child care regulation data book-residential child care
TRANSCRIPT
1
Texas Health and Human Services ● hhs.texas.gov
Child Care Regulation Data Book- Residential Child Care Regulation Statistics Fiscal Year 2020
Data Book Information The Data Book is a descriptive statistical resource of the services provided to the people of the State of Texas by the Texas Health and Human Services Commission (HHSC) for fiscal year 2020 (September 1, 2019 through August 31, 2020).
Information in this book covers the most frequently asked statistical questions about HHSC Residential Child Care programs. Our hope is that it will be beneficial in answering these questions and serve as a continuous resource.
The Data Book provides information in several types of charts using different time intervals and it provides county, regional, and statewide totals. Due to rounding of calculations, some percentages may not add to 100%.
When comparing data from one time period to another, please keep in mind that HHSC has undergone major changes over time. There have been re-alignments, major policy changes, and automation of case management and reporting that have all influenced the data. In some cases, this can make direct comparisons across the years misleading.
Temporary changes to Child Care Regulation operating procedures and childcare needs across the state in support of efforts to control the spread of COVID-19 impacted some of the reported statistics included in the Fiscal Year 2020 data book.
Child Care Regulation Data Book Fiscal Year 2020 was published on 5/31/2021.
Revised October 2021
2
Texas Health and Human Services ● hhs.texas.gov
Table of Contents
Data Book Information ................................................................................. 1 Residential Child Care Regulation Employee Demographics and Tenure ....... 3 Residential Child Care Operation Count by Type and Year from 2016-
2020 ....................................................................................... 4 Residential Child Care Operation Count and Capacity from 2019-
2020 on August 31 ................................................................... 4 Regional Count of Residential Child Care Operations on August 31 .............. 6 Listing of Residential Child Care Operation Counts by County as of
August 31 ................................................................................ 8 Applications Accepted and Permits Issued During Fiscal Year 2020 ........... 22 Inspections During Fiscal Year 2020 .................................................... 26 Inspections by Operation Type and Inspection Type ............................... 28 Non-Abuse Neglect Investigations during Fiscal Year 2020 ...................... 31 Non-Abuse Neglect Investigations by Operation Type and Region ............. 32 Adverse and Corrective Actions Initiated During Fiscal Year 2020 ............. 33 Monetary and Voluntary Actions Initiated During Fiscal Year 2020 ............ 35 Background Checks1 Requested During Fiscal Year 2020 ......................... 37 Child Care Administrator Credential Exam Fiscal Year 2020 ..................... 38 Top 10 Standards Deficiencies for Residential Child Care Operations
Fiscal Year 2020 ...................................................................... 39 Top 10 Standards Deficiencies for Residential Child Care Operations
Fiscal Year 2020 ...................................................................... 43
Revised October 2021
3
Texas Health and Human Services ● hhs.texas.gov
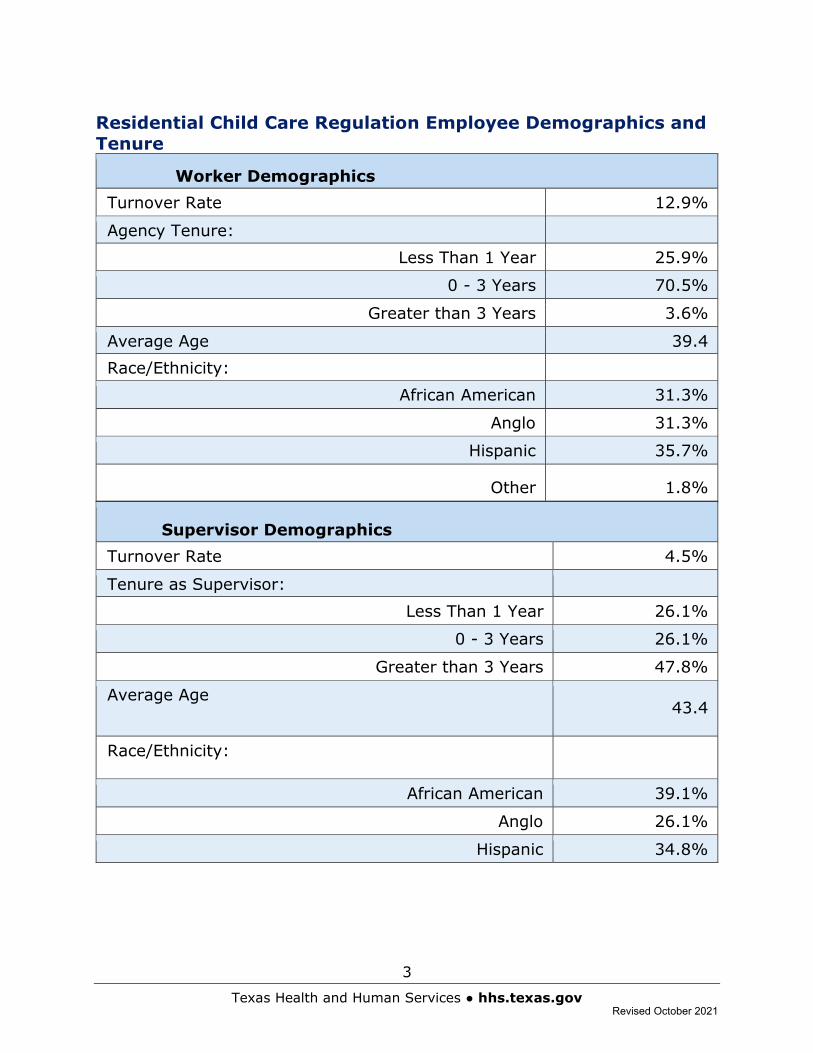
Residential Child Care Regulation Employee Demographics and Tenure
Worker Demographics Turnover Rate 12.9%
Agency Tenure:
Less Than 1 Year 25.9%
0 - 3 Years 70.5%
Greater than 3 Years 3.6%
Average Age 39.4 Race/Ethnicity:
African American 31.3%
Anglo 31.3%
Hispanic 35.7%
Other 1.8%
Supervisor Demographics Turnover Rate 4.5%
Tenure as Supervisor:
Less Than 1 Year 26.1%
0 - 3 Years 26.1%
Greater than 3 Years 47.8%
Average Age 43.4
Race/Ethnicity:
African American 39.1%
Anglo 26.1%
Hispanic 34.8%
Revised October 2021
4
Texas Health and Human Services ● hhs.texas.gov
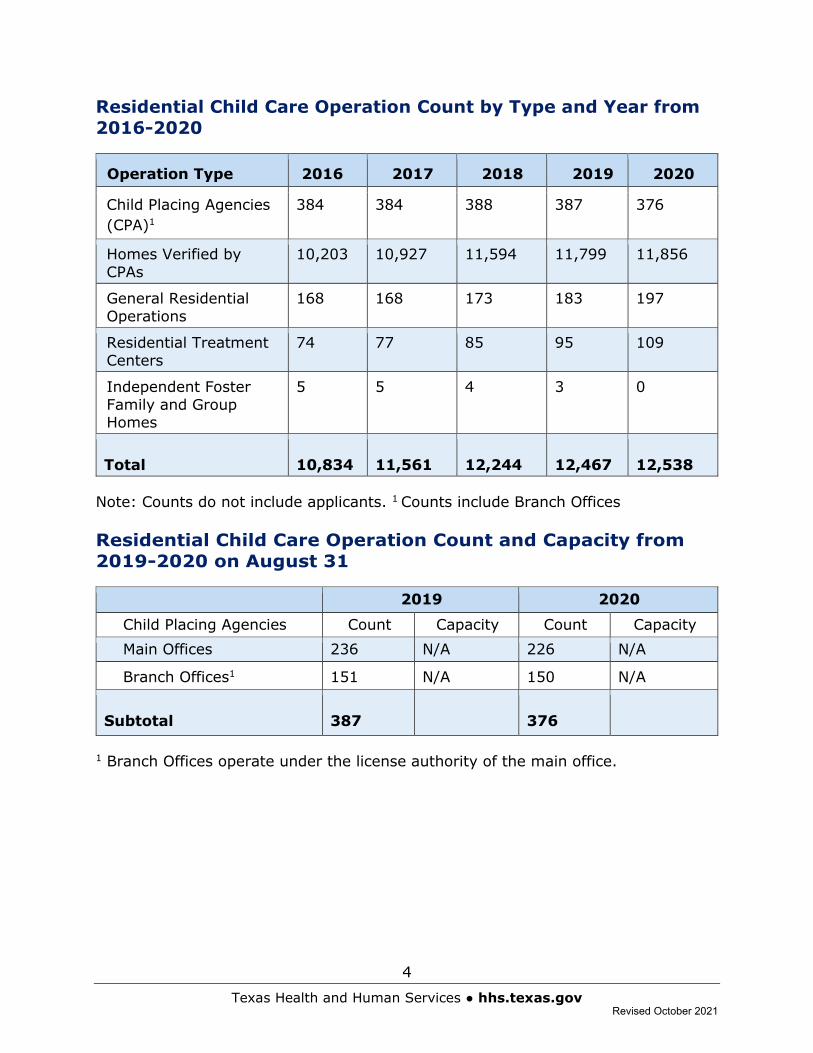
Residential Child Care Operation Count by Type and Year from 2016-2020
Operation Type 2016 2017 2018 2019 2020
Child Placing Agencies (CPA)1
384 384 388 387 376
Homes Verified by CPAs
10,203 10,927 11,594 11,799 11,856
General Residential Operations
168 168 173 183 197
Residential Treatment Centers
74 77 85 95 109
Independent Foster Family and Group Homes
5 5 4 3 0
Total 10,834 11,561 12,244 12,467 12,538
Note: Counts do not include applicants. 1 Counts include Branch Offices
Residential Child Care Operation Count and Capacity from 2019-2020 on August 31
2019 2020
Child Placing Agencies Count Capacity Count Capacity Main Offices 236 N/A 226 N/A
Branch Offices1 151 N/A 150 N/A
Subtotal 387 376
1 Branch Offices operate under the license authority of the main office.
Revised October 2021
5
Texas Health and Human Services ● hhs.texas.gov
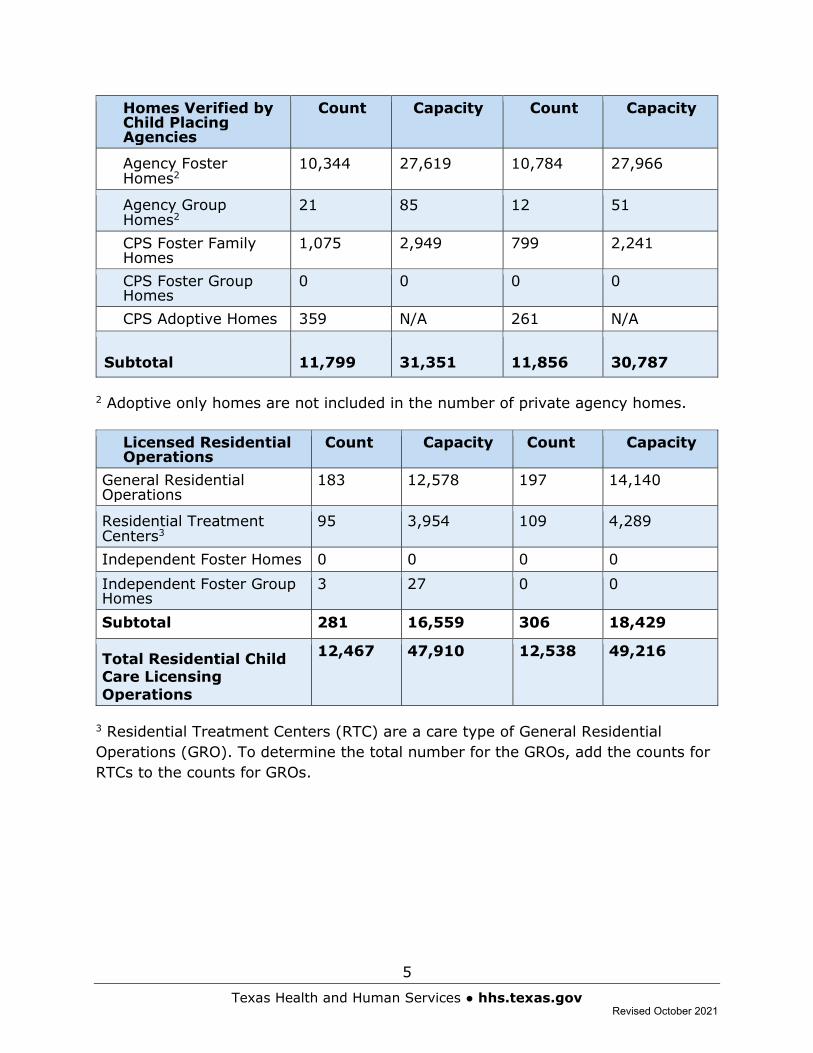
Homes Verified by Child Placing Agencies
Count Capacity Count Capacity
Agency Foster Homes2
10,344 27,619 10,784 27,966
Agency Group Homes2
21 85 12 51
CPS Foster Family Homes
1,075 2,949 799 2,241
CPS Foster Group Homes
0 0 0 0
CPS Adoptive Homes 359 N/A 261 N/A
Subtotal 11,799 31,351 11,856 30,787
2 Adoptive only homes are not included in the number of private agency homes.
Licensed Residential Operations
Count Capacity Count Capacity
General Residential Operations
183 12,578 197 14,140
Residential Treatment Centers3
95 3,954 109 4,289
Independent Foster Homes 0 0 0 0 Independent Foster Group Homes
3 27 0 0
Subtotal 281 16,559 306 18,429
Total Residential Child Care Licensing Operations
12,467 47,910 12,538 49,216
3 Residential Treatment Centers (RTC) are a care type of General Residential Operations (GRO). To determine the total number for the GROs, add the counts for RTCs to the counts for GROs.
Revised October 2021
6
Texas Health and Human Services ● hhs.texas.gov
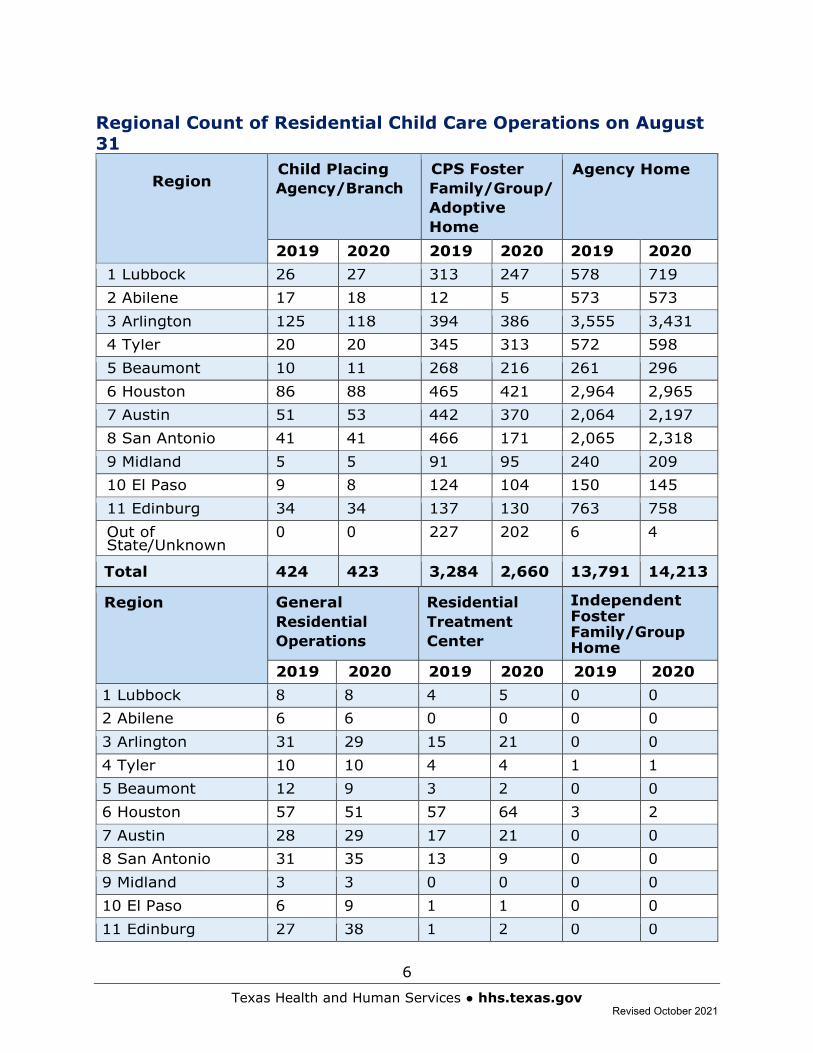
Regional Count of Residential Child Care Operations on August 31
Region Child Placing Agency/Branch
CPS Foster Family/Group/ Adoptive Home
Agency Home
2019 2020 2019 2020 2019 2020 1 Lubbock 26 27 313 247 578 719 2 Abilene 17 18 12 5 573 573 3 Arlington 125 118 394 386 3,555 3,431 4 Tyler 20 20 345 313 572 598 5 Beaumont 10 11 268 216 261 296 6 Houston 86 88 465 421 2,964 2,965 7 Austin 51 53 442 370 2,064 2,197 8 San Antonio 41 41 466 171 2,065 2,318 9 Midland 5 5 91 95 240 209 10 El Paso 9 8 124 104 150 145 11 Edinburg 34 34 137 130 763 758 Out of State/Unknown
0 0 227 202 6 4
Total 424 423 3,284 2,660 13,791 14,213
Region General Residential Operations
Residential Treatment Center
Independent Foster Family/Group Home
2019 2020 2019 2020 2019 2020 1 Lubbock 8 8 4 5 0 0 2 Abilene 6 6 0 0 0 0 3 Arlington 31 29 15 21 0 0 4 Tyler 10 10 4 4 1 1 5 Beaumont 12 9 3 2 0 0 6 Houston 57 51 57 64 3 2 7 Austin 28 29 17 21 0 0 8 San Antonio 31 35 13 9 0 0 9 Midland 3 3 0 0 0 0 10 El Paso 6 9 1 1 0 0 11 Edinburg 27 38 1 2 0 0
Revised October 2021
7
Texas Health and Human Services ● hhs.texas.gov
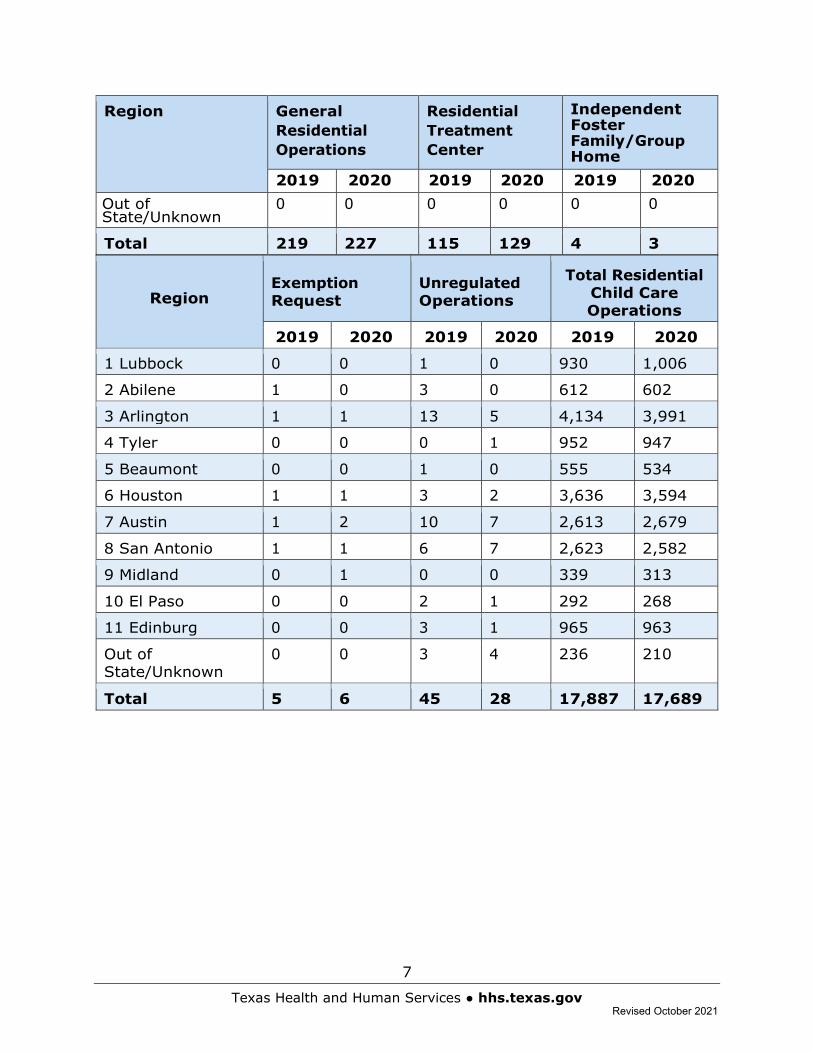
Region General Residential Operations
Residential Treatment Center
Independent Foster Family/Group Home
2019 2020 2019 2020 2019 2020 Out of State/Unknown
0 0 0 0 0 0
Total 219 227 115 129 4 3
Region Exemption Request
Unregulated Operations
Total Residential Child Care Operations
2019 2020 2019 2020 2019 2020
1 Lubbock 0 0 1 0 930 1,006
2 Abilene 1 0 3 0 612 602
3 Arlington 1 1 13 5 4,134 3,991
4 Tyler 0 0 0 1 952 947
5 Beaumont 0 0 1 0 555 534
6 Houston 1 1 3 2 3,636 3,594
7 Austin 1 2 10 7 2,613 2,679
8 San Antonio 1 1 6 7 2,623 2,582
9 Midland 0 1 0 0 339 313
10 El Paso 0 0 2 1 292 268
11 Edinburg 0 0 3 1 965 963
Out of State/Unknown
0 0 3 4 236 210
Total 5 6 45 28 17,887 17,689
Revised October 2021
8
Texas Health and Human Services ● hhs.texas.gov
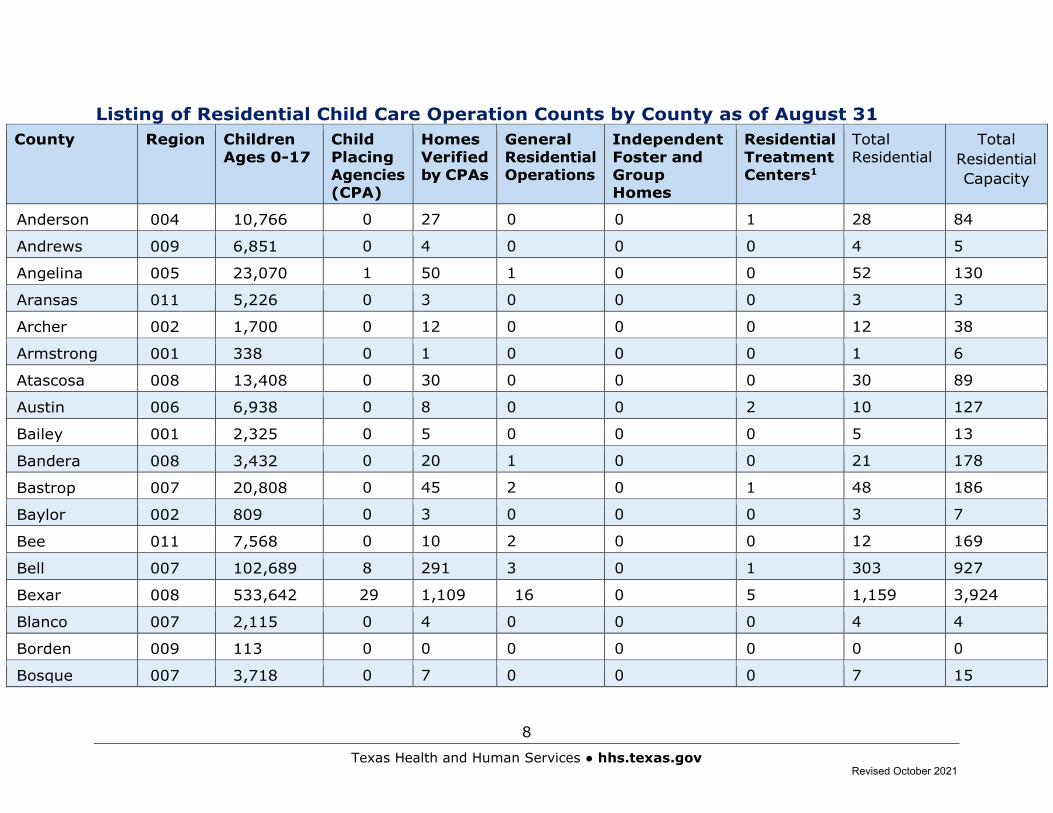
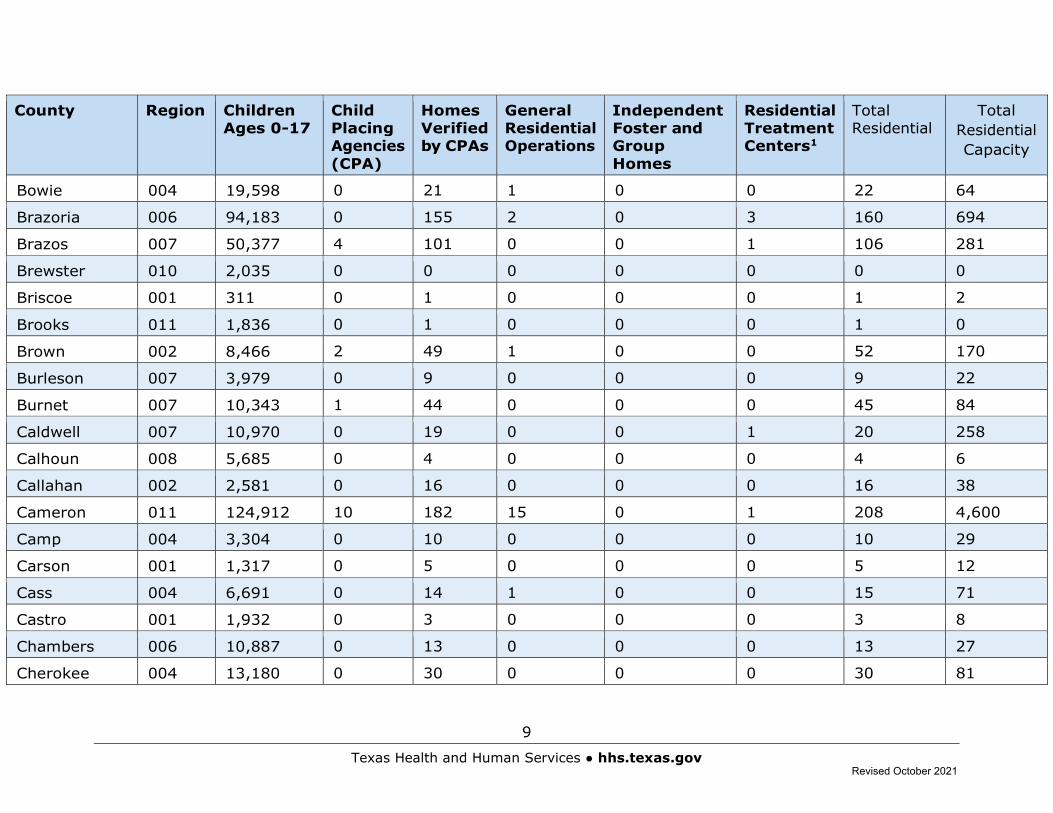
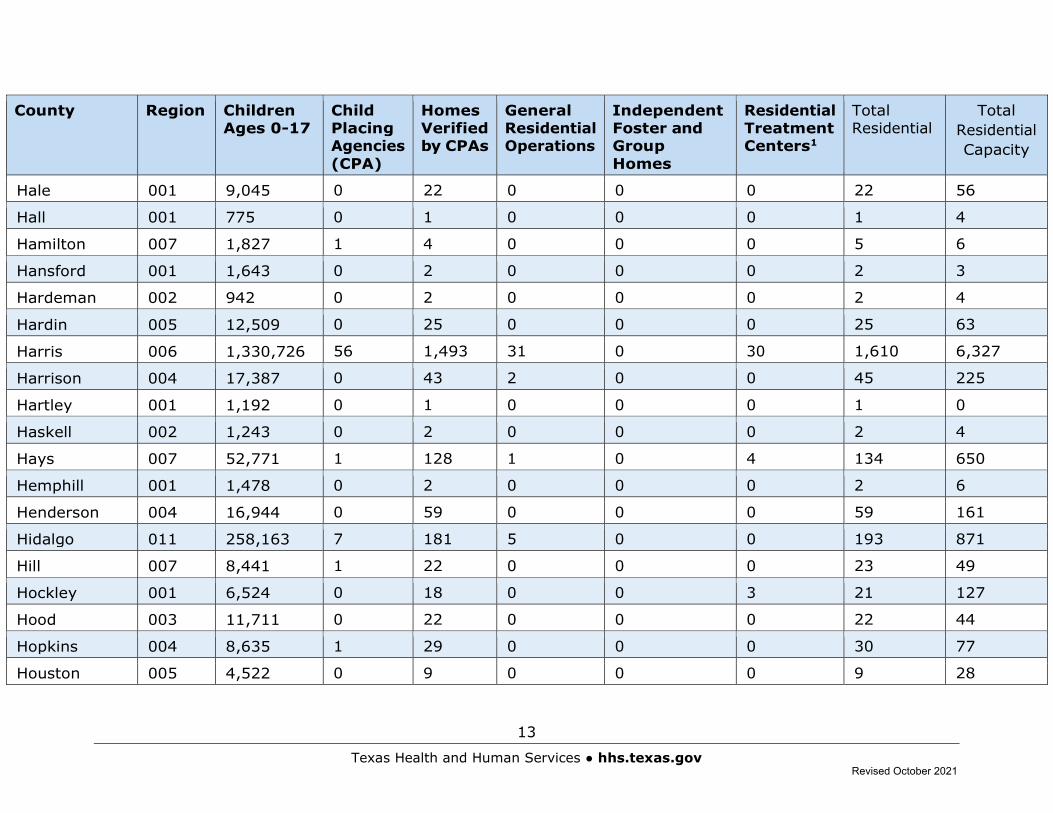
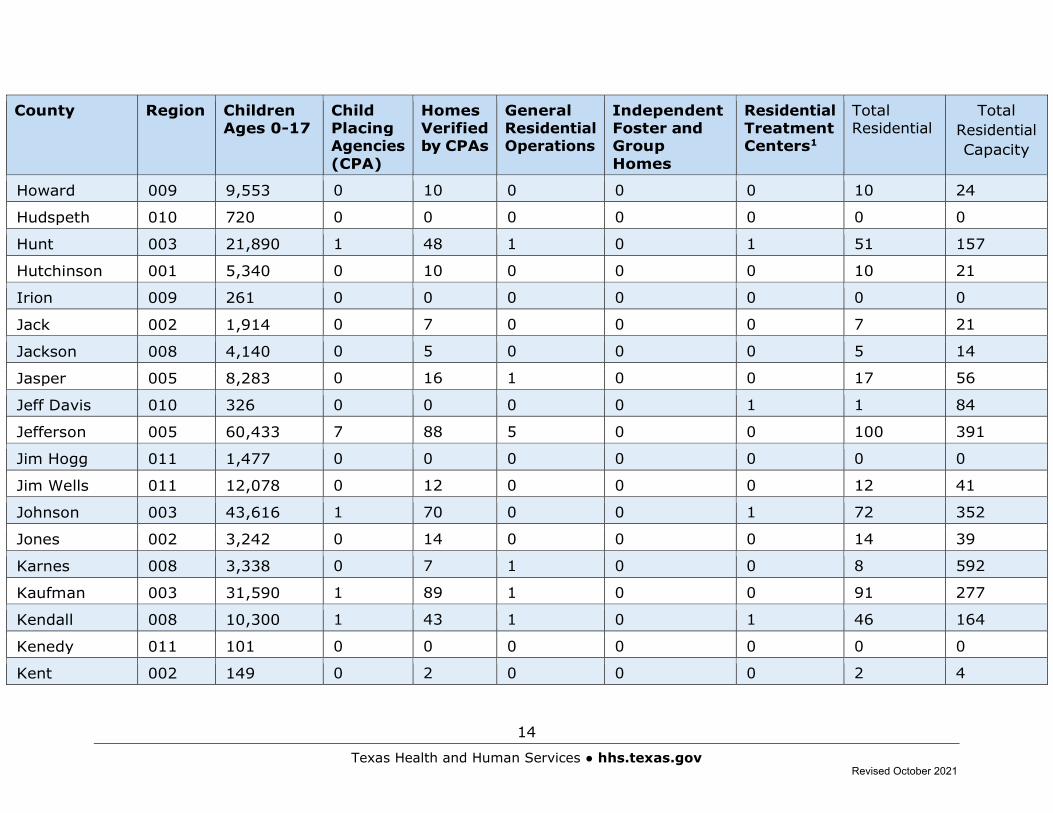
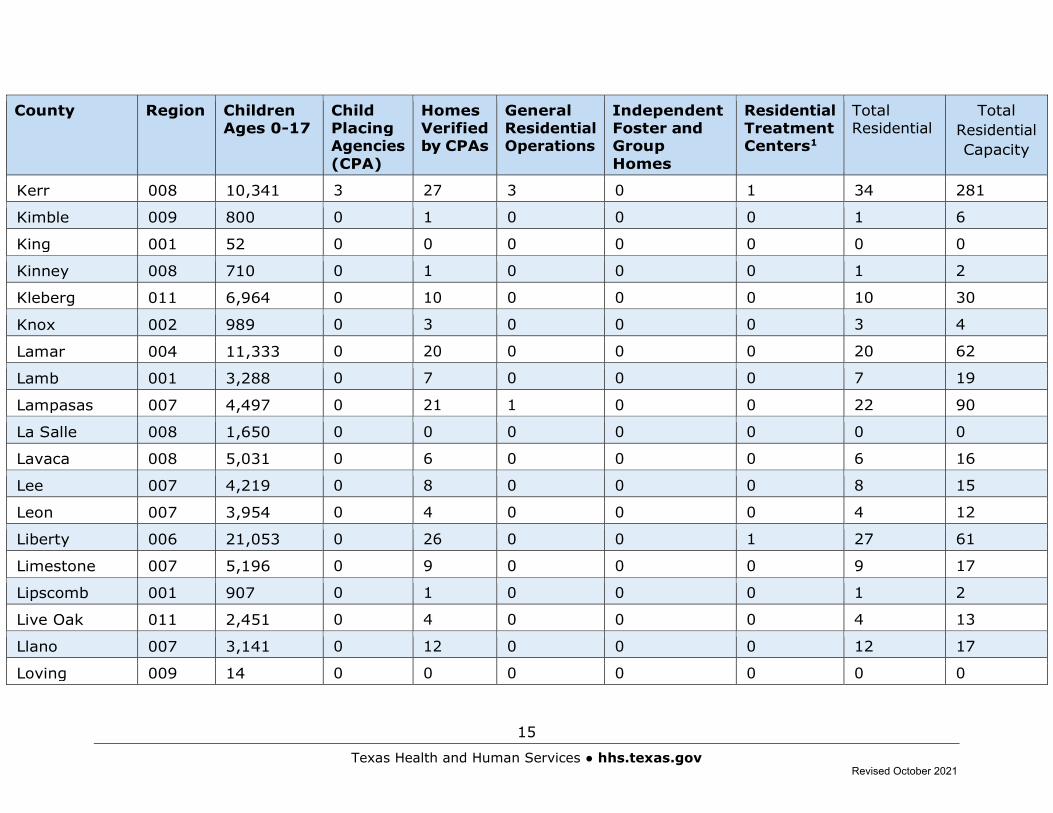
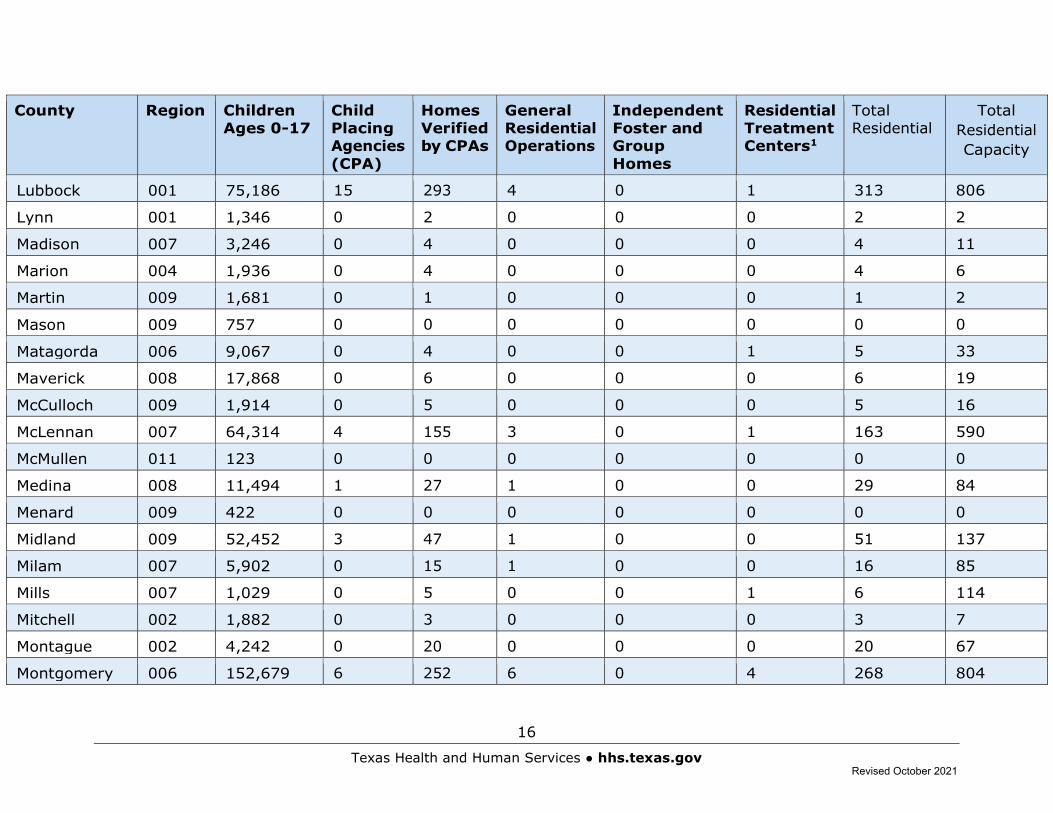
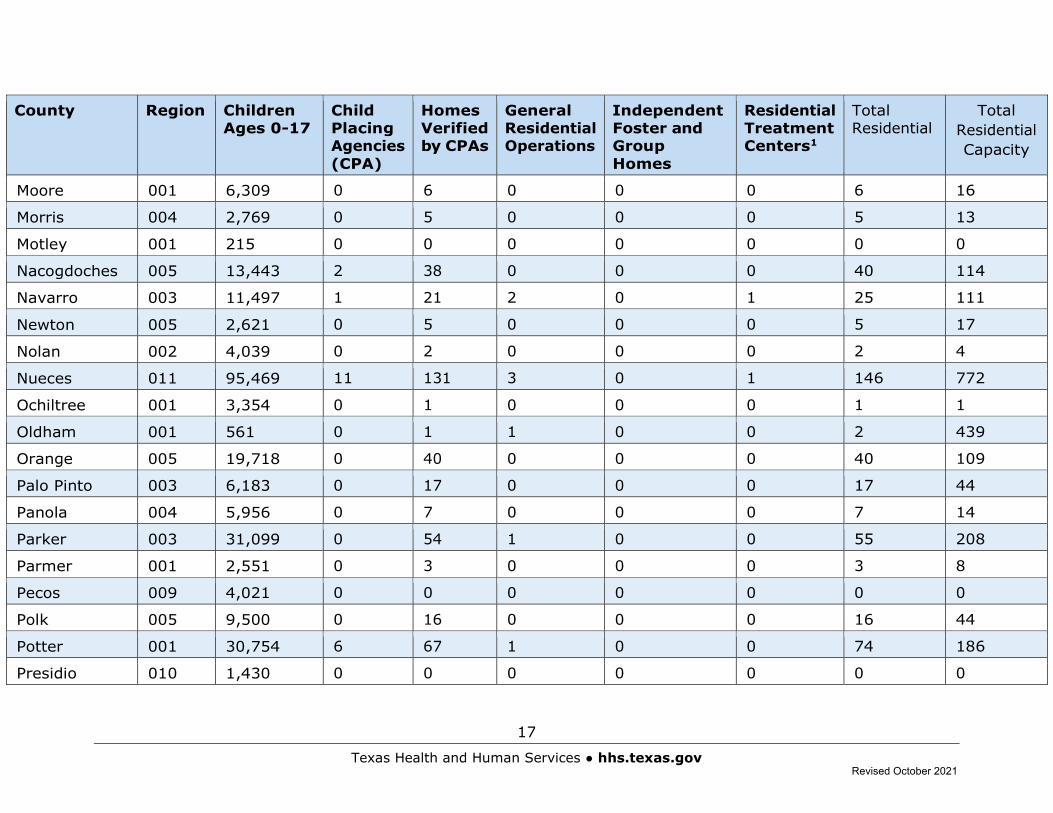
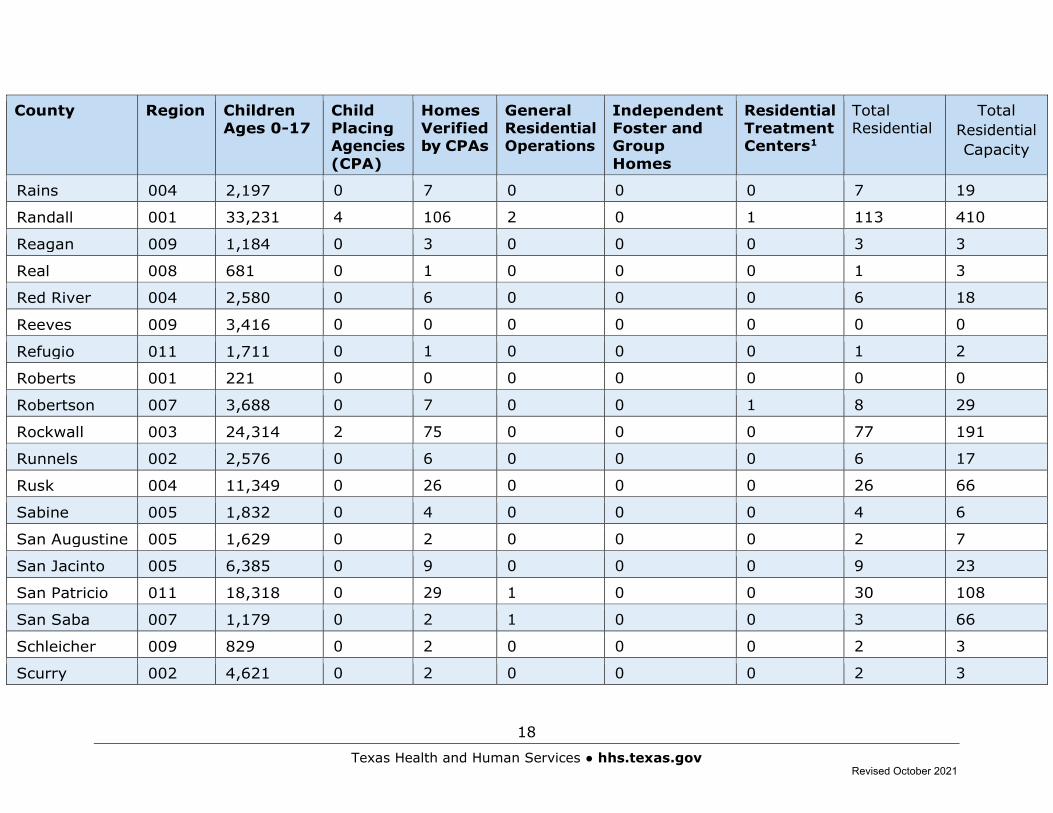
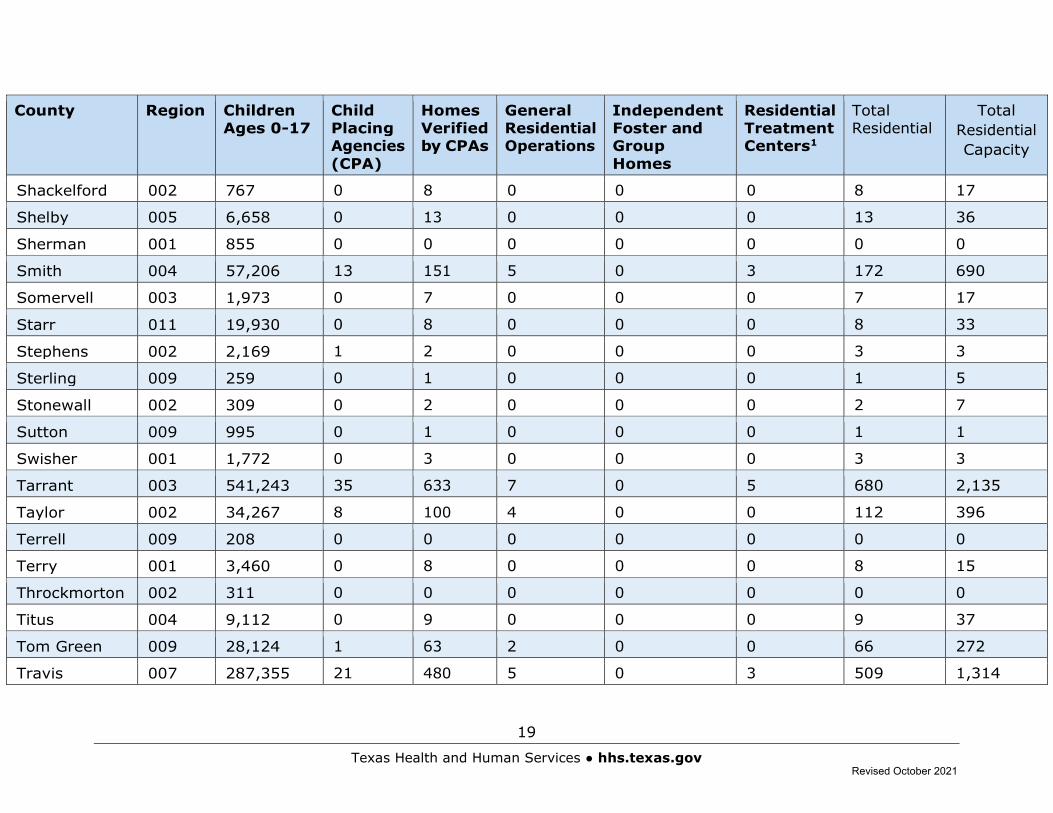
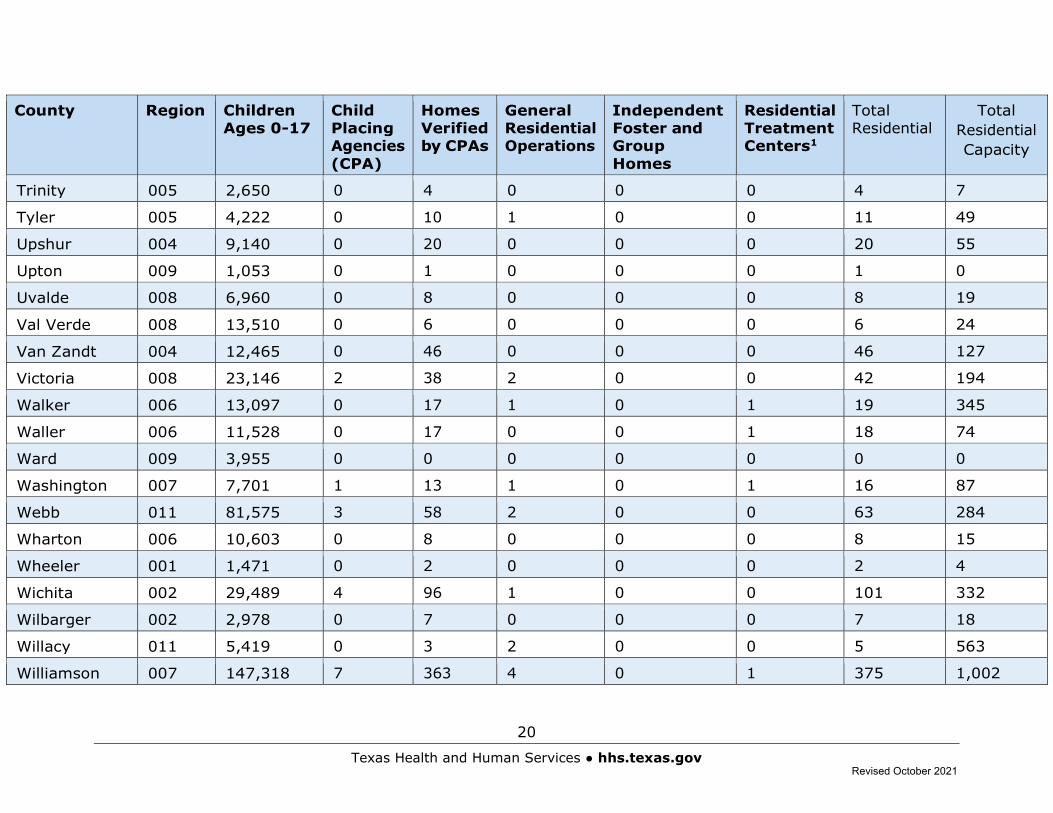
Listing of Residential Child Care Operation Counts by County as of August 31 County Region Children
Ages 0-17 Child Placing Agencies (CPA)
Homes Verified by CPAs
General Residential Operations
Independent Foster and Group Homes
Residential Treatment Centers1
Total Residential
Total Residential Capacity
Anderson 004 10,766 0 27 0 0 1 28 84
Andrews 009 6,851 0 4 0 0 0 4 5
Angelina 005 23,070 1 50 1 0 0 52 130
Aransas 011 5,226 0 3 0 0 0 3 3
Archer 002 1,700 0 12 0 0 0 12 38
Armstrong 001 338 0 1 0 0 0 1 6
Atascosa 008 13,408 0 30 0 0 0 30 89
Austin 006 6,938 0 8 0 0 2 10 127
Bailey 001 2,325 0 5 0 0 0 5 13
Bandera 008 3,432 0 20 1 0 0 21 178
Bastrop 007 20,808 0 45 2 0 1 48 186
Baylor 002 809 0 3 0 0 0 3 7
Bee 011 7,568 0 10 2 0 0 12 169
Bell 007 102,689 8 291 3 0 1 303 927
Bexar 008 533,642 29 1,109 16 0 5 1,159 3,924
Blanco 007 2,115 0 4 0 0 0 4 4
Borden 009 113 0 0 0 0 0 0 0
Bosque 007 3,718 0 7 0 0 0 7 15
Revised October 2021
9
Texas Health and Human Services ● hhs.texas.gov
County Region Children Ages 0-17
Child Placing Agencies (CPA)
Homes Verified by CPAs
General Residential Operations
Independent Foster and Group Homes
Residential Treatment Centers1
Total Residential
Total Residential Capacity
Bowie 004 19,598 0 21 1 0 0 22 64
Brazoria 006 94,183 0 155 2 0 3 160 694
Brazos 007 50,377 4 101 0 0 1 106 281
Brewster 010 2,035 0 0 0 0 0 0 0
Briscoe 001 311 0 1 0 0 0 1 2
Brooks 011 1,836 0 1 0 0 0 1 0
Brown 002 8,466 2 49 1 0 0 52 170
Burleson 007 3,979 0 9 0 0 0 9 22
Burnet 007 10,343 1 44 0 0 0 45 84
Caldwell 007 10,970 0 19 0 0 1 20 258
Calhoun 008 5,685 0 4 0 0 0 4 6
Callahan 002 2,581 0 16 0 0 0 16 38
Cameron 011 124,912 10 182 15 0 1 208 4,600
Camp 004 3,304 0 10 0 0 0 10 29
Carson 001 1,317 0 5 0 0 0 5 12
Cass 004 6,691 0 14 1 0 0 15 71
Castro 001 1,932 0 3 0 0 0 3 8
Chambers 006 10,887 0 13 0 0 0 13 27
Cherokee 004 13,180 0 30 0 0 0 30 81
Revised October 2021
10
Texas Health and Human Services ● hhs.texas.gov
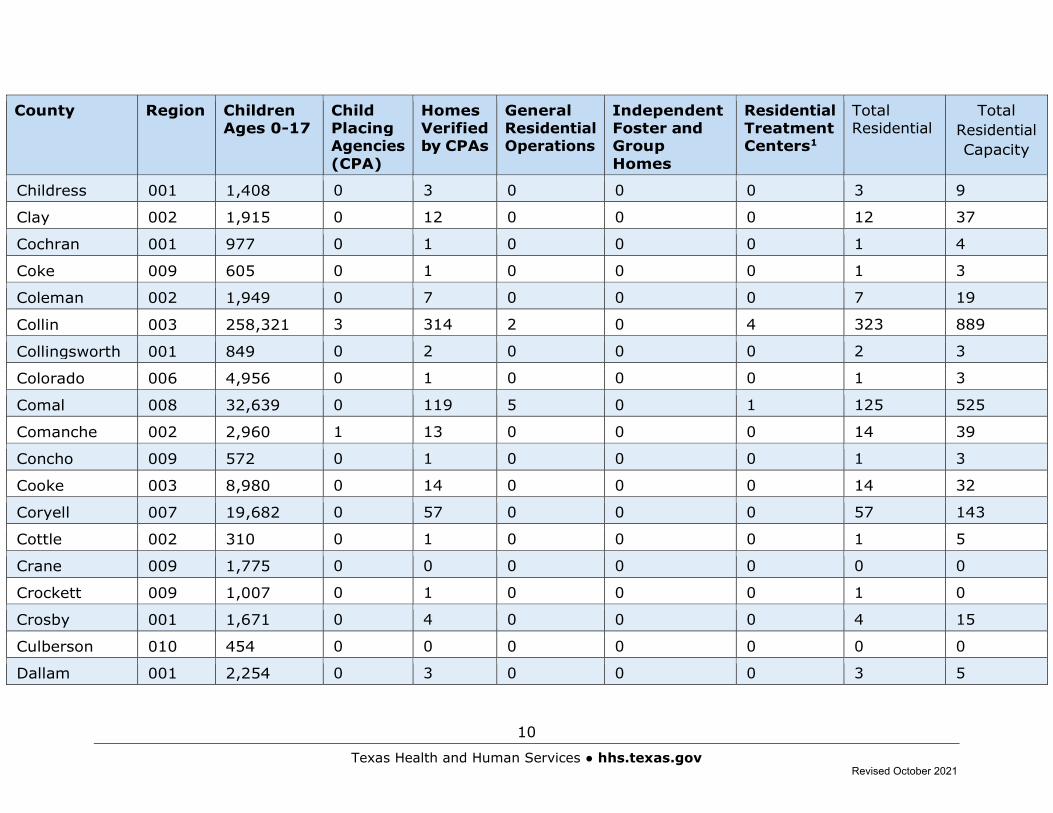
County Region Children Ages 0-17
Child Placing Agencies (CPA)
Homes Verified by CPAs
General Residential Operations
Independent Foster and Group Homes
Residential Treatment Centers1
Total Residential
Total Residential Capacity
Childress 001 1,408 0 3 0 0 0 3 9
Clay 002 1,915 0 12 0 0 0 12 37
Cochran 001 977 0 1 0 0 0 1 4
Coke 009 605 0 1 0 0 0 1 3
Coleman 002 1,949 0 7 0 0 0 7 19
Collin 003 258,321 3 314 2 0 4 323 889
Collingsworth 001 849 0 2 0 0 0 2 3
Colorado 006 4,956 0 1 0 0 0 1 3
Comal 008 32,639 0 119 5 0 1 125 525
Comanche 002 2,960 1 13 0 0 0 14 39
Concho 009 572 0 1 0 0 0 1 3
Cooke 003 8,980 0 14 0 0 0 14 32
Coryell 007 19,682 0 57 0 0 0 57 143
Cottle 002 310 0 1 0 0 0 1 5
Crane 009 1,775 0 0 0 0 0 0 0
Crockett 009 1,007 0 1 0 0 0 1 0
Crosby 001 1,671 0 4 0 0 0 4 15
Culberson 010 454 0 0 0 0 0 0 0
Dallam 001 2,254 0 3 0 0 0 3 5
Revised October 2021
11
Texas Health and Human Services ● hhs.texas.gov
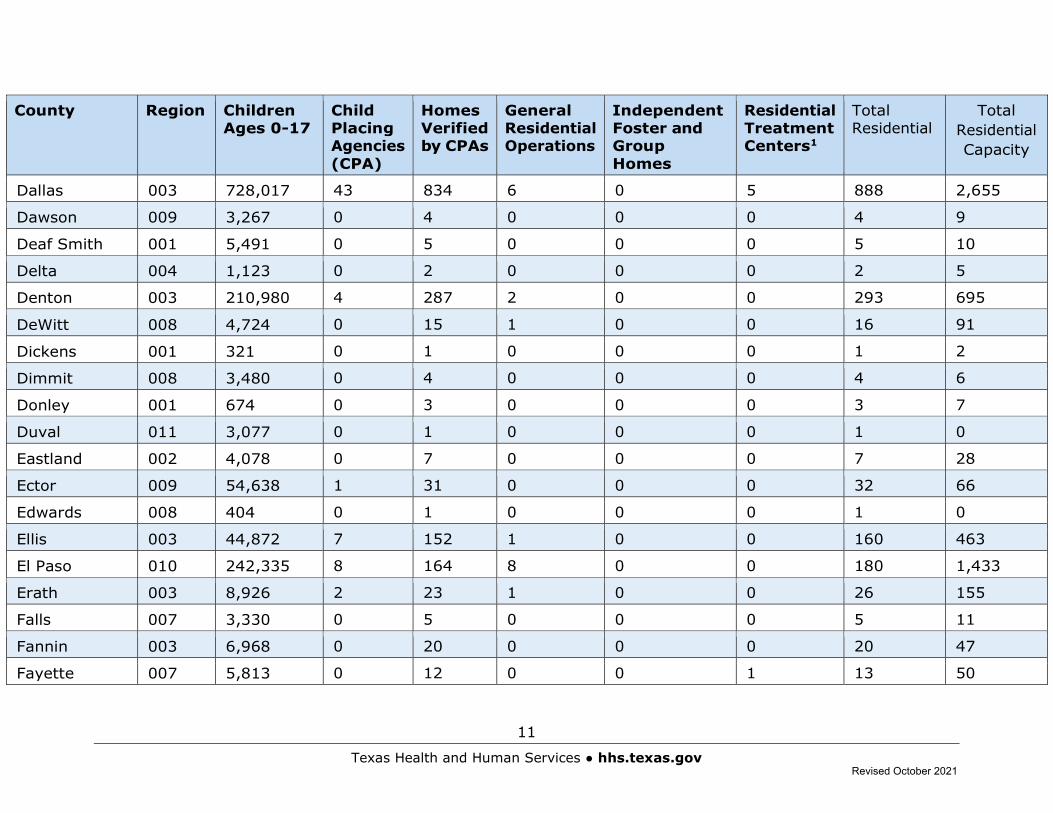
County Region Children Ages 0-17
Child Placing Agencies (CPA)
Homes Verified by CPAs
General Residential Operations
Independent Foster and Group Homes
Residential Treatment Centers1
Total Residential
Total Residential Capacity
Dallas 003 728,017 43 834 6 0 5 888 2,655
Dawson 009 3,267 0 4 0 0 0 4 9
Deaf Smith 001 5,491 0 5 0 0 0 5 10
Delta 004 1,123 0 2 0 0 0 2 5
Denton 003 210,980 4 287 2 0 0 293 695
DeWitt 008 4,724 0 15 1 0 0 16 91
Dickens 001 321 0 1 0 0 0 1 2
Dimmit 008 3,480 0 4 0 0 0 4 6
Donley 001 674 0 3 0 0 0 3 7
Duval 011 3,077 0 1 0 0 0 1 0
Eastland 002 4,078 0 7 0 0 0 7 28
Ector 009 54,638 1 31 0 0 0 32 66
Edwards 008 404 0 1 0 0 0 1 0
Ellis 003 44,872 7 152 1 0 0 160 463
El Paso 010 242,335 8 164 8 0 0 180 1,433
Erath 003 8,926 2 23 1 0 0 26 155
Falls 007 3,330 0 5 0 0 0 5 11
Fannin 003 6,968 0 20 0 0 0 20 47
Fayette 007 5,813 0 12 0 0 1 13 50
Revised October 2021
12
Texas Health and Human Services ● hhs.texas.gov
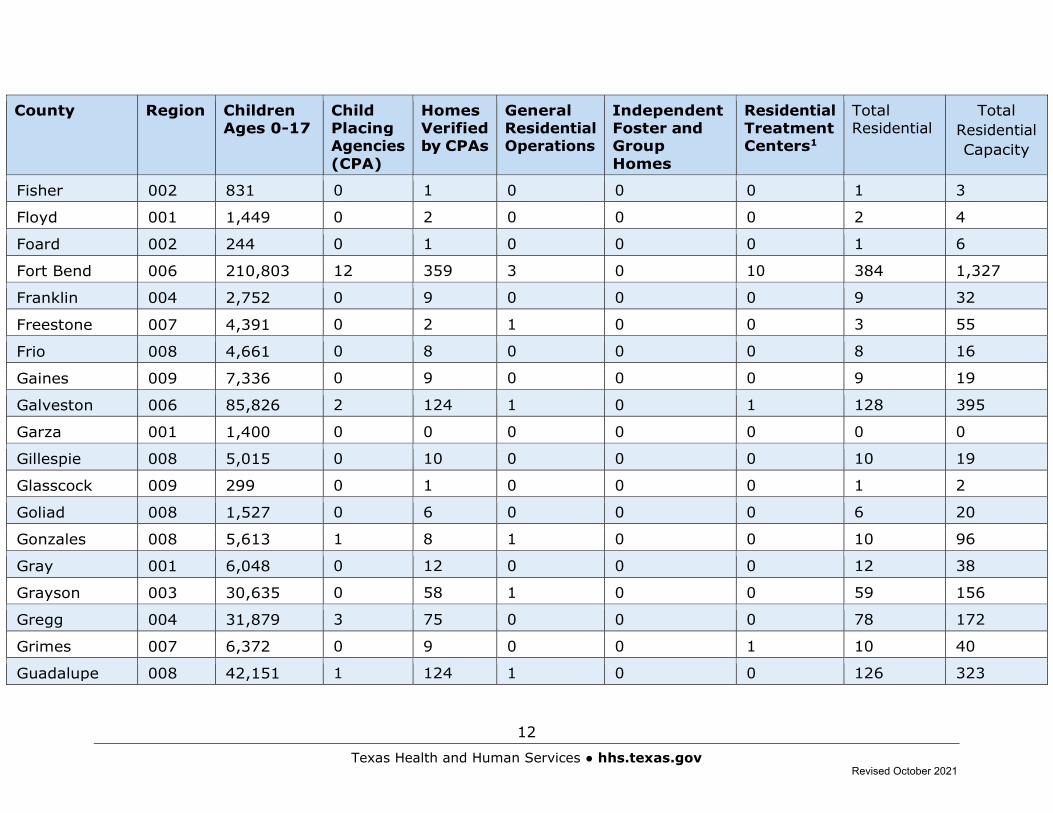
County Region Children Ages 0-17
Child Placing Agencies (CPA)
Homes Verified by CPAs
General Residential Operations
Independent Foster and Group Homes
Residential Treatment Centers1
Total Residential
Total Residential Capacity
Fisher 002 831 0 1 0 0 0 1 3
Floyd 001 1,449 0 2 0 0 0 2 4
Foard 002 244 0 1 0 0 0 1 6
Fort Bend 006 210,803 12 359 3 0 10 384 1,327
Franklin 004 2,752 0 9 0 0 0 9 32
Freestone 007 4,391 0 2 1 0 0 3 55
Frio 008 4,661 0 8 0 0 0 8 16
Gaines 009 7,336 0 9 0 0 0 9 19
Galveston 006 85,826 2 124 1 0 1 128 395
Garza 001 1,400 0 0 0 0 0 0 0
Gillespie 008 5,015 0 10 0 0 0 10 19
Glasscock 009 299 0 1 0 0 0 1 2
Goliad 008 1,527 0 6 0 0 0 6 20
Gonzales 008 5,613 1 8 1 0 0 10 96
Gray 001 6,048 0 12 0 0 0 12 38
Grayson 003 30,635 0 58 1 0 0 59 156
Gregg 004 31,879 3 75 0 0 0 78 172
Grimes 007 6,372 0 9 0 0 1 10 40
Guadalupe 008 42,151 1 124 1 0 0 126 323
Revised October 2021
13
Texas Health and Human Services ● hhs.texas.gov
County Region Children Ages 0-17
Child Placing Agencies (CPA)
Homes Verified by CPAs
General Residential Operations
Independent Foster and Group Homes
Residential Treatment Centers1
Total Residential
Total Residential Capacity
Hale 001 9,045 0 22 0 0 0 22 56
Hall 001 775 0 1 0 0 0 1 4
Hamilton 007 1,827 1 4 0 0 0 5 6
Hansford 001 1,643 0 2 0 0 0 2 3
Hardeman 002 942 0 2 0 0 0 2 4
Hardin 005 12,509 0 25 0 0 0 25 63
Harris 006 1,330,726 56 1,493 31 0 30 1,610 6,327
Harrison 004 17,387 0 43 2 0 0 45 225
Hartley 001 1,192 0 1 0 0 0 1 0
Haskell 002 1,243 0 2 0 0 0 2 4
Hays 007 52,771 1 128 1 0 4 134 650
Hemphill 001 1,478 0 2 0 0 0 2 6
Henderson 004 16,944 0 59 0 0 0 59 161
Hidalgo 011 258,163 7 181 5 0 0 193 871
Hill 007 8,441 1 22 0 0 0 23 49
Hockley 001 6,524 0 18 0 0 3 21 127
Hood 003 11,711 0 22 0 0 0 22 44
Hopkins 004 8,635 1 29 0 0 0 30 77
Houston 005 4,522 0 9 0 0 0 9 28
Revised October 2021
14
Texas Health and Human Services ● hhs.texas.gov
County Region Children Ages 0-17
Child Placing Agencies (CPA)
Homes Verified by CPAs
General Residential Operations
Independent Foster and Group Homes
Residential Treatment Centers1
Total Residential
Total Residential Capacity
Howard 009 9,553 0 10 0 0 0 10 24
Hudspeth 010 720 0 0 0 0 0 0 0
Hunt 003 21,890 1 48 1 0 1 51 157
Hutchinson 001 5,340 0 10 0 0 0 10 21
Irion 009 261 0 0 0 0 0 0 0
Jack 002 1,914 0 7 0 0 0 7 21
Jackson 008 4,140 0 5 0 0 0 5 14
Jasper 005 8,283 0 16 1 0 0 17 56
Jeff Davis 010 326 0 0 0 0 1 1 84
Jefferson 005 60,433 7 88 5 0 0 100 391
Jim Hogg 011 1,477 0 0 0 0 0 0 0
Jim Wells 011 12,078 0 12 0 0 0 12 41
Johnson 003 43,616 1 70 0 0 1 72 352
Jones 002 3,242 0 14 0 0 0 14 39
Karnes 008 3,338 0 7 1 0 0 8 592
Kaufman 003 31,590 1 89 1 0 0 91 277
Kendall 008 10,300 1 43 1 0 1 46 164
Kenedy 011 101 0 0 0 0 0 0 0
Kent 002 149 0 2 0 0 0 2 4
Revised October 2021
15
Texas Health and Human Services ● hhs.texas.gov
County Region Children Ages 0-17
Child Placing Agencies (CPA)
Homes Verified by CPAs
General Residential Operations
Independent Foster and Group Homes
Residential Treatment Centers1
Total Residential
Total Residential Capacity
Kerr 008 10,341 3 27 3 0 1 34 281
Kimble 009 800 0 1 0 0 0 1 6
King 001 52 0 0 0 0 0 0 0
Kinney 008 710 0 1 0 0 0 1 2
Kleberg 011 6,964 0 10 0 0 0 10 30
Knox 002 989 0 3 0 0 0 3 4
Lamar 004 11,333 0 20 0 0 0 20 62
Lamb 001 3,288 0 7 0 0 0 7 19
Lampasas 007 4,497 0 21 1 0 0 22 90
La Salle 008 1,650 0 0 0 0 0 0 0
Lavaca 008 5,031 0 6 0 0 0 6 16
Lee 007 4,219 0 8 0 0 0 8 15
Leon 007 3,954 0 4 0 0 0 4 12
Liberty 006 21,053 0 26 0 0 1 27 61
Limestone 007 5,196 0 9 0 0 0 9 17
Lipscomb 001 907 0 1 0 0 0 1 2
Live Oak 011 2,451 0 4 0 0 0 4 13
Llano 007 3,141 0 12 0 0 0 12 17
Loving 009 14 0 0 0 0 0 0 0
Revised October 2021
16
Texas Health and Human Services ● hhs.texas.gov
County Region Children Ages 0-17
Child Placing Agencies (CPA)
Homes Verified by CPAs
General Residential Operations
Independent Foster and Group Homes
Residential Treatment Centers1
Total Residential
Total Residential Capacity
Lubbock 001 75,186 15 293 4 0 1 313 806
Lynn 001 1,346 0 2 0 0 0 2 2
Madison 007 3,246 0 4 0 0 0 4 11
Marion 004 1,936 0 4 0 0 0 4 6
Martin 009 1,681 0 1 0 0 0 1 2
Mason 009 757 0 0 0 0 0 0 0
Matagorda 006 9,067 0 4 0 0 1 5 33
Maverick 008 17,868 0 6 0 0 0 6 19
McCulloch 009 1,914 0 5 0 0 0 5 16
McLennan 007 64,314 4 155 3 0 1 163 590
McMullen 011 123 0 0 0 0 0 0 0
Medina 008 11,494 1 27 1 0 0 29 84
Menard 009 422 0 0 0 0 0 0 0
Midland 009 52,452 3 47 1 0 0 51 137
Milam 007 5,902 0 15 1 0 0 16 85
Mills 007 1,029 0 5 0 0 1 6 114
Mitchell 002 1,882 0 3 0 0 0 3 7
Montague 002 4,242 0 20 0 0 0 20 67
Montgomery 006 152,679 6 252 6 0 4 268 804
Revised October 2021
17
Texas Health and Human Services ● hhs.texas.gov
County Region Children Ages 0-17
Child Placing Agencies (CPA)
Homes Verified by CPAs
General Residential Operations
Independent Foster and Group Homes
Residential Treatment Centers1
Total Residential
Total Residential Capacity
Moore 001 6,309 0 6 0 0 0 6 16
Morris 004 2,769 0 5 0 0 0 5 13
Motley 001 215 0 0 0 0 0 0 0
Nacogdoches 005 13,443 2 38 0 0 0 40 114
Navarro 003 11,497 1 21 2 0 1 25 111
Newton 005 2,621 0 5 0 0 0 5 17
Nolan 002 4,039 0 2 0 0 0 2 4
Nueces 011 95,469 11 131 3 0 1 146 772
Ochiltree 001 3,354 0 1 0 0 0 1 1
Oldham 001 561 0 1 1 0 0 2 439
Orange 005 19,718 0 40 0 0 0 40 109
Palo Pinto 003 6,183 0 17 0 0 0 17 44
Panola 004 5,956 0 7 0 0 0 7 14
Parker 003 31,099 0 54 1 0 0 55 208
Parmer 001 2,551 0 3 0 0 0 3 8
Pecos 009 4,021 0 0 0 0 0 0 0
Polk 005 9,500 0 16 0 0 0 16 44
Potter 001 30,754 6 67 1 0 0 74 186
Presidio 010 1,430 0 0 0 0 0 0 0
Revised October 2021
18
Texas Health and Human Services ● hhs.texas.gov
County Region Children Ages 0-17
Child Placing Agencies (CPA)
Homes Verified by CPAs
General Residential Operations
Independent Foster and Group Homes
Residential Treatment Centers1
Total Residential
Total Residential Capacity
Rains 004 2,197 0 7 0 0 0 7 19
Randall 001 33,231 4 106 2 0 1 113 410
Reagan 009 1,184 0 3 0 0 0 3 3
Real 008 681 0 1 0 0 0 1 3
Red River 004 2,580 0 6 0 0 0 6 18
Reeves 009 3,416 0 0 0 0 0 0 0
Refugio 011 1,711 0 1 0 0 0 1 2
Roberts 001 221 0 0 0 0 0 0 0
Robertson 007 3,688 0 7 0 0 1 8 29
Rockwall 003 24,314 2 75 0 0 0 77 191
Runnels 002 2,576 0 6 0 0 0 6 17
Rusk 004 11,349 0 26 0 0 0 26 66
Sabine 005 1,832 0 4 0 0 0 4 6
San Augustine 005 1,629 0 2 0 0 0 2 7
San Jacinto 005 6,385 0 9 0 0 0 9 23
San Patricio 011 18,318 0 29 1 0 0 30 108
San Saba 007 1,179 0 2 1 0 0 3 66
Schleicher 009 829 0 2 0 0 0 2 3
Scurry 002 4,621 0 2 0 0 0 2 3
Revised October 2021
19
Texas Health and Human Services ● hhs.texas.gov
County Region Children Ages 0-17
Child Placing Agencies (CPA)
Homes Verified by CPAs
General Residential Operations
Independent Foster and Group Homes
Residential Treatment Centers1
Total Residential
Total Residential Capacity
Shackelford 002 767 0 8 0 0 0 8 17
Shelby 005 6,658 0 13 0 0 0 13 36
Sherman 001 855 0 0 0 0 0 0 0
Smith 004 57,206 13 151 5 0 3 172 690
Somervell 003 1,973 0 7 0 0 0 7 17
Starr 011 19,930 0 8 0 0 0 8 33
Stephens 002 2,169 1 2 0 0 0 3 3
Sterling 009 259 0 1 0 0 0 1 5
Stonewall 002 309 0 2 0 0 0 2 7
Sutton 009 995 0 1 0 0 0 1 1
Swisher 001 1,772 0 3 0 0 0 3 3
Tarrant 003 541,243 35 633 7 0 5 680 2,135
Taylor 002 34,267 8 100 4 0 0 112 396
Terrell 009 208 0 0 0 0 0 0 0
Terry 001 3,460 0 8 0 0 0 8 15
Throckmorton 002 311 0 0 0 0 0 0 0
Titus 004 9,112 0 9 0 0 0 9 37
Tom Green 009 28,124 1 63 2 0 0 66 272
Travis 007 287,355 21 480 5 0 3 509 1,314
Revised October 2021
20
Texas Health and Human Services ● hhs.texas.gov
County Region Children Ages 0-17
Child Placing Agencies (CPA)
Homes Verified by CPAs
General Residential Operations
Independent Foster and Group Homes
Residential Treatment Centers1
Total Residential
Total Residential Capacity
Trinity 005 2,650 0 4 0 0 0 4 7
Tyler 005 4,222 0 10 1 0 0 11 49
Upshur 004 9,140 0 20 0 0 0 20 55
Upton 009 1,053 0 1 0 0 0 1 0
Uvalde 008 6,960 0 8 0 0 0 8 19
Val Verde 008 13,510 0 6 0 0 0 6 24
Van Zandt 004 12,465 0 46 0 0 0 46 127
Victoria 008 23,146 2 38 2 0 0 42 194
Walker 006 13,097 0 17 1 0 1 19 345
Waller 006 11,528 0 17 0 0 1 18 74
Ward 009 3,955 0 0 0 0 0 0 0
Washington 007 7,701 1 13 1 0 1 16 87
Webb 011 81,575 3 58 2 0 0 63 284
Wharton 006 10,603 0 8 0 0 0 8 15
Wheeler 001 1,471 0 2 0 0 0 2 4
Wichita 002 29,489 4 96 1 0 0 101 332
Wilbarger 002 2,978 0 7 0 0 0 7 18
Willacy 011 5,419 0 3 2 0 0 5 563
Williamson 007 147,318 7 363 4 0 1 375 1,002
Revised October 2021
21
Texas Health and Human Services ● hhs.texas.gov
County Region Children Ages 0-17
Child Placing Agencies (CPA)
Homes Verified by CPAs
General Residential Operations
Independent Foster and Group Homes
Residential Treatment Centers1
Total Residential
Total Residential Capacity
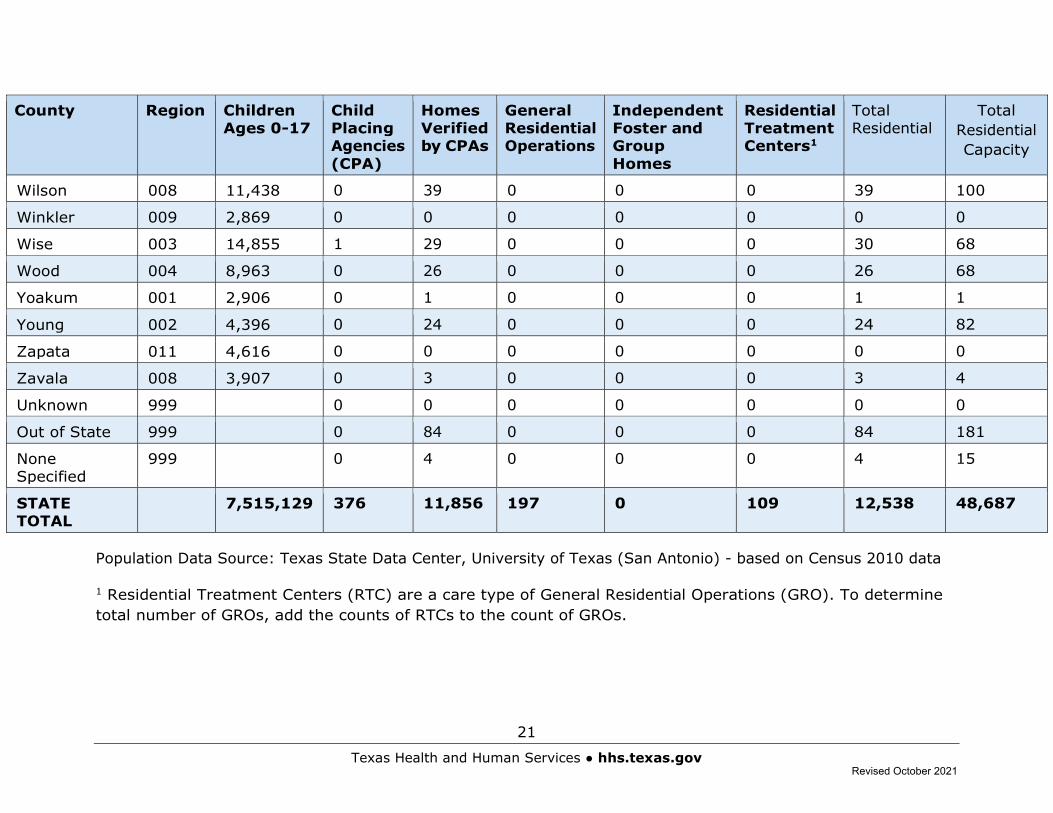
Wilson 008 11,438 0 39 0 0 0 39 100
Winkler 009 2,869 0 0 0 0 0 0 0
Wise 003 14,855 1 29 0 0 0 30 68
Wood 004 8,963 0 26 0 0 0 26 68
Yoakum 001 2,906 0 1 0 0 0 1 1
Young 002 4,396 0 24 0 0 0 24 82
Zapata 011 4,616 0 0 0 0 0 0 0
Zavala 008 3,907 0 3 0 0 0 3 4
Unknown 999 0 0 0 0 0 0 0
Out of State 999 0 84 0 0 0 84 181
None Specified
999 0 4 0 0 0 4 15
STATE TOTAL
7,515,129 376 11,856 197 0 109 12,538 48,687
Population Data Source: Texas State Data Center, University of Texas (San Antonio) - based on Census 2010 data
1 Residential Treatment Centers (RTC) are a care type of General Residential Operations (GRO). To determine total number of GROs, add the counts of RTCs to the count of GROs.
Revised October 2021
22
Texas Health and Human Services ● hhs.texas.gov
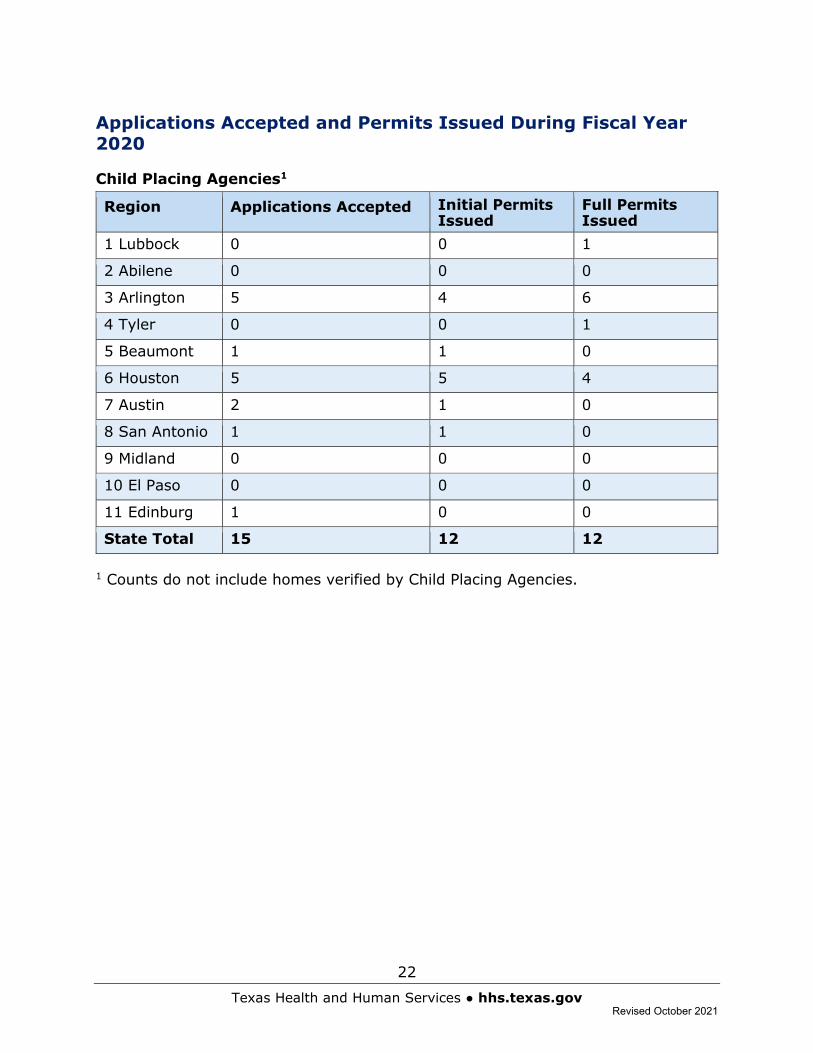
Applications Accepted and Permits Issued During Fiscal Year 2020
Child Placing Agencies1
Region Applications Accepted Initial Permits Issued
Full Permits Issued
1 Lubbock 0 0 1
2 Abilene 0 0 0
3 Arlington 5 4 6
4 Tyler 0 0 1
5 Beaumont 1 1 0
6 Houston 5 5 4
7 Austin 2 1 0
8 San Antonio 1 1 0
9 Midland 0 0 0
10 El Paso 0 0 0
11 Edinburg 1 0 0
State Total 15 12 12
1 Counts do not include homes verified by Child Placing Agencies.
Revised October 2021
23
Texas Health and Human Services ● hhs.texas.gov
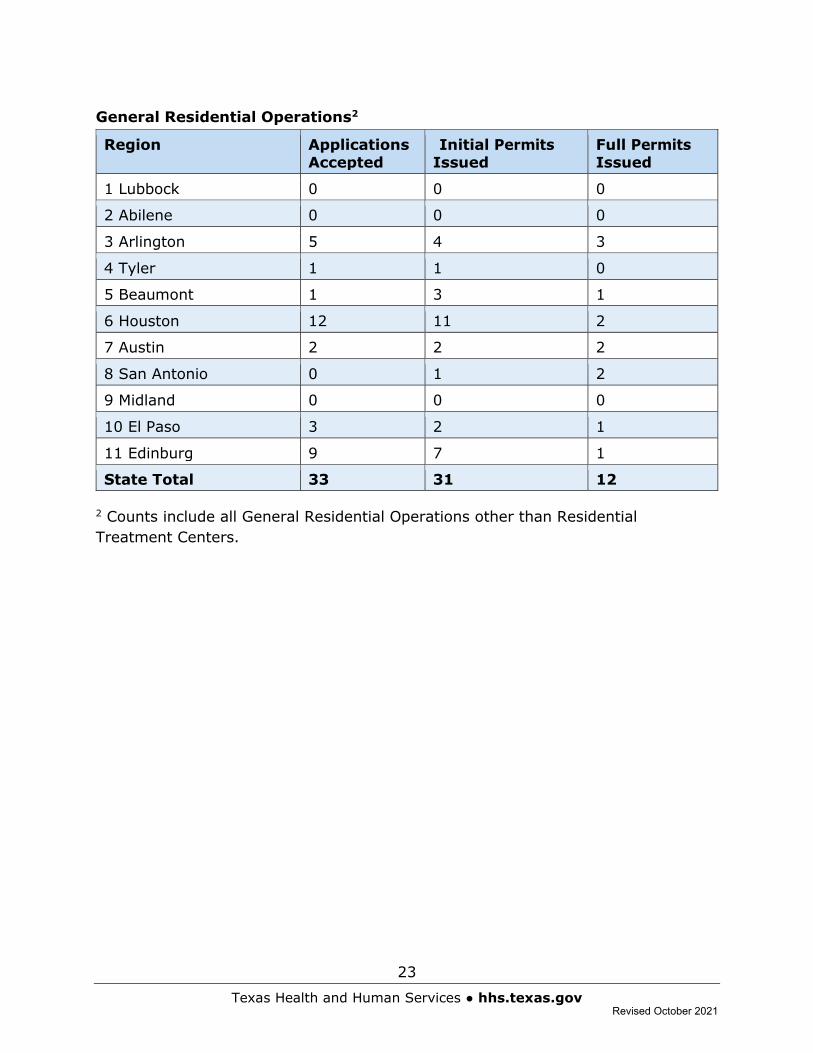
General Residential Operations2
Region Applications Accepted
Initial Permits Issued
Full Permits Issued
1 Lubbock 0 0 0
2 Abilene 0 0 0
3 Arlington 5 4 3
4 Tyler 1 1 0
5 Beaumont 1 3 1
6 Houston 12 11 2
7 Austin 2 2 2
8 San Antonio 0 1 2
9 Midland 0 0 0
10 El Paso 3 2 1
11 Edinburg 9 7 1
State Total 33 31 12
2 Counts include all General Residential Operations other than Residential Treatment Centers.
Revised October 2021
24
Texas Health and Human Services ● hhs.texas.gov
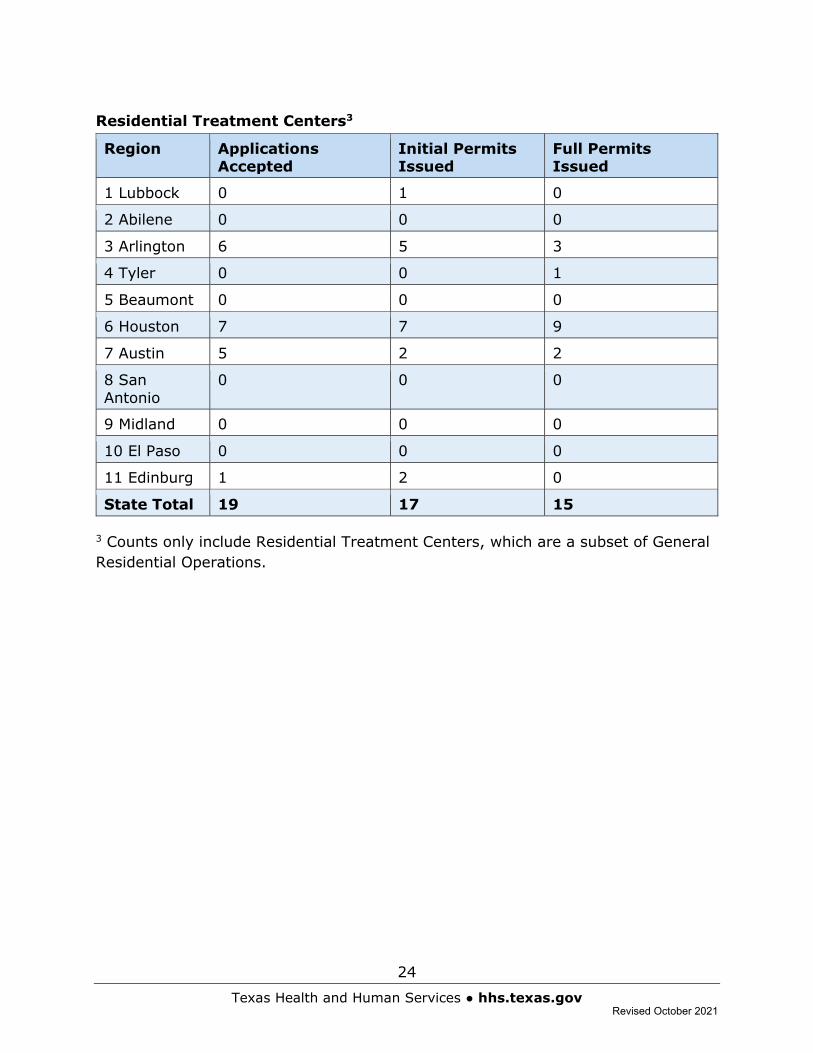
Residential Treatment Centers3
Region Applications Accepted
Initial Permits Issued
Full Permits Issued
1 Lubbock 0 1 0
2 Abilene 0 0 0
3 Arlington 6 5 3
4 Tyler 0 0 1
5 Beaumont 0 0 0
6 Houston 7 7 9
7 Austin 5 2 2
8 San Antonio
0 0 0
9 Midland 0 0 0
10 El Paso 0 0 0
11 Edinburg 1 2 0
State Total 19 17 15
3 Counts only include Residential Treatment Centers, which are a subset of General Residential Operations.
Revised October 2021
25
Texas Health and Human Services ● hhs.texas.gov
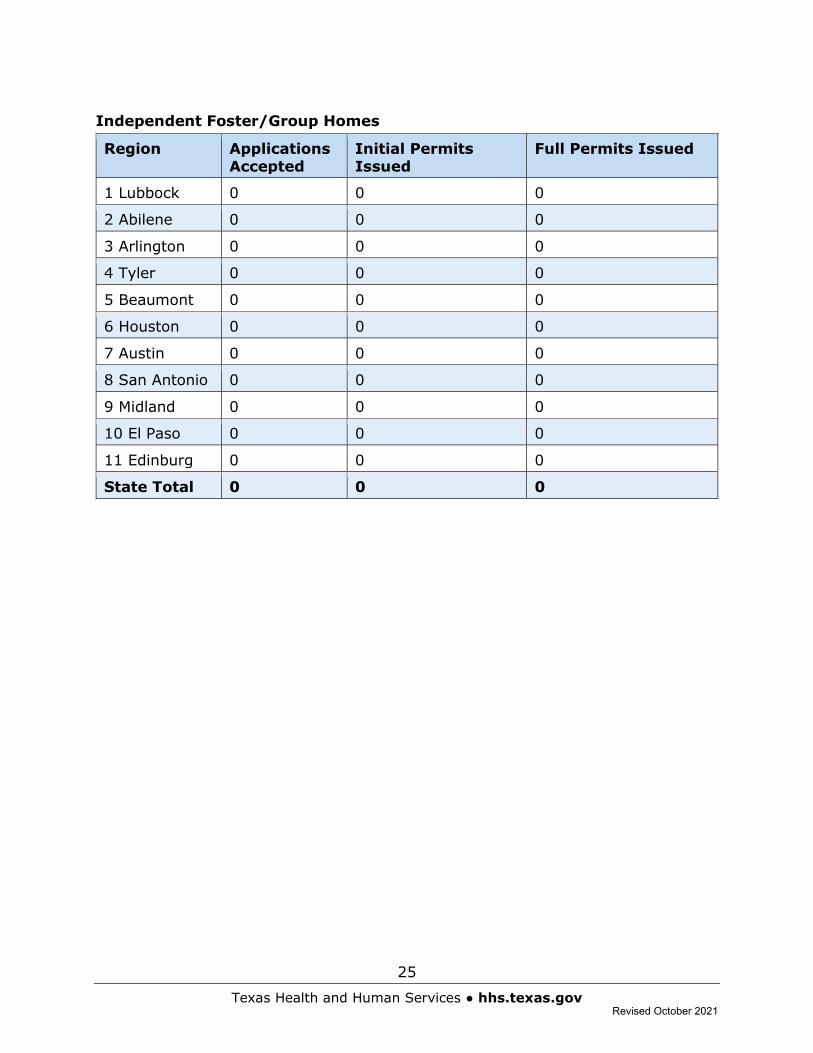
Independent Foster/Group Homes
Region Applications Accepted
Initial Permits Issued
Full Permits Issued
1 Lubbock 0 0 0
2 Abilene 0 0 0
3 Arlington 0 0 0
4 Tyler 0 0 0
5 Beaumont 0 0 0
6 Houston 0 0 0
7 Austin 0 0 0
8 San Antonio 0 0 0
9 Midland 0 0 0
10 El Paso 0 0 0
11 Edinburg 0 0 0
State Total 0 0 0
Revised October 2021
26
Texas Health and Human Services ● hhs.texas.gov
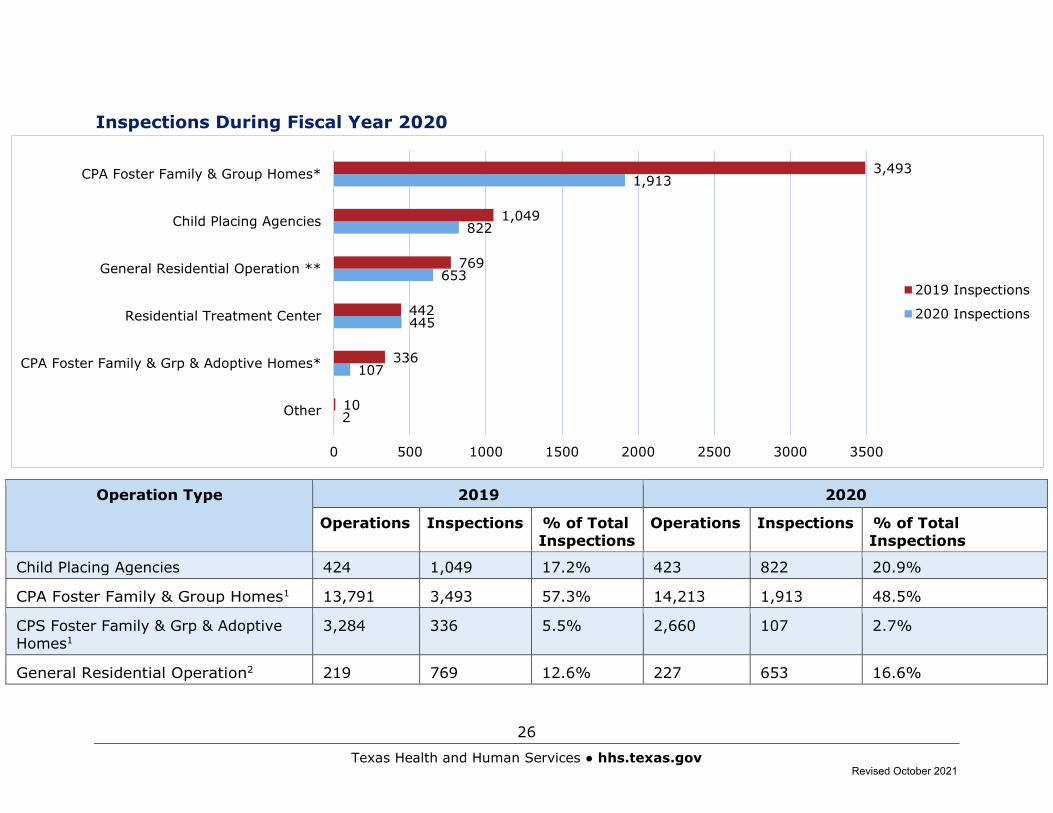
Inspections During Fiscal Year 2020
Operation Type 2019 2020
Operations Inspections % of Total Inspections
Operations Inspections % of Total Inspections
Child Placing Agencies 424 1,049 17.2% 423 822 20.9%
CPA Foster Family & Group Homes1 13,791 3,493 57.3% 14,213 1,913 48.5%
CPS Foster Family & Grp & Adoptive Homes1
3,284 336 5.5% 2,660 107 2.7%
General Residential Operation2 219 769 12.6% 227 653 16.6%
2
107
445
653
822
1,913
10
336
442
769
1,049
3,493
0 500 1000 1500 2000 2500 3000 3500
Other
CPA Foster Family & Grp & Adoptive Homes*
Residential Treatment Center
General Residential Operation **
Child Placing Agencies
CPA Foster Family & Group Homes*
2019 Inspections
2020 Inspections
Revised October 2021
27
Texas Health and Human Services ● hhs.texas.gov
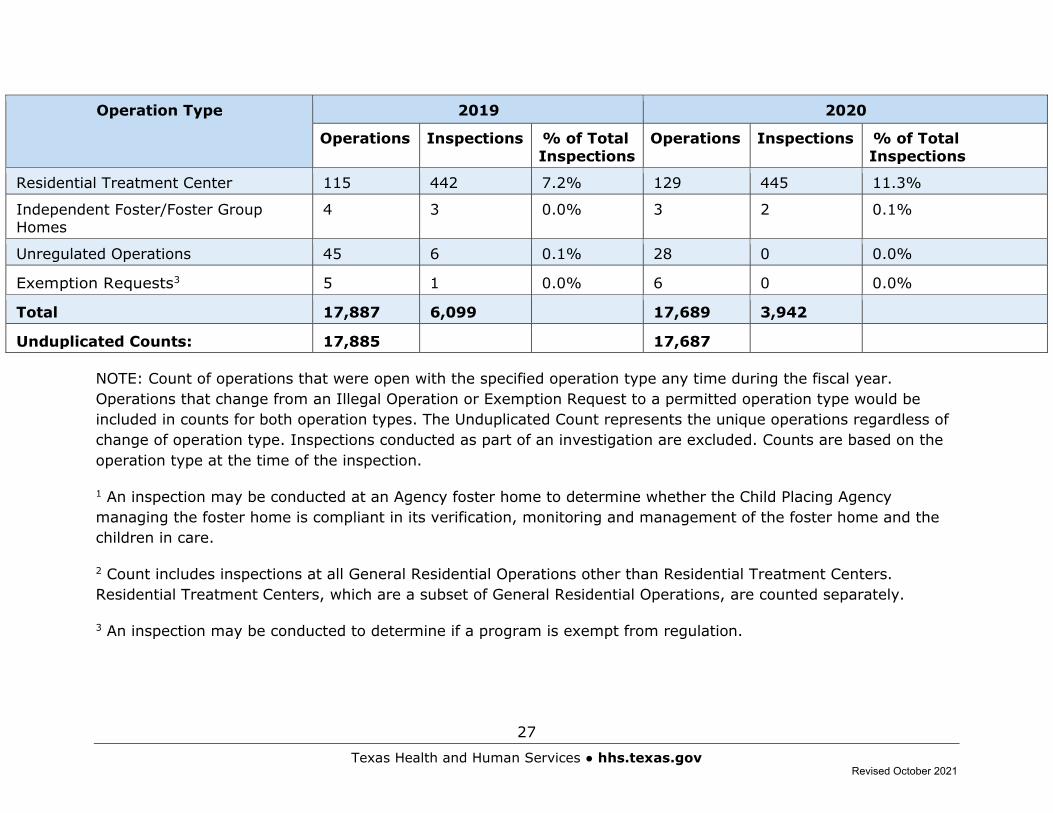
Operation Type 2019 2020
Operations Inspections % of Total Inspections
Operations Inspections % of Total Inspections
Residential Treatment Center 115 442 7.2% 129 445 11.3%
Independent Foster/Foster Group Homes
4 3 0.0% 3 2 0.1%
Unregulated Operations 45 6 0.1% 28 0 0.0%
Exemption Requests3 5 1 0.0% 6 0 0.0%
Total 17,887 6,099 17,689 3,942
Unduplicated Counts: 17,885 17,687
NOTE: Count of operations that were open with the specified operation type any time during the fiscal year. Operations that change from an Illegal Operation or Exemption Request to a permitted operation type would be included in counts for both operation types. The Unduplicated Count represents the unique operations regardless of change of operation type. Inspections conducted as part of an investigation are excluded. Counts are based on the operation type at the time of the inspection.
1 An inspection may be conducted at an Agency foster home to determine whether the Child Placing Agency managing the foster home is compliant in its verification, monitoring and management of the foster home and the children in care.
2 Count includes inspections at all General Residential Operations other than Residential Treatment Centers. Residential Treatment Centers, which are a subset of General Residential Operations, are counted separately.
3 An inspection may be conducted to determine if a program is exempt from regulation.
Revised October 2021
28
Texas Health and Human Services ● hhs.texas.gov
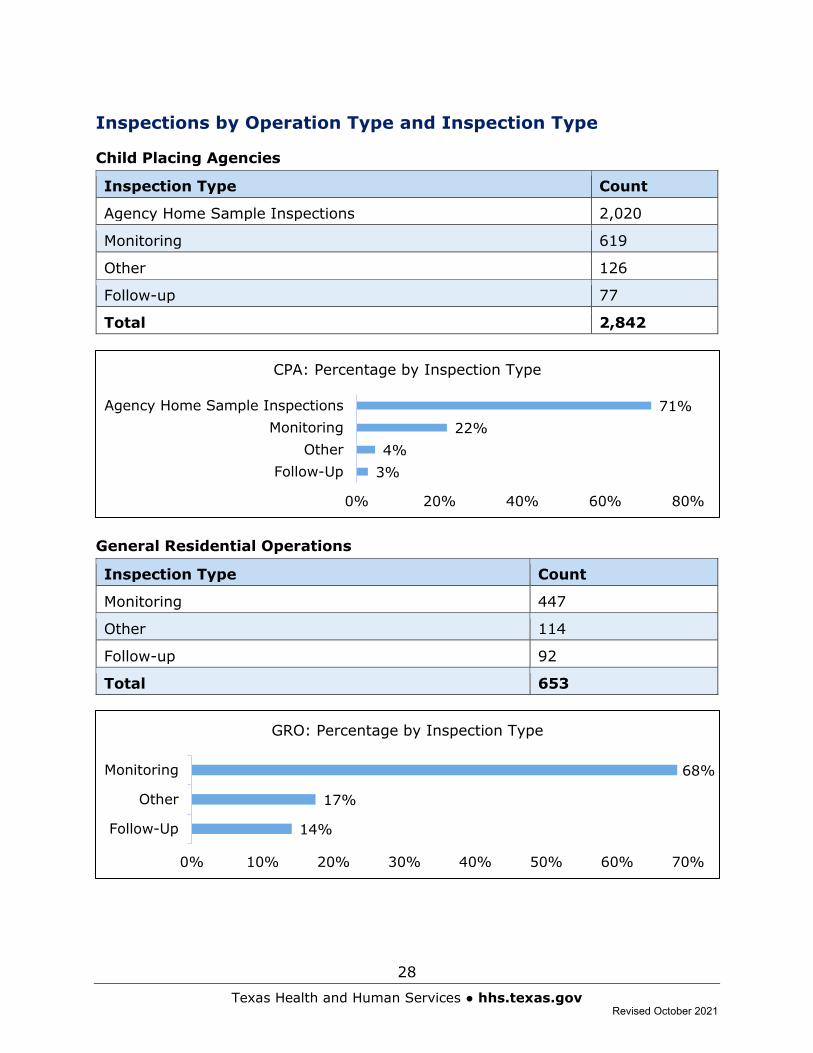
Inspections by Operation Type and Inspection Type
Child Placing Agencies
Inspection Type Count
Agency Home Sample Inspections 2,020
Monitoring 619
Other 126
Follow-up 77
Total 2,842
General Residential Operations
Inspection Type Count
Monitoring 447
Other 114
Follow-up 92
Total 653
3%4%
22%71%
0% 20% 40% 60% 80%
Follow-UpOther
MonitoringAgency Home Sample Inspections
CPA: Percentage by Inspection Type
14%
17%
68%
0% 10% 20% 30% 40% 50% 60% 70%
Follow-Up
Other
Monitoring
GRO: Percentage by Inspection Type
Revised October 2021
29
Texas Health and Human Services ● hhs.texas.gov
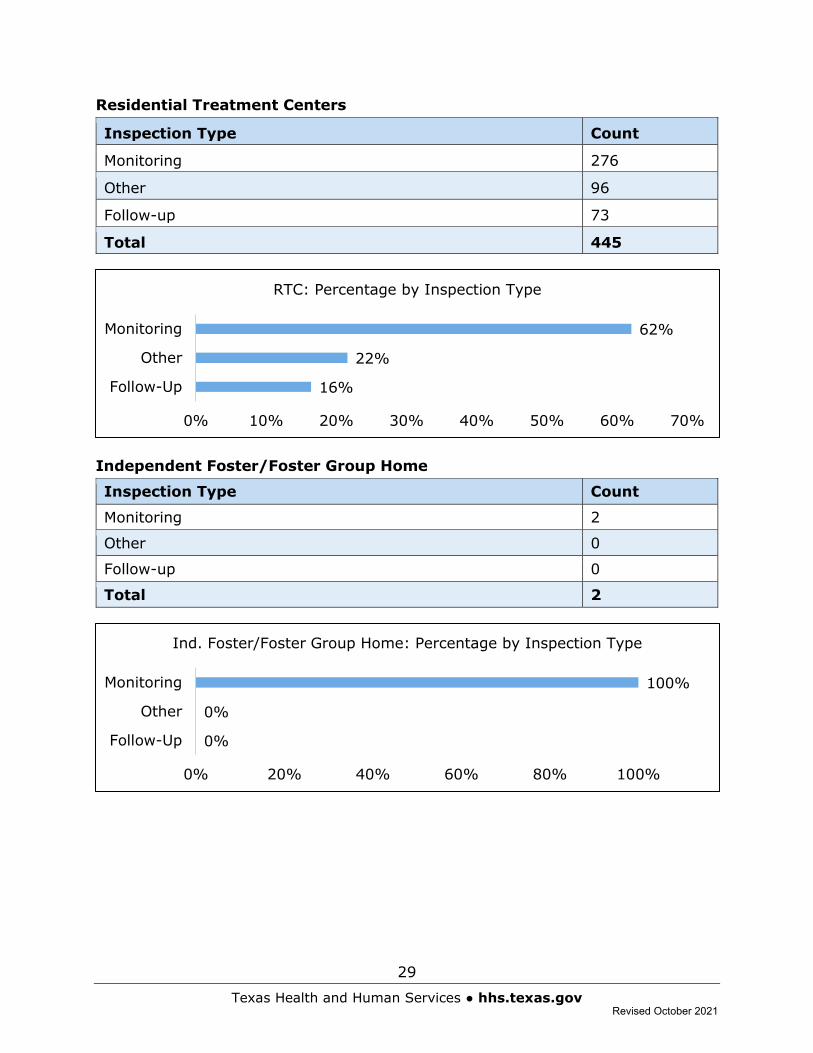
Residential Treatment Centers
Inspection Type Count
Monitoring 276
Other 96
Follow-up 73
Total 445
Independent Foster/Foster Group Home
Inspection Type Count
Monitoring 2
Other 0
Follow-up 0
Total 2
16%
22%
62%
0% 10% 20% 30% 40% 50% 60% 70%
Follow-Up
Other
Monitoring
RTC: Percentage by Inspection Type
0%
0%
100%
0% 20% 40% 60% 80% 100%
Follow-Up
Other
Monitoring
Ind. Foster/Foster Group Home: Percentage by Inspection Type
Revised October 2021
30
Texas Health and Human Services ● hhs.texas.gov
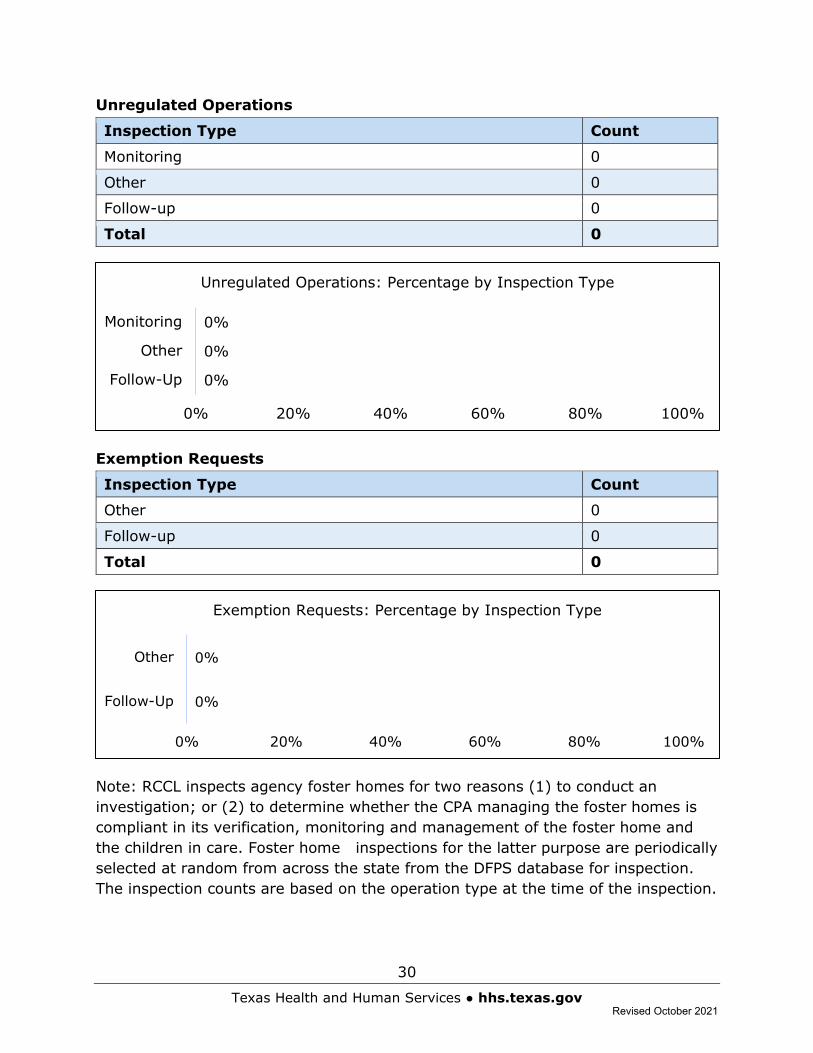
Unregulated Operations
Inspection Type Count
Monitoring 0
Other 0
Follow-up 0
Total 0
Exemption Requests
Inspection Type Count
Other 0
Follow-up 0
Total 0
Note: RCCL inspects agency foster homes for two reasons (1) to conduct an investigation; or (2) to determine whether the CPA managing the foster homes is compliant in its verification, monitoring and management of the foster home and the children in care. Foster home inspections for the latter purpose are periodically selected at random from across the state from the DFPS database for inspection. The inspection counts are based on the operation type at the time of the inspection.
0%
0%
0%
0% 20% 40% 60% 80% 100%
Follow-Up
Other
Monitoring
Unregulated Operations: Percentage by Inspection Type
0%
0%
0% 20% 40% 60% 80% 100%
Follow-Up
Other
Exemption Requests: Percentage by Inspection Type
Revised October 2021
31
Texas Health and Human Services ● hhs.texas.gov
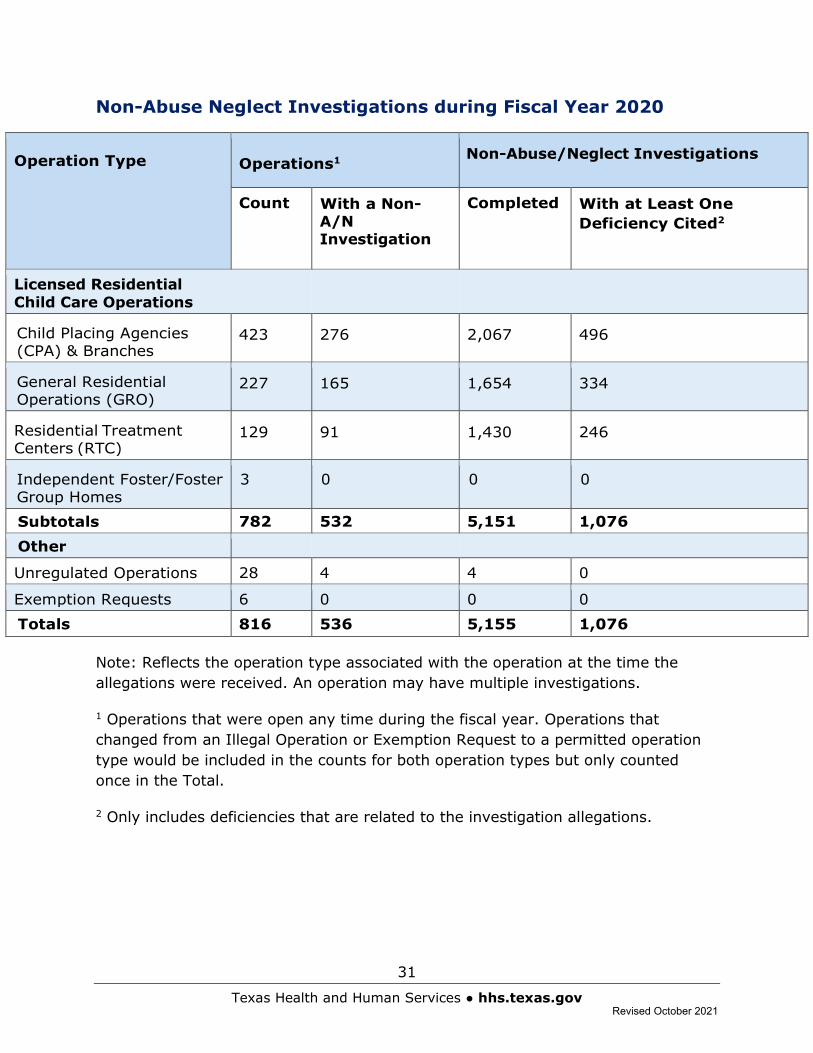
Non-Abuse Neglect Investigations during Fiscal Year 2020
Operation Type Operations1 Non-Abuse/Neglect Investigations
Count With a Non-A/N Investigation
Completed With at Least One Deficiency Cited2
Licensed Residential Child Care Operations
Child Placing Agencies (CPA) & Branches
423 276 2,067 496
General Residential Operations (GRO)
227 165 1,654 334
Residential Treatment Centers (RTC)
129 91 1,430 246
Independent Foster/Foster Group Homes
3 0 0 0
Subtotals 782 532 5,151 1,076 Other
Unregulated Operations 28 4 4 0
Exemption Requests 6 0 0 0
Totals 816 536 5,155 1,076
Note: Reflects the operation type associated with the operation at the time the allegations were received. An operation may have multiple investigations.
1 Operations that were open any time during the fiscal year. Operations that changed from an Illegal Operation or Exemption Request to a permitted operation type would be included in the counts for both operation types but only counted once in the Total.
2 Only includes deficiencies that are related to the investigation allegations.
Revised October 2021
32
Texas Health and Human Services ● hhs.texas.gov
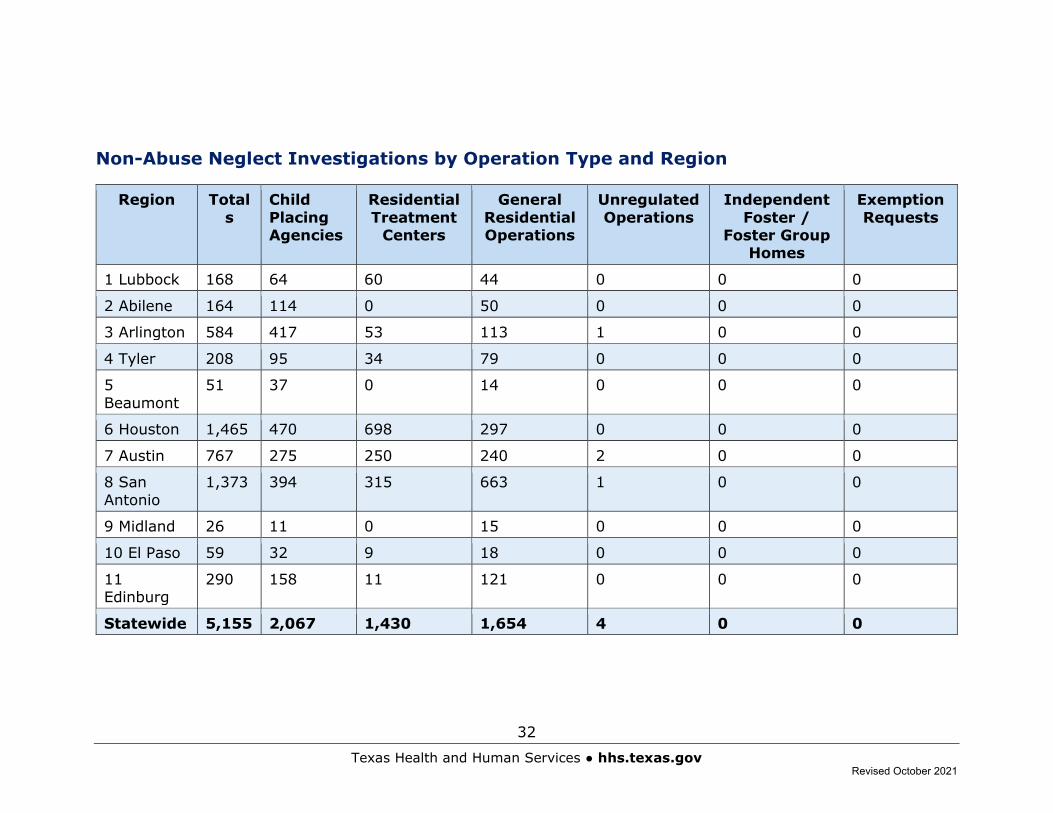
Non-Abuse Neglect Investigations by Operation Type and Region
Region Totals
Child Placing Agencies
Residential Treatment
Centers
General Residential Operations
Unregulated Operations
Independent Foster /
Foster Group Homes
Exemption Requests
1 Lubbock 168 64 60 44 0 0 0
2 Abilene 164 114 0 50 0 0 0
3 Arlington 584 417 53 113 1 0 0
4 Tyler 208 95 34 79 0 0 0
5 Beaumont
51 37 0 14 0 0 0
6 Houston 1,465 470 698 297 0 0 0
7 Austin 767 275 250 240 2 0 0
8 San Antonio
1,373 394 315 663 1 0 0
9 Midland 26 11 0 15 0 0 0
10 El Paso 59 32 9 18 0 0 0
11 Edinburg
290 158 11 121 0 0 0
Statewide 5,155 2,067 1,430 1,654 4 0 0
Revised October 2021
33
Texas Health and Human Services ● hhs.texas.gov
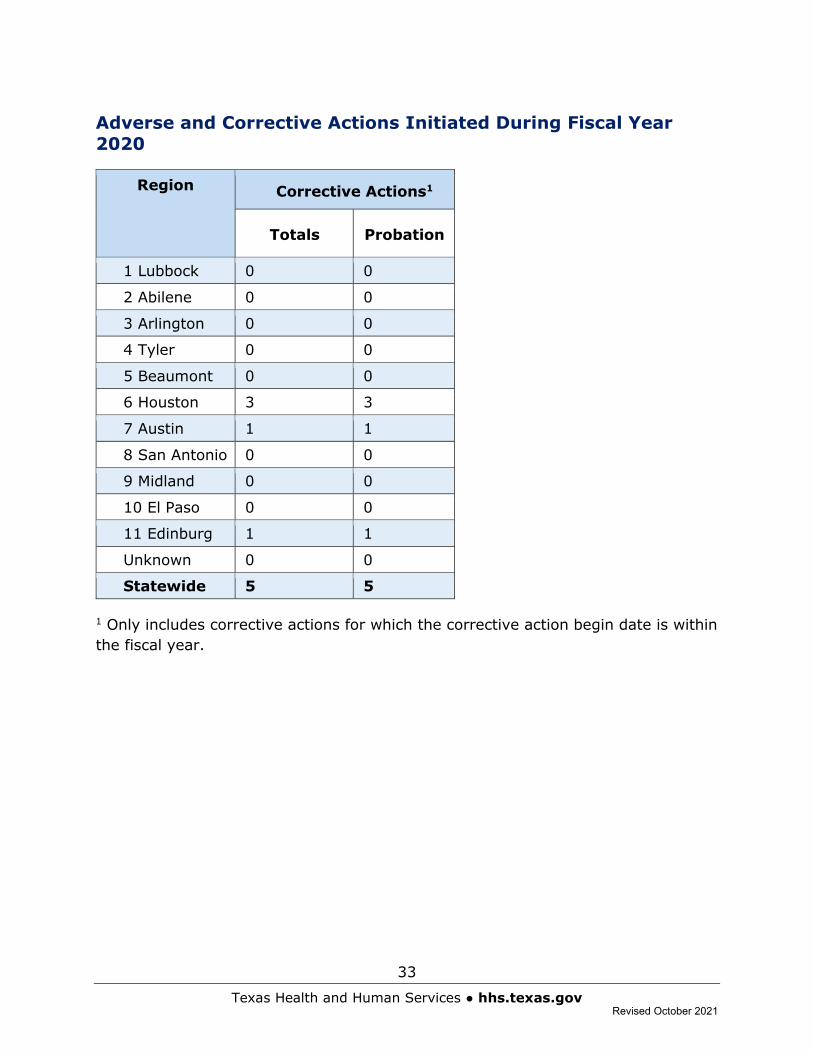
Adverse and Corrective Actions Initiated During Fiscal Year 2020
Region Corrective Actions1
Totals Probation
1 Lubbock 0 0
2 Abilene 0 0
3 Arlington 0 0
4 Tyler 0 0
5 Beaumont 0 0
6 Houston 3 3
7 Austin 1 1
8 San Antonio 0 0
9 Midland 0 0
10 El Paso 0 0
11 Edinburg 1 1
Unknown 0 0
Statewide 5 5
1 Only includes corrective actions for which the corrective action begin date is within the fiscal year.
Revised October 2021
34
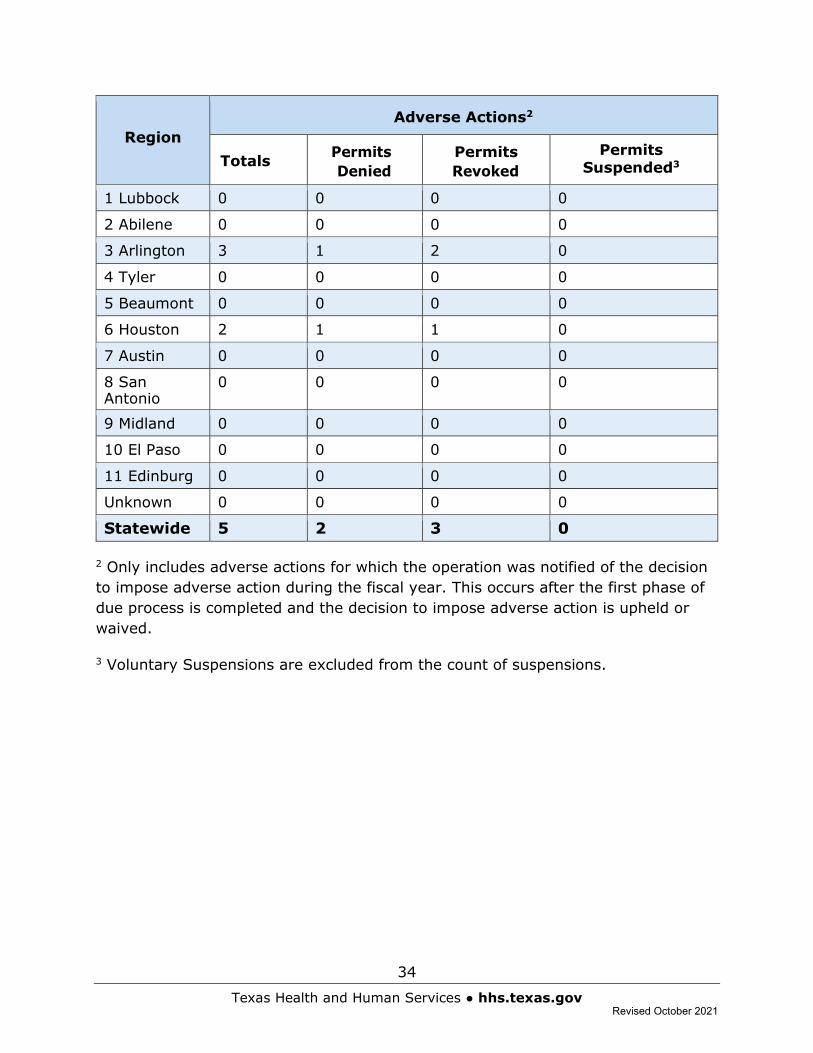
Texas Health and Human Services ● hhs.texas.gov
Region Adverse Actions2
Totals Permits Denied
Permits Revoked
Permits Suspended3
1 Lubbock 0 0 0 0
2 Abilene 0 0 0 0
3 Arlington 3 1 2 0
4 Tyler 0 0 0 0
5 Beaumont 0 0 0 0
6 Houston 2 1 1 0
7 Austin 0 0 0 0
8 San Antonio
0 0 0 0
9 Midland 0 0 0 0
10 El Paso 0 0 0 0
11 Edinburg 0 0 0 0
Unknown 0 0 0 0
Statewide 5 2 3 0
2 Only includes adverse actions for which the operation was notified of the decision to impose adverse action during the fiscal year. This occurs after the first phase of due process is completed and the decision to impose adverse action is upheld or waived.
3 Voluntary Suspensions are excluded from the count of suspensions.
Revised October 2021
35
Texas Health and Human Services ● hhs.texas.gov
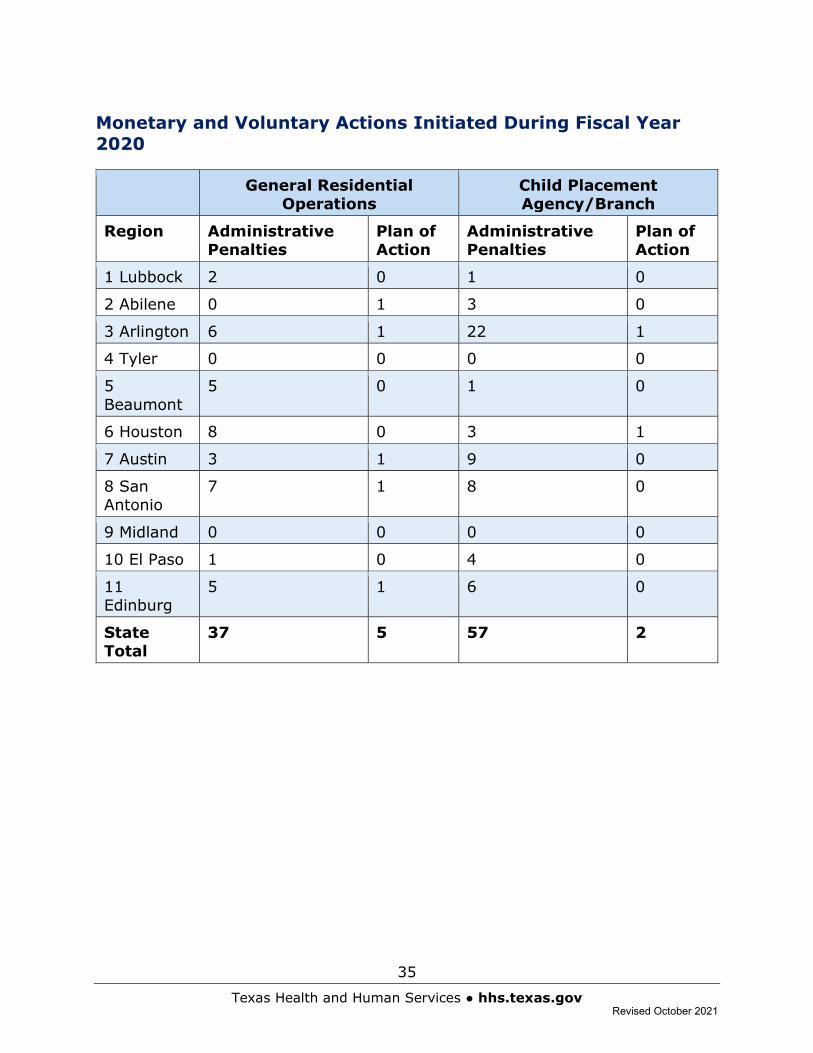
Monetary and Voluntary Actions Initiated During Fiscal Year 2020
General Residential Operations
Child Placement Agency/Branch
Region Administrative Penalties
Plan of Action
Administrative Penalties
Plan of Action
1 Lubbock 2 0 1 0
2 Abilene 0 1 3 0
3 Arlington 6 1 22 1
4 Tyler 0 0 0 0
5 Beaumont
5 0 1 0
6 Houston 8 0 3 1
7 Austin 3 1 9 0
8 San Antonio
7 1 8 0
9 Midland 0 0 0 0
10 El Paso 1 0 4 0
11 Edinburg
5 1 6 0
State Total
37 5 57 2
Revised October 2021
36
Texas Health and Human Services ● hhs.texas.gov
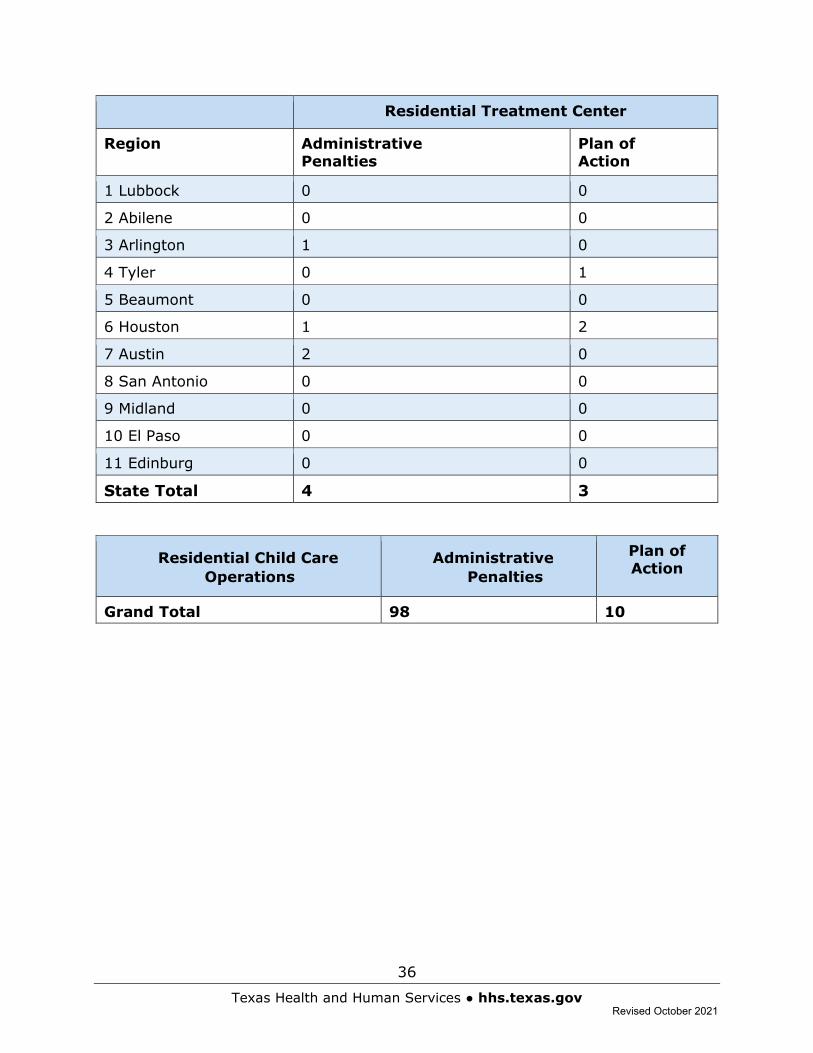
Residential Treatment Center
Region Administrative Penalties
Plan of Action
1 Lubbock 0 0
2 Abilene 0 0
3 Arlington 1 0
4 Tyler 0 1
5 Beaumont 0 0
6 Houston 1 2
7 Austin 2 0
8 San Antonio 0 0
9 Midland 0 0
10 El Paso 0 0
11 Edinburg 0 0
State Total 4 3
Residential Child Care Operations
Administrative Penalties
Plan of Action
Grand Total 98 10
Revised October 2021
37
Texas Health and Human Services ● hhs.texas.gov
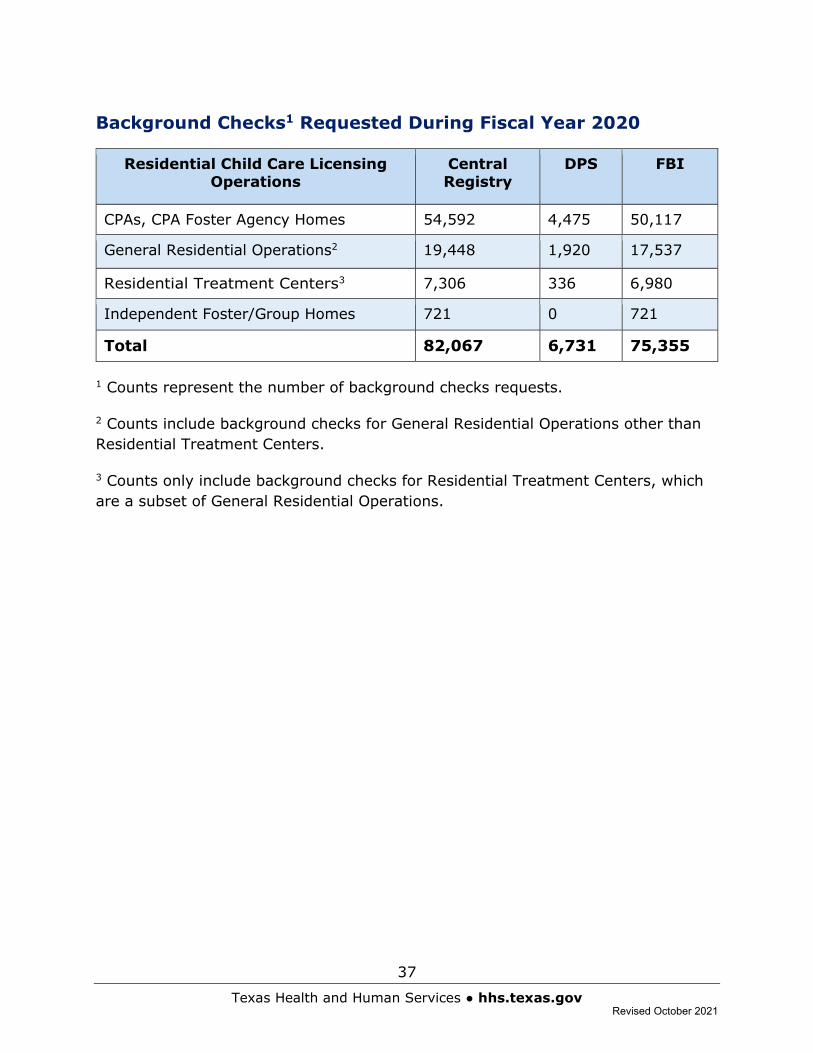
Background Checks1 Requested During Fiscal Year 2020
Residential Child Care Licensing Operations
Central Registry
DPS FBI
CPAs, CPA Foster Agency Homes 54,592 4,475 50,117
General Residential Operations2 19,448 1,920 17,537
Residential Treatment Centers3 7,306 336 6,980
Independent Foster/Group Homes 721 0 721
Total 82,067 6,731 75,355
1 Counts represent the number of background checks requests.
2 Counts include background checks for General Residential Operations other than Residential Treatment Centers.
3 Counts only include background checks for Residential Treatment Centers, which are a subset of General Residential Operations.
Revised October 2021
38
Texas Health and Human Services ● hhs.texas.gov
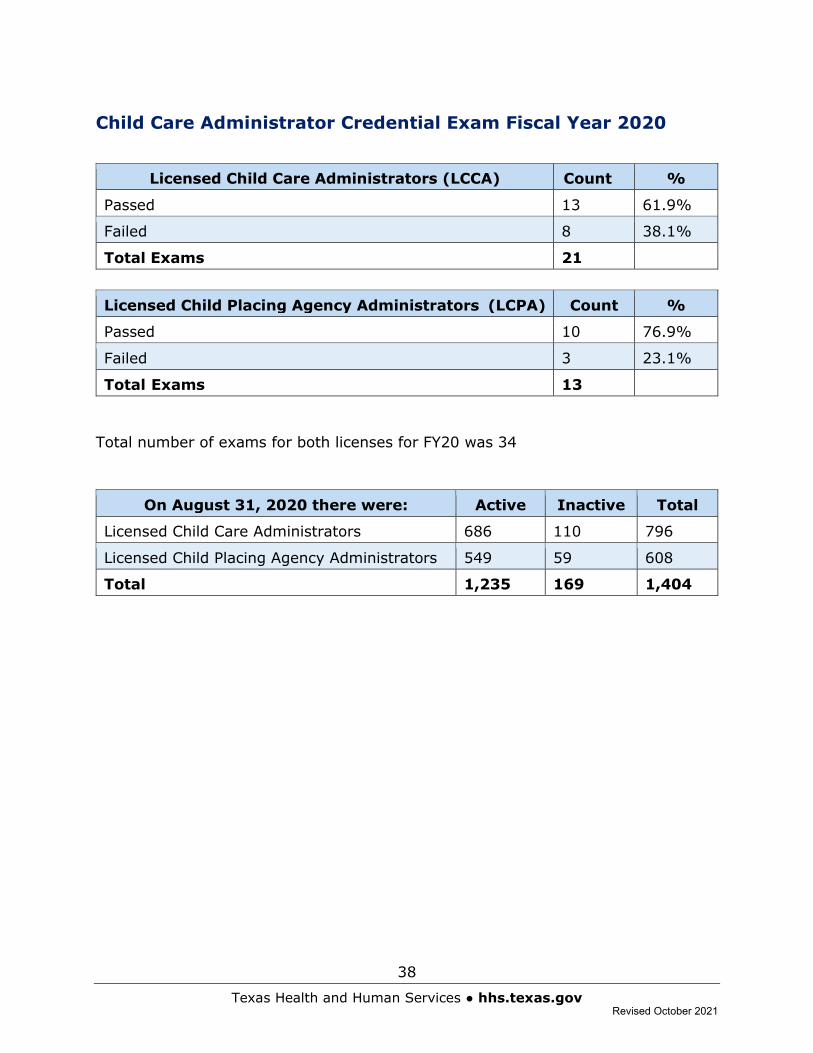
Child Care Administrator Credential Exam Fiscal Year 2020
Licensed Child Placing Agency Administrators (LCPA) Count %
Passed 10 76.9%
Failed 3 23.1%
Total Exams 13
Total number of exams for both licenses for FY20 was 34
On August 31, 2020 there were: Active Inactive Total
Licensed Child Care Administrators 686 110 796
Licensed Child Placing Agency Administrators 549 59 608
Total 1,235 169 1,404
Licensed Child Care Administrators (LCCA) Count %
Passed 13 61.9%
Failed 8 38.1%
Total Exams 21
Revised October 2021
39
Texas Health and Human Services ● hhs.texas.gov
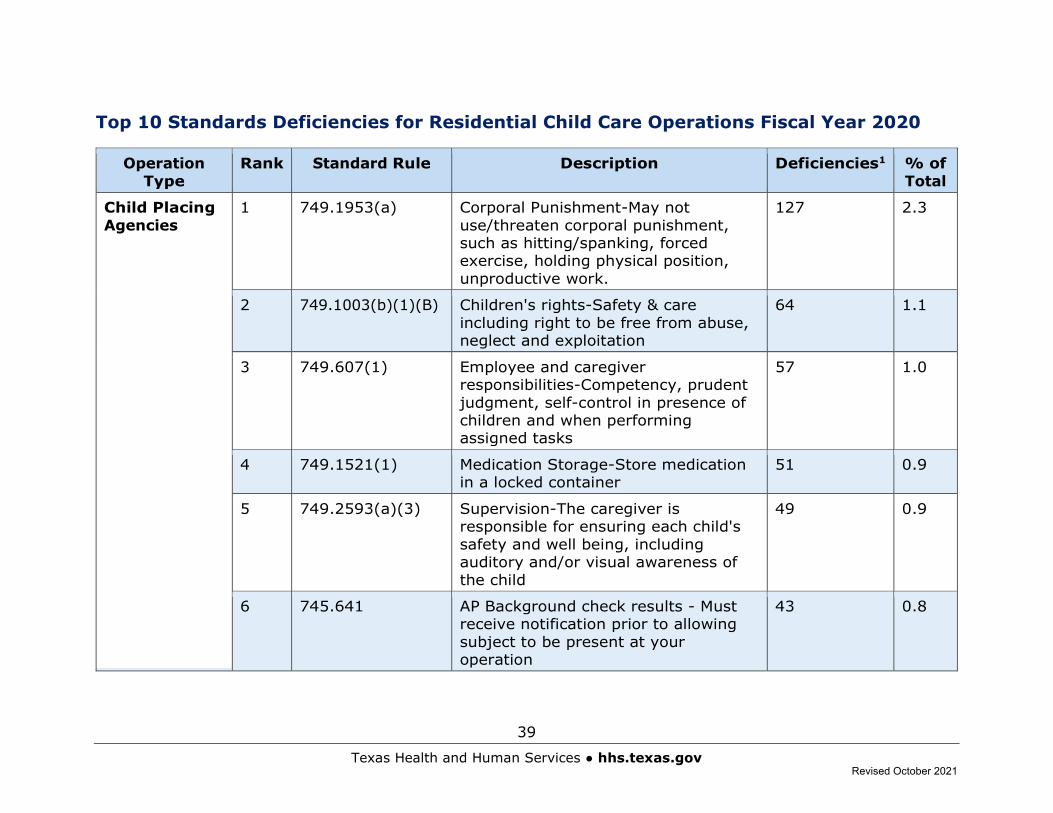
Top 10 Standards Deficiencies for Residential Child Care Operations Fiscal Year 2020
Operation Type
Rank Standard Rule Description Deficiencies1 % of Total
Child Placing Agencies
1 749.1953(a) Corporal Punishment-May not use/threaten corporal punishment, such as hitting/spanking, forced exercise, holding physical position, unproductive work.
127 2.3
2 749.1003(b)(1)(B) Children's rights-Safety & care including right to be free from abuse, neglect and exploitation
64 1.1
3 749.607(1) Employee and caregiver responsibilities-Competency, prudent judgment, self-control in presence of children and when performing assigned tasks
57 1.0
4 749.1521(1) Medication Storage-Store medication in a locked container
51 0.9
5 749.2593(a)(3) Supervision-The caregiver is responsible for ensuring each child's safety and well being, including auditory and/or visual awareness of the child
49 0.9
6 745.641 AP Background check results - Must receive notification prior to allowing subject to be present at your operation
43 0.8
Revised October 2021
40
Texas Health and Human Services ● hhs.texas.gov
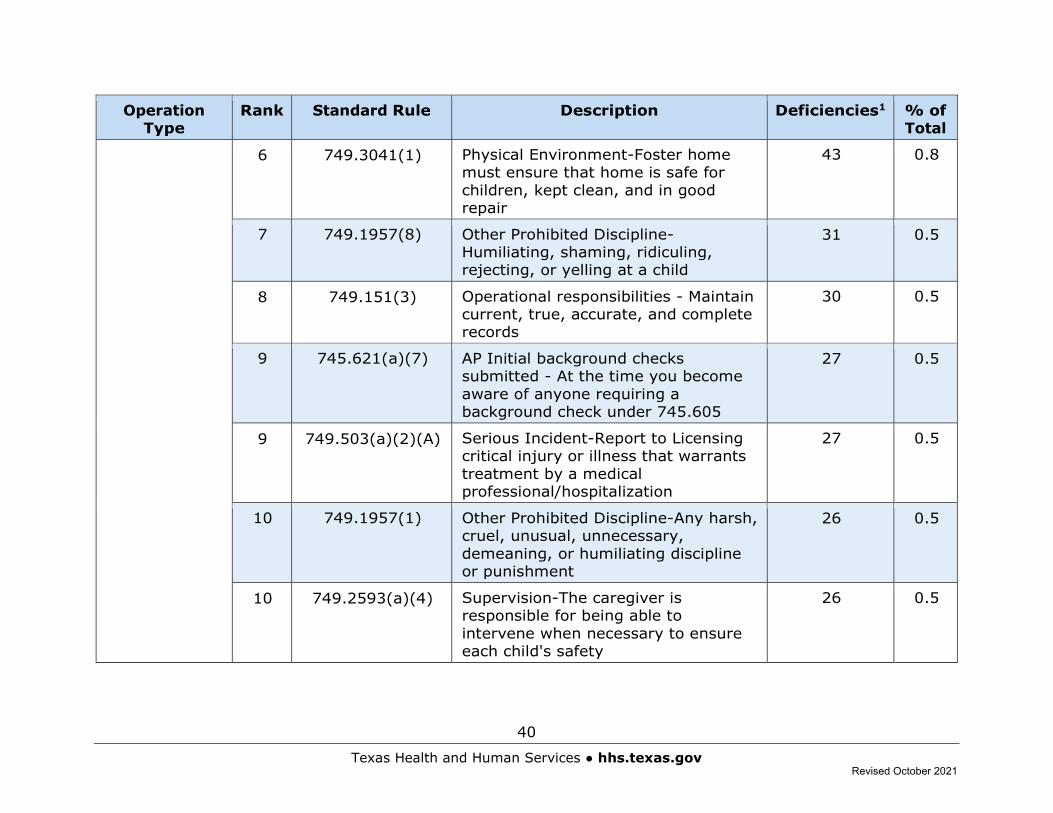
Operation Type
Rank Standard Rule Description Deficiencies1 % of Total
6 749.3041(1) Physical Environment-Foster home must ensure that home is safe for children, kept clean, and in good repair
43 0.8
7 749.1957(8) Other Prohibited Discipline-Humiliating, shaming, ridiculing, rejecting, or yelling at a child
31 0.5
8 749.151(3) Operational responsibilities - Maintain current, true, accurate, and complete records
30 0.5
9 745.621(a)(7) AP Initial background checks submitted - At the time you become aware of anyone requiring a background check under 745.605
27 0.5
9 749.503(a)(2)(A) Serious Incident-Report to Licensing critical injury or illness that warrants treatment by a medical professional/hospitalization
27 0.5
10 749.1957(1) Other Prohibited Discipline-Any harsh, cruel, unusual, unnecessary, demeaning, or humiliating discipline or punishment
26 0.5
10 749.2593(a)(4) Supervision-The caregiver is responsible for being able to intervene when necessary to ensure each child's safety
26 0.5
Revised October 2021
41
Texas Health and Human Services ● hhs.texas.gov
Operation Type
Rank Standard Rule Description Deficiencies1 % of Total
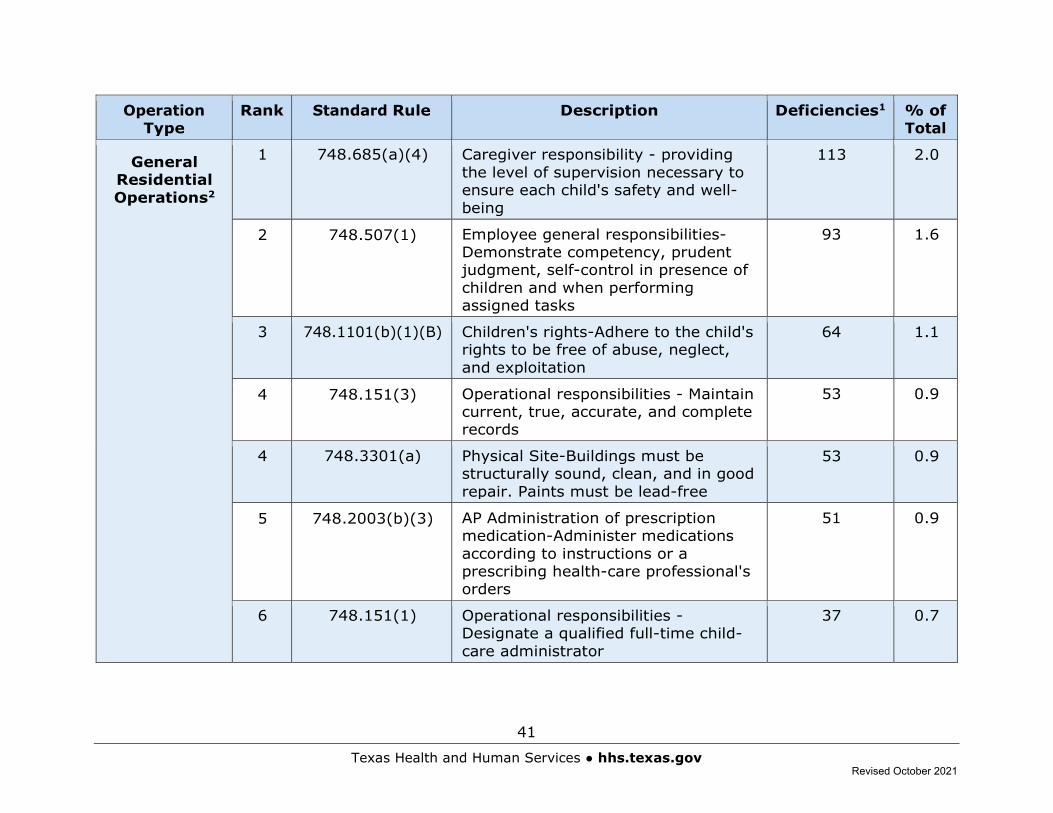
General Residential Operations2
1 748.685(a)(4) Caregiver responsibility - providing the level of supervision necessary to ensure each child's safety and well-being
113 2.0
2 748.507(1) Employee general responsibilities-Demonstrate competency, prudent judgment, self-control in presence of children and when performing assigned tasks
93 1.6
3 748.1101(b)(1)(B) Children's rights-Adhere to the child's rights to be free of abuse, neglect, and exploitation
64 1.1
4 748.151(3) Operational responsibilities - Maintain current, true, accurate, and complete records
53 0.9
4 748.3301(a) Physical Site-Buildings must be structurally sound, clean, and in good repair. Paints must be lead-free
53 0.9
5 748.2003(b)(3) AP Administration of prescription medication-Administer medications according to instructions or a prescribing health-care professional's orders
51 0.9
6 748.151(1) Operational responsibilities - Designate a qualified full-time child-care administrator
37 0.7
Revised October 2021
42
Texas Health and Human Services ● hhs.texas.gov
Operation Type
Rank Standard Rule Description Deficiencies1 % of Total
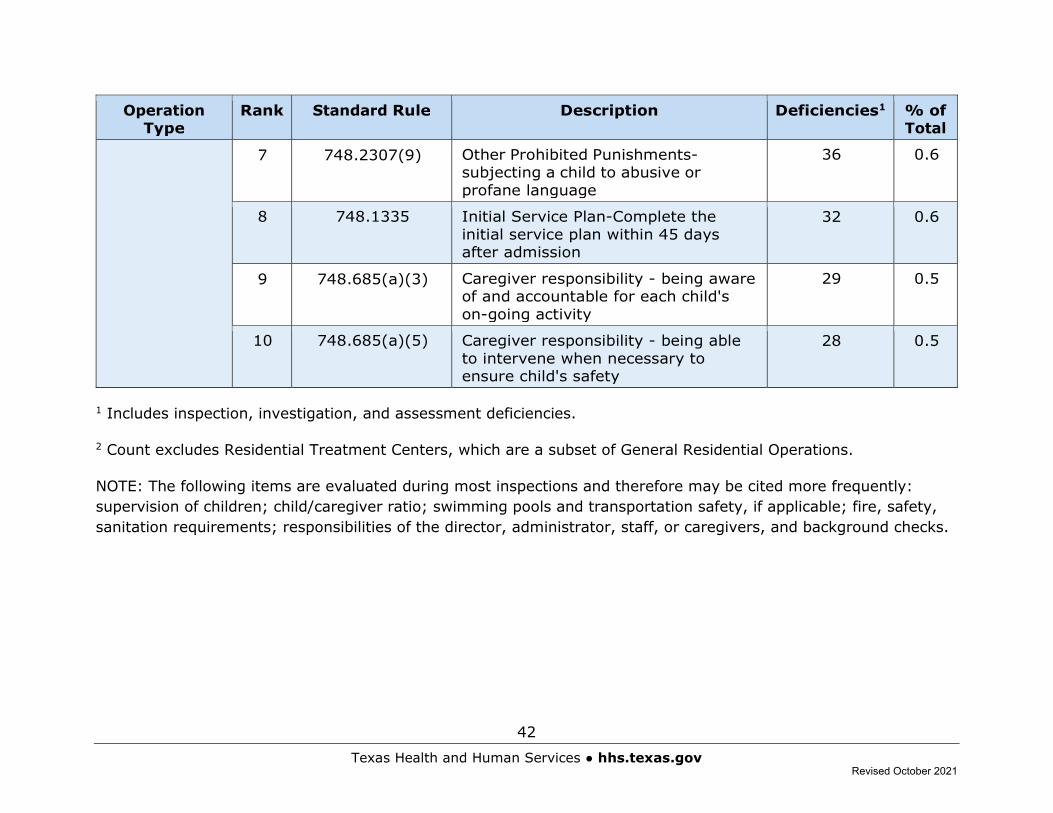
7 748.2307(9) Other Prohibited Punishments-subjecting a child to abusive or profane language
36 0.6
8 748.1335 Initial Service Plan-Complete the initial service plan within 45 days after admission
32 0.6
9 748.685(a)(3) Caregiver responsibility - being aware of and accountable for each child's on-going activity
29 0.5
10 748.685(a)(5) Caregiver responsibility - being able to intervene when necessary to ensure child's safety
28 0.5
1 Includes inspection, investigation, and assessment deficiencies.
2 Count excludes Residential Treatment Centers, which are a subset of General Residential Operations.
NOTE: The following items are evaluated during most inspections and therefore may be cited more frequently: supervision of children; child/caregiver ratio; swimming pools and transportation safety, if applicable; fire, safety, sanitation requirements; responsibilities of the director, administrator, staff, or caregivers, and background checks.
Revised October 2021
43
Texas Health and Human Services ● hhs.texas.gov
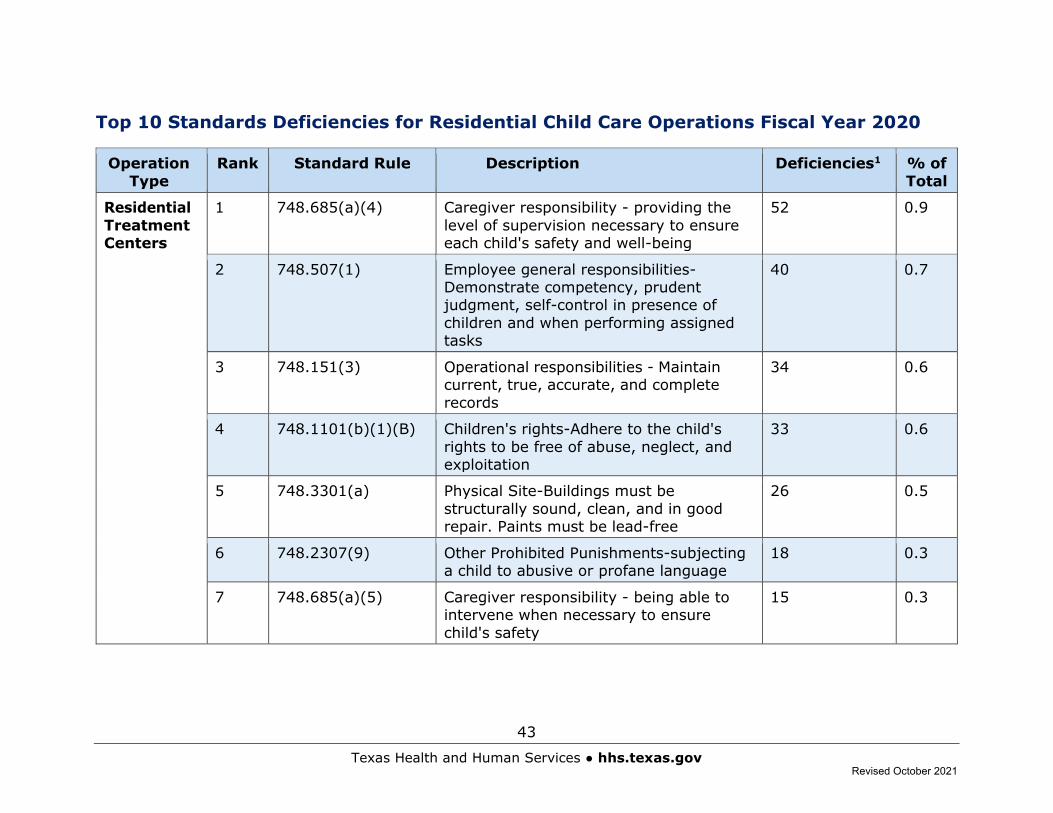
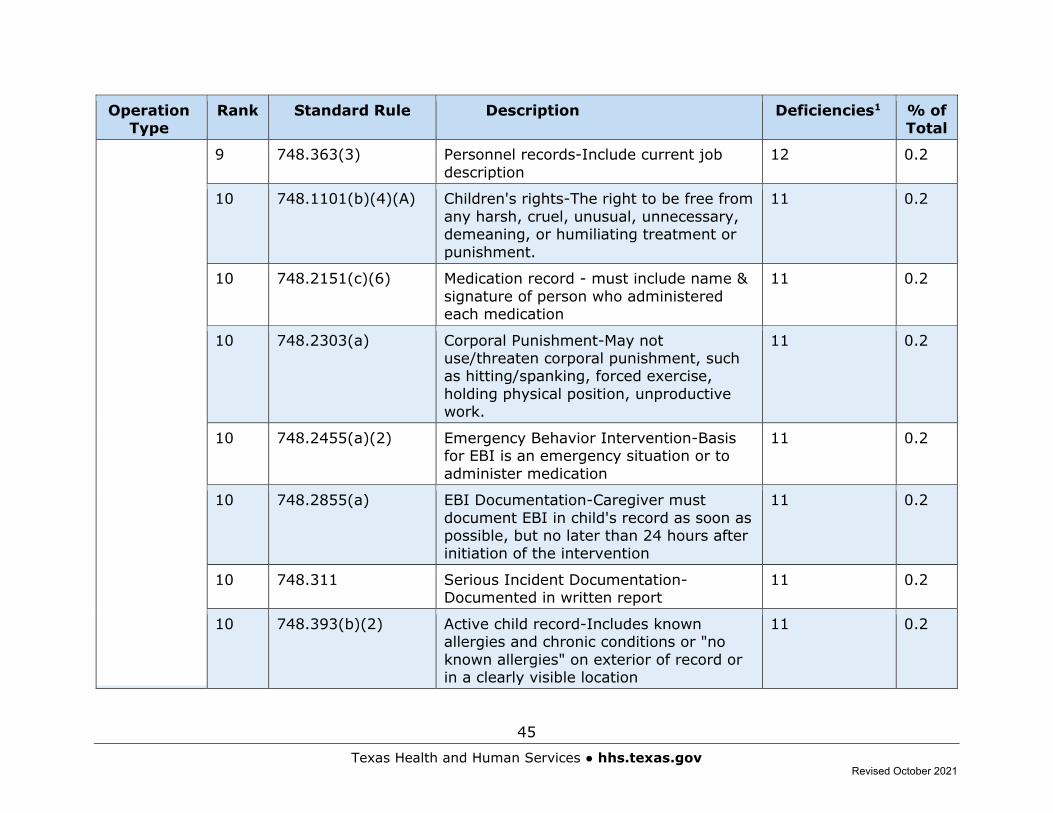
Top 10 Standards Deficiencies for Residential Child Care Operations Fiscal Year 2020
Operation Type
Rank Standard Rule Description Deficiencies1 % of Total
Residential Treatment Centers
1 748.685(a)(4) Caregiver responsibility - providing the level of supervision necessary to ensure each child's safety and well-being
52 0.9
2 748.507(1) Employee general responsibilities-Demonstrate competency, prudent judgment, self-control in presence of children and when performing assigned tasks
40 0.7
3 748.151(3) Operational responsibilities - Maintain current, true, accurate, and complete records
34 0.6
4 748.1101(b)(1)(B) Children's rights-Adhere to the child's rights to be free of abuse, neglect, and exploitation
33 0.6
5 748.3301(a) Physical Site-Buildings must be structurally sound, clean, and in good repair. Paints must be lead-free
26 0.5
6 748.2307(9) Other Prohibited Punishments-subjecting a child to abusive or profane language
18 0.3
7 748.685(a)(5) Caregiver responsibility - being able to intervene when necessary to ensure child's safety
15 0.3
Revised October 2021
44
Texas Health and Human Services ● hhs.texas.gov
Operation Type
Rank Standard Rule Description Deficiencies1 % of Total
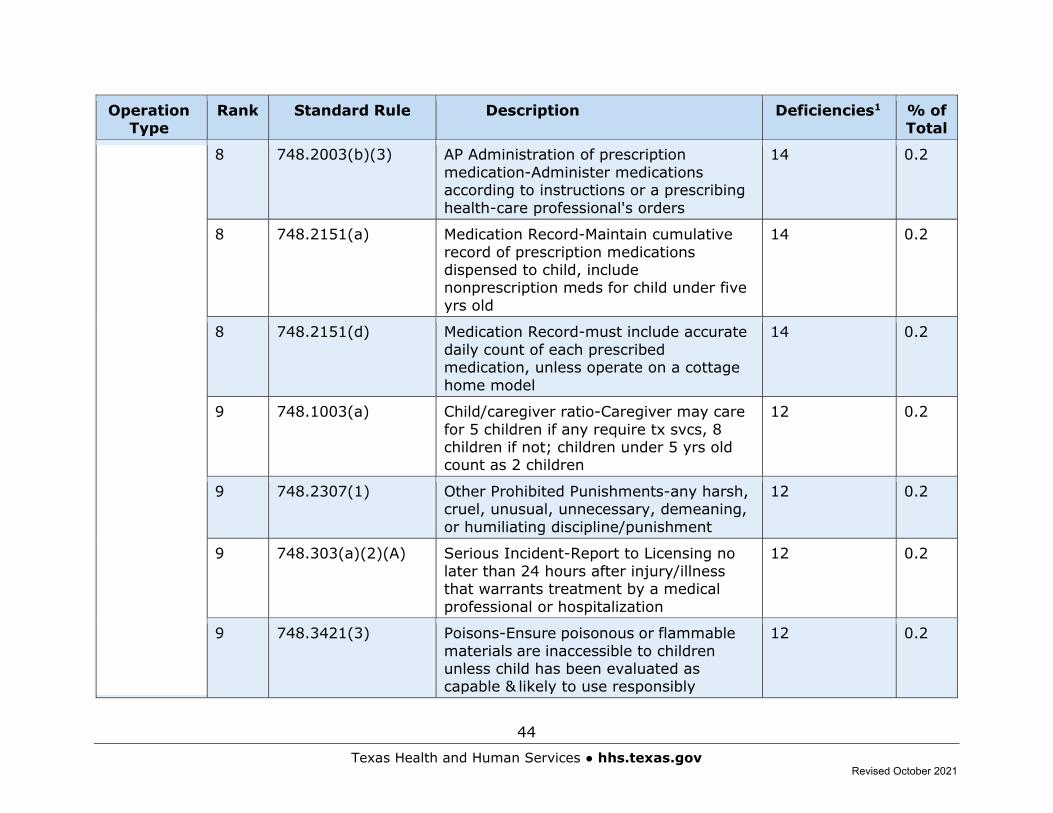
8 748.2003(b)(3) AP Administration of prescription medication-Administer medications according to instructions or a prescribing health-care professional's orders
14 0.2
8 748.2151(a) Medication Record-Maintain cumulative record of prescription medications dispensed to child, include nonprescription meds for child under five yrs old
14 0.2
8 748.2151(d) Medication Record-must include accurate daily count of each prescribed medication, unless operate on a cottage home model
14 0.2
9 748.1003(a) Child/caregiver ratio-Caregiver may care for 5 children if any require tx svcs, 8 children if not; children under 5 yrs old count as 2 children
12 0.2
9 748.2307(1) Other Prohibited Punishments-any harsh, cruel, unusual, unnecessary, demeaning, or humiliating discipline/punishment
12 0.2
9 748.303(a)(2)(A) Serious Incident-Report to Licensing no later than 24 hours after injury/illness that warrants treatment by a medical professional or hospitalization
12 0.2
9 748.3421(3) Poisons-Ensure poisonous or flammable materials are inaccessible to children unless child has been evaluated as capable & likely to use responsibly
12 0.2
Revised October 2021
45
Texas Health and Human Services ● hhs.texas.gov
Operation Type
Rank Standard Rule Description Deficiencies1 % of Total
9 748.363(3) Personnel records-Include current job description
12 0.2
10 748.1101(b)(4)(A) Children's rights-The right to be free from any harsh, cruel, unusual, unnecessary, demeaning, or humiliating treatment or punishment.
11 0.2
10 748.2151(c)(6) Medication record - must include name & signature of person who administered each medication
11 0.2
10 748.2303(a) Corporal Punishment-May not use/threaten corporal punishment, such as hitting/spanking, forced exercise, holding physical position, unproductive work.
11 0.2
10 748.2455(a)(2) Emergency Behavior Intervention-Basis for EBI is an emergency situation or to administer medication
11 0.2
10 748.2855(a) EBI Documentation-Caregiver must document EBI in child's record as soon as possible, but no later than 24 hours after initiation of the intervention
11 0.2
10 748.311 Serious Incident Documentation-Documented in written report
11 0.2
10 748.393(b)(2) Active child record-Includes known allergies and chronic conditions or "no known allergies" on exterior of record or in a clearly visible location
11 0.2
Revised October 2021
46
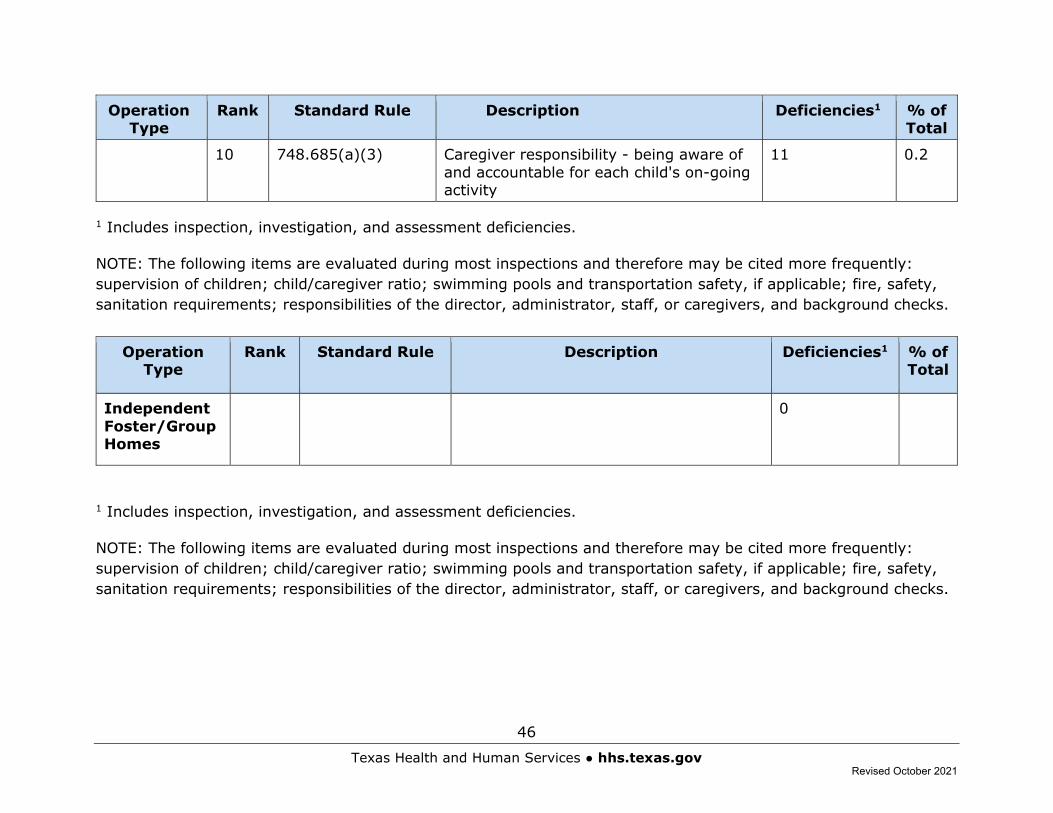
Texas Health and Human Services ● hhs.texas.gov
Operation Type
Rank Standard Rule Description Deficiencies1 % of Total
10 748.685(a)(3) Caregiver responsibility - being aware of and accountable for each child's on-going activity
11 0.2
1 Includes inspection, investigation, and assessment deficiencies.
NOTE: The following items are evaluated during most inspections and therefore may be cited more frequently: supervision of children; child/caregiver ratio; swimming pools and transportation safety, if applicable; fire, safety, sanitation requirements; responsibilities of the director, administrator, staff, or caregivers, and background checks.
Operation Type
Rank Standard Rule Description Deficiencies1 % of Total
Independent Foster/Group Homes
0
Revised October 2021
47
Texas Health and Human Services ● hhs.texas.gov
The above statistical tables are an overview of Residential Child Care Regulation operations and HHSC’s involvement with those operations. HHSC is granted its authority to regulate child-care facilities and child-placing agencies by the Texas Legislature in Chapter 42 of the Texas Human Resources Code. The purpose of regulation is to protect a group of class of children by establishing and enforcing statewide minimum standards.
Data received by Texas Health and Human Services were prepared by Regulatory Services Data and Analytics at HHSC.
For questions about these tables and processing of these reports, please email HHSC Regulatory Services Data and Analytics at [email protected]. For additional data and information requests, please email HHSC Open Records at [email protected]. Data for abuse and neglect allegations in Child Day Care Licensing operations can be found at DFPS Data Book1.
1 http://www.dfps.state.tx.us/About_DFPS/Data_Book/default.asp
Revised October 2021