child centred approach to climate change and health ... · child centred approach to climate change...
TRANSCRIPT
Child centred approach to climate change and health adaptation through schools : A randomised intervention trial in Bangladesh
Md Iqbal Kabir1,2*, Md Bayzidur Rahman3 , Wayne Smith1 , Mirza Afreen Fatima Lusha4 , Abul Hasnat Milton1 Affiliations: 1. Centre for Clinical Epidemiology and Biostatistics, School of Medicine and Public Health, Faculty of Health and Medicine, The University of Newcastle, NSW 2308,Australia 2 .National Institute of Preventive and Social Medicine, NIPSOM, Mohakhali, Dhaka, Bangladesh 3.School of Public Health and Community Medicine, Faculty of Medicine, University of New South Wales, Sydney, Australia. 4. Climate Change and Health Promotion Unit, Ministry of Health and Family Welfare, Bangladesh Author for correspondence:
Dr Iqbal Kabir, PhD candidate, The University of Newcastle, Australia e-mail:[email protected]

Background • The climate is changing and this change is affecting
human health directly and indirectly. • To protect health, highly strategic interventions for
adaptation will be required over the next 20-30 years. • Bangladesh topped on the risk index of climate victims
by the Intergovernmental Panel on Climate Change (IPCC).
• Children are one of the largest and most vulnerable groups at risk.
• Therefore child-centred adaptation would help to reduce the vulnerability.

School manual for high schools
• A school manual, based on a 2008 WHO manual, was developed for high school students on climate change and health protection by the Ministry of Health, Bangladesh in collaboration with the National Curriculum and Textbook Board (NCTB).
• A range of stakeholders from government and civil society, experts in climate change and education manual development, public health specialists and communication experts came together to develop the manual.

Objective • It was expected that this manual will help to increase the
knowledge level of high school students on health adaptation to climate change.
• No study has been conducted so far to examine the effectiveness of this manual in increasing the knowledge of the school children in climate change which would contribute to child centred adaptation.
• In this clustered randomized intervention trial we evaluated the effectiveness of this manual in increasing the knowledge level of school children.

Methods
• In Bangladesh, thirty upazilas (sub-district) of seven
coastal districts are known to be most vulnerable for climate change and extreme weather events().
• This cluster randomized intervention trial was conducted among 3293 secondary school participants of these areas from August 2012 to June 2013.
• Two secondary schools from each of the 30 upazilas were randomly selected in the study areas.
• From 60 selected schools, all the students studying in class seven (grade seven) were recruited.
Randomisation • Among 30 upazilas, 15 were randomly allocated to the
control group and 15 to the intervention group. • Random selection of schools and random allocation of
the upazilas were carried out by generating and sortin random numberws in SAS (version 9.3) program by an independent statistician.
• Thus out of the 60 schools, 30 received the intervention while the other 30 were the controls.
• All the students in both the groups sat for a pre-test of 30 uniform short questions
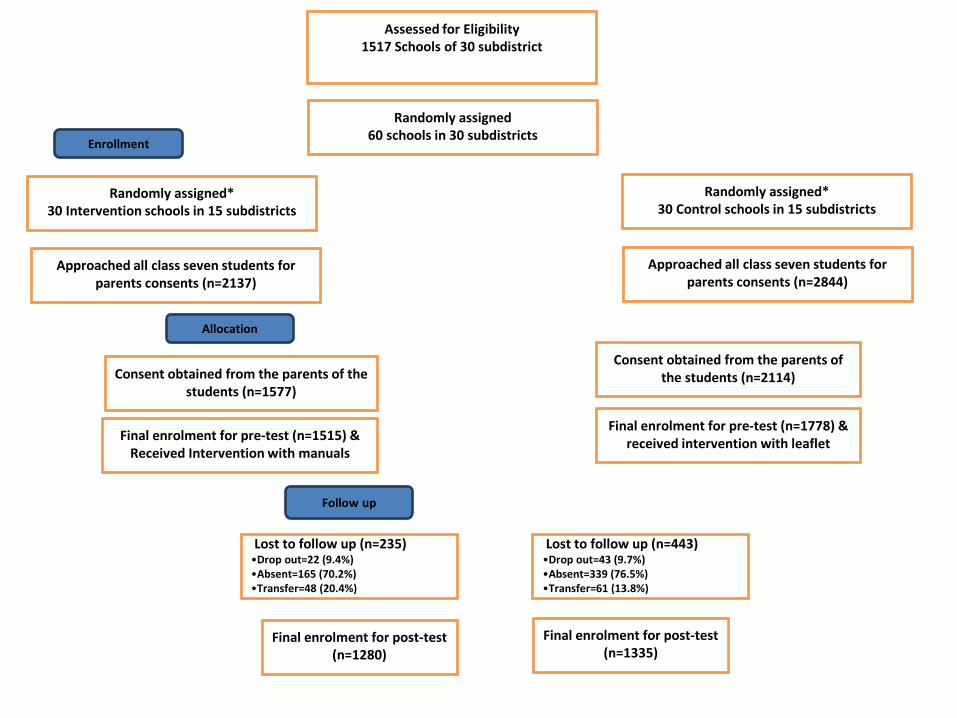
Assessed for Eligibility
1517 Schools of 30 subdistrict
Randomly assigned 60 schools in 30 subdistricts
Randomly assigned* 30 Intervention schools in 15 subdistricts
Randomly assigned* 30 Control schools in 15 subdistricts
Approached all class seven students for parents consents (n=2137)
Approached all class seven students for parents consents (n=2844)
Consent obtained from the parents of the students (n=1577)
Consent obtained from the parents of the students (n=2114)
Final enrolment for pre-test (n=1515) & Received Intervention with manuals
Final enrolment for pre-test (n=1778) & received intervention with leaflet
Lost to follow up (n=235) •Drop out=22 (9.4%) •Absent=165 (70.2%) •Transfer=48 (20.4%)
Lost to follow up (n=443) •Drop out=43 (9.7%) •Absent=339 (76.5%) •Transfer=61 (13.8%)
Final enrolment for post-test (n=1280)
Final enrolment for post-test (n=1335)
Enrollment
Allocation
Follow up

Intervention & Blinding • Total of 1515 students from 30 intervention schools
received the intervention through three days training based on the school manual.
• At the same time a leaflet containing general message on climate change and health was distributed among 1778 students of the 30 control schools.
• Six months later, a post-intervention test of the same questionnaire was taken for both intervention and control schools.
• A unique code number was provided to each of the participants to use on their score sheet. These codes were revealed from the University of Newcastle, Australia after completing post-intervention marking of the questionnaires

Data Analysis • We fitted a multivariable linear regression model using percentage
of post-intervention test score as the outcome variable under generalized estimating equation (GEE) framework to account for clustering by school, after adjusting for potential confounders and pre-intervention test score.
• We used exchangeable correlation structure to adjust for clustering. In the initial model, we included all the variables along with the main exposure variable (randomization arm) that were significant (P <0.25) in the univariable analysis.
• A backward elimination method was used to remove the variables that did not have any confounding effect, that is, could not make meaningful change (±10%) in the regression coefficient of the randomisation arm. If a variable was not a confounder but significant in the multivariable model at 5% level was retained for increased precision of the estimates.

Results • Most of the school children came from low income family
(n=3293), 45% family head were farmer or day labourer, 20% service holder, 21% small and medium business holder.
• Father was the family head in most of the cases (93%) and living mostly in non-brick kaccha (fence and corrugated sheets) or mud houses (Table 1).
• The variables occupation of family head, population density at home (person per room) (table 1), usable toilet per student, nearby community clinics, plantation programmes for the school students (table 2) were found significantly (at 25% level) different between the control and intervention groups and they were included in the multivariable random effect models.

Results • After adopting the backward elimination approach the final model
revealed that students in the intervention school obtained 17% (95%CI: 13% to 19%, P<0.001) higher marks compared to the control school
• Students whose family head is a house wife had the lowest score and population density demonstrated an inverse association with post intervention marks (regression coefficient = − 41, P<001) (table 3).
• The cluster adjusted RRs for all the 30 questions were greater than one demonstrating a higher probability of answering correct being in the intervention group.
• As a whole the multivariable analysis (table 4) shows that the intervention group became 3 to 7 times more knowledgeable (95% CI: 3% to 8 %, p<0.001) to control group on the issues of health effect of climate change.

Discussion • This intervention trial showed that the training with
manuals for school children increases the knowledge about climate change related current and future health risk as well as the adaptive measures compared to the control group.
• The rates of all outcomes were higher in intervention group as they received formatted training as per the manual
• Several global studies revealed that the key to building resilience and adaptive capabilities of children lies within preparation at the school levels.
• .

Discussion • In rural Bangladesh the dropout rate and absenteeism is quite
high (>30%) and that was the cause for lost to follow up (20.58%) in this trial. Short duration of time between assessment was another limitation
• This trial is first of its kind in South Asia. The randomisation of intervention schools has evenly spread unknown and known confounders. Furthermore the study recruited participants from an array of wider geographic locations.
• Climate Change will reconfigure and intensify existing exposures and conditions that pose risk to human health. With children being innately vulnerable, caution must be taken to direct prevention efforts by reducing their exposure and susceptibility to adverse effect from climate change.

Conclusion • As our result suggests, child centered adaptation
strategy through school health promotion can enhance the adaptive capacity of the future generation in the vulnerable community of South East Asia specially in the context of Bangladesh.
• The manual could be scaled up throughout the schools for mainstreaming the risk awareness in education system to protect human health from climate change.
• Further study for cost-effectiveness and longer term impact on population.


CASE STUDY: BANGLADESH VULNERABILITY Bangladesh: Part of GBM - Highly Vulnerable to Climate Change

Se
a L
eve
l Ris
e

Temperature variability
Deviation of yearly mean temperature during 1981-1990 (left), 1991-2000 (middle) and 2001-2010 (right) as compared with the baseline (1961-1990) based on local meteorological data