child health care system in north east india with special
TRANSCRIPT

1
Child Health Care System in North East India
with Special Reference to Sikkim
Dissertation Submitted to Sikkim University in Partial Fulfillment
Of the Requirement for Award of the Degree of
MASTER OF PHILOSOPHY
Submitted by:
Sumitra Gurung Roll No.: 15MPEC04
DEPARTMENT OF ECONOMICS
SCHOOL OF SOCIAL SCIENCE
SIKKIM UNIVERSITY
GANGTOK – 737102
2016

2
Date:
Declaration
I declare that the thesis entitled “Child Health Care System in North East India
with Special Reference to Sikkim’’ submitted to Department of Economics, Sikkim
University for the degree of Master of Philosophy. The research work brings to the light
the results of an original investigation made by me and it is authentic in nature. The thesis
is work of my own and has not been submitted for any other degree of this University or
any other University.
Sumitra Gurung
Roll Number: 15MPEC04
Registration Number: 10SU2144
We recommend this thesis to be placed before the examiners for evaluations.
(Dr. Komal Singha) (Dr. Ruma Kundu)
Head, Department of Economics Supervisor
Sikkim University Department of Economics
Sikkim University

3
Date:
Certificate
This is to certify that the thesis entitled “Child Heath Care System in North
East India with Special Reference to Sikkim’’ submitted to Department of Economics,
Sikkim University in partial fulfillment of the requirements for the degree of Master of
Philosophy in Economics, embodies the result of bona fide research work carried out by
Miss Sumitra Gurung under my guidance and supervision. She has fulfilled the
requirements relating to the nature, period of research and presentation of seminar talk
etc.
It is also being certified that the research work brings to the light the result of an
original investigation made by Ms. Sumitra Gurung and no part of the thesis has been
submitted for any degree, diploma, associate-ship and fellowship.
(Dr. Ruma Kundu)
Supervisor
Department of Economics
Sikkim University
6th Mile, Samdur, Tadong
Gangtok, Sikkim - 737102

4
Plagiarism Check Certificate
This is to certify that plagiarism check has been carried out for the following M.Phil
Dissertation with the help of Urkund Software and the result is within the permissible
limit decided by the University
“Child Health Care System in North East India
with Special Reference to Sikkim’’
Submitted by Miss Sumitra Gurung under the supervision of Dr. Ruma Kundu of the
Department of Economics, School of Social Science, Sikkim University,
Gangtok – 737102, India.
Signature of the Candidate
Countersigned by the Supervisor

5
Acknowledgements
This Dissertation would not be completed without taking the help from many
people, so, it’s a great pleasure to acknowledge and thanks all the people. First of all, I
would like to extend my special gratitude to my supervisor, Dr. Ruma Kundu, Assistant
Professor, Department of Economics, Sikkim University, who had guided me like a
parents and inspired me to make a capable and responsible person. Although my words
would be limited to acknowledging her for her enormous dedication, valuable and
precious time towards my work and this work would not been completed without her
constant and sincere guidance. Thank you for your patient and support, I would also like
to thank all the professors from the Department of Economics, Sikkim University who
had given me a wonderful opportunity and also imparted their valuable time, knowledge,
and skill to fulfill my dissertation.
No research is possible without the library, the source of learning resources. I take this
time to express my gratitude to all the library staff members of Sikkim University for
their services.
I would like to thank to Dr. Indraneel Mandal., Assistant Professor (OMDS), Asia Pacific
Institute of management, New Delhi, who has given his valuable time and dedication,
providing knowledge in writing, editing and valuable guidance throughout my
dissertation. I would also like to express my thanks to Dr. Srikant Kundu., Assistant
Professor, centre for Development studies, Trivandrum, Kerala, India, who has given his
precious and valuable time, enormous dedication, helping in the data processing and
analysing section throughout my Dissertation, and also to Dr. N. Mollah., Assistance

6
professor of Vinayaka Mission Sikkim University (VMSU) for his endless support and
help.
I express my deep gratitude to the Department of Health and Family Welfare (HFW),
Government of Sikkim and all the staff members of Rangpo, Rhenock, and Rongli
Healthcare institutions as well as the Panchayat and working staff members of Rangpo
Nagar Panchayat who had provided me much required information over the period. And
special thanks to all the respondents and key informants for their time and valuable
information.
And finally but most importantly, my greatest deal of credit goes to the people who help
and encourage me throughout my work my Aunt Mrs. Anju Chettri and my friend
Mr. Avtar Chettri. Last but not the least my heartfelt thanks always go to my family
members for their help, immense support, love and inspiration, Therefore, I will not miss
this chance to extend my gratitude towards my parents and I want to dedicate my thesis to
them, and finally remembering the blessings of God.
Date: - Sumitra Gurung
Place: Gangtok
7
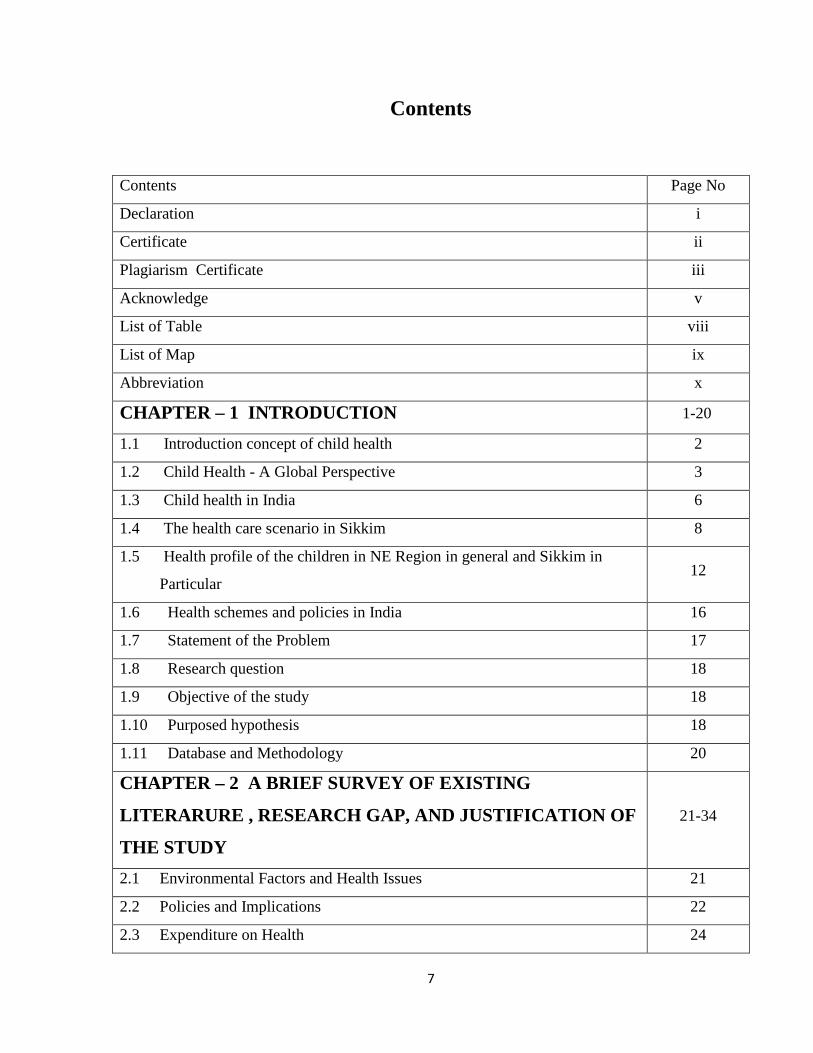
Contents
Contents Page No
Declaration i
Certificate ii
Plagiarism Certificate iii
Acknowledge v
List of Table viii
List of Map ix
Abbreviation x
CHAPTER – 1 INTRODUCTION 1-20
1.1 Introduction concept of child health 2
1.2 Child Health - A Global Perspective 3
1.3 Child health in India 6
1.4 The health care scenario in Sikkim 8
1.5 Health profile of the children in NE Region in general and Sikkim in
Particular 12
1.6 Health schemes and policies in India 16
1.7 Statement of the Problem 17
1.8 Research question 18
1.9 Objective of the study 18
1.10 Purposed hypothesis 18
1.11 Database and Methodology 20
CHAPTER – 2 A BRIEF SURVEY OF EXISTING
LITERARURE , RESEARCH GAP, AND JUSTIFICATION OF
THE STUDY
21-34
2.1 Environmental Factors and Health Issues 21
2.2 Policies and Implications 22
2.3 Expenditure on Health 24

8
2.4 Socio-Economic Factors 27
2.5 Constraints in attaining a good health 29
2.6 Health and Productivity 32
2.7 Research gap and justification for the study 33
2.8 Plan of the work 34
CHAPTER – 3 DATABASE AND METHODOLOGY 35-41
3.1 Data Source 35
3.2 Sampling Design 36
3.3 Location of the study area 37
3.4 Tools for analysis 41
CHAPTER – 4 RESULT AND DISCUSION 42-68
4.1 Status of child population in NE and in India 42
4.2 Status of full immunisation coverage 46
4.3 Number of diseases infected in child across NE and India 47
4.4 Status of vitamin A supplement for children in NE 48
4.5 Status of health care Infrastructure in NE and India 50
4.6 Status of women education level in NE Region 52
4.7 Description of variables 53
4.8 Descriptive statistics of variables in terms of frequency, percentage
frequency and cumulative frequency 58
4.9 Descriptive statistics of the socio-economic variables by using bivariate
frequency distribution 64
4.10 Result and analysis of probability of child immunization in Sikkim by
multinomial logit 68
CHAPTER – 5 CONCLUDING OBSERVATION AND
POLICY FINDNG 69-72
5.1 Conclusion 70
5.2 Policy and Prescriptions 72
BIBLIOGRAPHY 79

9
APPENDICE
Appendix A: Questionnaires 85
LIST OF TABLE
Figure No. Title of the tale Page No.
1.1 Immunisation schedule 6
1.2 Child population in India 6
1.3 State wise health centers in NE Region 8
1.4 District wise number of health centers in Sikkim 12
4.1 Percentage change in (0-14) years of population of Sikkim 42
4.2 State wise growth rate (0-14) age group population of NE Region 43
4.3 Descriptive statistics of full immunisation coverage of NE states and
India from (1992-2006) 44
4.4 Number of children per 100,000 household suffering from Diheorries,
Tuberculosis, Jaundice, and Malaria by NE and India 45
4.5 Vitamins A supplementation for children age 6-35 months in NE (1998-
2006) 46
4.6 Compound annual growth rate in health infrastructure in NER (2004-
2006) 48
4.7 Variables Descriptions 53
4.8 Descriptive statistics analysis of Immunization coverage 54
4.9 Descriptive statistics analysis of sex of the child 54
4.10 Descriptive statistics analysis of birth order of child 54
4.11 Descriptive statistics analysis of standard of living 55
4.12 Descriptive statistics analysis of cast 55
4.13 Descriptive statistics analysis of Religion 55
4.14 Descriptive statistics analysis of exposure to mass media 56
4.15 Descriptive statistics analysis of mother’s working status 56
4.16 Descriptive statistics analysis of location 56
4.17 Descriptive statistics analysis of avability of health card 56

10
4.18 Bivariate frequency distribution analysis of immunisation and birth order
of Child 58
4.19 Bivariate frequency distribution analysis of immunisation and Standard
of Living 59
4.20 Bivariate frequency distribution analysis of immunisation and cast 59
4.21 Bivariate frequency distribution analysis of immunisation and Religion 60
4.22 Bivariate frequency distribution analysis of immunisation and mother’s
working status 61
4.23 Bivariate frequency distribution analysis of immunisation and avability
of health card 61
4.24 Bivariate frequency distribution analysis of immunisation and sex of the
Child 62
4.25 Bivariate frequency distribution analysis of immunisation and location 63
4.26 Bivariate frequency distribution analysis of immunisation and exposure
to mass media 63
4.27 Regression analysis of Child Immunization in Sikkim by multinomial
logit model 65
LIST OF MAP Page No.
3.2 Maps of Sikkim 54
LIST OF FIGURE
Figure No. Title of the figure Page No.
3.1 Multi-stage sampling 53
4.1 Trend in full immunisation coverage 49
4.2 Sources of childhood vaccination by residence 50
4.3 Percentage distribution of education level (15-49) age grouped women’s 51
4.4 Trend in women exposure to mass media (1998-2006) 52
11
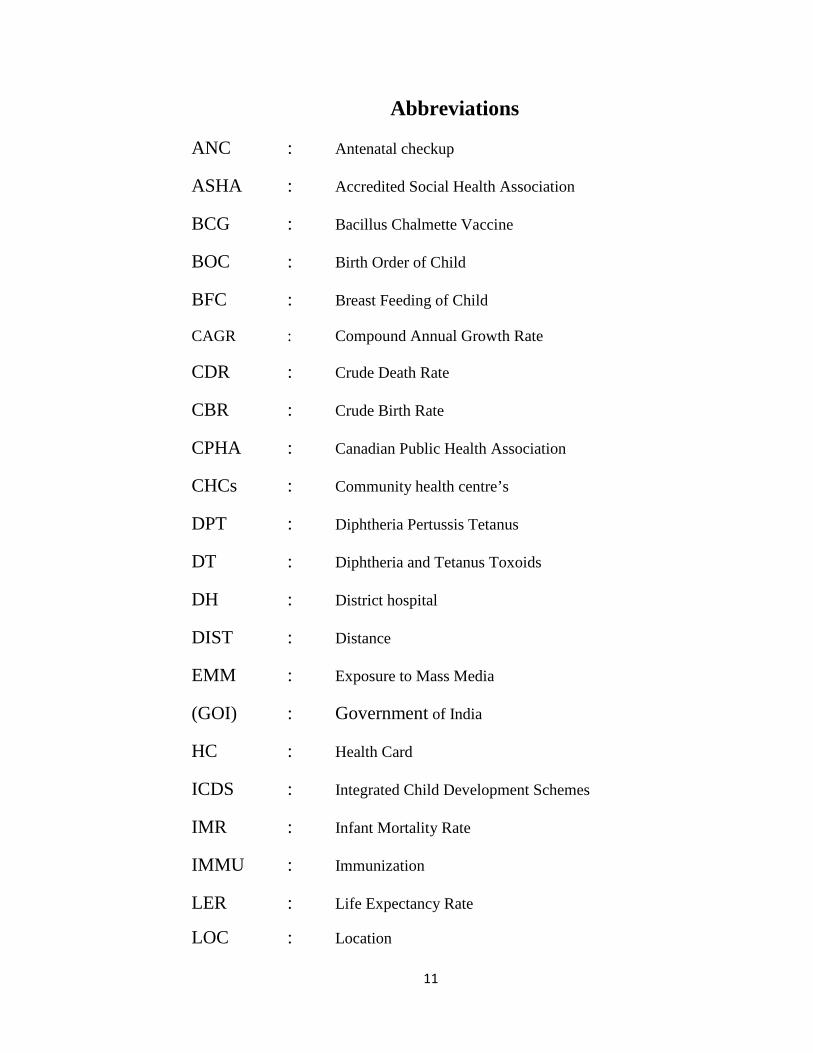
Abbreviations
ANC : Antenatal checkup
ASHA : Accredited Social Health Association
BCG : Bacillus Chalmette Vaccine
BOC : Birth Order of Child
BFC : Breast Feeding of Child
CAGR : Compound Annual Growth Rate
CDR : Crude Death Rate
CBR : Crude Birth Rate
CPHA : Canadian Public Health Association
CHCs : Community health centre’s
DPT : Diphtheria Pertussis Tetanus
DT : Diphtheria and Tetanus Toxoids
DH : District hospital
DIST : Distance
EMM : Exposure to Mass Media
(GOI) : Government of India
HC : Health Card
ICDS : Integrated Child Development Schemes
IMR : Infant Mortality Rate
IMMU : Immunization
LER : Life Expectancy Rate
LOC : Location

12
MMR : Maternal Mortality Rate
MA : Mother Age
ME : Mother Education
MWS : Mother Working Status
MEH : Monthly Expenditure on Health
NER : North Eastern Region
NFHS : National Family Health Survey
NDDCP : National Diarrhoeal Disease Control Programme
NNMB : National Nutrition Monitoring Bureau
OPV : Oral Polio Vaccine
PHCs : Primary health centre’s
PCI : Per Capita Income
RCH : Reproductive and Child Health
RNA : Number of room available
REL : Religion
STNM : Sir Tashi Namgyal Memorial Hospital
SC : Sub centers
TT : Tetanus Toxoid
TFM : Total Family Member
TWM : Total Working Member
WOC : Weight of Child
WIC : Woman, Infant and Child

13
Chapter - 1
Introduction
1.1. Introduction
The term child health refers the physical, mental, emotional, spiritual, and social
well being of the children. Since the Alma Ata declaration in 1978, health organisations
all over the world have been more vigilant and have been diligently working towards
attaining a good health for all. As child health is most endangered, especially among the
poorer sections of society in the developing countries, the bulk of such attempts are
directed towards children.
Concept of Child Health
The concept of child health is viewed differently by different authors. In order to
develop a universally acceptable definition, the two components in child health viz.,
“child’’ and “health” need to be discussed separately.
The Webster’s dictionary of English language, (1997) states that the word child refers to
“A son or daughter specially of an age of either infancy or youth". But they have not
mentioned the age of either infancy or youth, according to Robinson and Walgreen,
(1997) the span of childhood has been measured by them as the period from “birth to 12
years of age’’. In a meaning given by Nancy in (1983), the concept for the child is given
as the duration “from the day of birth to the 14th birthday’’. Similarly Marlow, (1994) and
Susan K. Samuel (1996) stated that the Childhood period is from birth to the
preadolescent stage and that the preadolescent age may exist anywhere between 11 to 13
years.
Coming to the term “Health’’, it is derived from the old English word “hoelth”, which
means a state of being sound and generally assumes a soundness of the body . According
to Stafen (1966), health is an absence of sickness both physically and mentally. Health is
viewed differently by different Researchers or authors all over the world.

14
According to the World Health organisation WHO in (1948) “Child health” is defined as
a state of complete physical, mental, intellectual, social and emotional well-being and not
merely the absence of disease or infirmity”.1 (Health Workgroup, First Things First,
October 2007). Healthy children live in families, environments and communities that
provide them with the opportunity to reach their fullest development potential. Keeping
this approach in mind the health of a child needs to be considered in a broader
perspective. So the evaluation of the healthcare status of the child requires special
attention. As the First Five Year Plan in India stated, “Health is a positive state of well
being in which harmonious development of mental and physical capacities of the
individual lead to the enjoyment of a rich and full life”2. It shows that lack of health
whether physical, mental or emotional is a bad sign for the nation while also being
harmful for the children. Poor health condition also deprives children from school
attendance. Thus the quality of children life depends on the implementation of the child
development scheme as well as proper dissemination of information to the parents in
different regions. Child health and its consequent issues are increasing in importance in
the developing countries but it is also a fact that the protection of child health and
prevention of diseases has been implemented very poorly. Thus good health is a
combination of physical, mental and social well-being of the nation. The expert
committee of the Indian Council for Medical Research (ICMR) and the Indian Council
for Social Science Research (ICSSR) referred to this fact in their report “Health for all by
2000 A.D.” In a wider sense, health is defined in terms of adaptation to change in nature
and society. Health plays a very important role in human life as it determines the well
being of the family as well as the nation.
Health and human capital also play a vital role in economic growth because economic
development is the process of raising the output level of an economy which is totally
depends on the physical and human capital. Physical capital is assigned a crucial
importance in economic growth whereas human capital is considered to be a long term
factor of production. Human physical capabilities have received the significant attention
in the recent times as a means of enriching intangible capital. Thus the improvement of 1 World health organization in (1948.) 2 First five year plan (1951-56).

15
health status has a major role in the enhancement of human capabilities (Sen 1987). In
economic terms human resource development can be described as accumulation of
human capital and its effectiveness towards the growth of the economy. It has been truly
considered that health is not everything, but everything else is nothing without health.
With the advancement in the field of knowledge and technology during the 21st century
medicine as a field has become more complex, while the treatment has become
correspondingly more costly. However the benefits or uses of modern medicine have not
yet spread uniformly, creating a gap between rural and urban areas, and between rich and
poor. Hence based on ideas given by many researchers on child health it may be
concluded that an absence of any disease or infirmity connected with physical, mental,
spiritual, and social well being can be regarded as health and that the individual struggle
for its protection and renovation.
After considering the studies on child and health separately, it is time to understand the
concept of child health. Kher (1972) has explained the concept of child health as “total
health of the child from infant to preadolescent period’’. Similarly Park (1995) was of the
opinion that child health is the “promotive, preventive, curative and rehabilitative care for
children’’. Thus according to the experts, child health in conclusion regarded as the
physical, emotional, spiritual, mental and social well-being, achieved through promotive,
curative, and rehabilitative care for the children from birth to the 13th year of life.
1.2. Child Health - A Global Perspective
Public effort for child health was introduced in the early seventeen century. Since
then, the American and European societies have placed greater focus on child health
(Friedlander, 1988). The World Health Organisation and the UNICEF have played a very
important role in promoting good health for all children.
The health sector in India has been neglected. Since Independence only 0.04% of GDP
has been invested in the health sector. In the Eleventh Five Year Plan (2007-2012) only
65% i.e. 75, 533 crores out of the total budgeted expenditure of 1, 23, 9001 crores has

16
been spent on the health sector. It shows the failure of the Government to utilise the fund
in an efficient manner for the proper development of the health sector.
However, even after six decades of planned development in India, the status of its
healthcare sector is quite unsatisfactory. Although India has achieved unparalleled
economic growth in the post-reforms decades (Saikia 2012), it has performed poorly in
terms of health sector development (Baru et.al. 2010). India has been lagging behind
other developing countries like China, Sri Lanka and Bangladesh in terms of the state of
healthcare infrastructure as well as many health indicators like life expectancy at birth,
infant mortality and under five mortality rates etc. (Government of India 2005). As per
the National Health Policy (2002) only 24 per cent villages in India have healthcare
facilities as against 88 per cent towns and only 34 per cent medical professionals are in
rural areas as against 66 percent in urban areas. Bhandari and Dutta (2007) observe that
while about 70 percent of India’s population live in rural areas, only 20 percent of
hospital beds are located in rural areas.
Improvement in health indicators is influenced by the following factors: (a) medical
involvement on health (b) health promoting factors like water, sanitation and hygiene (c)
social and economic factors. Most of the analysis shows that the second and third factors
have a greater impact on health.
1.3.Child Health in India
The present study has chosen the states of the region to gain a deeper
understanding of issues related to the child health. Child health status can be determined
by looking at the rates of morbidity and mortality of the children. It can also be
understood by looking at the coverage of immunisation, nutritional status and the
healthcare infrastructure facility. In 1977 India started a major health program which was
changed into a family welfare programme with maternal and child health becoming a
fundamental part of the family planning programme, with the vision of reduction in birth
rate which has a direct relationship with reduction in infant and child mortality. Similarly
India has started a diarrhoea disease control programme in 1978. The Universal

17
Immunisation program (UIP) was taken up in 1986 and it was started in all districts of the
country during 1989-90. UIP become a part of the Child Survival and Safe Motherhood
(CSSM) Programme in 1992 and Reproductive and Child Health (RCH) Programme in
1997. Bose (1998) reported that the Madras was the first state to set up maternal and
child clinics in 1931.By the year 1938, there were 800 maternal and child welfare clinics
functioning in India, providing services for pregnant mothers and children.
Child healthcare in pre independence period in India has to give a more attention with the
recognition of international children care by the Government of India, placing a more
emphasis on the need for children to grow healthy (paul, 1995). In 1943 the Government
of India organised a committee under the chairmanship of Bhore, which gives a more
attention to both mother as well as children to protect them from vulnerable disease
because of that causes the morbidity and mortality rates are high among this groups
(chalkley, 1987). Since independence the health services, organisation, infrastructure and
programme related with child health have been extensively changed in the first two
decades through the contribution of various committees like the Modaliar committee
(1962), the Jalianwala committee (1967), and the Srivastava committee (1975) etc.
similarly A National Health Policy has been introduced by the Government of India in
1983, with the objective of attaining the goal of “Health for All by 2000 AD’’ by
providing an effective and efficient healthcare system for all individuals throughout the
nation, specially the vulnerable groups like women, children and the under privileged.
Child health and its consequent issues are increasing in importance in the developing
countries but the protection and prevention has been implemented very poorly. As the
First Five Year Plan in India stated, “Health is a positive state of well being in which
harmonious development of mental and physical capacities of the individual lead to the
enjoyment of a rich and full life”3. It suggests that lack of health whether physical,
mental or emotional is a bad sign for the nation while also being harmful for the children.
Poor health condition also deprives them from school attendance. Thus the quality of
children’s life depends on the implementation of the child development scheme as well as
proper dissemination of information to parents in different regions.
3 First five year plan (1951-56).

18
As per the National Health Policy 2002 only 24 per cent villages in India have healthcare
facilities as against 88 per cent of the towns. Only 34 per cent of the medical
professionals are in rural areas as against 66 percent in urban areas. Bhandari and Dutta
(2007) observe that while about 70 percent of India’s population live in rural areas, only
20 percent of hospital beds are located in rural areas.
In the demographic context children in India account for (378.2) million and (37.7%) of
the total population as per the National Family Health Survey (2005 to 2006). There is a
decline trend in child population from 1971 viz. 42% to 39.6 % in 1981 and to 36 % in
1991. But during the last few decades i.e. 2000 show a minor improvement in child
population, even though there is a decline in overall percentage of the child population.
Table 1.1 Child Population in India
Year Children (in millions) Percentage of total population
1971 230.2 42.00
1981 270.9 39.60
1991 297.7 36.00
2001 378.2 36.76
2011 372.4 30.7
Source: National Family Health Survey, 2005-2006.
The above table shows that children of India in numbering 378.2 million account for 36
% of the total population as per the National Family Health Survey, (2000-2001). This
represents a moderate increase in total population. Even though there is decline in overall
child population from the previous year we can see from table 1.1 the child population is
constantly growing in terms of sheer numbers. The child population is 230.2 million in
1971 grew to 270.9 million by 1981. It further increased to 297 million in 1991and to 378
million in 2000 respectively. However there was a fall in child population to 158 million
in 2011.

19
Table 1.2. Number of Health Centers in NER (Census 2011)
Source: Rural health statistics in India (2011).
As per the 2011 census, the total population of the north-east region accounted for 3.1
percent of the population of India while the population of children aged less than six
years was reported to be 2.8 percent out of this population. Using the figures of Census
2001 the decline was sharper for female children compared to male children in the age
group of 0-6 years. According to NFHS-3 states like Sikkim, Mizoram and Manipur
have the lowest proportion of underweight children i.e. 20-22% as compared to other
north-east states, and are ahead of states like Kerala, Punjab and Goa. Meghalaya reveals
a very high proportion of underweight children comparable to states in east or central
India. On the other hand, Arunachal Pradesh, Assam and Tripura has a 30-40% of the
children are underweight. It also reveal that in the north-east region, more children in the
U-5 group are suffering from chronic malnutrition (36-55%), than from acute
malnutrition (9-31%).This means that child malnutrition among the U-5 age group in the
north-east region pertains more to stunting (short for their age) than wasting (thin for
their height).Therefore the above picture reveals that the condition of child health is not
in a good position throughout the north-east region. In total there are 7402 sub-centers,
States PHC CHCs Sub-centers
Arunachal Pradesh 97 48 286
Assam 938 108 4604
Manipur 80 16 420
Meghalaya 109 29 405
Mizoram 57 9 370
Nagaland 126 21 396
Sikkim 24 2 146
Tripura 79 11 632
India 148129 23887 4809

20
991 primary health centers, 178 community health centers and 615 allopathic hospitals in
the north-east excluding Sikkim.
1.4. The health care scenario in Sikkim
Sikkim is one of the most beautiful and peaceful states in India. It is a small,
remote, mountainous and landlocked state and lies in the North-Eastern region of India
with an area of about 7,096 square kilometers. It lies in the eastern Himalayas at an
altitude 300 meters to more than 8000 meters. The average maximum temperature is 28
degree C and minimum 13 degree C in summer while in winter it is 18 to 5 degree C.
Sikkim is the 22nd state of India; it merged with the Indian union in 16th may, 1975. There
is only one major government hospital at Gangtok viz. the Sir Tashi Namgyal Memorial
hospital (STNM) established in 1917 with 50 beds and 3 doctors. There has been
significant progress in health standards over the last 15 years.
Sikkim comprises of four districts viz. North, East, West and South. It has a total
population of 607,688 as per the (census 2011), It has a total of 9 sub-divisions, 176
gram Panchayat units, 31 administrative block centers, 986 Panchayat wards and 7
municipal corporations/nagar Panchayat consisting of 47 municipality wards/nagar
Panchayat. Sikkim did relatively well in achieving most of the national norms set under
the “Health for all by 2000” scheme of the central Government after it signed the Alma
Ata Declaration in 1978, as the results of improved healthcare are partially shown by the
birth and death rates in the state. Sikkim stood in a good position with regard to death and
birth rates as compared to the other north eastern regions. By 2003 the birth rate had gone
down by 21.9 % as against 24.8% nationally while the death rate had also gone down by
5.0 % against the national value of 8.0%. The state level hospital is located at Gangtok in
East district of the state. There are 24 primary health centers (PHCs) in the state. The East
district comprises of 8 primary health centers (PHCs) as it has the highest population,
followed by the West district with 7 PHCs, South with 6 and North with 3 PHCs; there
are also 147 primary health sub-centers out of which 33% are located in the East district,
28% in West, 27% in South and 13% in North, respectively.

21
The East district has higher pressure of in terms of handling population per health facility
as compared to the other districts. Districts hospitals and PHCs of the East district cover
2.45 lakh population followed by South, West and North with 1.31 lakh, 1.23 lakh and
0.41 lakh respectively. Because of the overcrowding effect of population in the East
district people are unable to get proper medical facilities, especially in the rural areas.
According to the Labor Bureau Report on Employment and Unemployment Survey
(2013-14), Sikkim has the highest unemployment rate (more than 15 percent) among the
Indian states. It indicates that Sikkim has not been able to escape from the vicious cycle
of poverty and malnutrition. Unemployment indicates the high level of the poverty line
and or no income generation. This situation leads to the upholding of causes of child
health because of the sustained increase in poverty rate.
Table 1.3. District wise No. of health institution in Sikkim (census2011)
Districts DH Sub
Divisional
Hosp.
CHC PHC SC
East Sikkim 1 0 1 6 48
West Sikkim 1 0 0 7 41
North Sikkim 1 0 0 5 19
South Sikkim 1 0 1 6 39
Source: Health & Family Welfare Department, Govt. of Sikkim.
Note: District hospital (DH), Sub-Divisional hospital (SDH), Community health centre
There have been many studies on health but the present study focuses on a micro level
effort whose primary objective is the provision the minimum public healthcare facilities
in rural areas. Primary healthcare infrastructure developments in rural area basically
consist of a three tier system viz., sub-centers, primary health centers, and community
health centers.

22
1.5. Health Profile of the children in North-East region in general and
Sikkim in particular
The health profile of the child depends on especial health care services whether in
north - east region or in Sikkim, health status of the children largely dependent on the
status of the mother, socio-economic status, education, awareness level, health practices
during pregnancy, periodical immunisation of the child, fertility records, antenatal care
etc. The present study is based on the relevant information will be collected from the
parents (especially mother) of the child with the help of structured questionnaire designed
for the purpose. Some of the studies on health status of mother contributed by the Rao,
et.al, and ministry of health and family welfare in (1995) show that age, family size, as
well as type of family, relation with family, etc will have an effect on the mother’s health
status.
Antenatal care
Antenatal care refers to the care given to the pregnant women so that they have a
safe pregnancy and healthy baby. Pregnancy is a normal physiological process associated
with certain risks to the health of the mother and the infant she bears. These risks can be
overcome through proper antenatal care. Data for the 1990s and 2000-2001 shows that
just over 70 % of women through the world have at least one antenatal care visit with a
skilled provider during pregnancy. In the industrialised countries, coverage is extremely
high with 98% of women having at least one visit whereas in developing world antenatal
care use is around 68%. This indicates considerable success for programme aimed at
making antenatal care available.
Antenatal care (ANC) strategies are intended for pregnant women in order to screen and
detect early signs of risk factors for diseases followed by timely intervention, originally
with the aspiration of reducing maternal and prenatal mortality and morbidity. The
acknowledged benefit of antenatal care to the baby in terms of growth, risk of infection,
and survival however, remains the justification of the benefits to the mother has now
shifted to emphasizing the promotion of health and health-seeking behavior, including
birth preparedness.

23
Disease and disorder during pregnancy
Organisms causing diphtheria, influenza, typhoid, tetanus, and chicken pox can
pass on the infection to the foetus. This is critical in determining the degree of effects on
the development of the foetus. Therefore, before the women conceive she should have
been immunised against measles. The pregnant mother should be immunised against
tetanus also as this is a major cause of mortality among mothers and infants.
Another disorder that can occur during pregnancy is toxemia. In its mild from it is
characterised by high blood pressure, rapid and excessive weight gain and retention of
fluid in the tissues. If the condition is controlled at this stage there is no danger to the
fetus. If it continues to progress, it can led to convulsion and even coma which can cause
death of the mother and the fetus. If the baby is born, her development in all areas will be
seriously affected.
Nutrition
The mother’s body is also undergoing changes during pregnancy and she needs
extra calories, protein, vitamins, and minerals. Hence the expectant mother needs more
food. Certain minerals and vitamins are required in greater quantities as compared to
others. These include calcium, iron and B-complex vitamins. The quality of the diet is as
important as its quantity. To ensure that the mother gets a nutritive diet, care should be
taken to include fruits, green vegetables, pulses, milk and its products. Mothers who have
a good diet pregnancy during enjoy better health and fewer disorders. If the mother is
healthy, the chances of delivering a premature baby are low. Children born of mothers
who have a good diet have a better health, a higher resistance to infection and fewer
chances of contracting of colds, pneumonia and tetanus. Mother who has a poor diet may
have infants with low birth weight. This can have adverse effects on the child’s physical
and mental development.

24
Benefit of breast feeding
Breast milk contains antibodies and others substances that help babies fight off
infections. The iron in breast milk is present in a form that is a very easy for babies to
absorb. Certain chemicals in breast milk may be important for optimal brain development
of an infant. A number of scientific studies have shown that on the whole, breastfed
babies are a little smarter than formula-fed ones. It may be that breast milk itself
improves brain development, or it may be that the women who choose to breast feed are
smarter on an average, so that the effect passes on to their babies.
Immunisation
The vaccine helps to stimulate the body’s immune system of the child to make
antibodies against viruses and bacteria. Normally, after a person fights off an infection,
the immune system remembers and is better able to defeat that infection. Vaccines create
the same beneficial responses without the illness.
Currently most of the children in the world are vaccinated against different diseases by
age two. They should have protection against the following types of infection:
(i). Diphtheria, in which a thick covering forms in the throat, leading to severe
breathing problems.
(ii). Tetanus, in which muscles involuntarily tighten, so that breathing becomes difficult
or impossible.
(iii). Measles, which includes not only an uncomfortable rash, but also high fever and
brain infection.
(vi). Mumps, which can include fever, headaches, deafness, swollen glands and painful
swelling.
(v). Polio, which can cause paralysis.

25
(vi). Hepatitis B, an infection of the liver that can result in chronic liver damage and
ultimately liver cancer.Thus vaccination protects children from those diseases which have
a negative impact on the child development process.
Table 1.4. National Immunisation Schedule for Children
Note: Bacillus calmette vaccine (BCG), oral polio vaccine (OPV), Diphtheria pertussis tetanus (DPT), Tetanus Toxoid (TT); Source: Ministry of health and family welfare (Government of India)
Table (1.4) shows the details of the vaccines that given to the infant from the time it was
in its mother’s womb to till childhood. The vaccine must be given at the right age, right
NAME OF VACCINE
WHEN TO GIVE DOSE ROUTE SITE
FOR PREGNANT WOMEN
TT-1 or Booster
Early in pregnancy 0.5ml intramuscular Upper arm
TT-2 4 weeks after TT-1 0.5ml intramuscular Upper arm FOR INFANTS BCG At birth or any time up to 1 year 1.1ml-0.05ml
(up-to 1months) Intra-dermal Left upper
arm OPV-O At birth if delivery is in institution, but
can be given up-to 2 weeks 2 drops Oral Oral
OPV-1,2 and 3
At 6, 10 and 14 weeks but can be given up-to 5 years
2 drops Oral Oral
DPT-1, 2 and 3
At 6,10 and 14 weeks but can be given up-to 2 years
0.5ml Intramuscular Mid-outer thigh
Measles (9-12 months ) should be given up- to 5 years
0.5ml Subcutaneous Right upper arm
Vitamin- A At 9 months with measles 1ml Oral Oral
FOR CHILDREN DPT – Booster
16-24 months 0.5ml I/M Mid- outer thigh
OPV – Booster
16-24 months 2 drops Oral Oral
Vitamin – A 16 months with DPT/OPV Booster, 24-30 and months (minimum interval between two dose in 6 months
2ml Oral Oral
DT 5 years 0.5ml Intramuscular Upper arm
TT 10 and 16 years 0.5ml Intramuscular Upper arm

26
dose, right interval and the full course must be completed to ensure the best possible
protection to the child against disease.
1.6. Health Schemes and Policies in India
Several plans and policies have been adopted by Government of India since
independence to strengthen the health care system in the country. Health planning in
India is a fundamental part of nationwide socio-economic planning. Health planning in
India has been formulated by a number of committees. These committees are appointed
by Government of India to assess the accessible healthcare situation and to advance
towards Health For All (1977), National Rural Health Mission (2005), accredited social
health activity (ASHA), integrated child development scheme and Anganwadi workers
(1975), Janine Suruksha Yojana (2005), Janani Shishu Suraksha Karyakaram (2011), and
Indradhanush immunization programme (2014).These are the schemes and policies that
have been implemented by the Government of India so far for achieving the good health
for child.
(i) Janani Suraksha Yojana
It is a National programme of health introduced by the Government of India
during 12th April 2005 by the Prime Minister of India. It is a nation-wide scheme whose
objective is to enhance the enrollment for institutional delivery especially among the poor
pregnant women and to reduce the maternal and neo-natal mortality rate. The thrust of
the JSY progrmme is to enlarge the institutional delivery as this single factor may also
promote the various other behaviors as well, like delivery by a skilled birth attendant,
timely referral in good institutions in case of any complications, early breastfeeding,
postnatal care within 7 days of delivery, exclusive breastfeeding and the adoption of
postpartum contraception etc.
Since the adoption of the 2005 policy, there has been sequential improvement in health
care facilities in all over the country. Now the share of institutional delivery at public
facilities increased from 37% to 63% in 1998 to 2009. Under the JSY schemes the

27
pregnant women will also get an incentive payment of Rs 1400 for institutional delivery
and Rs 600 for a home delivery conducted by skilled birth attendant.4
(ii) Janani Shishu Suraksha Karyakaram
Janani Shishu Suraksha Karyakaram is a centrally sponsored scheme of the
ministry of health and family welfare, Government of India for ensuring the development
of child health throughout India. The JSSK was launched in 1st June 2011 with the basic
developmental objectives of universalising access to and improving the quality of health
care services in the countries for all the children and mothers. In other words, the JSSK
aims at providing a primary level good quality accessible and affordable health services
for both child and mother.5
Specifically, the JSSK aims at providing free delivery services to each and every
pregnant woman who belongs to below poverty line groups by promoting institutional
delivery among the pregnant women. After implementing the programme the ratio of
women as well as infant death has been reduced significantly.
(iii) Integrated Child Development Programme (ICDS) 1975
The national programme of nutritional support to child, commonly known as
integrated child development programme (ICDS) is a comprehensive and integrated
flagship programmed of the Government of India (GoI), launched in 1975. In accordance
with the National Policy for children in India, ICDS aims at providing a effective health
services to the children especially in main concern areas such as hill tracks, tribal
communities, backward rural areas, and urban slums. As per the surveillance of UNICEF
(1989) ICDS aims at improving the child’s health physically, mentally, socially and
spiritually for achieving an appreciable improvement in health and wellbeing of mother
and children under 6 by providing health and nutrition education, health services,
supplementary food and pre-school education etc. Since independence, many attempts
were made for the evolution of integrated maternal and child health services. The ICDS
development programme is one of the largest development programmes in the world, it
4 Wikipedia, 26 july:Janani Suraksha Yojana. 5 Wikipedia, 26 July: Janani Shishu Suraksha Karyakaram.

28
covers more than 34 million children in the age group 0-6 years and 7 million pregnant
and lactating mother.
(iv) Accredited Social Health Activists (ASHA)
Accredited Social Health Activists is also referred to as community health
workers programme instituted by the Ministry of Health and Family Welfare (MoHFW),
Government of India. ASHA is also a part of National Rural Health Mission (NRHM)
which was started in 12th April 2005. One of the essential components of the National
Rural Health Mission is to provide every village / place in the countries with a trained
female community health activist. Since from the beginning of the days ASHA played a
effective role in almost all over the countries. Accredited social health activists act like a
frontline health workers because it links between the government and pregnant women in
the community. The key role of ASHA is to identify the pregnant women especially in
the rural communities and to facilitate at least three antenatal check-ups (ANC), motivate
them and their families to seek delivery care at health facility.
(v) National Rural Health Mission (NRHM) 2005
It is a programme of the Government of India enacted on 12th April 2005, which
described the modalities of free and compulsory mission to provide accessible, affordable
and quality health care to rural population, especially vulnerable and underserved
population groups in the country. The mission aims to achieve infant mortality rate (IMR)
of 30 per 1000 live births, maternal mortality 100 per 100 thousand live births and total
fertility rate of 2.1 by the year 2012.The mission attempt to get these goals through a set
of core strategies including enrichment in budgetary outlays for public health,
decentralized village and district level health planning and management etc.
(vi) Mission Indradhanush Immunisation Programme (2014)
Indradhanush immunisation programme is a universal immunisation programme
in India started by the ministry of health and family welfare (MOHFW) government of
India on 25th December 2014.Its a free of cost vaccine provided under the age group of 2
years children as well as pregnant women to prevent from the seven different vaccine

29
preventable diseases, full immunisation against the childhood preventable diseases is the
right of every child. The seven vaccine preventable diseases are as follows.
(i). Diphtheria
(ii). Pretussis
(iii). Tetanus
(iv). Tuberculosis
(v). Polio
(vi). Hepatitis B
(vii). Measles.
In this programme, there are four round phase of the mission i.e. first round, second
round, third round, and fourth round phase. Where the first round of the first phase was
started in 7th April, 2015, further second, third and fourth rounds phase were started in the
month of 7th December 2015 to 7th January 2016.In the first phase of mission, they had
found that across a 28 states, 201 district have a peak number of partially immunised and
unimmunised children identified by the government of India. Similarly, the second phase
of this programme also wants to achieve the full immunisation in 352 districts which
includes 279 mid priority, 33 district from the North East states and remaining 40 district
from the first phase to detected the missed out children. Thus the mission has
deliberately intended to achieve a goal of high quality routine of immunisation coverage
to strengthen the health care systems in our country and also that can be sustained over
the year. From the last few years, India’s coverage of full immunisation percentage has
goes up by 1 percent every year.

30
1.7. Statement of the Problem
After going through all the relevant reports and literature review it appears that
the healthcare system in Sikkim has not been able to cope up with the requirements of the
public healthcare system. One of the major challenges human beings face today is the
health issue. There is no doubt that health problems are increasing day by day. However
protection and prevention of diseases are being implemented very poorly. Rangpo seems
to be following this pattern. As per the 2011 census Sikkim has a population size of 6,
07,688 while the total population of Rangpo Nagar Panchayat is 10,450. It covers 5
wards with the total number of households being 2505. Rangpo is situated in East
Sikkim. It is the gateway to Sikkim. Though there has been a tremendous advancement in
the field of science and technology including health infrastructure, people lack access to
healthcare systems in the Rangpo rural area. A significant portion of the population
suffers from poor health condition in the rural areas around Rangpo due to lack of
suitable health infrastructure for a population of more than 10,000 (census 2011) with
only one primary health centre (PHC) to look after all the five wards. This is not
sufficient for the healthcare needs of the people. In the villages around Rangpo town, a
significant fraction of population has no access to proper healthcare facilities and hence
healthcare becomes a serious issue here. Other problems include lack of a hospital,
adequate health centers, and accessibility of health services to people, especially those
from rural areas. Improper health infrastructure has become an issue of disquiet for the
people. Though the political elite and the wealthy can afford high standard treatment in
better hospitals the poor people from the rural areas sometimes cannot survive due to lack
of proper healthcare facilities. The people of Rangpo have been facing problems like lack
of basic medical facilities, shortage of specialists, medical staff and equipment for many
years. The next nearest medical centre is at Singtam which is about 20 km from Rangpo
which poor people cannot afford to travel to and adds extra burden. Poor families
obviously cannot afford to go for treatment in private hospitals as the cost of treatment is
too high for them.

31
1.8. Research Question
The questions that the present study tries to address are:
1. To what extent can the changes in per capita income, parent’s education, working
status, poverty and socio-economic status affect health of the children in a
society?
2. What are the factors which extensively affect the childhood immunisation
coverage in East District of Sikkim?
1.9. Objectives of the Study
The study tries to explore the importance of the child health care system in North-
East India and also tries to analyse the problems associated with child healthcare in the
East District of Sikkim.
1. To understand the child health care system in North-East India.
2. To identify and estimate the impact of underlying factors associated with childhood
immunisation in East District of Sikkim.
1.10. Proposed Hypotheses
The following hypotheses will be considered for the present work.
1. The probability of achieving a good health for the child in North-East India is
significantly affected by various socio-economic factors as well as environmental factors.
2. Childhood immunisation in East District of Sikkim is impacted by underlying factors
associated with it.

32
1.11. Database and Methodology
Coverage and Data collection
The proposed study will be based on both primary and secondary data. The nature
of data will be both qualitative as well as quantitative. For the first objective, data will be
collected from secondary sources like primary health centers (PHCs), sub-center (SCs),
community health centers (CHCs), district hospitals, Ministry of Health and also from
National Family Health Survey (NFHS) etc. The present study will consider all eight
states in north-east India, i.e. Arunachal Pradesh, Assam, Manipur, Meghalaya, Mizoram,
Nagaland, Sikkim and Tripura.
Source of Date
Data for the study will be obtained from the three successive rounds of the
National Family Health Survey (NFHS) conducted during 1992-2006. The first round of
NFHS was conducted in 1992-93. The second round of NFHS was conducted in 1998-99
while the third round was conducted in 2005-06 respectively. Primary survey will be
carried out in different parts of East Sikkim where the respondents will be chosen on the
basis of purposive and convenience sampling. The present study consists of total 204
sample from three different sub-Division of East Sikkim (viz, Gangtok, Pakyoung,
Rongli). The relevant information will be collected from the parents of the child with the
help of structured questionnaire designed for the purpose. Thus the information shall
include individual characteristics such as age of the child, gender, mother’s education,
antenatal care (ANC) visit and availability of health card etc. Data on household
characteristics like size of the family, working status of the parents, distance from
hospitals, living standard, parent’s income, caste, religion etc will be collected.
Nature of Data
The present study will be consider the factors which is related to the child health
care in North-East India such as IMR, TFR, MMR, CBR, CDR, Percentage of fully and
Partially immunizes children, Neonatal mortality rate etc.

33
Data Analysis
The proposed methodological tools for the study will consist of using a
multinomial logit model for both primary and secondary data analysis.
The study will utilise the multinomial logit model for estimating the significant
determinants of child immunisation coverage and attaining a good health of the child.
Immunisation is considered in one of three observable states, namely, (i) no
immunisation, (ii) partial immunisation, and (iii) full immunisation.
The decision of parents to immunised children is described by the following model.
Yi= β X i + Ui ………………….. (i)
Where
Yi = 0: Hi < 0, I i < 0 (child neither immunized nor attended good health)
Yi = 1: Hi ≤ 0, I i ≤ 0 (child partially immunized and partially attended good health)
Yi = 2: Hi > 0, I i > 0 (child fully immunization and fully attended good health).
The proposed explanatory variables can be divided into three parts as follows:
a) Demographic characteristics such as age, gender, birth order, size at birth,
duration of breast feeding, age of mother and antenatal care (ANC) etc.
b) Household characteristics such as standard of living (low, medium, high), caste,
religion, education of the parent, employment status, income, family size,
exposure to mass media, etc.
c) Community characteristics like place of residence (rural, urban), distance from
hospitals, availability of doctors, and avability of Primary health centre (PHC).

34
Chapter - 2
Literature Review
As per the many of the researchers the status of child health care basically
depends on three categories of causes viz., environmental factors, demographic factors
and socio-economics factors. Environmental factors include drinking water, toilet
facilities, sanitation and locality or sorroundings. Demographic interrelated factores
includes sex of the child, parity, age of mothers, antenatal care (ANC) visit and health
cards etc. Socio-economic factors include mother’s education, place of residence,
religion, caste, standard of living, working status ofparents, mother’s exposure to mass
media, number of household rooms available etc.
2.1. Environmental Factors and Health Issues
This part of the study and literature review exhibit the environmental scenario
and its impacts on child health. Some of the environment related issues are highlighted by
Bradbury (2004) has worked on the issue of environmental effects on child health.
According to him, 6.4 percent of deaths among children under the age of 4 years occur
because of outdoor air pollution while the remaining 3.6 percent of deaths in the same
age group happen due to indoor air pollution. Indoor air pollution results from factors like
inadequate water and sanitation while outdoor air pollution is caused by motor vehicle
emissions, second hand smoke etc.
WHO and World Bank (2007) declared that high level of malnutrition is actually caused
by bad sanitation and diseases specially in young children. Although lack of food is one
important reason for malnutrition, in developing countries millions of childrens die
mostly from avoidable but chronic environmental diseases.
According to Sullivan and Elizabeth (2007), environment is a place where people can
exchange their ideas and views. They had carried out the studies on health and well-being
of the people directly linked to the environment i.e., (where they live, work and learn

35
etc). They have tried to say that if people live in a healthy environment they can learn to
do things properly. Therefore community behavior also has a great impact on the
development of child health. Bhattenheim (2008) shows how an unhealthy environment
is affecting the health condition of the rural people. According to him more than 60% of
children die due to improper sanitation facilities. Due to improper water and sanitation
facilities they may easily fall prey to different kinds of diseases like diarrhoea, variation
in height or weight etc. These kinds of problems are especially applicable to rural people
as they might not have proper toilets or after using these they do not follow the practice
of washing hands properly. So this kind of unhygienic practice will also have a harmful
effect on human life. Devchara et al (2007, 2008). According to them environmental
issues that affect child health include water, sanitation, hygene, indoor air pollution,
diseases like malaria etc. The top three indicators affecting the health of children very
badly in developing countries are water, sanitation, hygene, indoor air pollution.
2.2. Policies and Implications
This part mainly shows the policies and their importance in the maintenance of
good health of the child, Das and Dasgupta (2000) critically evaluate the immunisation
programme on the basis of demographic trends and child health. Immunisation of
children protects them against preventable diseases. It should be mandatory to have
timely vaccination at the age of 5 and the importance of the vaccination needs to be
imparted to the parents. Every year more than 46% of children are dying due to the low
birth weight and other child diseases which are caused by the lack of a proper programme
management system. It is also observed that child healthcare depends on the stability of
the government. Studies by Andrea & Senauer (2003) focus on the link between the
Women, Infant and Child (WIC) Program and the health of Preschool aged children in
USA. The WIC program provides foods with specific nutrients to pregnant and lactating
women, and to children up to the age of five, especially in low-income households. WIC
focuses on nutrients which have been found food deficient in the diet of the target
population, such as protein, calcium, iron, and vitamins A and C. The foods in the WIC
package also provide vitamins D and B-6 and folates. WIC gives more preference to
children who are at a nutritional risk or have certain health conditions.

36
Bredenkamp et. al. (2006) had tried to examine the effectiveness of the Integrated Child
Development programme in addressing the challenge of child under nutrition in India.
They found that although the ICDS programme appears to be well-designed and well-
placed to address the multidimensional causes of malnutrition in India, there are
numerous mismatches between what the ICDS programme proposed and its actual
implementation that prevent access to children suffering from under nutrition and also
that ICDS potential failed to cover the targeted group. ICDS gives more emphasis on the
provision of additional feeding and preschool education to children aged four to six years,
at the expenditure of other programs and components that are crucial for combating
persistent undernutrition, a failure to effectively reach children under three and,
ineffective targeting of the poorest states and those with the highest levels of under
nutrition which tend to have the lowest levels of programme funding and coverage.
According to Abhishek & Mohanty (2011) malnutrition among children is one of the
major public health concerns in developing countries, where it represents both a cause
and a manifestation of poverty. A child with insufficient nutrition in developing countries
is usually a consequence of poverty with its attributes of low family income, poor
education, poor environment and housing and inadequate access to food, safe water, and
healthcare.
2.3. Expenditure on Health
Ellis et al (2000) highlight the issues of poor quality of government health
expenditure. They state that expenditure on health in the public sector is very low as
compared to the private sector. Less expenditure in public health means less productivity,
which leads to fall in Gross Domestic Product (GDP), thus slowing down the
performance of the country. Thus we can say that health is wealth for the people.
Government policy on child health issues have been highlighted by Bhatia and Yesudian
(2001). According to them, the financing system of government was not efficient for
poorer sections of society. The government has introduced a programme called
Reproductive and Child Health Services in India which is tax financed and provided
through the supply side financing mechanism. In other words, the government runs these
schemes only for collecting revenue from people who do not have proper financing;

37
alternatively the existing schemes are unable to target the poor people with a lack of user
choice and the absence of linkages between the providers of payments and performance.
Hence there is a need for developing innovative financing mechanisms, which are able to
target scarce resources towards those who cannot afford to pay.
Studies by Srinivasan et al (2007) talked about the decentralisation and integration of the
Reproductive and Child Health Programme in India (RCH). It has been formulated in
almost all districts and funds have been allotted for implementing this programme in
different areas. RCH programmes are being implemented as an integrated package of a
number of reproductive and health services, including the traditional antenatal, natal and
post natal care for pregnant women as well as infants including immunisation of children
against common vaccine preventable diseases. Analysis reveals that, the state-level RCH
services are significantly more cost effective than the district level services. Thus the
speed of annual progress in RCH has decreased by half except in case of polio
vaccination. Decentralisation and integration of basic healthcare services may not be
effective unless it is monitored centrally and backed by full time health
(medical/paramedical) professionals at the delivery level.
Gupta and Khaira (2008) have contributed a study where they have tried to highlight
issues like flaws in child nutrition and health governance due to the misguided policies
and untrained or weak leadership .The scheme or the policies meant for a particular
section may not reach them; in other words the weaker sections of the society will be
deprived of the benefits meant for them.
Singh (2013), have a study on trend in child immunisation coverage in India. Although
the child immunisation is consider as a highly cost effective life saver medicine which
prevents the children from risky or hazardous disease. As compare to developing nation,
Although average annual rate of under five mortality has been gown down by 3.1 percent
during 1990-2009 but this much of percentage change in mortality rate will not going to
help to obtained the target of fourth millennium development goal (MDG) of India by
2015.so, as per Singh has given a more emphasis on vaccination to child has play a
essential position in achieving the goals specified in the millennium development

38
(MDG). In India about a fifty percent of children age group 12-23 month still not
receiving the essential immunization coverage nearly 20 percent of children was died in
every year because of vaccine preventable disease among children under five years of
age. Thus the present study advises that the sustained evaluation of the work performance
of the health system services reduce a gap between the groups of a child. Study also
recommends that targeted involvement group have a better performance conventionally
as compare to neglected group growing inequality in immunization coverage due to less
focus or less targeted intervention and lack of continuous and systematic assessment.
2.4. Socio-Economic Factors
Socio-economic issues highlighted by the many of the researchers can be taken as
major factors for the purpose of designing quantitative models for child health. Variables
used for this purpose include income and education of the parents, working status of the
mother etc. Mother’s literacy rate and schooling also have a greater impact on child
health and its survival.
Gok (1983), for the first time in economics, he has used a sibling data to estimate the
effects of family background on child health by using a multinomial regression method.
He has reported that the variable affects the child heath i: e parents schooling, mother
labor force status, and family size etc. family characteristics are the predominant features
for determinants of child health in conventional multivariate regression models, it is clear
that significant family influence is exercised on child health, as per the result 85 percent
of the variance explained by the sibling data and the remaining unexplained is determined
by regression analysis. Therefore the higher education level of parents, well living
standard and also a less family size are required to obtain a good health of child in a
childhood level. Virginia & Gok (1983) conducted studies to examine the effects of
family background on child health by using sibling data in health economics. According
to them about 21.6 per cent of the effects on child health are drawn from the family
background whereas 42.8 per cent mainly occurred due to common diseases. Family
background characteristics include areas like schooling of the parents, mother's working

39
status, (private, agriculture, regular etc) status of family and family size etc., all of which
have a great influence on child health.
Education is one of the important tools for human being thought the life. In this study
Gursoy Akile in (1994), also shows the importance of parent’s education (father) on
infant health. In a cross-national study by him in 1985 in Turkey, he has found that father
education was more powerful explanatory variable associated with infant survival. Which
is suggested that father with higher education may have a class and status differences,
though after his finding, he has mention that father should have at least primary level of
education then only they can protect their child from dying before to reach their first
birthday as per their report every year 1.6 million infant are more likely to die because of
only parents are not having education.
Sandiford et al (1995) show that mother’s education is the key factor that leads to
changes in a woman’s values, beliefs, power or knowledge which in turn leads to lower
child mortality either through better domestic child care or more effective use of health.
Also the educated mothers are more likely to use professional antenatal care compared to
non educated ones. Parental education plays an important role in the use of daily routine,
antenatal care and in maintaining good health of their children. Educated mothers are
always updated with access to information as compared to uneducated ones. The
Canadian Public Health Association (CPHA) in (1997) discussed the direct impact of
socioeconomic factors on human health. For example factors like poverty,
unemployment, education, living and working conditions, families, friends, workplaces,
social support and physical environments all have significant direct impacts on health. In
almost all societies health status is directly linked to social status. Those from a higher
socioeconomic position are usually in good health and generally live longer compared to
those from a poorer socioeconomic condition. Thus a slope exists in the rate of disease
from the top of the social ladder to the bottom as almost every disease had a greater
impact on a human being’s life according to the income range.
Anil (2000) discussed the socio-economic factors and healthcare structure related issues
that impact the effect of diabetes and consequently its costs. Factors that influence delay

40
in diagnosis also determine complication rates and thus costs. Chaiana et.al. (2002)
According to them poor child health situation is correlated with poor socio-economic
condition of parents. In general children with untreated dental caries and those with
poorer socioeconomic background are more likely to report poorer health condition of
child. The negative impact of untreated caries of income on child cognitive development
remains significant even after the change sex and socioeconomic. This study also shows
that the improvement of child health influenced by socio- economic conditions and dental
clinical status this is the most important findings of this study. Children with poor health
as present with more rigorous impacts on their quality of life. It is well established that
individuals from low socio- economic backgrounds are more likely to be exposed to
various risk factors which affecting the health, and that health contributes extensively to
the quality of life not only allowing for practical domain but also psychological and
social dimensions. Lower income is linked with poor health status of the children by
Carlson and Senauer, 2003) through a variety of factors such as lower access to health
services and health information along with a more limited ability to obtain acceptable
nutritious foods. Lower income leads to low nutritious food for mother, which in turn
creates the problem of stunting, low birth weight, low infant mortality rate etc. in
children. The supply of greater nutrition to the mother means improvement in the status
of vitamin A in the mother’s health and her breast milk and is likely to contribute to the
improved health of the infant. Strohschein (2005) shows how low household income will
have a negative impact on child status. Low household income is associated with worse
child mental health as well. Therefore it can be shown that low household income is
highly associated with high levels of depression and involvement in antisocial behavior.
The author highlights the importance of understanding the way in which children are
highly influenced by their parents’ income.
Inchani and Lai (2008), utilized a data from the census of India (2001) to analyse whether
the mother education level have an impact on child sex ratio or not. They had used
statistical tools like student t-test and chi-square test for this purpose. There is a variation
in child sex ratio between rural and urban areas of India and statistically shows that child
sex ratio exist higher in rural than urban areas because of variation in educational level
between mothers. Therefore mother education level play an important role in deterring

41
the child sex ratio in india or mother eduction is a important indicator for child general
development process. In Indian framework child sex ratio is always high in rural areas as
compared to urban because in rural areas once women completed the primary level they
will stop them self for further study.
Peter (2011), and Kanjilal et.al (2010) highlights the poor health status of rural children
in India. The National Family Health Survey (NFHS) and the National Nutrition
Monitoring Bureau (NNMB) in 2005-06 shows that 8.4% of children are under nourished
due to the sustained decline in per capita calorie consumption over the year 2005-06.
Infant and child mortality rates of rural areas have been recorded to be high as compared
to urban families. Child vaccination also have been found to be very poor. NSS data
shows that average calorie consumption in rural areas was about 10% lower in 2004-05
than in 1983. Thus, the proportionate decline was larger among better-off sections of the
population, and close to zero for the bottom quartile of the per capita expenditure scale.
In urban areas, there was little change in average calorie consumption over this period.
Acording to the author, the nutritional status of rural people was found to be exceedingly
poor due to improper nutritional diet. A higher burden of child nutrition on the state or
nation as a whole will have a greater impact on economic development.
According to the study of Dahl and Lance (2012) lower income of the parents has a
negative effect on child health development. They have tried to estimate the causal
effects of family income on children. The outcome has been the endogenity of income,
that is, children growing up in a poor family are less likely to have an adverse home
environment and are also more likely to face other challenges that would continue to
affect their development even if their family income increases substantially. Andre and
Mizell (2015) have showed the immediate and long term effects of parents’ income on
child behaviour that could lead to long term effects on child health development (e.g
lower self control, poor school performance etc). It was found that children from low
income families engage in a higher level of bullying than those from high income
families.

42
Ramaiah (2015) reveals that the poor health status, including higher morbidity, lower life
expectancy and higher rates of infant mortality is linked to race, ethnicity and caste. It is
also revealed that any kind of discrimination affects people’s health as access to
healthcare becomes difficult and quality of health services also worsen if he/she belongs
to a lower caste or ethnicity.
2.5. Constraints in attaining a good health
This portion includes the constraining factors towards attaining a good health,
such as availability of doctors, medicines, healing systems, priority on gender etc.
Kenneth & Upchurch (1995) used data from Demographic and Health Survey (DHS)
which shows a gender difference among infants and also the impact of discrimination on
infant health status. According to DHS data mortality rate is high under the age of five in
developing countries due to massive gender discrimination. The disadvantage for girls is
the largest in the young child (1-4 years) age group. In this age range, care of the child is
more important than genetic factors in determining mortality risk in infancy. The
disadvantages are largest in the Middle Eastern countries. It was found that girl mortality
risks are 60 percent higher than those for boys after the neonatal period. It was also noted
that girls were fed less and suffered more malnutrition. Infection rates were similar but
boys recovered more quickly than girls, and parents purchased more medicines for boys
than for girls. This type of discrimination is still practiced in India which leads to a
negative impact on the national growth rate while also promoting a bad quality of health
in society. Sweetman (2002) states that a woman is less concerned about how many child
she bears or at what interval as it is all decided by the man, who is the bread winner of
the house. A woman cannot independently decide the healthcare she wants to take or give
to her child as they need financial assistance from the husband. Mahmood (2004), linked
poverty with child morbidity and health seeking behavior in developing countries. As per
their finding the most common illnesses among the children from poor families are
intestinal infections including diarrhea, fever and viral diseases and also the Lack of
affordability of medical treatment was among them are the main reasons for not visiting
any health facility during the child illness. The present analysis also determined that
poverty has adversely influenced the nutritional status of children. The basic issue is how

43
to reduce household food insecure especially among the poor family. The government of
Pakistan initiated some target programmes to transfer cash benefits directly to the poor
including Zakat and food support programme. But there is a need to improve the target
efficiency of these programmes in Pakistan. Therefore higher the poverty rate higher will
be the rate of morbidity problems faces by developing countries people. Ballet and
Biggeri (2005) have carried out a study to examine the relation between child activity and
the capability approach. The paper explores the use of the capability approach towards
children as a subject of human development. This means that children are not simply
recipients of freedom but active social members and agents of future in their communities
with their own priorities, strategies and aspirations. As children grow up they are able to
express their point of view, values and priorities because today children’s are tomorrow’s
contributors.
Imre et.al. (2006) have discussed the issue of the lack of well qualified professional
doctors in Hungary. It was one of the greatest challenges faced by the Hungarian people
in early and mid 1990s. According to them lack of doctors is one of the major problems
caused by the lack of good medical training institiutions.
Similar studies has been observed by the kumar and Monthey in (2011), they has been
observed that urban population exhibit in different types of poverty, morbidity, mortality
and nutritional status as compared to rural population. This was happened because due to
the shifting pattern of poverty from rural to urban areas in developing countries. The
number of urban poor is increasing day by day in faster rate than those in rural areas
because of only high rate supply of rural people in urban areas. So, higher poverty level
will raise the cost of health care services which leads causes of inequality in health and
health care utilization within urban areas.
Mathew (2011) highlights the issues related to primary health centers in India.
Performance of primary health care centers in India are unsatisfactory due to shortage of
disciplinary medical expertise, laboratory facilities, and lack of others infrastructure
facilities and also the deficiency of life saving medicine. In each village one primary
health centers (PHC) will cover at least 25,000 per population and each centre is

44
equipped with the provision for preventive, curative, promotional and rehabilitative
aspects of public health and has an effective referral system. And also they have a first
level of contact and direct link between each individuals and the national level health care
system for providing a door to door health care services to the people in a community.
But the nation has failed to provide those kinds of facilities to the people in a community.
So, the people are totally deprived from the benefits in the primary health services in
public sector and they go for private sector health care services which are very expensive
for them. In India almost sixty to seventy percent of the people are required to look for
medical helps in private sector. Thus the present study concluded that, this circumstance
is faces by the people because of the irresponsibility and lack o proper planning on the
management system on the part of the Government. Thus the consequences of this
carelessness have a negative Impact on health of the common people as well as acquiring
an ill health and poverty which is hamper development.
Ram & Upadhayay (2012) dealt with health status of Sikkim and described the manner in
which problems of health and diseases are solved by their community health doctors by
utilising the flora and fauna availble in the himalayas.
2.6. Health and productivity
The demand of child care is heterogeneity in nature because it significantly effects
by the location, hours and cost for the overall development of child. After their analysis
they found that parents who really care about their infant overall cognitive development
preferred to send their kids in a baby care centers but there are some parents exist in
society who gives an importance to choose a cost, hours and time etc rather than overall
development of child at home. For them if demand for child care higher in nature will
reduce income but child will get a higher quality of caregiver. Therefore there are various
processes for child developmental care but process should have a positive impact on child
cognitive development Waite ei.al (1990). There are many studies which show the impact
of gender inequality in child health. Rosenzweig (1990) econometrically test ‘infant
morbidity’ and ‘allocation of time’ to analyse incidence of illness on child health. Her
infant morbidity is that a young child somewhere between six month and two years of
age constantly needs care and attention to reduce the mortality rate between male and

45
female child. Continuous estimation of health activities indicates that higher the infant
morbidity rate will extensively make differential in the capital accumulation between
girls and boys in Indonesia. Therefore it’s not only the responsibility of government to
make nation disease free but also the responsibility of parents to make future prosperity
of nation. Arora (2001) has also investigated the impact of good health on the economic
growth. Improvement in health facility will increase the human ability and it will increase
the pace of long term growth by 30 to 40 percent. As per the WHO estimation report in
(2006) 9.5 millions of children died before attending their fifth birthday in developing
countries. Around 32 percent of children in developing countries are stunted and 10
percent are wasted because of sub-optimal breast feeding practices. Especially non
exclusive breast feeding for first six month of life results in 1.4 million deaths and 10%
of the disease burden in children younger than 5 years.
The member of world health organization articulated the interest in improving the deep
understanding of linkage between the investment in health, economic growth and poverty
reduction. There studies in Latin America during the year (2005) Caribbean countries had
shows that improvement in GDP is strongly associated with life expectancy rate because
life expectancy at birth is single strongest explanatory variable of increase in countries
GDP. The finding of their study suggests that for any additional year of life expectancy
there will be an additional 1 % increase in GDP 15 years later.
Noonan et.al, (2005) asserts that poor child health as a mass phenomenon occurs not only
because of parental wage rate but because of the parents concerns for household survival
as well as less time spending with the child. They had decorated that the effects of child
health on the labor supply of father’s .which suggest that, children with high risk of
health problem may reduce the working hours of the parents (father) which leads a less
health investment then their previous condition.
Many Research has revealed that a direct trade-off exist between child health and
schooling. If we viewed it narrowly differences between child health and schooling it will
be clear. The relationship between child health and schooling given by Sisk (2005) and
they had provided an extensive proof that deprived quality of child health damage to the
children education level. As higher the chances of getting poor health the more will be

46
chance of dropping out from the education. As for the Yeravdekar et.al (2008) the
inequality and poverty are the two major root causes of ill health in our country (India).
The first health medical services facility established by British government in India
during the 18th century to provide benefit only for the nationals, armed forces, and
privileged civil servants only. Where indigenous system of medicine were totally
neglected, as per the 2011 census in (India) 68 percent of Indian inhabitant lives in rural
area whereas only 20 percent of medical facility located in that particular area. So, this
biasness lead high maternal and infant mortality rate, the main reason for them is a
financial problem, most of them can’t afford a high medical care facility, other major
reason are long distance of the public facility , long wait time, and inconvenient hours of
operation. All the issues are mention by them are the major factors of attending an ill
health in India. World health organization, world health organization, WHO in (2009)
brings together the fundamental knowledge about the infant and child feeding practices
because the optimal feeding practices lead the most effective affection to improve the
child health.
Bajpai and Dholakia (2011) studies on addressing the issues related to the provision of
quality services of accredited social health activists (ASHA) in the community. Central
government has introduce a ASHA programme in each and every community to reduce
the maternal and infant mortality rate by providing all the facilities to the people but in
most of the places they have a low contact between the ASHA and pregnant women due
to the social distance and also ASHA themselves have a lack of knowledge and skill to
recognize post-delivery danger signs for mother and newborns and the immediate care
that need to be taken.
Arif (2014), in this study he has tried to examine the health status of children in Pakistan
by using two important parameters i: e morbidity and malnutrition measured by with the
help of height and weight of the child as per the age. Similar study has been contributed
by World Bank in (20014) examined the correlation between poverty and child
malnutrition, using the Pakistan Rural Household Survey (PRHS) and they had shows a
positive relationship between the household income and nutritional status of children
although it piercing towards the occurrence of strong externality effects within

47
communities in the child's well- being. The morbidity and malnutrition has a linked with
food security and the income of the parents. As higher the income level the chance of
attending a good health will be more chances. As per their study they had found that
increase in avability of calories and decrease in diarrhea both will increase the probability
of improvement in health of the child.
Maternal depression is one of the most important factors of affecting the child health
during childhood which have not been overlooked very much till now. In these articles he
has tried to identify that how maternal depression linked to child physical health. He has
also mention that maternal depression is one of the major responsible factor for attending
a poor health among children ages six months to 11 years because children who live in
this situation are chronically depressed mother may be more in danger children of mother
to have a higher chances of getting poor health as well as poor cognitive development.
When depression is chronic and frequent mother may be less supportive or stressful and
less supportive circumstance which may reduce the mother ability to engage in prevent
their children from vulnerable situation Turney in (2016).
2.7. Research Gap and Justification for the Study
The literature on child health is enormous. However there are certain gaps in
research which the present study intends to fulfill. Firstly, child healthcare is a major
problem throughout the world. However there are few studies showing the relationship
between the child health and poverty or human deprivation. There is also a lack of
empirical studies on child health and mother’s education.
Besides, Sikkim remains one of the most neglected areas with regard to studies on child
health, though it almost stood in good position in monitoring the health but not in an
efficient manner.
Researchers from various fields have concentrated on diverse topics. The present study
on health deals with the failure of government health programmes in motivating the rural
people. The study focus on the effects of a variety of socio-economic factors on child
health in Sikkim. The existing literature in this field does not seem to have addressed this

48
issue. There has also been hardly any study on this particular issue in Sikkim. The
proposed research is an attempt to bridge this gap.
2.8. Plan of the Work
The Proposed dissertation paper is to be organized as follows:
Chapter 1: Introduction
Chapter one includes the introduction of the proposed research. It also introduces the
problem of child health care in North-East India in general and Sikkim in particular.
Chapter 2: Review of existing Literature
Chapter two elaborates the theoretical background of child healthcare and it also provides
the research gap and relevance of the present study.
Chapter 3: Database and Methodology of the Study.
This chapter outlines the data used for the study along with a description of the
methodology applied.
Chapter 4: Results and Discussions.
The fourth chapter summarises the results and related discussions.
Chapter 5: Concluding Observations and Policy Prescriptions.
Chapters five gives the conclusion of the dissertation starting with a brief outlook of the
every chapter. It underlines the findings of the field work and the resultant policy
prescriptions.

49
Chapter - 3
Database and Methodology
3.1. Data Source
The present study is based on both primary as well as secondary data.
Source of Secondary Data
Secondary data has been obtained from various sources such as the Ministry of
Health and Family Welfare (MoHFW), National Family Health Services (NFHS) etc.
Data has been collected on healthcare in Sikkim from sources like Department of
Healthcare, Human Services and Family Welfare, Government of Sikkim, and these
include available vital statistics on the number of hospitals, number of nurses, midwives
available (per thousand population), professional doctors, infrastructural facilities
available, as well as crude birth rate, death rate, maternal mortality rate and infant
mortality rate of all eight north eastern states. The data is taken from the three successive
rounds of the National Family Health Survey (NFHS) conducted during 1992-2006. The
first round of NFHS was conducted in 1992-1993; the second round in 1998-1999 and the
third round in 2005-2006. The NFHS is similar to other demographic and health survey
data (DHS) and it covers broad range topics such as immunisation of children, their
nutritional status, fertility, and mortality etc. All three rounds of NFHS data are nationally
representative because it has covered more than 99 percent of both the general population
as well as child population in India.
Source of Primary Data
Primary data has been collected by conducting a field survey during the period
from June 2016 to July 2016 with the help of pre-structured questionnaire. The following
sample design has been applied for selection of households.

50
3.2. Sampling Design
The present study was carried out in different parts of East Sikkim. Initially
multistage sampling was used where the entire state of Sikkim was divided into four
districts viz., north, south, west and east respectively. Each district is divided into three
subdivisions and blocks and finally each block is divided into rural and urban areas.
However the present study purposively selects the East subdivision of Sikkim because of
higher density of population as compared to the other districts. Moreover, the availability
of health care infrastructure facilities is better in the East district of Sikkim as compared
to the remaining three districts.
MULTI-STAGE SAMPLING
SIKKIM
EAST SIKKIM
THREE SUBDIVISION
Gangtok Pakyong Rongli
Rural Urban
Rural
Urban
Ranka Tadong
Rural Urban Rungdung Busty
Padamchey Busty Pakyong Bazar Rongli Bazar
Figure 3.1: Multi-Stage Sampling

51
All the three subdivision6 of East Sikkim have been selected for the collection of
field level data related to child healthcare. Again from these three subdivision we have
selected six different villages in addition to three from rural areas (viz Rungdung,
Padamchey, and Ranka) and remaining three from urban areas (such as Rongli Bazar,
Pakyoung Bazar, and Tadong) in order to capture differences in attitude as well as to
make a comparative study between them. Multistage sampling refers to a sampling
process which is carried out in several stages.
The population is first divided into large groups, called first stage units. These first stage
units are again divided into smaller units, called second stage units; again the second
stage units were divided into third stage units and so on, until we reach the ultimate
units7.
3.3. Location of the Study Area
The following location of the study area has been utilised to collect the data on
child health status across different blocks in the subdivisions of East Sikkim. The present
study consists of a total 204 samples from three different subdivisions of East Sikkim,
with 102 households from rural areas and remaining 102 households were collected from
urban areas respectively. We have selected from Gangtok and its surroundings (viz.,
Ranka and Tadong), for the collection of primary data on child healthcare. Similarly two
areas we have chosen from Pakyoung (i.e. Pakyoung Bazar and Padmchey Busty),
whereas the remaining two villages were selected from Rongli (i.e Rongli Bazar and
Rungdund Busty). The above location of the study area of East Sikkim is shown in the
following map (i.e. in fig 3.2).
6 Gangtok, Pakyong, Rongli.
7 These first stage units are again divided into smaller units, called second stage units; again the second stage units
were divided into third stage units and so on, until we reach the ultimate units7.

52
Figure: 3.2 Maps of Sikkim
3.4. Tools for analysis
The following analytical tools have been used for the study:
(i) Multinomial Logit Model:
Present study has used multinomial logit model for estimating the significant
determinants of child immunisation coverage and thereby attaining a good health. The
multinominal logit model is used because the dependent variable is in nominal form that
is considered in one of three observable states, namely, (i) no immunisation, (ii) partial
immunisation, and (iii) full immunisation. If there is no immunisation coverage the
dependent variables takes the value 0; for partial immunisation it takes the value 1; and
for full immunisation it takes the value 2. As per the immunisation schedule provided by
the District Hospital of Sikkim8 each child or infant should be provided the following
vaccines at the age of five years like:
(i) Two doses of TT vaccine = (i.e. TT-1 for early in pregnancy, & TT-2 after 4
week of TT-1)
(ii) One dose of BCG = at birth or up to 1 year.
(iii) Four doses of OPV = (i.e. OPV-0 at birth or can be given up to 2 weeks,
OPV-1, 2 and 3 at age 10 to 14 weeks but can be given up to 5 years)
8 Reterived from http://childcare.org/schedule of immunisation.

53
(iv) Three doses of DPT = (i.e. DPT-1, 2, & 3 at age 6, 10 & 14 but can be given
up to 2 years)
(v) One measles vaccine = (given at 9-12 months)
(vi) Vitamin-A = (At 9 months)
In this connection it is to be mentioned that, those children who had received a two doses
of TT vaccine, one doses of BCG, three doses of DPT, four doses of OPV, one measles
vaccine, and one dose of vitamin A/booster has been considered as a full immunized
children. Likewise children who had received at least three doses of vaccine from the
entire dose are considered as partially immunised children. Those children who did not
received a single vaccine from the entire dose mentioned above come under the no
immunisation coverage.
The present study has used the regression model for estimating the impact on child
immunisation coverage. Therefore the decision of a child to be immunised is described
by the following model as follows.
Yi= βXi + Ui ………………… (i)
Where;
Yi indicates the dependent variables
β indicates the Intercepts of explanatory variables
Xi indicates the ith explanatory variable
Ui Captures the errors term
Where;
Yi = 0: Hi < 0, I i < 0 (child neither immunised nor attained good health)
Yi = 1: Hi ≤ 0, I i ≤ 0 (child partially immunised and partially attained good health)
Yi = 2: Hi > 0, I i > 0 (child fully immunised and fully attained good health).
The information on child immunisation was collected for only new births to five years of
age from selected areas. Information on child immunisation was collected through the
immunisation card or health cards of the child and mother. The multinominal logit model
is mainly used to capture the importance of immunisation coverage on child health and is
also used in evaluating the impact of several socio-economic as well as environment

54
factors. Where socio-economic factors like education of parents, mother’s age, standard
of living, religion, caste, income of the parents and accessibility of healthcare services on
childhood vaccination. However environmental related factors like , family size,
exposure to mass media, place of residence (rural and urban), drinking water, toilet
facility, sanitation, place of residence, number of household rooms available, distance
from hospitals, availability of doctors, availability of primary health center (PHC) etc.
The relevant equation for multinomial logit model is as follows.
Yi = β0 + β 1 (BOCi ) + β 2 (MEi ) + β3 (LOCi) + β 4 (SOLi ) + β 5 (MWSi ) + β 6 (EMMi) +
β 7 (CASTEi ) + β 8 (RELi ) + β 9 (HCi ) + β 10 (SCi) +β 11 (MAGE) + Ui……………………….. (ii)
Where;
β 0 : Intercept Term.
β 1, β2 ………………… βn are coefficients of the explanatory variables.
Apart from multinominal logit model, present study also used a chil-square test and Bi-
variate frequency distribution.
(ii) Chi-square Test:
Chi-square test is commonly used for testing a relationship on categorical
variables. Basically a chi-square test can be used to test the null hypothesis that the given
attributes are independent of one another. If there are two attributes ‘a’ and ‘b’, the null
hypothesis is given by H 0 : attribute ‘a’ and attribute ‘b’ are independent. If p ≤ 0.05 we
may not be able to accept the null hypothesis. In that case we accept the alternative
hypothesis H1 . This implies that attributes ‘a’ and ‘b’ are associated with each other. So,
the chi-square test is used to determine whether there is a significant difference between
the expected frequencies and the observed frequencies in one or more categories.9
Therefore it can be used to understand the significance of the effects of immunisation
coverage across selected socio-economic variables. So, the progress rate of each vaccine
helps to know the progress rate of one vaccine to another.
9 Wikipedia, 23 September: chi-square test.

55
The formula for calculating the chi-square test is given below.
𝝌𝝌𝟐𝟐 = ∑�( 𝐹𝐹0 − 𝐹𝐹𝑒𝑒 )2
𝐹𝐹𝑒𝑒�
Where F0 indicates the observed frequencies and Fe the expected frequencies of the ith
rows values and jth column values divided by sum of total observation.
(iii) Bi-variate frequency distribution:
Bi-variate frequency distribution is one of the simplest forms of quantative analysis,
which involves the analysis of two variables (x, y) for the purpose of determining the
empirical relationship between them. Bi-variate frequency distribution is also used to
establish the correlation between the two variables.
.

56
Chapter - 4
Results and Discussion
This chapter provides a snapshot of the results of the study along with their
interpretation. Present chapter has made an attempt to examine the child health care
system in North-East (NE) India in general and particular in Sikkim. Thus the study has
used a descriptive statistics and Compound Annual Growth Rate (CAGR) in order to
understand the growth rate of child health care system in North-East (NE) and in Sikkim
over the year. Whereas to evaluate the significant effects of several socio-economic
variables on child health through immunisation coverage in the east district of Sikkim, we
have divided this chapter into three sections – descriptive statistics using univariate
frequency distributions, followed by the same using bivariate frequency distributions, and
ending with the analysis of the data using the multinomial logit model.
4.1 Status of Child Population in NE India
There has been decline in child population over the year, as in Table 4.1 reveals
that the child population of Sikkim was highest 1.31 % during 2001 census compared
with child population of NE states during 2011 census with figure 1.10 %.
Table 4.1 Percentage change in (0-14 years) age of population of Sikkim
sourc: Census of India (2011)
When child population is decreasing in trend in Sikkim it may be because that people are
aware for not to have more than two child or another reason may be child are dyeing due
malnourished. The state-wise total child (0-14years) age group population of NE Region
Year States 0-14 age group child
population in NE states
% of child population of Sikkim with
respect to NE states
2001
North East States 14407353 100
Sikkim 188907 1.31
2011 North East States 15000852 100
Sikkim 165937 1.10

57
reported in Table 4.2; the CAGR estimation has been done to examine the percentage
change in child population of child over the year. The child population growth in
Manipur was highest with growth rate at 2.20 % per annum followed by Meghalaya,
Meghalaya and Arunachal Pradesh with growth rate of 1.84 %, and 1.08 % per annum
respectively. Percentage change or growth rate of child population is relatively lower in
Sikkim by -1.28 % per annum followed by Nagaland (-0.70%) and Tripura (-0.54%) per
annum. Sikkim is lowest in terms of growth of population of child between age group (0-
14) years amongst the all NE states during 2001-2011 Census.
Table 4.2 State wise growth rate of (0-14) age group population of NER
Source: Census of India (2011)
4.2. Status of Full Immunisation Coverage
Table 4.3 reveals the trend of immuisation coverage between (12-24) months
child from (1992 to till 2006) has been observed that the considerable improvement in
India as compare to NE states. In case of Sikkim, the yearly average full immunization
was highest 46.66 amongst NE states but comparatively less when we compared with
India’s average. The least immunization of child has been registered in Nagaland with an
average figure of 13 per year. CAGR has been used to understand the percentage change
in immunisation coverage with progressing year 1992-2006. Negative sign of CAGR
child immunization indicate there has been.
State wise growth rate of 0-14 age group of child population
Year Arunachal
Pradesh Assam Manipur Meghalaya Mizoram Nagaland Tripura Sikkim
2001 442825 997034
2 706705 980877 313736 728409
107555
2 188907
2011 493361 102488
99 861688 1177942 356002 679032
101799
1 165937
CAGR
(%) 1.08 0.27 2.02 1.84 1.27 -0.70 -0.54 -1.28

58
Table 4.3 Descriptive statistics of full immunisation coverage of NE states and
India from (1992-2006)
States Mean CV (%) CAGR (%)
Arunachal Pradesh 24 15.02 -98.93
Assam 19.33 15.02 -98.94
Manipur 32.66 39.48 -98.82
Meghalaya 15.66 42.49 -98.68
Mizoram 37 22.12 -98.84
Tripura 24.33 18.53 -98.86
Nagaland 13 48.72 -98.26
Sikkim 46.66 50.36 -98.55
India 54 41.24 -98.68
Source: National Family Health survey (2005-06)
an improvement in immunisation coverage. In all the states of NE India have a negative
CAGR which indicates that there is a significant improvement in full immunisation
coverage over the study period. Sikkim’s performance is far better than others states like
Manipur, Arunachal Pradesh and Tripura. States like Assam and Arunachal Pradesh were
most consistent in immunisation coverage of child while Sikkim was most inconsistent
during the fifteen years of study.
4.3. Number of Diseases Infected in Child across NE Region
Table 4.4 shows the causes of diseases during the childhood period from birth to
five years of age viz, asthama, tuberculosis, jaundice, and malaria among the eight NE
states and India. In India, 2,468 children per 100,000 populations were suffering from
asthama diseases, where in sikkim 4,711 children out of 100,000 are died from asthama
which was higher than national average. Thus the prevalence of asthama varied
considerably amongst the states. Whereas in case of tuberculosis prevalence rate i.e. 710
per 100,000 were in Assam and 8932 per 100,000 were in Tripura.

59
Table 4.4. Number of child household suffering from Diarrhea, Tuberculosis,
Jaundice and Malaria in North-East States and India in NFHS-2
States Asthama Tuberculosis Jaundice Malaria
Arunachal Pradesh 3117 1270 1669 12619
Assam 3278 710 2768 2974
Manipur 2040 1107 1728 1995
Meghalaya 5995 1459 2658 16658
Mizoram 2149 1063 3155 7359
Tripura 2235 8932 4218 8869
Nagaland 5729 1654 5348 16166
Sikkim 4711 1002 2382 1108
India 2468 544 423 3697
Average for NE 3656.75 2149.625 2990.75 8468.6
Source: NFHS (1998-99), India.
In all the states in the NE Region, except Assam had a higher rate of tuberculosis disease
but the 0-14 age group of child being observed over the time. In India, only 544 per
100,000 populations were suffering from tuberculosis. Similarly Jaundice is one of
diseases most common in Nagaland which is 5348 out of 100,000 population are died
only from it, whereas in Sikkim (2382) which is also much higher as compared to
national average in India. Again it was observed that as per the NFHS report (1998-99)
the occurrence of malaria also widely varied across the states, Children suffered from
malaria was most often reported in Meghalaya followed by Nagaland, Arunachal
Pradesh, and Madhya Pradesh whereas the prevalence of malaria is relatively lower in
Sikkim as compared to the national average.
4.4. Vitamin A supplements for child in NE
Insufficiency of Vitamin A is one of the serious nutritional deficiencies in the
universe. In each year more than 250 million of children are affecting throughout the
world. At the age of 0-3 years children at high risk of vaccine preventable diseases and if
children are already had a poor nutritional diet may have a negative impact on child’s

60
overall development process .Therefore, the complete dose of vaccine and proper
nutritional diet is essential for future development of a child.
Table 4.5 Vitamin A supplements for child age between (6-35) months in NE states
(1998-2006)
Source: National family health survey 1998-99 to 2005-06
The 2nd and 3rd round NFHS data also provides the data on vitamin A supplements.The
above mentioned table shows the percentage change in vitamin A supplementation for
child in the NE states and India. Mizoram has received a highest percentage of vitamin A
dose with 70.6% followed by Sikkim with 45.8% and Manipur with 38.4 % which are
much higher than the national average 29.7% while the performance of Nagaland and
Assam performance were not better on the basis of receiving a vitamin A nutrition’s.
Except Mizoram and Sikkim all other NE states were found to be backward in terms of
vitamin A supplementation when compared with the national average level as per NFHS-
II round data.
States
Percentage of children age 6-35 months who had received vitamin A dose
NFHS (II)
(1998-99)
NFHS (III)
(2005-06)
Arunachal Pradesh 20.9 18.7
Assam 15.4 18.7
Manipur 38.4 15.2
Meghalaya 24.7 20.9
Mizoram 70.6 46.5
Nagaland 6.8 8.9
Tripura - 41.2
Sikkim 45.8 24.2
Average for NER 27.8 24.2
India 29.7 24.8

61
The NFHS III round data shows that there is a significant change in all NE states. Except
Manipur and Nagaland performing well in receiving the vitamin A supplementation
which is 41.2% and 8.9% respectively followed by Assam is 18.7%. While some of the
states such as Arunachal Pradesh, Mizoram, Meghalaya, Sikkim, and Manipur
performance was poor in receiving the vitamin A supplements. Thus the vitamin A
supplements status of NE states from NFHS II and III rounds data shows that there is fall
in nutritional distribution in most of the states which was even below the national average
rate. Expect Nagaland, Tripura and Assam were performing well in terms of vitamins A
supplements.
4.5. Status of health care infrastructure in NE and India
On the basis of analysis conducted with the help of time series data from (2004 to
2016) by using simple descriptive statistics, it indicates that on an average the total
number of Sub-centers functioning was 47.09%, Primary health centers functioning was
26.18% and community health centers functioning was 16.27% over the year. On an
average the progress rate of Tripura progress rate in terms of health care infrastructure
(sub-centers) is better position as compared to other states. While Assam, Manipur,
Meghalaya, Nagaland, and Mizoram were also have a better position in terms of sub-
center infrastructure facility. Among eight NE states, on an average Sikkim has
experiencing worse in sub-centers facility available followed by Arunachal Pradesh.
Except Sikkim and Arunachal Pradesh, all other NE states were performing well in terms
of sun-centers over the year. While in terms of primary health centers (PHC), Sikkim
occupied first position against national average while Tripura was in second position
followed by Assam, Manipur, Meghalaya, and Nagaland. It can be observe that the
performance of Arunachal Pradesh performance was not well with regards to primary
health centers also. On the basis of mean estimation value in terms of community health
centers (CHCs), on an average Arunachal Pradesh were doing well while the
performance of remaining states compared to national average was very poor. It has been
observed that Sikkim stood in a least position in terms of community health centers
during the study period.

62
Table 4.6 Descriptive statistics of health care infrastructure in NER and in India
from (2004 to 2016)
Source: computed and compiled from secondary data, Ministry of health and famiWelfare, Government of India.
The above estimated Table 4.6 also shows the CAGR of three infrastructural facilities i.e.
Sub-Centers, Primary Health Centers, and Community Health Centers during the year
2004 to 2015.
States Distractive statistics Sub-centers PHC CHCs
Arunachal Pradesh
Mean 14.36 13.28 13.09 Std.Deviation 36.25 36.26 72.14 CAGR (%) -99.95 -99.02 -98.95
Assam
Mean 47.09 26.18 11.45 Std.Deviation 23.19 20.23 18.95 CAGR (%) -99.96 -99.13 -98.96
Manipur
Mean 42.27 23.45 16.27 Std.Deviation 23.46 17.70 46 CAGR (%) -99.99 -99.15 -99.01
Meghalaya
Mean 40.36 23.15 16.27 Std.Deviation 11.05 15.44 2.45 CAGR (%) -99.01 -99.11 -98.98
Nagaland
Mean 39.01 23.15 2.02 Std.Deviation 1.09 15.98 0.02 CAGR (%) -99.01 -99.11 -98.98
Mizoram
Mean 36.54 19.54 9.01 Std.Deviation 2.01 16.62 0.01 CAGR (%) -99.01 -99.15 -99.01
Tripura
Mean 69.81 31.36 12.09 Std.Deviation 17.10 70.37 3.78 CAGR (%) -98.93 -99.14 -98.93
Sikkim
Mean 13.3 27.28 2.36 Std.Deviation 33.48 61.03 1.50 CAGR (%) -99.06 -99.15 -99.06
India
Mean 147.3 353.01 26.45 Std.Deviation 264.72 392.78 2.54 CAGR (%) -99.01 -98.81 -98.95

63
For primary estimation we have divided this chapter into three sections – descriptive
statistics using univariate frequency distributions, followed by the same using Bi-variate
frequency distributions, and ending with the analysis of the data using the multinomial
logit model.
The present study employed the descriptive statistics in terms of frequency, percentage
and cumulative frequency and also Bi-variate Frequency distribution table. Apart from
this multinomial logit model has been used for understanding the significant effects of
several socio-economic variables on child health through immunisation coverage in the
east district of Sikkim.
Let us now consider the following figures such as Trends in full immunisation
coverage (1992-2006), sources of childhood vaccination by residence, percentage
distribution of education level between (15-49) years age grouped women (2005-06), and
trend in women exposure to mass media from (1998-2006) etc.

64
Figure 4.1 Trends in Full Immunisation Coverage (1992-2006)
Source: NFHS-1 (1992-93), NFHS-2 (1998-99), NFHS-3, (2005-06), India.
Refers to Figure 4.1, the trend in immunisation coverage among the NE states Sikkim has
achieved steady growth in immunisation coverage over the year. In NFHS-1 (i.e. 1992-
93), Sikkim 23 children were immunised per 100 new baby, whereas in phase-2 (i.e.
1998-99) state had in double of its immunisation coverage and subsequently the number
of immunisation had increased by 204% in phase-3 (i.e. 2005-06) as compared to NFHS-1.
Arunachal Pradesh Assam Manipur Meghalay Mizoram Tripura Nagaland Sikkim
NFHS-1 23 19 29 10 57 20 4 23
NFHS-2 21 17 22 14 60 24 14 47
NFHS-3 28 22 47 23 46 29 21 70
01020304050607080
Vacc
inat
ion
cove
rage

65
Figure 4.2 Sources of Childhood Vaccination by Residence
Source: NFHS-2, (1998-99), India.
Figure 4.2 shows the percentage distribution of vaccination sources from where
the child are being immunised. In the rural areas the majority of the children were
immunised in public sector, which was 85% while 9% of child were immunised from
private medical sector whereas 6% was been immunised via the others sectors (i.e.
NGOs). In urban areas 72% were immunised from the public sector and one fourth of the
children were immunised in private medical sector and the role of other sector was almost
negligible in urban area (i.e. only 2%). It is be observed from the figure that the
percentage change of child receiving vaccinations from the private sector is considerably
lower in rural areas (9%) compared with urban areas (24%). It may be linked with the
children of more educated mother and those belonging to households with high standard
of living were more likely to get vaccine from private sectors.
4.6. Status of Women Education Level in NE Region
Figure 4.3 shows that the percentage changes in distribution of education level
between the (15-49) years age group women during (2005-06) amongst the NE states. In
Sikkim, the percentage change in the educational level of women was just below 35%
who had spent less than five years in school and exactly 15% of women has spent 5-10
years in schooling and 23% of the women has spend more than 10 years of schooling
over the year (2005-06).
public sector
private medical sectorother soource
26%
2%
72%
Urban
public sector
private medical sectorother soource
6%9%
85%
Rural

66
Figure 4.3 Percentage distribution of education level between (15-49 years) age
grouped women (2005-06)
Source: NFHS-2 (1998-99), India
In a country like India where a large number of women’s are illiterate or have a little
formal education in such as the mass media can play a vital role in bringing about in
modernization. Refer to Figure 4.4; in NHFS-3 more than 80% of women were regularly
exposed to any mass media from Manipur which was highest amongst NE states followed
by Mizoram and Sikkim.
Figure 4.4: Trend in women exposure to mass media from (1998-2006)
Source: NFHS (2005-06), India
05
10152025303540
Educ
atio
n le
vel
<5 years5-10 years
0
50
100
Expo
sure
to m
ass
med
ia
1998-99
2005-06

67
However, in NFHS-2 again women of Manipur were more interested to engage in
any mass media (i.e. 68%) followed by Mizoram and Tripura. Whereas Sikkim
has achieved a just double exposure to mass media in this regards in third round
(i.e. 73%) as compared to second round NFHS (i.e. 2005-06).
4.7. Description of Variables
Table 4.7. Variables Description
Sl.No Variables
Name
Description of the variables
1 IMMU Immunisation: 0 for not being immunised, 1 for partially
immunised, & 2 for fully immunised.
2 LOC Location: 0 for rural, 1 for urban
3 Cast SC/ST=0, OBC=1, others=2
4 ME Mother’s education: 0 for primary, 1 for secondary, & 2 for higher
secondary and above.
5 MWS Mother’s working status: 0 for not working, 1 for working
6 EMM Exposure to mass media: 0 for those who are not exposed to mass
media, 1 for those who are exposed to mass media.
7 HC Availability of Health card: 0 for non availability of health card, 1
for availability of health card
8 BOC Birth order of child: 0 for first child, 1 for second child, 2 for 3
plus.
9 SOL Standard of living: 0 for low, 1 for medium, & 2 for high.
10 Religion 0 for Hindu, 1 for Christian, & 2 for others.
11 Mage Mother’s age: 0 for (15-24), 1 for (25-35), & 2 for (35+).
12 SC Sex of the child: 0 for female, 1 for male.

68
Let us consider the descriptive statistics of the variables in terms of different statistical
tools which are as follows.
4.8. Descriptive Statistics of Variables in terms of Frequency Percentage
Frequency and Cumulative Frequency
Table 4.8. Descriptive statistics on immunisation coverage
IMMU Frequency Percentage Cumulative frequency
0 45 22.06 22.06
1 44 21.57 43.63
2 115 56.37 100.00
Total 204 100.00 -
Source: Author’s calculation on primary data.
Table 4.9. Descriptive statistics on sex of the child
SC Frequenc
y
Percentage Cumulative
frequency
0 111 54.41 54.41
1 93 45.59 100.00
Total 204 100.00 -
Source: Author’s calculation on primary data
Table 4.10. Descriptive statistics on birth order of child
BOC Frequency Percentage Cumulative frequency
1 87 42.65 42.65
2 73 35.78 78.43
3 32 15.69 94.12
4 12 5.88 100.00
Total 204 100.00 -
Source: Author’s calculation on primary data

69
Table 4.11. Descriptive statistics on standard of living
SOL Frequency percentage Cumulative frequency
0 98 48.04 48.04
1 95 46.57 94.61
2 11 5.39 100.00
Total 204 100.00 -
Source: Author’s calculation on primary data
Table 4.12. Descriptive statistics on caste
Source: Author’s calculation on primary data
Table 4.13. Descriptive statistics on religion
Religion Frequency percentage Cumulative
frequency
0 158 77.45 77.45
1 29 14.22 91.67
2 17 8.33 100.00
Total 204 100.00 -
Source: Author’s calculation on primary data
Caste Frequency Percentage Cumulative
frequency
0 69 33.82 77.45
1 64 31.37 91.67
2 71 34.80 100.00
Total 204 100.00 -

70
Table 4.14. Descriptive statistics on EMM
EMM Frequency. Percentage Cumulative frequency
0 80 39.22 39.22
1 124 60.78 100.00
Total 204 100.00 -
Source: Author’s calculation on primary data
Table 4.15. Descriptive statistics on working status of mother
MWS frequency percentage Cumulative frequency
0 123 60.29 60.29
1 81 39.71 100.00
Total 204 100.00 -
Source: Author’s calculation on primary
Table 4.16. Descriptive statistics on location (Rural / Urban)
Source: Author’s calculation on primary data
Table 4.17. Descriptive statistics on availability of health cards
Source: Author’s calculation on primary data.
Location Frequency Percentage Cumulative frequency
0 102 50.00 50.00
1 102 50.00 100.00
Total 204 100.00 -
HC frequency percentage Cumulative frequency
0 42 20.59 20.59
1 162 79.41 100.00
Total 204 100.00 -

71
From the table 4.9, it is clear that 45 respondents (i.e. 22% of total respondents of the
sampled children) have not undergone any kind of immunisation. Partial immunisation
has been observed in case of the children of 44 respondents (21%). More than half of the
sample i.e., 115 respondents or (56%) have completed the immunisation process.
From table 4.10, we can observe that, 111 respondents (i.e. 54.41% of the total sample)
have females as children whereas 93 respondents (i.e. 45.59% of sample) have
males.Table 4.11 shows that 42.65% of the total respondents have only one child,
whereas 35.78% have two children, 15.69% have three children and the rest i.e. 5.88%
have four children.
From the table 4.12, it is clear that 98 respondents (i.e. 48.04%) are from low economic
background families. On the other hand 95 respondents (i.e. 46.57%) are from middle
class families and 11 respondents (i.e. 5.39%) belong to upper class family groups.
From table 4.13, it appears that 33.82% of the respondents belong to SC/ST category,
31.37% are belong are OBCs and the rest (i.e. 34.80%) are in the general category.
Observations from table 4.14, make it clear that more than half of the sample (i.e. 158)
respondents are Hindu, only 29 respondents are Christians and the remaining 17
respondents belongs to other categories (i.e. Muslim, Jain, Shik etc).
Table 4.15, shows that more than half of the respondents i.e. 124 are familiar with the
mass media whereas 80 respondents have not been exposed to them.
From the table 4.16, it is clear that 60.29% of the total respondents out of the 204
sampled are engaged in income earning activities, whereas 39.71% have not been
engaged in any kind of income earning activity.
From table 4.17, we can see that out of 204 respondents half of the sample was collected
from rural areas with the other half coming from urban areas.
From table 4.18, it is clear that 20.59% of the respondents do not have any health cards
whereas almost 80% of them have health cards.

72
4.9. Descriptive Statistics of the socio-economic variables by using
Bivariate frequency distribution table
Table 4.18. Bi-variate frequency distribution for immunisation coverage
and birth order of child
IMMU BOC
1 2 3 4 Total
0 14 20 8 3 45
1 25 8 7 4 44
2 48 45 17 5 115
Total 87 73 32 12 204
Chi-square
value
10.0754 (***)
df 6
Source: Author’s calculation on primary data.
Using the bivariate frequency distribution table we can observe the effects of different
types of socio-economic variables on the distribution of immunisation coverage. From
table 4.19, we can get an idea about the changes in the distribution of immunisation
coverage as birth order of the child changes. In others words here we are interested to
know whether distribution of immunisation coverage remains the same across the
different birth orders of the children. However from the above table it is apparent that
when birth order of child is one, 48 children out of 87 are fully immunised. On the other
hand when the birth order changes from 1 to 4 only five children out of 12 have been
fully immunised. From this result we can say that the distribution of immunisation
coverage changes with the birth order of the child, which is again confirmed by the chi-
square value; this chi-square value is significant at 12% level.

73
Table 4.19. Bi-variate frequency distribution for immunisation coverage
and standard of living
IMMU SOL
0 1 2 Total
0 12 12 21 45
1 10 16 18 44
2 47 36 32 115
Total 69 64 71 204
Chi-square value 7.6250 (**)
df 4
Source: Author’s calculation on primary data
Similarly, from table 4.20, we can get an intuition regarding the changes in distribution of
immunisation coverage as standard of living changes. We can clearly observe that out of
69 respondents 47 children who have been fully immunised belong to families from low
economic background; in contrast 36 out of 64 respondents belonging to middle class
family and 32 out of 71 coming from upper income class family have been fully
immunised. Therefore from this result we can say that as the standard of living varies
from 0 to 1 and from 1 to 2 (i.e. low to middle, middle to higher class) so, the distribution
of immunisation coverage also varies within the entire group.
Table 4.20. Bi-variate frequency distribution for immunisation coverage and caste
Source: Author’s calculation on primary data
IMMU Caste
0 1 2 Total
0 12 12 21 45
1 10 16 18 44
2 47 36 32 115
Total 69 64 71 204
Chi-square value 8.5379 (***)
df 4

74
Table 4.21, relates to the effect of caste on distribution of immunisation coverage. The
chi-square value also shows that caste has a significant effect on child immunisation
coverage at 10% level with four degrees of freedom. 12 children out of the 69 sampled
have not been received any kind of immunisation; they belong to families in SC/ST
category. 12 out of 64 come from families in the OBC category and 21 out of 71
respondents in the general category have not been immunised at all. Thus as per the
above result, the distribution of immunisation coverage changes with the change in caste
from SC/ST to OBC and from OBC to general category.
Table 4.21. Bi-variate frequency distribution for immunisation coverage
and religion
IMMU
Religion
0 1 2 Total
0 31 9 5 45
1 28 8 8 44
2 99 12 4 115
Total 158 29 17 204
Chi-square value 14.1107 (***)
df 4
Source: Author’s calculation on primary data
We can see from the table 4.22, that the progress rate in distribution of immunisation
coverage among the entire group differs according to religion. It is also clear that the rate
of partial immunisation varies from one religion to another; out of 158 respondents 28
have undergone partial immunisations who are Hindus. But in case of other religions only
8 children have received partial immunisation, Thus the people from Hindu religions
background are performing better in terms of partiall imunisation coverage compared to
Christian and others religion categories respectively. Therefore we can also conform from
the chi-square value that is found to statistically significant at 10% level

75
Table 4.22. Bi-variate frequency distribution for immunisation coverage and
Mother’s working status
IMMU MWS
0 1 Total
0 29 16 45
1 31 13 44
2 63 52 115
Total 123 81 204
Chi-square value 3.6803(***)
df 2
Source: Author’s calculation on primary data
In table 4.23, we are interested to know whether the changes in mother are working status
has a significant effect on the distribution of child immunisation coverage. It appears
from this table that for more than half of the sample, mothers are not engaged in any
income earning activity; 63 children out of 123 have been fully immunised. In case of
working mothers 52 children out of 81 have been fully immunised.
Table 4.23. Bi-variate frequency distribution for immunisation coverage and
availability of health cards
IMMU HC
0 1 Total
0 16 29 45
1 12 32 44
2 14 101 115
Total 42 162 204
Chi-square value 12.3484 (**)
df 2
Source: Author’s calculation on primary data

76
Table 4.24, shows the impact of health cards on distribution of immunisation coverage.
More than half of the children (i.e. 101) out of 162 who have received any kind of
immunisation fully are health card holders, whereas 32 are partially immunised and only
29 children out of 162 have not been immunised at all. It is also clear from the above
table that improvement in distribution of immunisation coverage among who do not have
health cards is relatively less. Thus the possession of health cards also has a significant
effect on child immunisation coverage.
Table 4.24. Bi-variate frequency distribution for immunisation coverage based on
sex of the child
IMMU SC
0 1 Total
0 26 19 45
1 25 19 44
2 60 55 115
Total 111 93 204
Chi-square 0.5404
Df 2
Source: Author’s calculation on primary data.
It is clear from the table 4.25, that out of 111 female children, 26 have not been
immunised, whereas out of 93 male children only 19 have not received any
immunisation. In other words the percentage of no immunisation is better for the male
child compared to the female child. Similarly there is also variation in partial and full
immunisation coverage with the sex of the child.

77
Table 4.25. Bi-variate frequency distribution for immunisation coverage and
Location
IMMU Location
0 1 Total
0 37 8 45
1 17 27 44
2 48 67 115
Total 102 102 204
Chi-square value 24.1007 (*)
df 2
Source: Author’s calculation on primary data
According to table 4.26, it is found that among the rural children, 37 children out of 102
missed any kind of immunisation, 17 children were partially immunised, whereas 48
children are fully immunised. On the other hand, in case of children from urban
locations, the rate of full immunisation is quite higher here at 67, more than 26 were
partially immunised and rate of no immunisation coverage was lowest here with only 8
out of 102 respondents. This can be again confirmed from the chi-square value which is
found to significant at 1% level with two degrees of freedom.
Table 4.26. Bi-variate frequency distribution of immunisation coverage and
exposure to mass media
IMMU EMM
0 1 Total
0 17 28 45
1 20 24 44
2 43 72 115
Total 80 124 204
Chi-square value 0.9181
Df 2
Source: Author’s calculation on primary data.

78
From the table 4.27, it is apparent that 72 children out of 124 are being fully
immunised are familiar through engagement with mass media, while for those who are
not exposed to mass media only 43 children out of 80 are fully immunised. In case of
partially immunisation, 24 out 124 had been immunised through familiarity with mass
media, whereas in the other category 20 out of 80 were immunized. From this result we
can say that the distribution of immunisation coverage varies with exposure to mass
media.
4.10. Result and Analysis of probability of child immunization coverage in East
Sikkim by multinomial logit model
IMMUi = β 0 + β 1 SCi + β 2 LOCi+ β 3 BOCi + β 4Magei + β 5 MEi+ β 6SOLi + β 7 Cast i +
β 8 Religion i + β9 EMMi + β 10 MWSi + β 11 HCi + u i ………… (1)
In order to understand the effects of socio-economic and demographic factors on
immunization coverage multinomial logit regression is used for East Sikkim after
considering the nature of i.e. immunisation coverage which has been divided into three
categories i.e. full immunisation, partial immunisation and no immunisation.
It is seen from the above table that out of the 11 variables, 5 are found to be statistically
significant. Boc, Mage, Sol, Caste and Religion; others are found to be statistically
insignificant. In order to understandthe effects of socio-economic and demographic
factors on immunization coverage multinomial logit regression is used for East Sikkim
after considering the nature of i.e. immunisation coverage which has been divided into
three categories i.e. full immunisation, partial immunisation and no immunisation.

79
Table 4.27. Factors Affecting Child Immunisation in Sikkim
Explanatory Variables Order Coefficients
Sex of the child 1 0.030
(0.05)
Birth order of child
2 -0.806***
(-1.42)
3 0.315
(0.45)
4 0.826
(0.85)
Mother Age
1 1.581***
(-2.74)
2 -1.890**
(-2.33)
Location 1 0.433
(0.82)
Mother Education
1 -0.071
(-0.12)
2 0.493
(0.61)
Standard of living
1 0.068***
(-1.48)
2 -13.78
(-0.02)
Cast
1 1.026***
(1.85)
2 0.976***
(1.68)
Religion
1 0.682
(1.19)
2 1.37***
(1.54)
Exposure to mass media 1 0.290

80
Note: *, NoteNote: *, **, and *** shows the 1%, 5%, and 10% level of significance Figure within the brackets represent the Z statistics value
In order to understand the effects of socio-economic and demographic factors on
immunization coverage multinomial logit regression is used for East Sikkim after
considering the nature of variable i.e. immunisation coverage which has been divided into
three categories i.e. full immunisation, partial immunisation and no immunisation.
It is seen from the above table that out of the 11 variables, 5 are found to be statistically
significant: Boc, Mage, Sol, Caste and Religion; others are found to be statistically
insignificant.
From the above table we can observe that the estimated slope coefficient on birth order of
child is statistically significant. The negative slope coefficient of birth order the child
suggests that the odds in favor of immunisation decreases by 0.5 units for second child,
holding others variables constant.
The coefficient of mother’s age is positive for a Mage value of 1 (i.e., age group of 25 to
35 years) and negative for a value of 2 (i.e. age group of 35+). This is not unexpected,
since it suggests that at younger ages, mothers are more keen to ensure the health of their
children. However with the advancement of age, there is a decrease in this tendency.
In case of medium standard of living the coefficient is found to be negative and
significant. This suggests that for those with this standard of living there will be less
tendency to get the children immunized, which is difficult to explain or justify.
(0.47)
Mother working status 1 -0.481
(-0.98)
Health card 1 -0.649
(-1.10)
Constant - 0.089
No. of variables - 204
LR chi2 - 102.47
Pseudo R2 - 0.2544

81
The coefficient is positive and significant for both values of caste, which indicates that
the trend towards immunisation will be higher for OBCs and those from the general
caste. Another way of looking it is that people from an SC/ST background will have less
urge for immunisation.
As far as religion is concerned, the coefficient is found to be positive and significant for
other religions, thus suggesting that followers of such religions will have a greater
tendency for getting their children immunised.
As per the immunization schedule provided by the District hospital of Sikkim that each
child or infant should provide the following vaccine at the age 5 years like
(i) Two dose of TT vaccine =(i.e. TT-1 for early in pregnancy, & TT-2 after 4
week of TT-1)
(ii) One dose of BCG = at birth or up to 1 year.
(iii) Four dose of OPV = (i.e. OPV-0 at birth or can be given up to 2 weeks, OPV-
1,2 and 3 at age 10 to 14 weeks but can be given up to 5 years)
(iv) Three dose of DPT = (i.e. DPT-1,2,& 3 at age 6, 10 & 14 but can be given up
to 2 years)
(v) One measles vaccine = (given at 9-12 months)
(vi) Vitamin-A = (At 9 months)
In this connection it is to be mentioned that, those children who had received a two doses
of TT vaccine, one doses of BCG, three doses of DPT, four doses of OPV, one measles
vaccine, and one dose of vitamin A/booster has been considered as a full immunized
children. Likewise children who had received at least three doses of vaccine from the
entire dose are considered as Partially immunised children. Those children who did not
received a single vaccine from the entire dose mentioned above come under the no
immunisation coverage.
At an overall level the LR Chi square value (36) is quite high and its probability value is
very small for all the categories, indicating that the model is a very good fit.

82
Chapter - 5
Conclusion Observation and Policy Prescriptions
5.1 Conclusion
Survival is the core of every nation. Long term survival of a nation necessitates
being strong in terms of health as well as wealth, i.e., economic well-being. Generally
however the focus is shifted away from health because of supposedly more important
issues like the environment, socio-economic aspects, demographics, etc. Child health
encompasses complete physical, mental, emotional and social well being of the child.
Researchers and policy makers are investigating the main causes of the problems and are
also trying to bring it to the attention of the government. The present study was based on
micro level study for analysing and investigating the problems associated with child
health. Socio-economic problems of the parents and environmental conditions play a
crucial role in ensuring the good health of the child.
The present study has used a secondary data mainly from National Health Family Survey
sources to know the child health care system in North-East (viz Arunachal Pradesh,
Assam, Tripura, Meghalaya, Manipur, Nagaland, Mizoram, and Sikkim) in general and
Sikkim in particular. Thus the simple descriptive statistics and CAGR analysis for the
period (1992-2006) has been used to examine the health care system in the North-East.
As per the findings of the study, the percentage change in full immunisation coverage is
relatively high in Sikkim, second only to Nagaland.
While in terms of socio-economic factors like mother education, among the eight north
east states, Mizoram is doing well in terms of women education level. Percentage change
in women’s education level in Sikkim is relatively less across all the categories as
compared to Mizoram. As per the results obtained from CAGR the trend in diseases
caused increased in all most all the states compared to the nation average over the period
1998-99.

83
The general view emerging from the study was that the problems encountered in ensuring
child health originated both from socio-economic issues as well as environmental factors.
However in rural areas most people are unable to take advantage of the healthcare system
due to the expenses involved; lack of awareness of the people is also an issue. The
condition of government hospitals is very pathetic with a poor management system. With
poor people avoiding treatments in government hospitals there is further decline in the
health of the people. In such a situation it is natural that the health of children is a major
casualty.
A perusal of the descriptive statistics shows that more than half of the respondents have
had their children fully immunised. However there is a significant proportion whose
children have been only partially immunised, or even with no immunization at all, with
almost equal numbers of people in both.
Coming to the number of children, the highest proportions are in favor of one or two
child families, with the percentages progressively falling downwards for higher number
of children.
Urban children have better immunisation coverage than rural children, possibly because
of better accessibility to health care facilities. With reference to caste the trend of
immunisation coverage is higher in favor of OBC and general category, the percentage
change in immunisation being higher for both the categories.
Coming to mother’s education level, immunisation coverage is twice more for mothers
with more than 10 years of schooling as compared to those who have less than 5 or less
years of schooling. Immunisation coverage varied substantially with socio-economic
status of household; while, the lower coverage of full immunisation among the children
of Hindu religion is probably because of some parents’ mistaken belief about the ill
effects of vaccination or in connection with religions faith. Beside the socio-economic
factors, possession of health card is also significantly associated with full immunisation
coverage in Sikkim.
In the view of the some experienced or knowledgeable respondents from the selected
areas the facilities available in rural areas are not sufficient for achieving a good health

84
for the child. There is also a lack of awareness regarding available vaccines as more than
half of the mothers only know the OPV vaccine. Religious beliefs and availability of
financial support also impact the health of the child. As per the above-mentioned
respondents some people are engaged in day to day work for fulfilling their children’s
needs as well as to protect them from diseases which ironically results in less time
devoted to their children.
As per the preceding findings the major factors leading to a child not being immunised
has often been found to be the mother’s age, mother’s education as well as income of the
parents. In general as the mother gets older she has a lower tendency towards getting the
child immunised. Again, with the higher education level of the mother the greater will be
the chance of the children being immunised, which was confirmed from the observations
in our study. During our study women in both the areas admitted that they were more
aware about child healthcare and all medical facilities are available in the respective
health centers which was not so in earlier times. Both pre-natal and post-natal care is
followed. During pregnancy they have to take all required medicines and vaccination,
while after birth they take their child for immunisation.
In earlier times women had to face many problems in immunizing their children but now
health centers have opened even in villages which monitor immunisation of every child
on time. Presence of PHCs in the villages has led to the decrease in death rates during
delivery. Advancements in the field of medicine and steps taken by the government
towards healthcare like immunisation and others medical facilities provided on time have
led to a decrease in the rate of polio and disabilities among children.
In general, the healthcare system has now improved in all almost all parts of Sikkim with
regard to child health problems like TT1, TT2 during pregnancy and diseases like BCG,
DPT, and measles etc which were not available earlier. Urban children had better
immunisation coverage than rural children probably because of better accessibility and
the success of supply side factors.

85
5.2 Policy and Prescriptions
Based on the findings, we would like to highlight certain implications for the
improvement of the child healthcare system in various places of Sikkim as well as for the
betterment of upcoming generation. Some suggestions regarding these issues (with
reference to child health care) are as follows.
• Improvement in quality of health care services, health infrastructure, health
workforce, and nutritional diet, etc. helps to reduce infant and maternal mortality
rate, while improvement in the quality of life helps to reduce fertility control and
population stabilisation.
• Village level health workers should increase the frequency of door to door
interaction with the people, specially with mothers; health care providers should
conduct the ward, Panchayat and block levels awareness programmes and medical
campaigns in every district of Sikkim.
• Generally, the awareness of most of the respondents is limited to polio vaccine;
hence there is a need for awareness campaigns. The health departments should
also enquired about the reasons for the careless attitude of the health workers
whose sole responsibility is to sensitise people about the different types of
vaccination schemes.
• All the health workers (like medical staff, nurses, in-charges, medical officers,
attendants etc.) should strengthen their leadership abilities so as to run the
respective institutions properly. Training facilities should provide to all the
workers as most of them have not received such training.
• Illiteracy is one of the reasons for people lagging behind in terms of awareness
level. In order to improve the awareness level regarding child health among the
citizens of Sikkim, education should be given topmost priority.
• While establishing health clinics or health centers, the government should look to
keep in mind factors like population size as well as distance.

86
Selected Bibliography
Abhishek, K & Mohanty, S. K. (2011). Socio-Economic differentials in childhood
immunization in India, Università degli Studi di Roma “La Sapienza” , 1(67): 1-19.
Arif, G.M. (2014). Child Health and Poverty in Pakistan, Pakistan Institute of
Development Economics, Islamabad, 3(43): 211-238.
Acharya, A & Paunio, M. K. (2007). Environmental Health and Child Survival,
Washington DC: Department of Public Health and Environment. The World Bank, 10
(117): 144-149.
Andrea, C & Senauer, B. (May, 2003). The Impact of the Special Supplemental Nutrition
Program for Women, Infants, and Children, American Journal of Agricultural
Economics, 2(85): 479-491.
Angus, C. A. (2005). Health and Wealth among the Poor: India and South Africa
compaired, American Economic Association, 2(95): 229-223.
Angus, D., & Drèze, J. (February 14, 2009). Food and Nutrition in India, Facts and
Interpretations, Economic & Political Weekly, 7(44): 42-65.
Anil, K. (March 2007). Economic Analysis of Diabetes Care, World Diabetes
Foundation, Lyngby, Denmark, 473-482.
Arif, G.M. (2014). Child Health and Poverty in Pakistan, Pakistan Institute of
Development Economics, Islamabad, 3(43): 211-238.
Government of India, Annual Report (2011-12). Ministry of Women and Child
Development. p-14.
Arif, G.M. (2014). Child Health and Poverty in Pakistan, Pakistan Institute of
Development Economics, Islamabad, 3(43): 211-238.
Banerji, D. (1973). Health Behaviors of Rural Populations and Impact of Rural Health
Services. Economic and Political Weekly, 51(8): 47-53.

87
Bredenkamp, C. Gupta., M, D. Lee., Y, K. Shekar., & Gragnolati, M.(2006). Integrated
child development scheme and Persistent Under nutrition, Strategies to Enhance the
Impact, Economic and Political Weekly, 12(41): 1193-1201.
Bajpai, Nirupam., and Dholakia, H. Ravindra. (2011). Improving the performance of
Accredited Social Health Activists, Columbia Global Centers, South Asia, Columbia
University, 4(1): 42-49.
Devcharan, S. (2008). Environmental Health and Child Survival, Environmental Health,
Malnutrition and Child Health, Washington. The World Bank Washington D.C., 4(46):
1122-1130.
Economic Survey (2015-2016). Government of India Ministry of Finance, Department of
Economics Affairs, Economic Division February (2016), volume II.
Gujarati, Damador.N., and Sangeeta. (2008). Basic Econometrics, Fourth edition, Tata
McGraw-Hill New Delhi.United state military Academy, West Point.
Gok, W. Virginia. (1983). Sibling Data and the Family Background Influence on Child
Health, Medical care lippincott Williams and Wilkins, 6(12): 630-638.
Gursoy, A., (1994). Comment On Education and Infant and Child Mortality: Gender,
Education and Child Health, National Centre for Epidemiology and Population Health
(NCEPH) Australian National University, 2(4): 183-189.2.
Heeju, S. (2007). Child Health in Peru: Importance of Regional Variation and
Community Effects on Children's Height and Weight. Journal of Health and Social
Behavior, 4(48): 418-433.
Harold, A., Konde-Lule, J. Sebuliba., Bundy, D & Hall, A. (July 2006). Effect on
Weight Gain of Routinely giving Albendazole to Preschool Children during Child Health
Days in Uganda ,British Medical Journal ,7559(333): 122-124.

88
Hollingsworth, B., and Stuart, P. j. (2008). Efficiency Measurement in Health and Health
Care, London School of Hygienic and Tropical Medicine, UK, School of Public Health,
University of California, USA.
Imre, B. Dozsa., C,Kal. Z., Nagy, L. Boresek., B, Brandtmuller. A., et al. (July 2006).
Development of Health Economics in Hungery between (1990-2006), The European
Journal of Health Economics , 1(7): s4-s6."
Inchani, R. L., and Lai, D. (2008). Association of Educational Level and Child Sex Ratio
in Rural and Urban India, Springer, Social Indicator Research, 1(86): 69-81.
Jitendra, S. (2007). Economic Burden of Diabetes, Health Economy , Chapter 45,
John, B. (May 26, 1990). Child Health Surveillance, British Medical Journal , 6738(300):
1381-1382.
Johansen, S. Anne., Leibowitz, Arleen., and Waite, J. Linda. (1996). The Importance of
Child-Care Characteristics to Choice of Care, Journal of Marriage and Family, National
Council on Family Relations, 3(58): 759-772.
Kenneth, H., & Upchurch, D. M., (March 1995). Gender Differences in Child Health:
Evidence from the Demographic and Health Surveys,Population and Development
Review, 1(21): 127-151.
Khan, M. E., Hazra, A., and Bhatnagar, Isha. (2010). Impact of Janani Suraksha Yojana
on selected family Health behaviors in Rural Uttar Pradesh, Indian Journal of family
welfare, (56).
Kanjilal, B., Mazumdar, G., Papiya, M., and Rahman, Hafizur. M. (2005). Nutritional
Status of Children in India: Household Socio-Economic Condition as the Contextual
Determinant, Institute of Health Management Research, Kolkata, India, International
Journal of Equity in Health, 19(9).

89
Kumar, A., and Mohanty, K. Sanjay. (2011). Socio-economic differentials in childhood
immunization in India, 1992-2006, International institute for population sciences,
Mumbai, DOI 10.1007/s 12546-011-9069-y, 8(46): 301-322.
Lemon, James. A., Charles, Bauer. R., Sheldon, Korones. B., Papile, Lu-Ann., Stoll, J.
B. V.J., Temprosa, M., Wright, L. Linda., Ehrenkranz, A. Richard., Fanaroff , A. Avroy.,
and Waldemar ,Carlo. (2001). “Very Low Birth Weight Outcomes of the National
Institute of Child Health and Human Development, Neonatal Research Network, January
1995 Through December 1996, Pediatrics (107)1.
Mahmud, K. M., Khan, Walker., Rushby, Fox. D., Cutts, F., & Akramuzzaman, S.
(December 2004). Cost of Delivering Child Immunization Services in Urban Bangladesh:
A Study Based on Journal of Health, Population and Nutrition, 4(22): 404-412.
Mathew, V. R. (2011). A Critical Study of the Efficacy of Primary Health Centers for the
Promotion of Community Health in Kerala with Special Reference to Ernakulam
Districts, School of Gandhi Thought and Development Studies, Kerala.
Manu, K. N.(2006). Child Survival Programmes Revisited, Economic and Political
Weekly, 1(41): 28-30.
Moatula, A., & Lhungdim, H. (2014). Re-Estimating Malnourishment and Inequality
among Children in North-East India, Economic & Political Weekly, 1(61), Vol XlIX No.
6.
Noonan, K., Reichman, E. Nancy., and Corman, Hope. (2005). New Fathers' Labor
Supply: Does Child Health Matter, Social Science Quartely, Wilry, 4(86): 1399-1417.
National Family Health Survey (1992-2005), India: International Institute for Population
Science.
Population Commission, (2011), District wise Demographic Indicators, National
Commission on Population, Government of India, New Delhi.
Peter, S. (March 2010). Estimation of child malnutrition in India, Economic and political
weekely , 12(45): 14-18.

90
Philip, M. (2004). Health Economics Development, Malnutrition and Dietary Protein,
The World Bank Washington D.C, World Bank.,
Pandey, S.A., Mondal, K.S., Gupta, N. D., Gosh, Manna. B.S., Das, S. and Bhattacharya,
S.K. (2003). Gender Differences in Healthcare-Seeking during common Illnesses in a
Rural Community of West Bengal, India, Journal of Health Population and Nutrition,
Epidemiology Division, National Institute of Cholera and Enteric Diseases, P-33, C.I.T.
Road, Scheme XM,
Piovesan,C., Leopolda, Jose., Guedes, S. r., and Ardenghi, M. T. (2010). Impact of
Socio-economic and Clinical Factors on Child Oral Health-Related Quality Of Life
(Cohrqol), Quality of Life Research, 9(10): 1359-1366.
Pitt, M.M., and Rosenzweing, R. Mark. (1990). Estimating the Intrahousehold Incidence
of Illness: Child Health and Gender-Inequality in the Allocation of Time, Wiley for the
Economics Department of the University of Pennsylvania and Institute of Social and
Economic Research, Osaka University, 4(31): 969-989.
Ram, N. P., & Upadhyay, N. (2012). Status of Health Care System in Sikkim, India.
International journal of cross-culture studies , 8(15): 15-19.
Rudolf, T. H., Costales, M., & Flavier. J. (Feb 1997). Poliomyelitis Eradication and its
Impact on Primary Health Care in the Philippines. The Journal of Infectious Diseases,
1(175): S272-S276.
Sweetman, C. (2002). Gender Development and Health, Teaching Ability Gender ,
Health and Child Develoment ,Experence and Challenges, 24(83).
Spence, M. Lewis. (2009). Health and Growth. The International School Bank for
Reconstruction and Development. The World Bank.
Sarkhel, J., and Bhukta, B. (2005). An Introduction to Mathematical Techniques for
Economic Analysis, Department of Commerce, Burdwan University, Netaji
Mahavidyalaya, Arambagh.

91
Sisk, E. Jane. (2008). Does Child Labor Affect School Attendance and School
Performance, Multi Country Evidence on SIMPOC Data.
Singh, Kumar. P. (2013). Trends in Child Immunization across Geographical Regions in
India: Focus on Urban-Rural and Gender Differentials, International Institute for
Population Sciences, Mumbai, India, PLoS ONE 8(9).
Srinivasan, K. Shekhar., and Arokiasamy, P. (2007). Reviewing Reproductive and Child
Health Programmes in India, Economic and Political Weekly , 27/28(42),2931-
2935+2937-2939.
Tewatie, K.S., and Roy, P. (1999). Mother Child Health,Impact of Womens Work , A
correlation between childhealth and mother education, journal of health economy,4(32):
112-120.
Thomas, P. J., George, D. J., Edward, S.S., & Anne, K.(2003). Promoting Childrens
Health, Linking System of Care to Promote Health, New York London: The Guilford
Press New York London.
Tobin, J. (1958). Estimation of the Relationship for linear Dependent variables:
Econometrica: 24-36.
Economic Survey (2015-2016). Government of India Ministry of Finance, Department of
Economics Affairs, Economic Division February 2016, volume II.
Turney, Kristin. (2011). Maternal Depression and Childhood Health Inequalities, Journal
of Health and Social Behavior, American Sociological Association, 3(52): 314-332.
Urquieta- Salomon, J.E., and Villarreal, H.J. (2015). Evolution of Health Coverage in
Mexico, evidence of progress and challenges in the Mexican health system, Health Policy
and Planning , 28-36.
Virginia, L., & Gok, W.(1983). Sibling Data and the Family Background Influence on
Child Health, Journal of Medical Care , 6(21): 630-638.

92
Weisman, S. Carol (1997). Changing Definition of Women’s Health: Implications for
Health care and Policy, Journal of Maternal and Child health, 1(3): 179-189.
Yeravdekar, Rajiv., Yeravdekar, vidya Rajiv., Tutakne, M. A. Bhatia., Neeta, P and
Tambe Murlidhar. (2013). Strengthening of Primary Health Care: Key to deliver
inclusive Health Care, Indian Journal of Public Health, and Vol. 57(2).
Website Consulted:
National Rural Health Mission, (2004). Government of India, obtained from http; //
nrhm.gov.in / nrhm-a / maternal-health / Janani-suraksha-yojana on 26-07-2016.
Child Healthcare programme in India’, (2015), retrieved from http; // www.ihp.org /
healthcare-India Accessed on 26.07.2016.
Mission Indradhanus Programme (2014), retrieved from currentaffairs.gktoday.ingovt-
mission-indradhnus-immnuisation-kids-against-7-vaccine-preventabile-diseases accessed
on 2-08-2016.
http://www.nrhm.gov.in/nrhm-statewise-information /arunachal pradesh.html Accessed on 3-
08-2016
http://www.nrhm.gov.in/nrhm-statewise-information /assam.html Accessed on 3-08-2016
http://www.nrhm.gov.in/nrhm-statewise-information /manipur. html Accessed on 3-08-2016
http://www.nrhm.gov.in/nrhm-statewise-information /meghalaya.html Accessed on 3-08-
2016
http://www.nrhm.gov.in/nrhm-statewise-information /tripura.html Accessed on 3-08-2016
http://www.nrhm.gov.in/nrhm-statewise-information /nagaland.html Accessed on 3-08-2016
http://www.nrhm.gov.in/nrhm-statewise-information/mizoram.html Accessed on 3-08-2016
http://www.nrhm.gov.in/nrhm-statewise-information /sikkim.html Accessed on 3-08-2016
Child Healthcare programme in India’, (2015), retrieved from http; // www.ihp.org /
healthcare-India on 26.07.2016

93
Appendix
Questionnaire
1. Location: □Rural □Urban Name of the village:
2. GPU:
3. Block:
4. Name of the Respondent :
5. Gender : □Male □Female
6. Age (in years):
7. Religion :
i. Hindu
ii. Christian
iii. Others
8. Cast:
i. SC/ST
ii. OBC
iii. General
Questioner related to mother health
7. Mother’s education (year of schooling):
8. Exposure to mass media: yes/no
9. Working status of mother: yes/no

94
10. Anti-natal care check up :Yes/No
11. Do you receive health card? Yes/No
12. Age of mother:
13. Standard of living:
Details of the household Member:
14. Total number of room available:
15. Total number of family member:
17. Total number of working member:
18. Gender of household head:
i. Govt
ii. Private
iii. Self employment
iv. Other (specify)
0. Low
i. Medium
ii. High
Total no of
children
Relation with
household head
Sex of child Age of child Education
background

95
19 Education levels of household head:
20. Family status: APL / BPL
21. Occupation of household head:
Monthly Expenditure Details on dietary food
22. Family monthly consumption expenditure:
i. Govt
ii. Private
iii Farmer
iv.Businessman
v.Other (specify)
Sl.no Items Expenditure
1 Green vegetables
2 Eggs, milk, meat
3 Fruits, edible oils,
spices etc
4 Junk food
5 Medical
6 Clean and hygienic
7 Education

96
23. Total income of the family:
24. Income of the head of the family:
Question Related to the child village
25. Water facility available in your home? Yes/No
26. Toilet facility available in your home? Yes/No
27. Do you have your own house? Yes/No
□ Kutccha house □ Pukka house
28. What kind of fuel is used for cooking purpose?
i. Gas
ii. Wood
iii. Charcoal
Iv other
29. Tick if this is available near to your home:
i. PHC
ii. CHCs
iii. Sub-centres
iv .private clinic
Note: if the above mention items is not available near to village
30. Is your home accessible to road? Yes / No
If yes: □ pukka road □ Kuchha road

97
31. Tick whichever is available: □Bus service □Service vehicles □Taxi □All
Question Related to Child health
32. Birth order of the child:
33. Weight of the child:
34. Breast feeding of child: Yes / No
If yes: Duration of breastfeeding
35. Birth place of child: i. □ Hospital ii. □Home
36. Which hospital: i. □Government ii. □Private
37. Distance from hospital:
38. How many time did you visit to doctors in a month
39. Did he / she is immunized: □Yes . □No
If yes:
i. Full immunize
ii. Partial immunize
iii. No immunize
i. 1st
ii. 2nd
iii. 3rd
iv. 4th
i. 2-3 kg
ii. 4 kg
iii. 5kg +

98
40. Do you have an idea about to wash hand before and after food? Yes / No
41. How many times you take a bath in a week?
42. What types of diseases causes a child health more?
i. Fever
ii. Diheorriea
iii. Malaria
iv. Typhoid
v. Any Other
specify
43. Reason for causing diseases