child labour and youth employment outcomes in ethiopia...
TRANSCRIPT

POLICY OPTIONS FOR REDUCING CHILD LABOUR AND PROMOTING SCHOOLING IN YEMEN
CHILD LABOUR AND YOUTH CHILD LABOUR AND YOUTH EMPLOYMENT OUTCOMES EMPLOYMENT OUTCOMES
IN IN ETHIOPIAETHIOPIA
Furio RosatiFurio Rosati

Child labour and Child labour and youthyouth employmentemployment
in in EthiopiaEthiopia
MAIN POINTS OF DISCUSSIONMAIN POINTS OF DISCUSSION
Youth employment begins at 8 years of age (for some but large groups)Youth enter the labour market with very low level of human capitalEducated youth face specific but not dramatic problems in urban areasRelevance of household wealth for labour market outcomes (weak)Relevance of local labour market conditions (robust)Policy questions
Child labour and Child labour and youthyouth employmentemployment
in in EthiopiaEthiopia
Section 1.Section 1.
CHILD LABOUR IN ETHIOPIACHILD LABOUR IN ETHIOPIA

Child labour and Child labour and youthyouth employmentemployment
in in EthiopiaEthiopia
Source: UCW calculations based on Ethiopia Labour Force Survey 2Source: UCW calculations based on Ethiopia Labour Force Survey 200100136,836,849,749,710010030,330,316,816,820,020,032,932,955--14 years14 years52,652,663,463,410010011,111,127,127,125,525,536,336,31010--14 years14 years252539,439,410010044,744,79,19,115,915,930,330,355--9 years9 years
in schoolin school(2)+(3)(2)+(3)
in workin work(1)+(3)(1)+(3)TotalTotal
(4)(4)Neither in Neither in school nor school nor
in workin work
(3)(3)Combining Combining work and work and
schoolschool
(2)(2)Only in Only in schoolschool
(1)(1)Only inOnly in
workworkAge Age GroupGroup
Table 1. Child activity breakdown, by age groupTable 1. Child activity breakdown, by age group
the rate of child involvement in economic the rate of child involvement in economic activity is among the highest in the world; activity is among the highest in the world;
childrenchildren’’s school enrolment, on the other s school enrolment, on the other hand, remains very low, with obvious hand, remains very low, with obvious consequences for human capital accumulationconsequences for human capital accumulation
Section 1.Section 1. CHILD LABOUR CHILD LABOUR

Child labour and Child labour and youthyouth employmentemployment
in in EthiopiaEthiopia
childrenchildren’’s work is primarily a rural s work is primarily a rural phenomenon in Ethiopiaphenomenon in Ethiopia
differences by sex are large in rural areas but differences by sex are large in rural areas but not in urban ones; not in urban ones;
0
20
40
60
80
100
5 6 7 8 9 10 11 12 13 14
Male
Female
Male
Female
% c
hild
ren
invo
lved
in
% c
hild
ren
invo
lved
in
econ
omic
act
ivity
ec
onom
ic a
ctiv
ity
ageage in in yearsyears
RURALRURAL
URBANURBAN
Section 1.Section 1. CHILD LABOUR CHILD LABOUR
Child labour and Child labour and youthyouth employmentemployment
in in EthiopiaEthiopia
Section 2.Section 2.
LABOUR MARKET STATUS OF LABOUR MARKET STATUS OF ETHIOPIAN YOUNG PEOPLEETHIOPIAN YOUNG PEOPLE
Child labour and Child labour and youthyouth employmentemployment
in in EthiopiaEthiopiaSection 2.Section 2. LABOUR MARKET STATUSLABOUR MARKET STATUS
OF ETHIOPIAN YOUTHOF ETHIOPIAN YOUTH
19,819,812,112,168,168,173,973,914,014,068.168.112,112,168.168.11818--19 years19 years
Source: UCW calculations based on Labour Force Survey 2001 *Source: UCW calculations based on Labour Force Survey 2001 *
17.8 17.8 18.4618.4671.271.276.0 76.0 13.013.04.94.97.4 7.4 11.0211.0263.7 63.7 1515--24 years24 years21,021,04,3*4,3*74,774,780.6 80.6 15,115,16,06,0----4,34,374.674.62020--24 years24 years
10,710,746,946,968,468,470.7 70.7 8,58,52,22,226,126,120,820,842,442,41515--17 years17 years
JoblessJobless(4)+(5)(4)+(5)
In In educationeducation
(2)+(3)(2)+(3)EmployedEmployed
(1)+(3)(1)+(3)In labour In labour
forceforce(1)+(3)+(4)(1)+(3)+(4)
(5)(5)InactiveInactive
(4)(4)UnemployUnemploy--
eded
(3)(3)Combining Combining education education
and and employemploy--
mentment
(2)(2)Only in Only in
educationeducation
(1)(1)Only in Only in
employmenemploymentt
Age Age GroupGroup
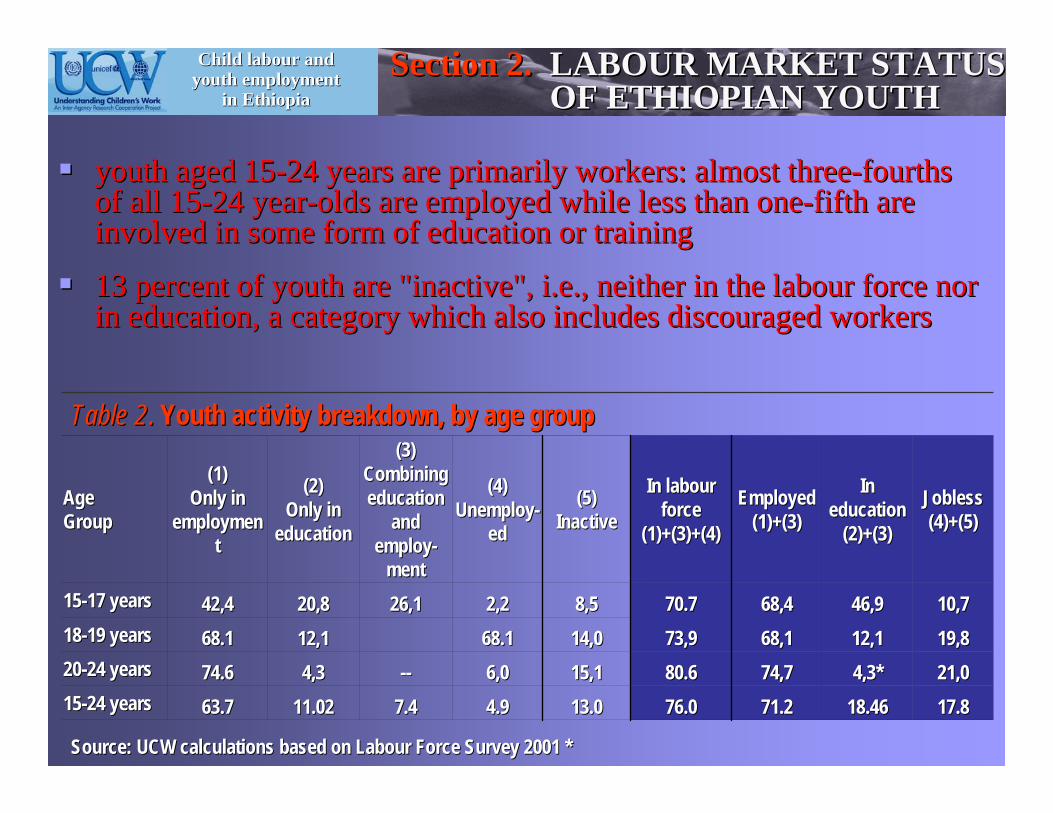
Table 2Table 2.. Youth activity breakdown, by age groupYouth activity breakdown, by age group
youth aged 15youth aged 15--24 years are primarily workers: almost three24 years are primarily workers: almost three--fourths fourths of all 15of all 15--24 year24 year--olds are employed while less than oneolds are employed while less than one--fifth are fifth are involved in some form of education or traininginvolved in some form of education or training
13 percent of youth are "inactive", i.e., neither in the 13 percent of youth are "inactive", i.e., neither in the labourlabour force nor force nor in education, a category which also includes discouraged workersin education, a category which also includes discouraged workers

Child labour and Child labour and youthyouth employmentemployment
in in EthiopiaEthiopiaSection 2.Section 2. LABOUR MARKET STATUSLABOUR MARKET STATUS
OF ETHIOPIAN YOUTHOF ETHIOPIAN YOUTH
levels of measured unemployment are relatively low among levels of measured unemployment are relatively low among Ethiopian young people Ethiopian young people -- 6.4% of 156.4% of 15--24 year24 year--olds in the olds in the labourlabourforce is unemployed force is unemployed
youth living in cities and towns are much more likely to be youth living in cities and towns are much more likely to be unemployed than rural youth, underscoring the different nature ounemployed than rural youth, underscoring the different nature of f the urban and rural job marketsthe urban and rural job markets
Source: UCW calculations based on Ethiopia Labour Force Survey 2Source: UCW calculations based on Ethiopia Labour Force Survey 2001001
17.017.013.213.24.64.63.73.7RuralRural21.421.411.711.718.618.69.79.7UrbanUrbanResidResid
enceence
27.627.621.521.58.98.96.16.1FemaleFemale6.76.73.23.24.04.03.43.4Male Male
SexSex
17.817.813.013.06.46.44.94.9Total Total JoblessnessJoblessness(1)(1)InactivityInactivity(1)(1)Unemployment Unemployment
raterateUnemployment Unemployment
ratio ratio Background Background characteristicscharacteristics
Table 3.Table 3. Youth unemployment, inactivity and jobless indicators, by sex aYouth unemployment, inactivity and jobless indicators, by sex and residencend residence

Child labour and Child labour and youthyouth employmentemployment
in in EthiopiaEthiopiaSection 2.Section 2. LABOUR MARKET STATUSLABOUR MARKET STATUS
OF ETHIOPIAN YOUTHOF ETHIOPIAN YOUTH
Differences in unemployment levels begin to emerge at Differences in unemployment levels begin to emerge at age 17 and peak at age 23, when 20 percent of urban youth age 17 and peak at age 23, when 20 percent of urban youth are unable to find work against only 3 percent of their rural are unable to find work against only 3 percent of their rural counterparts counterparts
% u
nem
ploy
ed
% u
nem
ploy
ed
0
5
10
15
20
15 16 17 18 19 20 21 22 23 24
Urban
Rural
ageage in in yearsyears
Child labour and Child labour and youthyouth employmentemployment
in in EthiopiaEthiopiaSection 2.Section 2. LABOUR MARKET STATUSLABOUR MARKET STATUS
OF ETHIOPIAN YOUTHOF ETHIOPIAN YOUTH
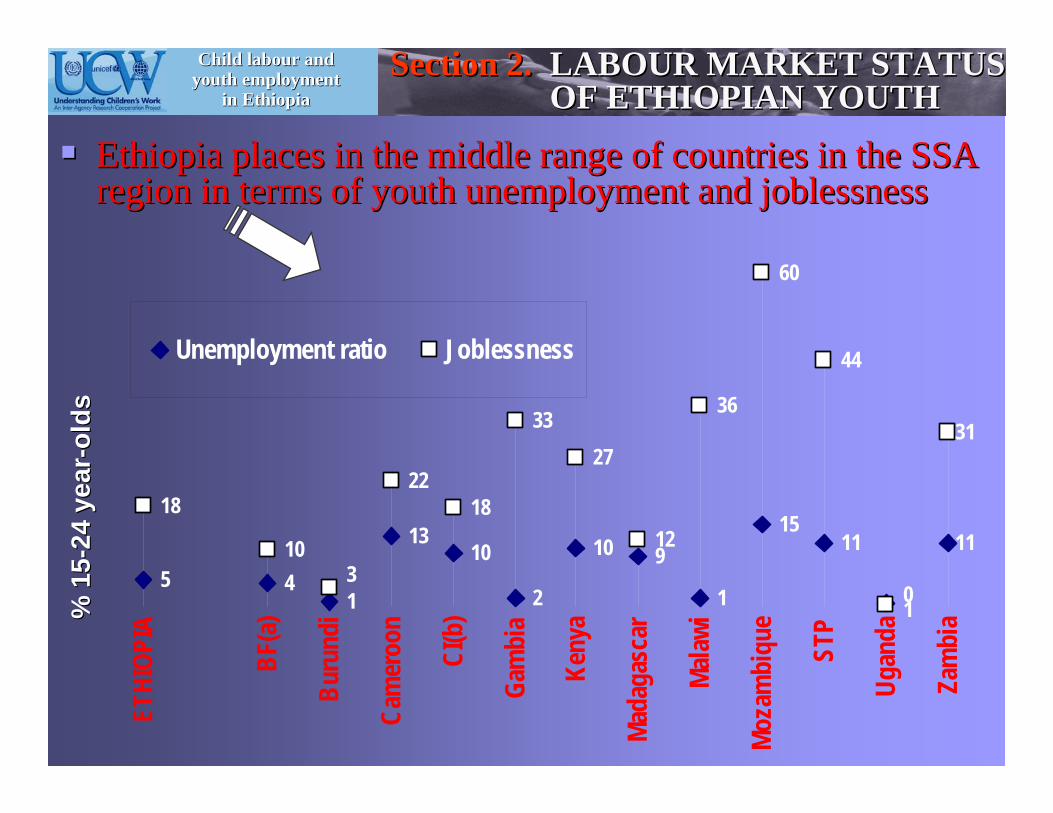
Ethiopia places in the middle range of countries in the SSA Ethiopia places in the middle range of countries in the SSA region in terms of youth unemployment and joblessness region in terms of youth unemployment and joblessness
5 41
1310
2
10 9
1
1511 11
18
10
2218
3327
12
36
60
44
31
13
0
ETHI
OPIA
BF(a)
Buru
ndi
Cam
eroo
n
CI(b
)
Gam
bia
Keny
a
Mada
gasc
ar
Malaw
i
Moza
mbi
que
STP
Ugan
da
Zam
bia
Unemployment ratio Joblessness
% 1
5%
15 --
24 y
ear
24 y
ear -- o
lds
olds

Child labour and Child labour and youthyouth employmentemployment
in in EthiopiaEthiopiaSection 2.Section 2. LABOUR MARKET STATUSLABOUR MARKET STATUS
OF ETHIOPIAN YOUTHOF ETHIOPIAN YOUTH
data on hours worked suggest that youth data on hours worked suggest that youth underemploymentunderemploymentmay be more prevalent in rural areasmay be more prevalent in rural areas
hrs.
wor
ked
in la
st 7
day
s hr
s. w
orke
d in
last
7 d
ays
20
25
30
35
40
45.10
-14
15-19
20-24
25-29
30-34
35-39
40-44
45-49
50-54
55-59
60-64 65
+
Urban Rural
ageage rangesrangesSource: UCW calculations based on Ethiopia Labour Force Survey 2Source: UCW calculations based on Ethiopia Labour Force Survey 2001001

Child labour and Child labour and youthyouth employmentemployment
in in EthiopiaEthiopiaSection 2.Section 2. LABOUR MARKET STATUSLABOUR MARKET STATUS
OF ETHIOPIAN YOUTHOF ETHIOPIAN YOUTH
evidence suggests that much of urban youth evidence suggests that much of urban youth unemployment is structural rather than transitory in natureunemployment is structural rather than transitory in nature
in addition, the share of youth with very long spells of in addition, the share of youth with very long spells of unemployment increases with ageunemployment increases with age
% o
f une
mpl
oyed
duration of unemployment
Source: 2003 Urban Biannual Employment Unemployment Survey (UBEUSource: 2003 Urban Biannual Employment Unemployment Survey (UBEUS), S),
Child labour and Child labour and youthyouth employmentemployment
in in EthiopiaEthiopiaSection 2.Section 2. LABOUR MARKET STATUSLABOUR MARKET STATUS
OF ETHIOPIAN YOUTHOF ETHIOPIAN YOUTH
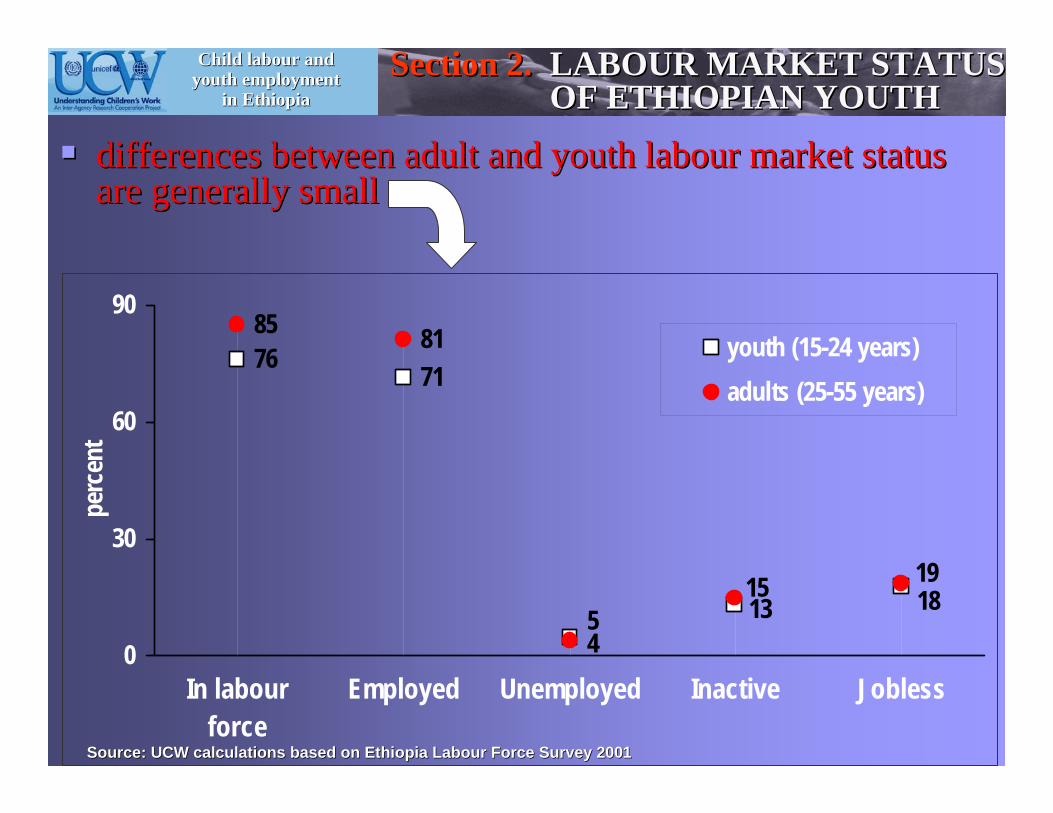
differences between adult and youth differences between adult and youth labourlabour market status market status are generally smallare generally small
Source: UCW calculations based on Ethiopia Labour Force Survey 2Source: UCW calculations based on Ethiopia Labour Force Survey 2001001
76 71
85 81
518131915
40
30
60
90
In labourforce
Employed Unemployed Inactive Jobless
perc
ent
youth (15-24 years)adults (25-55 years)
Child labour and Child labour and youthyouth employmentemployment
in in EthiopiaEthiopiaSection 2.Section 2. LABOUR MARKET STATUSLABOUR MARKET STATUS
OF ETHIOPIAN YOUTHOF ETHIOPIAN YOUTH
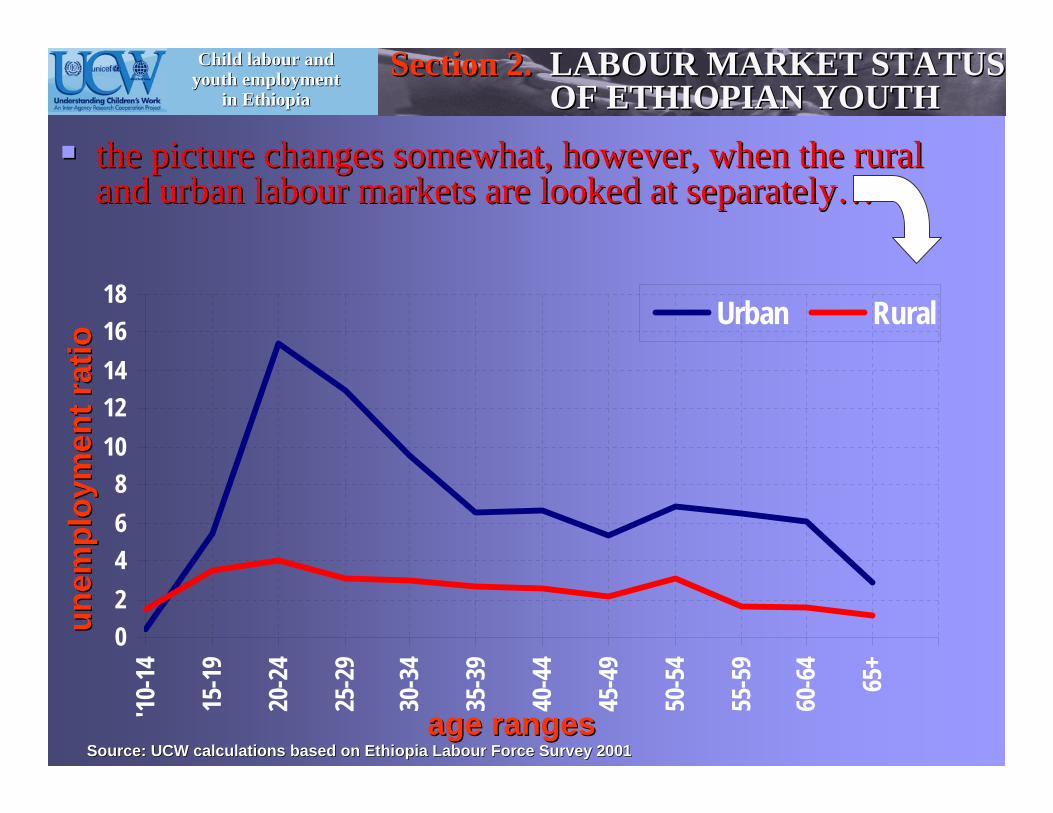
the picture changes somewhat, however, when the rural the picture changes somewhat, however, when the rural and urban and urban labourlabour markets are looked at separatelymarkets are looked at separately……
unem
ploy
men
t rat
io
unem
ploy
men
t rat
io
02468
1012141618
'10-1
4
15-1
9
20-2
4
25-2
9
30-3
4
35-3
9
40-4
4
45-4
9
50-5
4
55-5
9
60-6
4
65+
Urban Rural
age rangesage rangesSource: UCW calculations based on Ethiopia Labour Force Survey 2Source: UCW calculations based on Ethiopia Labour Force Survey 2001001
Child labour and Child labour and youthyouth employmentemployment
in in EthiopiaEthiopiaSection 2.Section 2. LABOUR MARKET STATUSLABOUR MARKET STATUS
OF ETHIOPIAN YOUTHOF ETHIOPIAN YOUTH
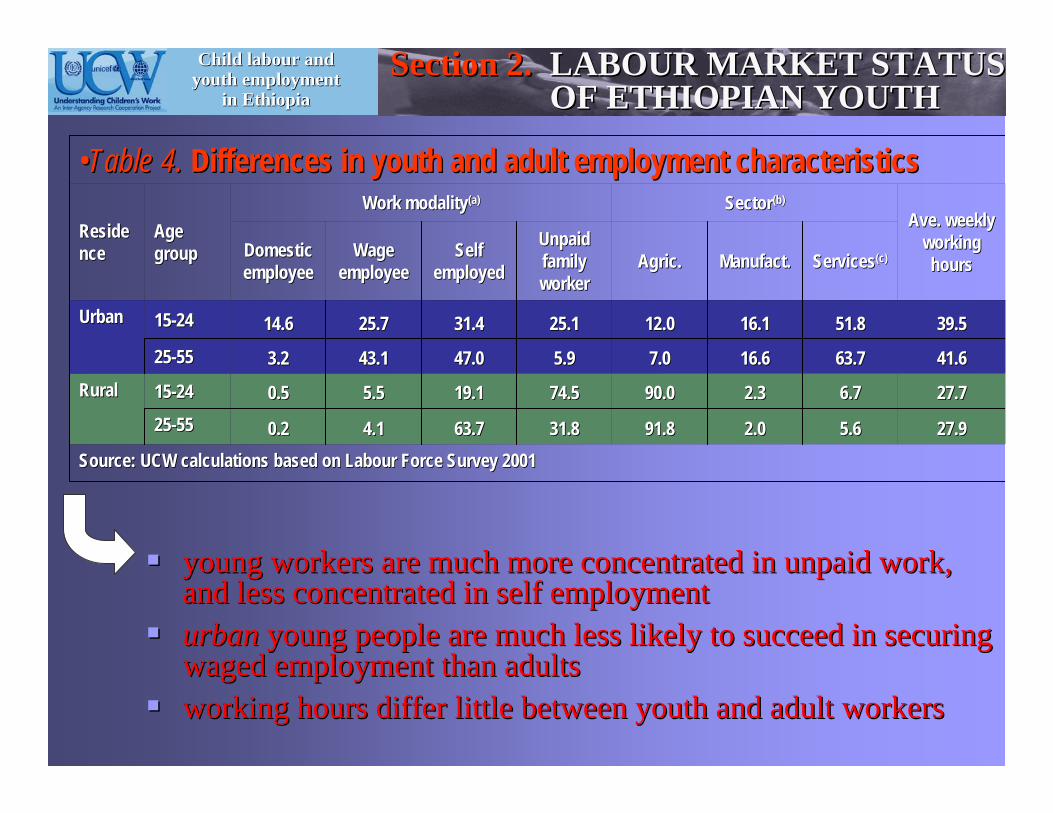
young workers are much more concentrated in unpaid work, young workers are much more concentrated in unpaid work, and less concentrated in self employmentand less concentrated in self employmenturbanurban young people are much less likely to succeed in securing young people are much less likely to succeed in securing waged employment than adults waged employment than adults working hours differ little between youth and adult workersworking hours differ little between youth and adult workers
Source: UCW calculations based on Labour Force Survey 2001Source: UCW calculations based on Labour Force Survey 200127.927.95.65.62.02.091.891.831.831.863.763.74.14.10.20.22525--55 55 27.727.76.76.72.32.390.090.074.574.519.119.15.55.50.50.51515--2424RuralRural41.641.663.763.716.616.67.07.05.95.947.047.043.143.13.23.22525--55 55 39.539.551.851.816.116.112.012.025.125.131.431.425.725.714.614.61515--24 24 UrbanUrban
ServicesServices(c(c))ManufactManufact..Agric.Agric.Unpaid Unpaid family family workerworker
Self Self employedemployed
Wage Wage employeeemployee
Domestic Domestic employeeemployee
Ave. weekly Ave. weekly working working hourshours
SectorSector(b(b) ) Work Work modalitymodality(a(a))
Age Age groupgroup
ResideResidencence
••Table 4.Table 4. Differences in youth and adult employment characteristicsDifferences in youth and adult employment characteristics

Child labour and Child labour and youthyouth employmentemployment
in in EthiopiaEthiopia
Section 3.Section 3.
TRANSITIONS TO WORKTRANSITIONS TO WORK

Child labour and Child labour and youthyouth employmentemployment
in in EthiopiaEthiopia
the average ages of school leaving and job entry (calculated on the average ages of school leaving and job entry (calculated on the the basis of estimated probabilities) indicate that the transition fbasis of estimated probabilities) indicate that the transition from rom school to work school to work begins at a very late age (19,4 years)begins at a very late age (19,4 years) and is and is relatively long in duration (4 years)relatively long in duration (4 years)
this can be seen more clearly by looking at the transition in this can be seen more clearly by looking at the transition in Ethiopia with the context of the SSA region as a wholeEthiopia with the context of the SSA region as a whole……
Section 3.Section 3. TRANSITIONS TO TRANSITIONS TO WORK WORK
Notes: (1) Estimated probabilities calculated on the basis of thNotes: (1) Estimated probabilities calculated on the basis of the age at which work participation rate is at its maximume age at which work participation rate is at its maximumSource: UCW calculations based Ethiopia Labour Force Survey 2000Source: UCW calculations based Ethiopia Labour Force Survey 2000
4,024,0223,4223,4219,419,4yearsyears
Average age of Average age of entering into work entering into work for the first timefor the first time
average age of average age of dropping out dropping out
Transition Transition durationduration
End point of End point of transitiontransition
Beginning point Beginning point of transition of transition
Children ever in schoolChildren ever in school••Table 4.Table 4. School to work transition pointsSchool to work transition points(1)(1)
A. TRANSITIONS FROM SCHOOL TO WORKA. TRANSITIONS FROM SCHOOL TO WORK

Child labour and Child labour and youthyouth employmentemployment
in in EthiopiaEthiopia
19,4
15 16 17 18 19 20 21 22 23 24 25
Burkina FasoBurundi
CameroonCote d’Ivoire
GambiaKenya
MadagascarMalawi
MozambiqueSTP
UgandaZambia
ETHIOPIA
Source: Source: UCW calculations based Ethiopia UCW calculations based Ethiopia LabourLabour Force Survey 2001 and World Bank Standard Files and Standard InForce Survey 2001 and World Bank Standard Files and Standard Indicators (SFSI) datasetsdicators (SFSI) datasets
ETHIOPIAETHIOPIA
years
ave. school ave. school dropdrop--out ageout ageave. age for entering ave. age for entering work for 1work for 1°° timetimeave. duration of ave. duration of transition transition
23,4
Section 3.Section 3. TRANSITIONS TO TRANSITIONS TO WORK WORK

Child labour and Child labour and youthyouth employmentemployment
in in EthiopiaEthiopiaSection 3.Section 3. TRANSITIONS TO TRANSITIONS TO
WORK WORK
the characteristics of the transition appear to depend the characteristics of the transition appear to depend significantly on both residence and sex, and on the significantly on both residence and sex, and on the interaction between the twointeraction between the two
17,5
19
18,8
20
19,5
21,8
23,8
23,8
17 18 19 20 21 22 23 24
Source: UCW calculations based on Ethiopia Labour Force Survey 2Source: UCW calculations based on Ethiopia Labour Force Survey 2001001
years
female, ruralfemale, rural
male, ruralmale, rural
female, urbanfemale, urban
male, urbanmale, urban
ave. school ave. school dropdrop--out ageout ageave. age for entering ave. age for entering work for 1work for 1°° timetimeave. duration of ave. duration of transition transition

Child labour and Child labour and youthyouth employmentemployment
in in EthiopiaEthiopiaSection 3.Section 3. TRANSITIONS TO TRANSITIONS TO
WORK WORK
the majority of Ethiopian 15the majority of Ethiopian 15--24 year24 year--olds never enter school, olds never enter school, transiting instead directly from inactivity to the transiting instead directly from inactivity to the labourlabour forceforceaverage age at first job for this group, at 8 years, is low relaaverage age at first job for this group, at 8 years, is low relative to tive to other SSA countriesother SSA countries
Source: UCW calculations based on Ethiopia Labour Force Survey 2Source: UCW calculations based on Ethiopia Labour Force Survey 2001001
B. TRANSITIONS DIRECTLY TO WORKB. TRANSITIONS DIRECTLY TO WORK
8 8,4
10,2 11
,2 11,5
11,3
14,8
12,7
17,1
16,3
13,8 14
,5
68
1012141618
ETHI
OPIA BF
Buru
ndi
Cam
eroo
n
CI(b
)
Gam
bia
Keny
a
Malaw
i
Moza
mbi
que
STP(
c)
Ugan
da
Zam
bia
Ave
. age
at f
irst j
obA
ve. a
ge a
t firs
t job

Child labour and Child labour and youthyouth employmentemployment
in in EthiopiaEthiopia
Section 4.Section 4.
HUMAN CAPITAL AND YOUTH LABOUR HUMAN CAPITAL AND YOUTH LABOUR MARKET OUTCOMESMARKET OUTCOMES

Child labour and Child labour and youthyouth employmentemployment
in in EthiopiaEthiopia
human capital levels among Ethiopian youth are very low: 61% of human capital levels among Ethiopian youth are very low: 61% of has has never entered school force and an additional 16% has only primarnever entered school force and an additional 16% has only primary y educationeducationdifference by residence in educational attainment, however, are difference by residence in educational attainment, however, are very very largelarge
Source: UCW calculations based on Ethiopia Labour Force Survey 2Source: UCW calculations based on Ethiopia Labour Force Survey 2001001
Source: UCW calculations based on Labour Force Survey 2001Source: UCW calculations based on Labour Force Survey 20017,57,51,31,334,934,9higher educationhigher education
3,43,41,21,213,313,3completed lower secondarycompleted lower secondary
11,611,68,78,724,024,0not completed lower secondary not completed lower secondary
16,016,016,916,912,112,1primary or lessprimary or less
61,461,471,971,915,715,7no schoolingno schooling
1515--2424
%%%%%%
TotalTotalRuralRuralUrbanUrbanHighest education Highest education level attainedlevel attained
Age Age groupgroup
Table 6.Table 6. School attainment levels, by residence School attainment levels, by residence
Section 4.Section 4. HUMAN CAPITAL AND YOUTH HUMAN CAPITAL AND YOUTH LABOUR MARKET OUTCOMES LABOUR MARKET OUTCOMES

Child labour and Child labour and youthyouth employmentemployment
in in EthiopiaEthiopia
More educated youth has higher unemployment ratesMore educated youth has higher unemployment rates
Source: UCW calculations based on Ethiopia Labour Force Survey 2Source: UCW calculations based on Ethiopia Labour Force Survey 2001001
Section 4.Section 4. HUMAN CAPITAL AND YOUTH HUMAN CAPITAL AND YOUTH LABOUR MARKET OUTCOMES LABOUR MARKET OUTCOMES
8,09,582,5higher education9,66,683,8lower secondary completed9,54,686,0lower secondary not completed8,22,389,4primary or less17,13,379,6No schooling
25-55 years
12,622,764,7higher education13,712,773,6lower secondary completed14,07,978,0lower secondary not completed9,54,985,6primary or less17,74,278,1No schooling
20-24 years
InactiveUnemployedEmployedEmployment statusHighest education
level attainedAge group

Child labour and Child labour and youthyouth employmentemployment
in in EthiopiaEthiopiaSection 4.Section 4. HUMAN CAPITAL AND YOUTH HUMAN CAPITAL AND YOUTH
LABOUR MARKET OUTCOMES LABOUR MARKET OUTCOMES
Determinats (correlates) of employments
•Estimates of employment probability by level of education
•Few explanatory variables: Gender, Proxies for wealth, Local labour market measures
•Selection problems: Linear probability models with generalized Heckman correction (Bouguignon et al.)
•Instruments: Household Sctructure
•Results similar to probit

Child labour and Child labour and youthyouth employmentemployment
in in EthiopiaEthiopiaSection 4.Section 4. HUMAN CAPITAL AND YOUTH HUMAN CAPITAL AND YOUTH
LABOUR MARKET OUTCOMES LABOUR MARKET OUTCOMES
Determinants (correlates) of employments II
LOCAL LABOUR MARKET MEASURES
•State level
•Cluster analysis based on flows of migration across zones
•Zones

Child labour and Child labour and youthyouth employmentemployment
in in EthiopiaEthiopia
Source: UCW calculations based on Ethiopia Labour Force Survey 2Source: UCW calculations based on Ethiopia Labour Force Survey 2001001
Section 4.Section 4. HUMAN CAPITAL AND YOUTH HUMAN CAPITAL AND YOUTH LABOUR MARKET OUTCOMES LABOUR MARKET OUTCOMES
Dendrogram - Cluster analysis0
200
400
600
800
1 2 4 11 7 38 8 32 50 47 49 44 48 40 29 18 20 34 46 39

Child labour and Child labour and youthyouth employmentemployment
in in EthiopiaEthiopiaSection 4.Section 4. HUMAN CAPITAL AND YOUTH HUMAN CAPITAL AND YOUTH
LABOUR MARKET OUTCOMES LABOUR MARKET OUTCOMES
Main results I
•Differences by area and by level of education
•Large gender differences (Female between 22 and 14 per cent less likely to be in employment)
•Income/wealth are important for the less educated youth. Credit rationing/social network. Weak.

Child labour and Child labour and youthyouth employmentemployment
in in EthiopiaEthiopiaSection 4.Section 4. HUMAN CAPITAL AND YOUTH HUMAN CAPITAL AND YOUTH
LABOUR MARKET OUTCOMES LABOUR MARKET OUTCOMES
Main results II
•Substantial influence of the local labour market conditions in urban areas for less educated youth (especially never attended school)
•Similar effects in rural areas, but more attenuated (presence of agricultural self/under employment).
•Results are consistent across local labour market definitions

Child labour and Child labour and youthyouth employmentemployment
in in EthiopiaEthiopia
Conclusion and policy issues I
Dual labour market
In rural areas, where the large majority of population resides, young people enjoy low unemployment, relatively easy transition from school to work and almost no disadvantage with respect to adults in the labour force. On the other hand, rural youth start to work at very early ages, endowed with extremely low level of human capital, and face underemployment in largely subsistence farming, low incomes and few chances to be employed in the formal sector of the economy.

Child labour and Child labour and youthyouth employmentemployment
in in EthiopiaEthiopia Section 5.Section 5. Conclusions and policy issues Conclusions and policy issues SectionSection
Conclusion and policy issues II
Dual labour market
In urban areas, youth face better prospects in terms of income and employment quality, but difficulties in finding a job. The urban youth unemployment rate is larger than the adult one and the chances of getting into wage employment are lower with respect to the adults. Transition from school to work is long and higher levels of education are associated with higher unemployment. In short, the functioning of the labour market, where it exists as in urban areas, seems to put youth at a disadvantage.

Child labour and Child labour and youthyouth employmentemployment
in in EthiopiaEthiopia Section 5.Section 5. Conclusions and policy issuesConclusions and policy issues
Conclusion and policy issues III
Main Policy issues.
•Information gap. A lot of information, not so informative
•The very high levels of child labour and associated very low levels of school attainment, both influencing patterns of employment (unemployment), job quality and remuneration later in life call for increases efforts in addressing the access and quality of education, influencing parents’ decisions (incentive schemes, opportunity costs, etc.)

Child labour and Child labour and youthyouth employmentemployment
in in EthiopiaEthiopia Section 5.Section 5. Conclusions and policy issuesConclusions and policy issues
Conclusion and policy issues IV
The large number of youth already in the labour market with very low human capital. Even if the general enrolment situation improves, the current generation of young people will have few chances to see a real change in their circumstances. Further investment in special training and skill formation activities is therefore needed in parallel with broader education expansion efforts, to improve the employment prospects of this “stock” of low or uneducated youth.

Child labour and Child labour and youthyouth employmentemployment
in in EthiopiaEthiopia Section 5.Section 5. Conclusions and policy issuesConclusions and policy issues
Conclusion and policy issues V
• The minority of (primarily urban) youth relatively well equipped with human capital face specific but not dramatic problems in terms of unemployment. There is not at present enough information to identify the causes and characteristics of this phenomenon
• Is this symptomatic of a non well working labour market?
• The phenomena is small (relative to the other problems of the labour market), but can have spill over in terms of incentives or expectations

Child labour and Child labour and youthyouth employmentemployment
in in EthiopiaEthiopia Section 5.Section 5. Conclusions and policy issuesConclusions and policy issues
Conclusion and policy issues VI
• The impact of low skill levels and the likely impact of credit rationing on youth labour force outcomes underscore the relevance of the Government’s Micro and Small Enterprise Development and Micro Finance strategies. Unfortunately, there is not information available to assess the impact of such strategies. Again, it would be an important priority to fill these gaps.

Child labour and Child labour and youthyouth employmentemployment
in in EthiopiaEthiopia Section 5.Section 5. Conclusions and policy issuesConclusions and policy issues
Conclusion and policy issues VII
• The strong role that labour market stance plays in determining the probability of employment indicates that macroeconomic growth is crucial to youth employment and that the youth situation hinges to a large extent on the success of general national development policies. The fact that labour market effects are particularly strong for the less educated labour force points to the special vulnerability of these groups and to the need to introduce risk reduction policies

Child labour and Child labour and youthyouth employmentemployment
in in EthiopiaEthiopia
Source: UCW calculations based on Ethiopia Labour Force Survey 2Source: UCW calculations based on Ethiopia Labour Force Survey 2001001
Section 4.Section 4. HUMAN CAPITAL AND YOUTH HUMAN CAPITAL AND YOUTH LABOUR MARKET OUTCOMES LABOUR MARKET OUTCOMES
0.480.480.46310.4631--2.432.43--1.99291.9929--2.282.28--1.65281.6528--5.245.24--3.06923.0692--2.532.53--5.20885.2088share_~pshare_~p2.832.831.02341.02344.694.691.73411.73417.267.261.36971.36975.45.41.34901.34902.712.712.34182.3418empl_t~pempl_t~p--1.141.14--0.07110.07111.131.130.10100.1010--1.41.4--0.09870.0987--4.354.35--0.21780.2178--0.910.91--0.06710.0671exp4*exp4*--1.871.87--0.06720.0672--0.60.6--0.05330.0533--3.733.73--0.23570.2357--5.635.63--0.32440.3244--2.112.11--0.19450.1945exp3*exp3*--1.621.62--0.07270.0727--0.050.05--0.00410.0041--3.923.92--0.22070.2207--8.328.32--0.39630.3963--5.495.49--0.38010.3801exp2*exp2*--1.781.78--0.13770.1377--0.970.97--0.07850.0785--3.563.56--0.26930.2693--7.177.17--0.45830.4583--4.514.51--0.38340.3834exp1*exp1*0.390.390.00650.00650.910.910.02270.02270.090.090.00250.00250.910.910.04760.0476--0.190.19--0.00490.0049own_ho~eown_ho~e**--2.852.85--0.00970.00971.041.040.00690.0069--1.941.94--0.01030.0103--1.731.73--0.01050.0105--0.930.93--0.00400.0040hhsize1hhsize1--10.7310.73--0.14110.1411--4.214.21--0.18180.1818--5.85.8--0.22240.2224--4.084.08--0.20360.2036--3.623.62--0.14930.1493female*female*0.750.750.00220.0022--1.451.45--0.00410.00410.250.250.00030.0003--1.91.9--0.00180.0018--6.086.08--0.00380.0038age2age2--0.640.64--0.07910.07911.391.390.16320.1632--0.380.38--0.01840.01841.971.970.06220.06226.516.510.14090.1409ageage
zzdy/dxdy/dxzzdy/dxdy/dxzzdy/dxdy/dxzzdy/dxdy/dxzzdy/dxdy/dx
Higher EducationHigher EducationLower secondaryLower secondarycompletedcompleted
Not completedNot completedlower secondarylower secondaryPrimary or lessPrimary or lessNever attended Never attended
schoolschoolvariablevariable
(a) URBAN(a) URBAN
••Table 7Table 7.. Probability of employment by level of education, youth aged 10Probability of employment by level of education, youth aged 10--24 years, 24 years, probitprobit estimates estimates using the regionusing the region--wide definition of local labour marketwide definition of local labour market

Child labour and Child labour and youthyouth employmentemployment
in in EthiopiaEthiopia
Source: UCW calculations based on Ethiopia Labour Force Survey 2Source: UCW calculations based on Ethiopia Labour Force Survey 2001001
Section 4.Section 4. HUMAN CAPITAL AND YOUTH HUMAN CAPITAL AND YOUTH LABOUR MARKET OUTCOMES LABOUR MARKET OUTCOMES
0.610.610.81890.8189--2.162.16--1.73491.7349--0.790.79--0.26140.26141.121.120.45900.45901.251.250.84670.8467share_~pshare_~p0.520.520.22420.22424.884.881.44391.44392.532.530.45330.45332.332.330.33760.33762.142.140.64000.6400empl_t~pempl_t~p5.85.80.16890.16890.050.050.00600.0060exp4*exp4*4.534.530.16060.1606--0.870.87--0.03580.0358--1.171.17--0.13400.1340--0.630.63--0.05280.0528000.00030.0003exp3*exp3*7.947.940.37170.3717--0.690.69--0.02060.0206--1.551.55--0.08930.0893--1.231.23--0.07660.0766--0.220.22--0.03310.0331exp2*exp2*11.211.20.18650.1865--2.42.4--0.18140.1814--1.081.08--0.06500.0650--0.990.99--0.08290.0829--0.220.22--0.03490.0349exp1*exp1*--0.650.65--0.05150.05152.192.190.14570.14572.452.450.13450.13450.820.820.02820.02821.631.630.06360.0636own_ho~eown_ho~e**--0.260.26--0.00160.00160.580.580.00440.00440.160.160.00050.00050.110.110.00030.00030.290.290.00060.0006hhsize1hhsize1--2.562.56--0.16420.1642--2.632.63--0.12840.1284--5.35.3--0.17830.1783--7.547.54--0.20410.2041--15.3215.32--0.25130.2513female*female*--0.140.14--0.00090.00091.251.250.00520.0052--1.61.6--0.00170.0017--2.132.13--0.00070.0007--2.652.65--0.00080.0008age2age20.260.260.06970.0697--1.31.3--0.20790.20791.571.570.06490.06492.382.380.02900.02902.742.740.03140.0314ageage
zzdy/dxdy/dxzzdy/dxdy/dxzzdy/dxdy/dxzzdy/dxdy/dxzzdy/dxdy/dxHigher EducationHigher Education
Lower secondaryLower secondarycompletedcompleted
Not completedNot completedlower secondarylower secondaryPrimary or lessPrimary or less
Never attended Never attended schoolschool
variablevariable
(b) RURAL(b) RURAL
••Table 7Table 7.. Probability of employment by level of education, youth aged 10Probability of employment by level of education, youth aged 10--24 years, 24 years, probitprobit estimates estimates using the regionusing the region--wide definition of local labour marketwide definition of local labour market

Child labour and Child labour and youthyouth employmentemployment
in in EthiopiaEthiopia
Source: UCW calculations based on Ethiopia Labour Force Survey 2Source: UCW calculations based on Ethiopia Labour Force Survey 2001001
Section 4.Section 4. HUMAN CAPITAL AND YOUTH HUMAN CAPITAL AND YOUTH LABOUR MARKET OUTCOMES LABOUR MARKET OUTCOMES
1.281.280.9940.994--0.250.25--0.1040.104--0.410.41--0.1260.126--2.892.89--1.2921.292--2.542.54--1.8961.896share_~pshare_~p3.323.321.4361.4363.633.631.5031.50310.3510.351.3121.3123.913.910.9930.9932.852.851.9181.918empl_t~pempl_t~p--1.211.21--0.0740.0741.151.150.1030.103--1.451.45--0.1000.100--4.434.43--0.2190.219--1.051.05--0.0840.084exp4*exp4*--1.961.96--0.0720.072--0.530.53--0.0460.046--3.843.84--0.2390.239--5.495.49--0.3290.329--2.132.13--0.2150.215exp3*exp3*--1.781.78--0.0800.0800.070.070.0060.006--3.963.96--0.2230.223--8.198.19--0.3950.395--5.215.21--0.3960.396exp2*exp2*--1.831.83--0.1440.144--0.790.79--0.0660.066--3.583.58--0.2740.274--7.17.1--0.4570.457--4.314.31--0.4010.401exp1*exp1*0.40.40.0070.0070.880.880.0230.023--0.030.03--0.0010.0010.830.830.0440.044--0.430.43--0.0090.009own_ho~eown_ho~e**
--2.652.65--0.0110.0111.031.030.0070.007--2.072.07--0.0100.010--1.531.53--0.0090.009--0.30.3--0.0010.001hhsize1hhsize1--11.0211.02--0.1420.142--4.244.24--0.1820.182--5.835.83--0.2250.225--4.084.08--0.2050.205--3.883.88--0.1550.155female*female*0.720.720.0020.002--1.41.4--0.0040.0040.30.30.0000.000--1.811.81--0.0020.002--6.056.05--0.0040.004age2age2--0.60.6--0.0750.0751.331.330.1580.158--0.440.44--0.0210.0211.891.890.0610.0616.56.50.1410.141ageage
zzdy/dxdy/dxzzdy/dxdy/dxzzdy/dxdy/dxzzdy/dxdy/dxzzdy/dxdy/dxHigher EducationHigher Education
Lower secondaryLower secondarycompletedcompleted
Not completedNot completedlower secondarylower secondaryPrimary or lessPrimary or less
Never attended Never attended schoolschool
variablevariable
(a) URBAN(a) URBAN
Table 8Table 8.. Probability of employment by level of education, youth aged 10Probability of employment by level of education, youth aged 10--24 years, 24 years, probitprobit estimates estimates obtained with indicators of local labour market separated for ruobtained with indicators of local labour market separated for rural and urban areasral and urban areas

Child labour and Child labour and youthyouth employmentemployment
in in EthiopiaEthiopia
Source: UCW calculations based on Ethiopia Labour Force Survey 2Source: UCW calculations based on Ethiopia Labour Force Survey 2001001
Section 4.Section 4. HUMAN CAPITAL AND YOUTH HUMAN CAPITAL AND YOUTH LABOUR MARKET OUTCOMES LABOUR MARKET OUTCOMES
0.760.760.6000.6001.051.051.3051.305--6.066.06--0.8480.8482.572.570.3530.3531.281.280.9940.994share_~pshare_~p0.480.480.2570.2570.650.650.3980.3988.058.050.8660.8664.734.730.4410.4413.323.321.4361.436empl_t~pempl_t~p5.685.680.1690.169--------------------------1.211.21--0.0740.074exp4*exp4*4.544.540.1620.162--0.130.13--0.0070.007--1.111.11--0.1270.127--0.650.65--0.0540.054--1.961.96--0.0720.072exp3*exp3*7.367.360.3730.3730.270.270.0110.011--1.451.45--0.0840.084--1.291.29--0.0780.078--1.781.78--0.0800.080exp2*exp2*
10.8110.810.1870.187--1.801.80--0.1080.108--0.970.97--0.0580.058--1.041.04--0.0850.085--1.831.83--0.1440.144exp1*exp1*--0.680.68--0.0530.0532.362.360.2270.2272.342.340.1340.1340.870.870.0300.0300.400.400.0070.007own_ho~eown_ho~e**--0.270.27--0.0020.0020.720.720.0060.0060.150.150.0000.0000.170.170.0010.001--2.652.65--0.0110.011hhsize1hhsize1--2.512.51--0.1640.164--2.732.73--0.1050.105--6.086.08--0.1790.179--8.058.05--0.2050.205--11.0211.02--0.1420.142female*female*--0.140.14--0.0010.0011.001.000.0050.005--1.461.46--0.0020.002--2.062.06--0.0010.0010.720.720.0020.002age2age20.260.260.0700.070--1.031.03--0.1990.1991.431.430.0600.0602.302.300.0290.029--0.600.60--0.0750.075ageage
zzdy/dxdy/dxzzdy/dxdy/dxzzdy/dxdy/dxzzdy/dxdy/dxzzdy/dxdy/dxHigher EducationHigher Education
Lower secondaryLower secondarycompletedcompleted
Not completedNot completedlower secondarylower secondaryPrimary or lessPrimary or less
Never attended Never attended schoolschool
variablevariable
(b) RURAL(b) RURAL
Table 8Table 8.. Probability of employment by level of education, youth aged 10Probability of employment by level of education, youth aged 10--24 years, 24 years, probitprobit estimates estimates obtained with indicators of local labour market separated for ruobtained with indicators of local labour market separated for rural and urban areasral and urban areas

Child labour and Child labour and youthyouth employmentemployment
in in EthiopiaEthiopiaSection 4.Section 4. HUMAN CAPITAL AND YOUTH HUMAN CAPITAL AND YOUTH
LABOUR MARKET OUTCOMES LABOUR MARKET OUTCOMES
Source: UCW calculations based on Ethiopia Labour Force Survey 2Source: UCW calculations based on Ethiopia Labour Force Survey 20000004.34.30.1342730.13427310.7210.720.2560150.256015training*training*
--7.667.66--0.299420.29942--12.9112.91--0.314170.31417educ5*educ5*
--4.34.3--0.207360.20736--13.0713.07--0.244030.24403educ4*educ4*--6.736.73--0.149370.14937--10.4910.49--0.208460.20846educ3*educ3*--9.069.06--0.107040.10704--9.359.35--0.124390.12439educ2*educ2*0.050.050.0286430.028643--2.432.43--0.748490.74849share_~pshare_~p||4.54.51.2099951.2099955.735.731.1838621.183862empl_t~pempl_t~p||0.710.710.0379590.037959--4.944.94--0.078520.07852exp4*exp4*0.440.440.0243160.024316--3.213.21--0.072480.07248exp3*exp3*--0.140.14--0.008360.00836--2.252.25--0.06040.0604exp2*exp2*--0.470.47--0.028860.02886--1.711.71--0.070060.07006exp1*exp1*3.113.110.093920.09392--0.140.14--0.0020.002own_ho~eown_ho~e**--1.181.18--0.002520.00252--1.141.14--0.002630.00263hhsize1 hhsize1 --13.813.8--0.236470.23647--5.425.42--0.077060.07706female*female*--3.533.53--0.000790.00079--3.983.98--0.001440.00144age2 age2 4.174.170.0401990.0401997.007.000.090.09AgeAge
zzdy/dxdy/dxzzdy/dxdy/dxVariable Variable RuralRuralUrbanUrban
••Table 9.Table 9. Marginal effects of control variables on the probability of beinMarginal effects of control variables on the probability of being in work, by residenceg in work, by residence

Child labour and Child labour and youthyouth employmentemployment
in in EthiopiaEthiopiaSection 4.Section 4. HUMAN CAPITAL AND YOUTH HUMAN CAPITAL AND YOUTH
LABOUR MARKET OUTCOMES LABOUR MARKET OUTCOMES
Note: the numbers of treated and controls refer to actual nearesNote: the numbers of treated and controls refer to actual nearest neighbour matchest neighbour matchesSource: UCW calculations based on Ethiopia Labour Force Survey 2Source: UCW calculations based on Ethiopia Labour Force Survey 2000000
14.14814.1480.0140.0140.1970.19714821514821580738073RuralRural
37.48137.4810.0070.0070.2480.24815091615091680738073UrbanUrban
ttStd. Err.Std. Err.ATTATTn. contr.n. contr.n. treat.n. treat.ResidenceResidence
••Table 10Table 10. . ATT estimation with nearest neighbour matching method (random drATT estimation with nearest neighbour matching method (random draw version), aw version), analytical standard errorsanalytical standard errors