childhood injuries in bradford an epidemiological needs
TRANSCRIPT

Childhood Injuries in Bradford An Epidemiological Needs Assessment Analysis of the Born in Bradford Cohort December 2018

i
Acknowledgements
The author gratefully acknowledges the support and contributions of the following in the development of this report:
Bradford Council Public Health Team
Bradford Council Children’s Services
Born in Bradford EpiStats Team for support with data, Stata and statistical analysis
TPP and the TPP ResearchOne team in completing study participant matching to GP primary care records and in providing ongoing informatics support
Finally, Born in Bradford is only possible because of the enthusiasm and commitment of the Children and Parents in BiB. We are grateful to all the participants, health professionals and researchers who have made Born in Bradford happen. Please direct any enquiries to the author: Chris Cartwright, Public Health Registrar, Yorkshire and the Humber [email protected]

ii
Executive Summary Childhood injuries remain an important public health priority in England and are one of six high impact areas for positively impacting on the health, wellbeing and outcomes for children, young people, families and communities identified by Public Health England (PHE) and the Department for Health and Social Care (DHSC). Despite relatively small recent downward trends in incidence in Bradford, admissions to hospital due to injury for the age group 0-4 years are in line with the national average and are above the national average for ages 0-14 years. Partners in Bradford and Airedale, through the Bradford District Plan and Joint Health and Wellbeing Strategy, have outlined ambitions for Bradford to be a great place for everyone, where prevention of ill health is a priority, children have the best start in life and live in safe, secure homes and neighbourhoods and that demand for unplanned and urgent care is reduced. Understanding and addressing childhood injuries therefore presents an opportunity to the delivery of the vision and outcomes for the District. PHE has set out a framework for establishing local circumstances and developing approaches to reduce the incidence of childhood injuries. Whilst there have been some studies in the UK, there is a national acknowledgement in England that routinely available data is limited in scope and detail. Additionally, admissions, as reported in the National Public Health Outcomes Framework, are only likely to represent a small proportion of injury events. This epidemiological needs assessment was produced, using data from the Born in Bradford cohort study, to inform local child injury prevention activities. The assessment found children aged 0-4 years were twice as likely to attend A&E with an injury than a GP setting and were 50% more likely to attend A&E compared with those aged 5-10 years. Over 40% of children aged 0-4 years attended a healthcare setting at least once for an injury compared to one third for those aged 5-10 years. Those attending in ages groups 0-4 years were 39% more likely to attend for an injury aged 5-10 compared within those who did not. Injury attendances followed a seasonal pattern, being highest during months with the longest day light hours and lowest in months with the least. Male children were between 37% and 52% more likely to attend for an injury for age groups 0-4 and 5-10 respectively, compared to females. However there were differences within injury presentations. Whilst the proportion of males attending because of a bruise or superficial Injury and cut / bite / other open wound was higher than females, females had a higher proportion of attendances for fractures and sprains and dislocations. Differences associated with ethnicity were minimal for most aspects analysed however children of mothers with poorer maternal mental health at study recruitment were 34% likely to attend for an injury for ages 5-10. Other associations between injury attendance and child, parental and environmental characteristics were limited with the exception of deprivation. Injury attendances were between 40-50% lower for children living in the least deprived wards compared to those living in the most deprived wards. Limitations in the precision and type of data available prevented analysis by injury intent, mechanism or injury severity. Additionally some caution is needed in the interpretation and comparison with other studies due to the incomplete nature of some of the data. Injuries to the head and neck accounted for a significant proportion (around one third) of all attendances, with approximately 50% of these being bruises and superficial injuries or cuts / bites / open wounds. Whilst burns decreased as a total proportion with age, fractures and sprains and dislocations increased.
iii
Bruise or superficial injury and cut / bite / other open wound accounted for a higher proportion of total injuries in A&E settings compared to GP across both age groups. Fractures accounted for a higher proportion of total injuries in GP settings compared to A&E across both age groups.
Regarding healthcare utilisation, males were more likely to attend multiple times in both age groups compared to females with approximately 50% of those attending for an injury likely to do so two or more times. This could be multiple attendance for the same or a different injury. Arrival by ambulance decreased with age with over 90% of A&E attendees making their own travel arrangements. A significant proportion (over 50%) were discharged with no need for follow-up, the proportion admitted was generally 5% or less. Patterns were similar across different ethnicities with some limited differences in multi-attendance and onward patient destination from A&E. The results of this analysis show that childhood injuries are an important issue locally, particularly in the context of healthcare utilisation. They also contribute to understanding the local injury profile, supporting the actions detailed in the PHE framework for addressing childhood injuries. Further injury prevention advice is available in NICE guidance PH29 (11) and PH30 (11) which detail injury prevention approaches for under 15s broadly and at home. A guide for Commissioners (13) detailing cost effective child injury prevention interventions at home is also available. The recommendations resulting from this analysis are as follows: Recommendation 1: The PHE framework for child injury prevention should be applied locally in Bradford to progress injury prevention and risk reduction locally. Recommendation 2: Opportunities to provide injury prevention advice at first injury attendance should be explored given those injured are more likely to re-attend at a later age with an injury. Recommendation 3: Seasonality should be considered as a factor within future injury prevention activities. Recommendation 4: Programmes to support and improve maternal mental health should continue to be supported as an association between poor maternal mental health and childhood injury has been identified. Recommendation 5: Further exploration of data regarding maternal mental health in the Born in Bradford cohort would be useful to identify whether continued mental health issues were experienced by the mother during the child’s early years and whether any causative links can be established. This would aid understanding regarding support for maternal mental health as the child ages as well as during the first few years of life. Recommendation 6: Gender as a risk factor should be considered within injury prevention activities. This may include targeting males more generally and females specifically regarding fractures and injuries to limbs and extremities. Data available in the future (see Recommendation 8) will help improve understanding of injury mechanism and intent to target prevention activities. Recommendation 7: Injury prevention interventions and opportunities should be considered in Bradford given that increasing deprivation is associated with higher incidence of injuries and that a significant proportion of the population live in some of the most deprived areas of the country. Recommendation 8: Future health needs assessments and monitoring of injuries in Bradford should utilise the new Emergency Care Data Set (when available) to provide greater insight into injury mechanisms and intent to inform potential future injury prevention opportunities.

iv
Recommendation 9: Support for coding for Primary Care Practitioners should encompass recording of injuries and enable improved specificity of coding regarding the nature of injury and anatomical region affected. Recommendation 10: Accepting the limitations of the available data, there are potential opportunities to consider advice available and offered to the public regarding types of childhood injury, signs and symptoms to be aware of and where medical support (e.g. minor injuries) may be best obtained so as to best manage utilisation of health services.

v
Contents Acknowledgements .................................................................................................................................. i Executive Summary ................................................................................................................................. ii 1.0 Introduction ...................................................................................................................................... 1
1.1 Background ................................................................................................................................... 1 1.2 Recent Studies............................................................................................................................... 3 1.3 Born in Bradford ............................................................................................................................ 4 1.4 Scope and Objectives .................................................................................................................... 4 1.5 Methods ........................................................................................................................................ 5
2.0 Epidemiological Profile ..................................................................................................................... 6 2.1 Injury Attendance ......................................................................................................................... 6 2.2 Seasonality and Attendance ......................................................................................................... 7 2.3 Associations and Attendance ........................................................................................................ 8
3.0 Injury Profile .................................................................................................................................... 11 3.1 Intent ........................................................................................................................................... 12 3.2 Mechanism .................................................................................................................................. 12 3.3 Nature ......................................................................................................................................... 12 3.4 Anatomical Region ...................................................................................................................... 12 3.5 Relationship between Nature and Anatomical Region ............................................................... 13
4.0 Healthcare Utilisation ..................................................................................................................... 15 4.1 Utilisation by Service Type .......................................................................................................... 15 4.2 Multiple Attendances .................................................................................................................. 17 4.3 Arrival Mode (A&E) ..................................................................................................................... 17 4.4 Destination (A&E)........................................................................................................................ 17 4.5 Associations with Admission ....................................................................................................... 20
5.0 Implications and Next Steps ............................................................................................................ 21 6.0 References ...................................................................................................................................... 23 A. Methods ............................................................................................................................................ 25
A.1 Data Sources and Preparation .................................................................................................... 25 A.2 Data Analysis ............................................................................................................................... 25
B. ICD-10 Codes ..................................................................................................................................... 27 C. Missing A&E Data Preparation .......................................................................................................... 28

1
1.0 Introduction
Chapter Summary
Childhood injuries remain an important public health priority in England despite recent downward trends in incidence
Issues with injury data availability and utility are recognised nationally
Hospital admissions in Bradford District due to injury are similar to the national average for age group 0-4 but are above the national average for ages 0-14
Increasing deprivation has been linked to increasing injury incidence across multiple studies
Males are more likely to attend healthcare settings with an injury than females
A previous study of childhood injuries in the Bradford District was conducted in 2004-2005
Born in Bradford provides an opportunity to update understanding of childhood injuries in the city and address some of the knowledge gaps due limitations with nationally available data
This report presents an epidemiological health needs assessment of childhood injuries in Bradford based on data from the Born in Bradford study
1.1 Background
Reducing accidents is one of six high impact areas identified by Public Health England (PHE) and Department for Health and Social Care (DHSC) for Health Visitors. Unintentional injuries amongst the under 5s represent a significant cause of preventable death and serious harm with major effects on education, employment, emotional wellbeing and family relationships. They are also one of the leading causes of attendances at accident and emergency (A&E) and hospitalisations amongst the under 5’s with injuries tending to occur in and around the home (1). 370,000 children under the age of 5 years attend A&E annually in England of which 40,000 are admitted for treatment. The home is a major location where injuries take place and many factors affect injury occurrence including childhood development, home environment including overcrowding, parental and carer knowledge and behaviours. Additionally, inequalities are observed with children living in the most deprived wards 38% more likely to be admitted with an injury compared to the least deprived wards. Males are also more likely to attend than females (2). These short term financial costs of hospitalisations due to injuries are estimated to be between £2500-£3000 and a single A&E attendance is estimated to cost between £100-£180. Despite this they are largely preventable (1).
2
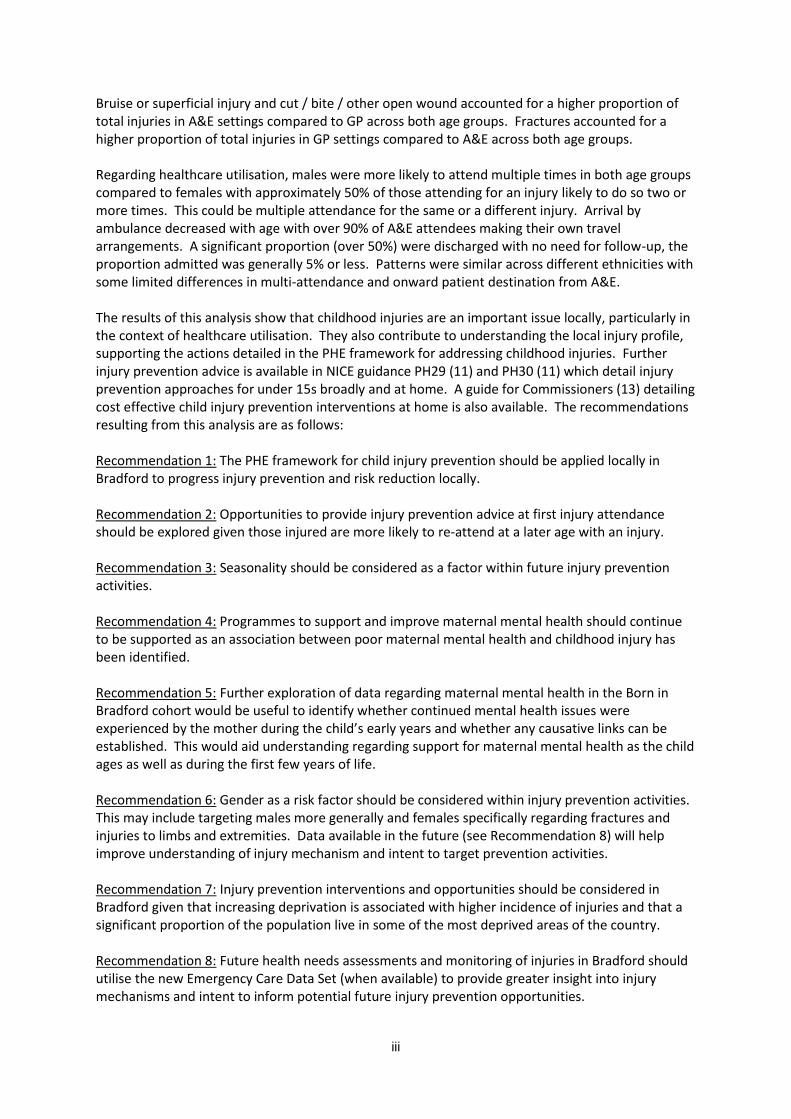
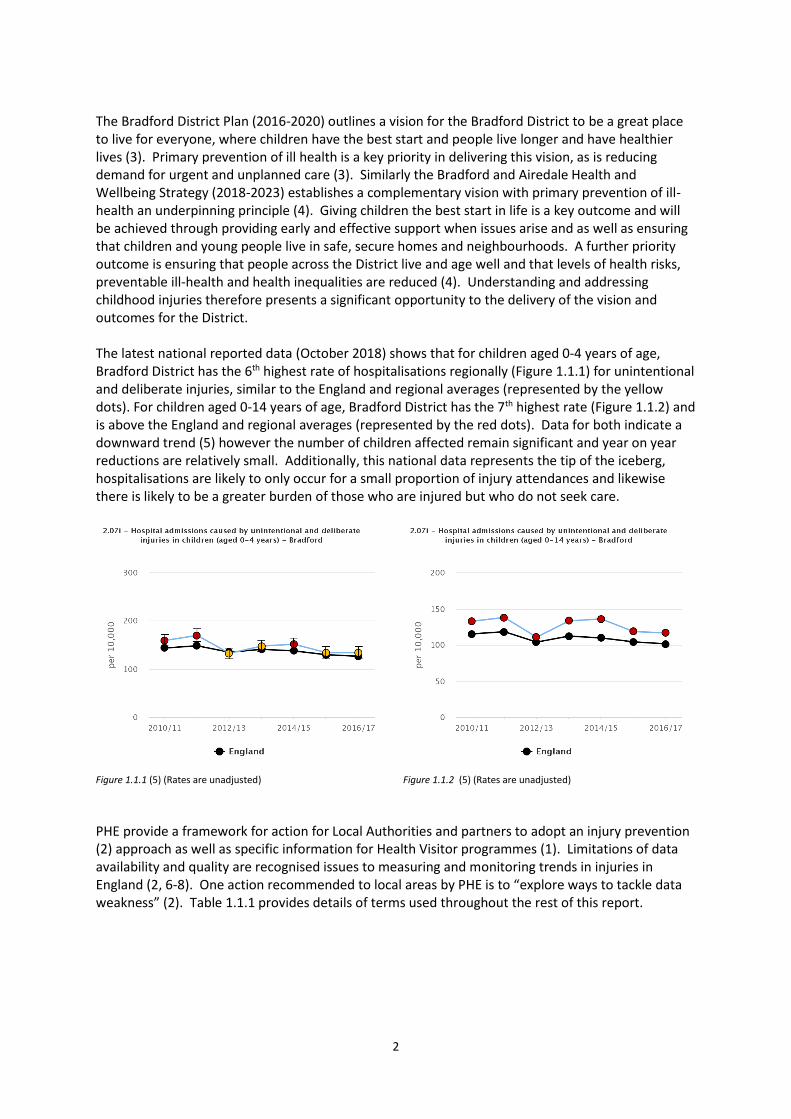
The Bradford District Plan (2016-2020) outlines a vision for the Bradford District to be a great place to live for everyone, where children have the best start and people live longer and have healthier lives (3). Primary prevention of ill health is a key priority in delivering this vision, as is reducing demand for urgent and unplanned care (3). Similarly the Bradford and Airedale Health and Wellbeing Strategy (2018-2023) establishes a complementary vision with primary prevention of ill-health an underpinning principle (4). Giving children the best start in life is a key outcome and will be achieved through providing early and effective support when issues arise and as well as ensuring that children and young people live in safe, secure homes and neighbourhoods. A further priority outcome is ensuring that people across the District live and age well and that levels of health risks, preventable ill-health and health inequalities are reduced (4). Understanding and addressing childhood injuries therefore presents a significant opportunity to the delivery of the vision and outcomes for the District. The latest national reported data (October 2018) shows that for children aged 0-4 years of age, Bradford District has the 6th highest rate of hospitalisations regionally (Figure 1.1.1) for unintentional and deliberate injuries, similar to the England and regional averages (represented by the yellow dots). For children aged 0-14 years of age, Bradford District has the 7th highest rate (Figure 1.1.2) and is above the England and regional averages (represented by the red dots). Data for both indicate a downward trend (5) however the number of children affected remain significant and year on year reductions are relatively small. Additionally, this national data represents the tip of the iceberg, hospitalisations are likely to only occur for a small proportion of injury attendances and likewise there is likely to be a greater burden of those who are injured but who do not seek care.
Figure 1.1.1 (5) (Rates are unadjusted)
Figure 1.1.2 (5) (Rates are unadjusted)
PHE provide a framework for action for Local Authorities and partners to adopt an injury prevention (2) approach as well as specific information for Health Visitor programmes (1). Limitations of data availability and quality are recognised issues to measuring and monitoring trends in injuries in England (2, 6-8). One action recommended to local areas by PHE is to “explore ways to tackle data weakness” (2). Table 1.1.1 provides details of terms used throughout the rest of this report.

3
Term Explanation
Injury Refers to an event which has a physical impact on the body, these are defined according to International Classification of Diseases 10 (ICD-10) codes (see Annex Bb).
Injury attendance Refers to presentation at GP or A&E which is recorded in healthcare systems for an injury. There may be multiple attendances for a single injury event.
Admission Refers to admission to a hospital ward as a result of attending A&E with an injury.
Intent Distinguishes if the injury resulted from a deliberate or unintentional action by the person injured or another person.
Mechanism Refers to the action which caused the injury for example a road traffic collision, electrocution etc. Categories for mechanisms have been developed based on WHO guidelines (16).
Nature Refers to the type of injury which occurred for example fracture, burn etc. Categories for nature have been developed based on WHO guidelines (16).
Anatomical Region
Refers to the area of the body affected by the injury for example head, arm etc. Categories were developed according to body regions referred to within ICD-10 codes.
Table 1.1.1 - Terminology
1.2 Recent Studies
Lyons et.al., (2015) analysed GP and A&E attendances and hospital admissions for injuries using healthcare records in Wales. Table 1.2.1 summarises the different attendance and admission rates per 100,000 population, showing A&E attendances being at least double those of GP and 14% and 8% of A&E attendances being admitted for ages groups 0-4 and 5-9 respectively. Attendances decreased with age but the reduction was less for A&E attendances. For age group 0-4, males were approximately 20% more likely to attend or be admitted compared to females. The difference was between 13-14% for attendances for age group 5-9 however admissions were significantly higher (46%) amongst males in this age group (6).
Age Group GP Attendances (2013) A&E Attendances (2014) Hospital Admissions (2014)
0-4 7148 per 100,000 14279 per 100,000 1959 per 100,000
5-9 5960 per 100,000 13170 per 100,000 1077 per 100,000 Table 1.2.1 – Attendances and Admissions
Kirkwood et.al., (2016) reviewed A&E attendance and injury mechanisms, activities and locations while piloting enhanced injury surveillance in Oxfordshire between 2012-2014. For all age groups males were approximately 20% more likely to attend than females. Those in the most deprived quintile were 50% more likely to attend for an injury compared to those in the least deprived quintile. Incidence rates for injury attendances were 5160 per 100,000 person years for age group 0-4 and 5090 per 100,000 person years for age group 5-9 years. These are substantially lower than the study by Lyons et.al. (7). Baker et.al., (2015) looked specifically at childhood injuries where burns, fractures and poisonings occurred using GP and hospital data for a cohort aged 0-24. GP data was based on the General Practice Research Datalink which whilst representative of England generally, slightly under represents Yorkshire. The authors applied a time algorithm to avoid multiple counting of attendances due to a single injury events. Incidence for burns peaked at age 1, poisonings at age 2 and fractures at age 13. Incidence rates overall for ages 0-24 were 358 per 100,000 person years for burns, 419 for poisonings and 1808 for fractures (9). Hardy (2007) undertook a study of accidental (unintentional injuries) injury attendances at A&Es in the Bradford District 2004-05. This study looked at injury attendances for children aged 4-12 years

4
attending A&Es at Bradford Royal Infirmary (BRI) and Airedale General Hospital (AGH). Hardy found that males attendance at BRI were approximately 50% higher than females. Attendances had a pattern which corresponded to increasing daylight hours, with injuries peaking in June at approximately 12% compared to just under 6% in December. In terms of injury mechanisms, 57% of injuries were related to falls, 19% due to being hit by or banging into an object. Soft tissue injuries, lacerations accounted for 41% and 23% of attendances respectively, fractures and dislocation approximately 15%. Approximately 32% of injuries affected the head and face region, 5% the spine, pelvis and trunk. 58% were discharged, 6% of attendees were admitted, 22% referred to outpatient or clinic and 11% were referred for follow-up by a GP or healthcare professional (8).
1.3 Born in Bradford
The Born in Bradford cohort study is following over 13,500 children born at Bradford Royal Infirmary between March 2007 and December 2010. It is part of a mission “to conduct rigorous and applied health research to improves the health and wellbeing of families in Bradford and beyond” (10). As well as collecting information from families within the birth cohort the study also enables record linkage with many data sources including general practice (GP) and A&E records (11). Whilst some studies of cohorts and child injuries in the UK have taken place (9) using routine data such as GP and A&E records, none has provided an opportunity for a more comprehensive analysis of data around factors including ethnicity, parental factors, housing conditions and childhood development factors such as early years foundation stage assessments. Born in Bradford therefore provides an opportunity to review more recent data and explore further factors which may provide important information to inform injury prevention interventions and activities within the Bradford District. The cohort is representative of the population of Bradford (12) born in the city but may not reflect more recent changes due to migration. This report provides an epidemiological health needs assessment of childhood injuries of the Born in Bradford cohort in order to support and inform local injury prevention activities and actions, addressing weaknesses in the data identified in the PHE report.
1.4 Scope and Objectives
Aim To describe the non-fatal injury epidemiology of children within the Born In Bradford (BIB) study cohort in order to inform local injury prevention activities and planning. Objectives
To establish the basic epidemiological profile of injuries within the BIB cohort (and sub-group) using BIB research data, primary care and hospital linked data
To explore associations which may explain the epidemiological profile and inform potential injury prevention activities
To describe the profile of injuries (injury intent, mechanism, nature and anatomical region affected)
To describe healthcare utilisation by GP and A&E attendance, ambulance usage and hospital admissions and referrals
To identify recommendations for injury prevention based on this analysis and opportunities for further action and research
This epidemiological health needs assessment will be presented for further consideration to:
Child Death Overview Panel chaired by Bradford Council
Public Health Team, Bradford Council

5
Children’s Services, Bradford Council
1.5 Methods
Methods, data sources, analysis and methodological limitations are detailed more fully in Annex A. In brief, data from GP records in the District and A&E at Bradford Royal Infirmary were extracted for the Born in Bradford cohort where an attendance due to an injury was recorded, as defined by ICD-10 coding. GP record Read codes were linked to corresponding ICD-10 codes. GP records are available for the full cohort period whereas A&E records were only available from 2011 onwards. Data for the cohort was available from a number of different sources including the baseline questionnaire completed by the child’s mother at recruitment as well as education and other health data. Data was analysed and presented for two age groups (0-4 years and 5-10 years) in light of different injury mechanisms and incidence rates previously reported in these groups by other studies.

6
2.0 Epidemiological Profile
Chapter Summary
Children aged 0-4 years were twice as likely to attend A&E with an injury than GP and 50% more likely to attend A&E compared with those aged 5-10 years
Over 40% of children attended a healthcare setting at least once for an injury aged 0-4 years compared to one third for those aged 5-10 years
Injury attendance is highest in age 0-4
Children attending for an injury at age 0-4 were 39% more likely to attend for an injury at age 5-10 compared with those who did not
Injuries follow a seasonal pattern, being highest during months with the longest day light hours and lowest in months with the least – the difference is more pronounced in the age group 5-10
Male children were 37%-52% more likely to attend for an injury for age groups 0-4 and 5-10 respectively, compared to females
Children of mothers with poorer maternal mental health at study recruitment were 34% more likely to attend for an injury for ages 5-10, there was no association of significance for those aged 0-4
Injury attendances were between 40-50% lower for children living in the least deprived wards compared to those living in the most deprived wards
Other associations between injury attendance and child, parental and environmental characteristics were limited
Differences by ethnicity were limited
2.1 Injury Attendance
Incidence rates for attendance at GP and A&E are shown in Table 2.1.1. Rates are not directly comparable with those published by PHE (Figures 1.1.1 and 1.1.2) which care calculated using a different dataset and account for all hospital admissions due to injury, not just admissions via A&E. Rates have been calculated based on those children in the cohort with complete GP records, 10937 for ages 0-4 and 8609 for ages 5-10. GP data was available between July 2007 and August 2017 and A&E data between February 2011 and December 2017. Denominators have been calculated accordingly but it should be noted that attendance at facilities other than Bradford Royal Infirmary or GP Practices within Bradford are not included in these figures. Multiple attendances for the same injury are included. A&E attendance for ages 0-4 years were approximately 50% higher than those

7
aged 5-10 years. A&E attendances for ages 0-4 years were over twice those for GP attendances aged 0-4 but GP attendance was still significant.
Age 0-4 Age 5-10
Incidence Rate per 10,000 person years
Incidence Rate per 10,000 person years
GP Attendance 714 (95% CI 692-736) 645 (95% CI 616-673)
A&E Attendance 1507 (95% CI 1465-1550) 919 (95% CI 887-952)
Table 2.1.1 – Attendances rates between 2007-2017 (GP) 2011-2017 (A&E)
Of the total cohort with complete records, 41.5% of those aged 0-4 years attended a health care setting at least once for an injury compared to 33.3% for those aged 5-10% (see Table 2.1.2). Those children who attended for an injury whilst aged 0-4 were 39% more likely (95% CI 1.27-1.53, p<0.001) to attend again for an injury aged 5-10.
Age 0-4 Age 5-10
Individual Children Injured
Number of Injury Attendances
Individual Children Injured
Number of Injury Attendances
GP Attendance 2740 3905 1525 1981
A&E Attendance 3427 4793 2035 3086
Total 4542 8698 2871 5067 * Total for individual children in not a sum of GP and A&E attendances but represents a count of individual children who had at least one injury attendance, they may have attended multiple settings.
Table 2.1.2 – Attendances by individual children and age group between 2007-2017 (GP) 2011-2017 (A&E)
Utilisation by healthcare setting is considered further in Section 4.0. The following sections consider total attendances (both A&E and GP settings).
2.2 Seasonality and Attendance
Attendances for injury display a seasonal pattern (Figure 2.2.1), with lowest attendance during months with the shortest daylight hours (November – February) and the highest during months with the longest daylight hours (May – August). This difference is more pronounced for ages 5-10 where injury attendances in June are more than double those in December.
Figure 2.2.1 – Seasonality of attendances

8
2.3 Associations and Attendance
Associations between exposures and attending a healthcare setting one or more times as a result of an injury were explored. The data presented is unadjusted. Associations were identified initially, any reporting a p value of 0.2 or below were carried through for subsequent analysis. Table 2.3.1 details associations for both age groups. Confounding factors (factors which influence both exposure and the injury outcome) were included in the final analysis and are also reported. Mother in receipt of means tested benefits and housing tenure (i.e. whether the mother owned or rented their house) were used as proxy measurements for deprivation. Potential exposures for analysis were identified based the findings of other studies as well as exploration of data available in the cohort such as early years foundation assessments regarding childhood development and measures of obesity from the national child measurement programme. Overall, male children aged 0-4 years were 1.37 times (95% CI 1.11 – 1.69, p=0.003) more likely to attend a healthcare setting at least once for an injury compared to female children and 1.52 times (95% CI 1.20 – 1.84, p=0.001) if aged 5-10. Ethnicity was not a statistically significant factor in attendance for either age group. There were few other factors associated with injury attendance. Children whose mother was educated to above A Level standard (or equivalent for non-UK based education) were 36% less likely to attend for an injury compared to other education levels. Children of fathers aged 46 or over were 3 times more likely to attend for an injury than those of other age groups but these were only significant for ages 5-10. Other factors explored which did not show associations included early years foundation stage profile scores, strength and difficulties scores, overweight or obese children at ages 4/5 (as measured in the national child measurement programme). Strengths and difficulty questionnaire scores including measures of hyperactivity were not included in the final analysis as significant associations were not observed in the initial analysis. Maternal mental health presented the only significant association for an injury attendance for children aged 5-10 within the exploratory analysis. Children whose mother had a General Health Questionnaire score on or above the threshold indicative of mental health disorders at the baseline questionnaire were 34% more likely (95% CI 1.06-1.69, p=0.015) to attend for an injury compared to those below the threshold.

9
(All attendances i.e. GP &/or A&E) Age 0-4 Age 5-10
OR 95% CI p value OR 95% CI p value
Exposure
Maternal Mental Health (GHQ)
- Below Threshold 1 - - 1 - -
- Threshold or Above 0.98 0.80-1.20 0.860 1.34 1.06-1.69 0.015
Overweight or obese at ages 4/5
- No 1 - - 1 - -
- Yes 1.18 0.88-1.57 0.272 1.12 0.81-1.57 0.491
EYFSP (07) – Managing feelings and behaviour
- Emerging 1 - - 1 - -
- Expected 0.91 0.64-1.28 0.573 0.86 0.59-1.29 0.499
- Exceeding 0.87 0.54-1.40 0.566 0.75 0.44-1.30 0.310
EYFSP (04) – Moving and handling
- Emerging 1 - - 1 - -
- Expected 0.90 0.62-1.29 0.558 1.03 0.68-1.56 0.880
- Exceeding 0.92 0.57-1.48 0.731 1.42 0.83-2.43 0.199
Confounders
Gender - Female 1 - - 1 - -
- Male 1.37 1.11-1.69 0.003 1.52 1.20-1.94 0.001
Ethnicity - White British 1 - - 1 - -
- Pakistani 1.01 0.70-1.45 0.956 1.06 0.71-1.59 0.778
- Other 0.71 0.48-1.05 0.084 0.92 0.60-1.43 0.714
Housing Tenure
- Owned (inc. Mortgage) 1 - - 1 - -
- Rented 1.07 0.83-1.38 0.610 0.87 0.65-1.18 0.379
- Other 1.19 0.81-1.75 0.366 0.75 0.47-1.19 0.219
Means Tested Benefits
- Yes 1 - - 1 - -
- No 0.82 0.64-1.05 0.123 1.10 0.83-1.46 0.502
Mother Employed
- Yes 1 - - 1 - -
- No 0.94 0.72-1.23 0.666 1.35 0.99-1.82 0.054
Mother’s Level of Education
- GCSE or below 1 - - 1 - -
- A Level 1.15 0.72-1.30 0.826 0.81 0.57-1.14 0.221
- Higher than A Level 1.09 0.79-1.41 0.558 0.64 0.46-0.90 0.010
- Other 0.94 0.62-1.42 0.768 0.72 0.45-1.15 0.171
Father’s Level of Education
- GCSE or below 1 - - 1 - -
- A Level 1.06 0.78-1.45 0.704 0.97 0.68-1.39 0.872
- Higher than A Level 1.09 0.82-1.44 0.558 0.80 0.58-1.11 0.187
- Other 0.96 0.72-1.30 0.807 0.80 0.57-1.12 0.198
Mother’s Age at Birth
- 15 and under 1 - - 1 - -
- 16 to 25 1.29 0.81-2.04 0.285 0.96 0.55-1.66 0.886
- 26 to 35 0.89 0.60-1.34 0.590 1.10 0.68-1.78 0.706
- 36 to 45 - - - - - -
- 46 and above - - - - - -
Father’s Age at Birth
- 15 and under - - -
- 16 to 25 1 - - 1 - -
- 26 to 35 0.81 0.61-1.07 0.135 0.83 0.60-1.14 0.255
- 36 to 45 0.73 0.50-1.06 0.097 0.76 0.50-1.17 0.218
- 46 and above 0.99 0.46-2.06 0.979 2.98 1.28-6.90 0.011
Parental Country of Birth
- UK 1 - - 1 - -
- Mother non-UK born 0.89 0.60-1.32 0.567 0.75 0.48-1.17 0.208
- Both parents non-UK born 0.90 0.64-1.27 0.563 0.95 0.65-1.39 0.789
Household with children <15yrs
- 0 1 - - 1 - -
- 1 0.97 0.75-1.25 0.813 0.93 0.70-1.25 0.644
- 2-3 1.10 0.82-1.48 0.520 0.96 0.69-1.34 0.808
- 4 and more 0.88 0.47-1.64 0.687 0.63 0.31-1.30 0.215
Child receives free school meals
- No 1 - - 1 - -
- Yes 1.06 0.80-1.41 0.69 1.01 0.73-1.39 0.954
Special Education Needs
- EHCP 1 - - 1 - -
- Not SEN 1.56 0.76-3.24 0.228 0.96 0.45-2.04 0.906
- SEN Support 1.95 0.95-4.00 0.070 0.92 0.43-1.96 0.833 Table 2.3.1 – Associations with injury attendance

10
Figures 2.3.1 and 2.3.2 show the proportion of injury attendances by Index of Multiple Deprivation (IMD) quintile for both age groups. These figures show a decreasing trend of attendances with decreasing deprivation. It should be noted that a significant proportion of the Bradford cohort reside in the some of the most deprived wards nationally (66% reside in wards in the most deprived quintile. Table 2.3.2 shows the odds of injury by deprivation for both age groups. Those in the least deprived quintile were 49% and 39% less likely to have an injury attendance compared to the most deprived at ages 0-4 and 5-10 respectively.
Figure 2.3.1 – Proportion of injury attendance by deprivation ages 0-4
Figure 2.3.2 – Proportion of injury attendance by deprivation ages 5-10
IMD Quintile Age 0-4 Age 5-10
OR 95% CI p value OR 95% CI p value
1 (most deprived) 1 - - 1 - -
2 0.90 0.82 - 1.00 0.050 0.87 0.78 – 0.98 0.017
3 0.88 0.78 – 0.99 0.039 0.89 0.78 – 1.02 0.096
4 0.75 0.59 – 0.94 0.014 0.79 0.61 – 1.02 0.070
5 (least deprived) 0.51 0.36 – 0.70 0.000 0.61 0.43 – 0.87 0.006 Table 2.3.2 – Chance of injury attendance by IMD (univariate analysis)

11
3.0 Injury Profile
Chapter Summary
Data limitations of routinely recorded data prevent analysis of injury intent and injury mechanism
Issues with precision of coding mean that it is not possible to conclusively determine between 30-40% of injury nature and anatomical region affected
Bruise or superficial injury and cut / bite / other open wound accounted for approximately 40% of total attendances for both age groups and were higher as a total proportion for males
Fractures and sprains and dislocation increased as a proportion of total injuries from 16% ages 0-4 to 25% ages 5-10 and were higher as a total proportion for females
Burns decreased as a proportion of total injuries from 4% for ages 0-4 to 1% for ages 5-10
Injuries to the head and neck accounted for between 33% and 28% of total attendances for ages 0-4 and 5-10 respectively and were higher as a total proportion for males
Injuries to the shoulder and upper arm were higher in females as a total proportion compared to males
Injuries to the ankle and foot increased as a total proportion from 3% to 7% for ages 0-4 and 5-10 respectively
Fractures to limbs and extremities increased as a total proportion with age
Over 50% of injuries to the head and neck were either a bruise or superficial injury and cut / bite / other open wound
Fractures to lower limbs decreased as a total proportion of injuries with age, in contrast they increased for hand and wrist
Differences by ethnicity were limited

12
3.1 Intent
Injury intent is an important characteristic but was found to be poorly represented in the ICD-10 codes. Unfortunately other markers of intent were not included in the data and it has therefore not been possible to explore this attribute.
3.2 Mechanism
At least 60% of mechanism information is missing in the available data. As with injury intent, injury mechanism is poorly represented in the ICD-10 codes referenced within the dataset and other information was not readily available to identify potential injury mechanisms. Attempts were made to review presenting symptoms for A&E attendances but missing data remains a substantial proportion. Mechanism of injury is therefore not reported.
3.3 Nature
The data for nature of injury, the type of injury received, is more complete. 2% or less was missing though approximately one third of all attendances were coded as “other” (see Table 3.3.1). This could be improved further in the future if healthcare staff recording this information selected more precise coding. Approximately 25% of A&E attendances were coded as “other” compared with approximately 40% of GP attendances. Burns and thermal injuries accounted for a much smaller proportion of total injuries in ages 5-10 compared with 0-4 (1% vs. 4% respectively). Fractures and sprains as a proportion of total injuries were however higher in this age group (fractures 16% vs. 10%, sprains and dislocation 9% vs. 6% respectively). Statistically significant gender differences were evident across both age groups. Females had a higher proportion of fracture injuries, approximately 3-4% higher as a total proportion compared with males. Sprains and dislocation injuries were also between 2-5% higher. Males had a higher proportion of cut / bite / open wound injuries (approximately 3-4% higher as a total proportion) than females. Concussion / head injuries and poisonings made up less than 1% of all injuries as a total proportion across both age groups. Differences by ethnicity were not significant.
Nature Count Both Male Female Count Both Male Female
Bruise or Superficial Injury 2602 20% 21% 19% 1640 19% 20% 17%
Burn/Thermal 483 4% 3% 4% 93 1% 1% 1%
Concussion/Head Injury 51 0% 0% 0% 37 0% 0% 0%
Cut/Bite/Other Open Wound 2352 18% 20% 16% 1725 20% 21% 18%
Fracture 1301 10% 9% 12% 1341 16% 14% 18%
Internal inc. Foreign Body 701 5% 5% 6% 321 4% 4% 4%
Poisoning 163 1% 1% 2% 51 1% 0% 1%
Sprain/Dislocation 721 6% 5% 7% 796 9% 7% 13%
Other 4283 33% 34% 32% 2469 29% 31% 25%
Missing 272 2% 2% 2% 105 1% 1% 1%
Total 12929 100% 100% 100% 8578 100% 100% 100%
Age 0-4 Age 5-10
ProportionsProportions
Table 3.3.1 – Injury nature by age groups and gender
3.4 Anatomical Region
The data for anatomical region injured is relatively complete (see Table 3.4.1) with approximately 2% missing however a substantial proportion, approximately 40%, is coded as other. This is despite a manual review of A&E attendances which enabled the anatomical region to be identified for a further 4000 attendances. In the case of these 4000 the data entered was often less precise, selecting a category e.g. cut for “other” region rather than the anatomical region specifically affected. Approximately 40% of A&E data remained categorised as “other” after this manual review in comparison with GP data which is a little more precise though one third is still coded as “other”.

13
The head and neck is the single most common anatomical region affected in injury attendances accounting for between 33% and 28% in ages 0-4 and 5-10 respectively. There is small reduction in attendances for injuries affecting the head in the 5-10 age group compared to 0-4. Ankle and foot injuries also increase slightly as a proportion of total attendances in the 5-10 age group compared with 0-4. For other anatomical regions, attendance across both age groups is similar. The profile across genders is also very similar. Attendances for injuries to the head and neck as a total proportion were between 7-9% higher in males compared to females. In contrast shoulder and upper arm injuries in females were higher as a total proportion across both age groups, ankle and foot injuries were higher as a total proportion in ages 5-10. Differences by ethnicity were not significant.
Nature Count Both Male Female Count Both Male Female
Ankle and Foot 477 3% 3% 3% 696 7% 5% 9%
Head and Neck 4789 33% 36% 29% 2759 28% 31% 22%
Hip and Lower Limb 437 3% 3% 3% 287 3% 2% 3%
Internal inc. Foreign Body 665 5% 4% 5% 309 3% 3% 3%
Shoulder and Upper Arm 1292 9% 8% 11% 805 8% 7% 9%
Trunk 91 1% 1% 1% 99 1% 1% 1%
Wrist and Hand 973 7% 6% 7% 858 9% 8% 9%
Multiple 36 0% 0% 0% 37 0% 0% 0%
Other - Unspecified 5460 38% 38% 37% 3998 40% 39% 41%
Missing 338 2% 2% 3% 160 2% 1% 2%
Total 14558 100% 100% 100% 10008 100% 100% 100%
Age 0-4 Age 5-10
Proportions Proportions
Table 3.4.1 - Anatomical region injured by age groups and gender
3.5 Relationship between Nature and Anatomical Region
As a proportion of total injuries by anatomical region (Tables 3.5.1 and 3.5.2), fractures represent a substantial portion across both age groups for hip and lower limbs (approximately one third) with significant increases in proportions in age 5-10 for shoulder and upper limb (from 51% to 72% respectively) and wrist and hand (16 to 35% respectively). Sprain or dislocation as a proportion of total injuries for ankle and foot also increase from 35% to 49% for age groups 0-4 and 5-10 respectively. Bruise or superficial injuries and cut / bite / other open wound are common injuries for the head and neck jointly accounting for 50% to 52% across both age groups. Even though these may appear superficial injuries in comparison to other categories e.g. concussion, fracture etc it is not possible to draw any conclusions regarding injury severity based on this information. Age 0-4
Nature Ankle Head and Hip and Internal Shoulder and Trunk Wrist and Multiple Other Missing
Bruise or Superficial Injury 13% 29% 12% 1% 3% 30% 16% 26% 11% 0%
Burn/Thermal 4% 0% 9% 0% 4% 29% 16% 12% 4% 4%
Concussion/Head Injury 0% 1% 0% 0% 0% 0% 0% 0% 0% 0%
Cut/Bite/Other Open Wound 17% 21% 9% 0% 1% 20% 26% 24% 26% 14%
Fracture 13% 1% 35% 0% 51% 1% 16% 14% 9% 0%
Internal 4% 0% 3% 73% 2% 4% 3% 2% 2% 0%
Poisoning 0% 0% 0% 19% 0% 0% 0% 0% 0% 1%
Sprain/Dislocation 35% 1% 17% 0% 21% 4% 7% 12% 7% 0%
Other 15% 47% 15% 6% 19% 11% 16% 10% 40% 0%
Missing 0% 0% 0% 0% 0% 0% 0% 0% 0% 80%
Total 100% 100% 100% 100% 100% 100% 100% 100% 100% 100%
Region
Table 3.5.1 – Proportion of total injuries by anatomical region for ages 0-4

14
Age 5-10
Nature Ankle
Head and
Neck
Hip and
Lower Limb Internal
Shoulder and
Upper Limb Trunk
Wrist and
Hand Multiple Other Missing
Bruise or Superficial Injury 12% 28% 13% 4% 6% 31% 13% 27% 13% 0%
Burn/Thermal 2% 0% 4% 0% 1% 6% 2% 7% 1% 2%
Concussion/Head Injury 0% 1% 0% 0% 0% 0% 0% 0% 0% 0%
Cut/Bite/Other Open Wound 12% 24% 20% 1% 3% 19% 21% 27% 26% 32%
Fracture 16% 1% 32% 0% 72% 2% 35% 20% 16% 0%
Internal 2% 0% 4% 69% 1% 2% 2% 0% 2% 0%
Poisoning 0% 0% 0% 12% 0% 0% 0% 0% 0% 1%
Sprain/Dislocation 49% 1% 15% 0% 10% 18% 18% 10% 11% 0%
Other 8% 45% 12% 13% 7% 22% 10% 10% 32% 0%
Missing 0% 0% 0% 0% 0% 0% 0% 0% 0% 66%
Total 100% 100% 100% 100% 100% 100% 100% 100% 100% 100%
Region
Table 3.5.2 – Proportion of total injuries by anatomical region for ages 5-10
When reviewing the spread of different natures of injury across different parts of the body (Tables 3.5.3 and 3.5.4) it is notable that fractures occur across multiple regions but are particularly prevalent in shoulder and upper limb regions accounting for 39% and 32% in each age group respectively. Fractures to the lower limbs decrease as a total proportion with age (9% to 4%) whilst the reverse is true for the wrist and hand (9% to 16%). Dislocation and sprain injuries follow a similar pattern, with increases for the ankle and foot (15% to 28%) and wrist and hand (7% to 13%). Attendances for bruise or superficial injury (66% to 56%) and cut / bite / other open wound (42% to 38%) to the head account for significant proportions in both groups and across both age groups though they do reduce with age. Patterns for other injury natures are relatively similar across different age groups, the exception being burn and thermal injuries. Whilst differences do exist, patterns for injuries of other natures are relatively similar across different age groups, the exception being burn and thermal injuries where decreases are seen with age for wrist and hand (28% to 13%). Age 0-4
Nature Ankle
Head and
Neck
Hip and
Lower Limb Internal
Shoulder and
Upper Limb Trunk
Wrist and
Hand Multiple Other Missing Total
Bruise or Superficial Injury 2% 66% 2% 0% 1% 1% 5% 0% 23% 0% 100%
Burn/Thermal 3% 4% 6% 0% 9% 5% 28% 1% 42% 2% 100%
Concussion/Head Injury 0% 88% 0% 3% 0% 0% 0% 0% 9% 0% 100%
Cut/Bite/Other Open Wound 2% 42% 1% 0% 0% 1% 7% 0% 45% 1% 100%
Fracture 4% 4% 9% 0% 39% 0% 9% 0% 34% 0% 100%
Internal 2% 1% 1% 76% 3% 0% 3% 0% 13% 0% 100%
Poisoning 0% 0% 0% 98% 0% 0% 0% 0% 0% 2% 100%
Sprain/Dislocation 15% 4% 7% 0% 25% 0% 7% 0% 41% 0% 100%
Other 1% 51% 1% 1% 4% 0% 2% 0% 39% 0% 100%
Missing 0% 0% 0% 0% 0% 0% 0% 0% 0% 100% 100%
Region
Table 3.5.3 – Proportion of total injuries by nature for ages 0-4
Age 5-10
Nature Ankle
Head and
Neck
Hip and
Lower Limb Internal
Shoulder and
Upper Limb Trunk
Wrist and
Hand Multiple Other Missing Total
Bruise or Superficial Injury 4% 56% 2% 1% 2% 2% 5% 1% 28% 0% 100%
Burn/Thermal 9% 6% 9% 2% 6% 5% 13% 2% 45% 2% 100%
Concussion/Head Injury 0% 86% 0% 0% 0% 0% 0% 0% 14% 0% 100%
Cut/Bite/Other Open Wound 3% 38% 2% 0% 1% 1% 7% 0% 45% 2% 100%
Fracture 6% 2% 5% 0% 32% 0% 16% 0% 38% 0% 100%
Internal 3% 2% 3% 67% 1% 0% 4% 0% 18% 0% 100%
Poisoning 0% 0% 0% 98% 0% 0% 0% 0% 0% 2% 100%
Sprain/Dislocation 28% 4% 4% 0% 6% 2% 13% 0% 43% 0% 100%
Other 2% 51% 1% 1% 2% 1% 2% 0% 40% 0% 100%
Missing 0% 0% 0% 0% 0% 0% 0% 0% 0% 100% 100%
Region
Table 3.5.4 – Proportion of total injuries by nature for ages 5-10

15
4.0 Healthcare Utilisation
Chapter Summary
Males were more likely to attend for an injury in all settings except GP for ages 0-4
Fractures accounted for a higher proportion of total injuries in GP settings compared to A&E across both age groups
Bruise or superficial injury and cut / bite / other open wound accounted for a higher proportion of total injuries in A&E settings compared to GP across both age groups
Limb and extremity injuries accounted for a higher proportion of total injuries in GP settings compared to A&E across both age groups
Head and neck injuries accounted for a higher proportion of total injuries in A&E compared to GP settings across both age groups
Males were more likely to attend multiple times in both age groups compared to females
Approximately 50% of those attending for an injury were likely to attend two or more times
Attendances arriving by ambulance decreased with age, generally 90% or more of those attending A&E made their own transport arrangements
Over 50% of those attending A&E were discharged with no follow-up required, this decreased over time as follow-up by GP or Health Care Professional or referral to clinic increased
Burn and fracture injuries had the greatest follow-up by proportion of attendances
Admissions peaked at 5% of A&E attendances at age 7, admissions were predominately for head injuries and fractures
A slightly higher proportion of those arriving by ambulance were admitted
Patterns were similar across different ethnicities with some limited differences in multi-attendance and destination from A&E
4.1 Utilisation by Service Type
As previously identified, males were more likely to attend a healthcare setting because of an injury. When considering this further (see Table 4.1.1) this is consistent across age groups and settings with

16
the exception of ages 0-4 where utilisation of GP services for an injury event is similar between both genders. No statistically significant differences by ethnicity were observed for utilisation of different healthcare settings.
Female Female
OR OR 95% CI p value OR OR 95% CI p value
All 1 1.37 1.11-1.69 0.003 1 1.52 1.20-1.94 0.001
GP only 1 1.01 0.80-1.27 0.951 1 1.4 1.04-1.89 0.028
A&E only 1 1.59 1.28-1.98 0.000 1 1.56 1.21-2.03 0.001
Age 0-4 Age 5-10
Male Male
Table 4.1.1 – Healthcare setting utilisation by gender (unadjusted)
Table 4.1.2 shows the distribution of attendance at both A&E and GP by nature of injury. Surprisingly attendances at GP, as a total proportion, are higher for fractures in both age groups (15% and 20%) compared to A&E (7% and 13%). Attendances at A&E are higher for bruise or superficial injuries and cut / bite / other open wound.
Nature A&E GP A&E GP
Bruise or Superficial Injury 27% 9% 24% 10%
Burn / Thermal 3% 5% 1% 1%
Concussion / Head Injury 0% 0% 1% 0%
Cut / Bite / Other Open Wound 23% 11% 24% 13%
Fracture 7% 15% 13% 20%
Internal 6% 5% 4% 4%
Poisoning 0% 3% 0% 1%
Sprain / Dislocation 6% 5% 10% 8%
Multiple 0% 0% 0% 0%
Other 27% 42% 23% 40%
Missing 0% 5% 0% 3%
Total 100% 100% 100% 100%
Age 0-4 Age 5-10
Table 4.1.2 – Healthcare setting utilisation by nature
Table 4.1.3 shows the distribution of attendance at both A&E and GP by anatomical region of injury. A higher proportion of attendances at A&E are for head and neck injuries in comparison to GP across both age groups. In contrast attendances for limb injuries (hip and lower limb, shoulder and upper arm and wrist and hand) are higher as a total proportion for GP compared with A&E across both age groups.
Region A&E GP A&E GP
Ankle and Foot 3% 4% 7% 7%
Head and Neck 36% 30% 29% 26%
Hip and Lower Limb 2% 5% 2% 4%
Internal - Other 5% 4% 3% 3%
Shoulder and Upper Arm 7% 12% 6% 12%
Trunk 0% 1% 1% 2%
Wrist and Hand 6% 8% 8% 9%
Multiple 0% 0% 0% 0%
Other - Unspecified 41% 33% 44% 32%
Missing 0% 5% 0% 4%
Total 100% 100% 100% 100%
Age 0-4 Age 5-10
Table 4.1.3 – Healthcare setting utilisation by anatomical region

17
4.2 Multiple Attendances
Of those who attended a healthcare setting for an injury, approximately 50% did so only once within each age group (see Table 4.2.1). Males were more likely to attend 3 or more times compared with females as a proportion of children injured. Other ethnicities were less likely to attend on more than 1 occasion, 80% attended once in ages 0-4 compared to approximately 75% for White British and Pakistani ethnicities and 64% compared to approximately 56% for ages 5-10 for respective ethnicities.
No. Attendances Male Female Male Female
1 Attendance 49% 54% 52% 58%
2 Attendances 27% 27% 29% 27%
3 or more Attendances 24% 19% 19% 15%
Age 0-4 Age 5-10
Table 4.2.1 – Attendances of injured children by age group
4.3 Arrival Mode (A&E)
The vast majority of children and their families/guardians attending at A&E made their own travel arrangements. Arrival via ambulance was highest for children under 1 year of age (12%) with a declining trend by age (see Figure 4.3.1). This trend was statistically significant for both ages 0-4 (p=0.014) and 5-10 (p=0.028). Male children were more likely as a proportion of total attendances to attend by ambulance. In ages 5-10 this was statistically significant with 8% of males compared to 4% of females arriving by ambulance (p<0.001). There were no statistically significant differences in arrival method when considering ethnicity for either age group.
Figure 4.3.1 – A&E arrival mode by age
4.4 Destination (A&E)
Hospital admissions occurred for only a small proportion of those attending A&E (see Figure 4.4.1), peaking at about 5% by the age of 7. The vast majority of attendances were discharged without a need for follow-up, however as a total proportion this began to decrease after the age of 4. Discharge with follow-up by GP or another Health Care Professional (HCP) generally increased with

18
from the age of 4 after an initially high start point at 1 year of age. Referral to clinic within hospitals e.g. out patients or fracture clinic remained between around 15-20% of total attendances across age groups. Patterns were similar by both gender and ethnicity. Admission and referral to clinic / outpatients was lower in White British compared to Pakistani and Other ethnicities (p<0.001) for the 5-10 age group only.
Figure 4.4.1 – Destination of child as a proportion of total injury attendance by age
Figures 4.4.2 and 4.4.3 show the destination of patients by nature of injury as a proportion of total A&E attendances. Admissions were predominately for head injuries and fractures but still only accounted for a small proportion of total patient destinations. The majority (as a total proportion) of fractures and burns / thermal injuries were followed up either in clinic or by another healthcare professional. Specifically for poisonings, a higher proportion of cases were discharged for follow-up by a healthcare professional for ages 5-10 compared to ages 0-4 however there were no admissions for poisonings in the 5-10 age group. For the majority of other injuries the major destination was discharge with no follow-up required.

19
Figure 4.4.2 – Destination of A&E attendances by nature for age 0-4
Figure 4.4.3 – Destination of A&E attendances by nature for age 5-10
Figures 4.4.4 and 4.4.5 show the destination of patients by anatomical region injured as a proportion of total A&E attendances. Admissions were predominately for upper and lower limb injuries. Referrals to clinic or other healthcare professional also accounted for significant proportions of upper and lower limb injuries. The majority of injuries involving the head and neck injuries were discharged with no further follow-up required. The patterns across both age groups are similar. A higher proportion of injuries to the ankle and foot and trunk at ages 0-4 were referred on to clinic or other health care professional. A higher proportion of injuries to the shoulder and upper limb were referred on to clinic or health care professional at ages 5-10.

20
Figure 4.4.4 – Destination of A&E attendances by anatomical region for age 0-4
Figure 4.4.5 – Destination of A&E attendances by anatomical region for age 5-10
4.5 Associations with Admission
A greater proportion of those arriving at A&E via ambulance were admitted, across both age groups (see Table 4.5.1). The proportion admitted was greater for the age group 5-10 compared to 0-4. It is worth noting however that the majority were discharged with no follow-up required, with similar proportions irrespective of mode of arrival.
Count Proportion Count Proportion Count Proportion Count Proportion
Hospital Admission 31 6% 90 2% 27 10% 122 3%
Referred to Clinic / Outpatients 42 9% 937 19% 22 8% 698 18%
Discharged with follow-up by GP/HCP 116 24% 930 19% 63 24% 894 23%
Discharged, no follow up required 292 60% 3027 60% 140 54% 2208 56%
Other 4 1% 41 1% 7 3% 19 0%
Total 485 100% 5025 100% 259 100% 3941 100%
p=0.000 p=0.000
Age 5-10Age 0-4
Ambulance Self Ambulance Self
Table 4.5.1 – Destination of attendance by arrival mode

21
5.0 Implications and Next Steps Implications of the analysis and recommendations for action are detailed in this section. They are set in the context of the wider four step framework for reducing childhood injuries detailed in the 2018 PHE report “Reducing unintentional injuries in and around the home among children under five years” (2). The first step recommends reviewing and understanding the local injury profile, auditing existing child injury prevention activities (for example within family nurse partnerships) and identifying neighbourhoods and groups who may benefit from a targeted approach to inform the development, implementation and monitoring of an injury prevention action plan in stages two to four (2). Nationally reported data shows that injury admissions in Bradford are similar to the national average for children aged 0-4 but above for those aged 0-14 (5). This health needs assessment has shown that the incidence of injury attendances (compared to admissions) are significantly higher, with admissions accounting for only a small proportion of total attendances at A&E. Childhood injuries are therefore an important issue locally, particularly with regard to healthcare utilisation. Guidance on injury prevention for the under 15s in the home is available from NICE (PH29 (13) and PH30 (14)) and a guide for Commissioners (15) detailing cost effective child injury prevention interventions at home is also available. The PHE framework for child injury prevention details an approach for assessing current injury prevention activities locally, actions to take to strengthen injury prevention within wider work programmes and a guide for monitoring injury prevention locally. Additional guidance for Health Visitors (1) is also available as one of the six high impact areas for child health.
Recommendation 1: The PHE framework for child injury prevention should be applied locally in Bradford to progress injury prevention and risk reduction locally.
Those attending for an injury at ages 0-4 were 39% more likely to attend for an injury at ages 5-10 compared with those who did not.
Recommendation 2: Opportunities to provide injury prevention advice at first injury attendance should be explored given those injured are more likely to re-attend at a later age with an injury.
Seasonality appears to be a factor in injury attendance, with increasing attendance corresponding to longer day light hours, this is not necessarily the same as school holidays which occur at points throughout the year.
Recommendation 3: Seasonality should be considered as a factor within future injury prevention activities.
Poor maternal mental health at recruitment during pregnancy was shown to be associated with an increased risk of injury at ages 5-10.
Recommendation 4: Programmes to support and improve maternal mental health should continue to be supported as an association between poor maternal mental health and childhood injury has been identified. Recommendation 5: Further exploration of data regarding maternal mental health in the Born in Bradford cohort would be useful to identify whether continued mental health issues were

22
experienced by the mother during the child’s early years and whether any causative links can be established. This would aid understanding regarding support for maternal mental health as the child ages as well as during the first few years of life.
Attendance due to an injury was higher for males compared with females, in line with previous studies (being 37-52% higher for ages 0-4 and 5-10 respectively). That said, there were a number of gender differences within injury presentations with fractures, sprains and dislocations accounting for a higher proportion of injuries in females compared to males, whereas males had a higher proportion of attendances for bruises, cuts and other wounds, particularly to the head.
Recommendation 6: Gender as a risk factor should be considered within injury prevention activities. This may include targeting males more generally and females specifically regarding fractures and injuries to limbs and extremities. Data available in the future (see Recommendation 8) will help improve understanding of injury mechanism and intent to target prevention activities.
Deprivation has been shown in previous studies and in this health needs assessment to be associated with injury attendance. Within this analysis no specific components of deprivation e.g. poor rental housing or overcrowding were identified as being associated with injuries. That said, Bradford does have a high proportion of children living in some of the most deprived areas of the country.
Recommendation 7: Injury prevention interventions and opportunities should be considered in Bradford given that increasing deprivation is associated with higher incidence of injuries and that a significant proportion of the population live in some of the most deprived areas of the country.
The limitations in available data have already been acknowledged nationally. New injury recording mechanisms in A&E through an Emergency Care Data Set (7) should go someway to address these issues and provide richer data in terms of injury mechanism etc. Precision of coding is likely to remain an issue for primary care data however.
Recommendation 8: Future health needs assessments and monitoring of injuries in Bradford should utilise the new Emergency Care Data Set (when available) to provide greater insight into injury mechanisms and intent to inform potential future injury prevention opportunities. Recommendation 9: Support for coding for Primary Care Practitioners should encompass recording of injuries and enable improved specificity of coding regarding the nature of injury and anatomical region affected.
The analysis shows that attendance at A&E and GP settings for injuries are significant, admissions account for a small proportion of A&E attendances. It is a limitation of this analysis that it has not been possible to establish severity of injury. Whilst the priority areas identified by PHE (2) account for small proportions of total injury attendances in the cohort no conclusions regarding their significance should be drawn from this. What is apparent is that attendance due to injuries to the head, especially cuts and superficial wounds account for a significant proportion of all attendances.
Recommendation 10: Accepting the limitations of the available data, there are potential opportunities to consider advice available and offered to the public regarding types of childhood injury, signs and symptoms to be aware of and where medical support (e.g. minor injuries) may be best obtained so as to best manage utilisation of health services.

23
6.0 References 1. Public Health England and Department of Health and Social Care. (2018). Early years high impact area 5: Managing minor illnesses and reducing accidents (improving health literacy). Health visitors leading the Healthy Child Programme. [Online] 30th November 2018. https://assets.publishing.service.gov.uk/government/uploads/system/uploads/attachment_data/file/756697/early_years_high_impact_area_5.pdf 2. Public Health England. (2018). Reducing unintentional injuries in and around the home among children under five years. [Online] 14th September 2018. https://assets.publishing.service.gov.uk/government/uploads/system/uploads/attachment_data/file/696646/Unintentional_injuries_under_fives_in_home.pdf.
3. Bradford District Partnership. (2016). Bradford District Plan 2016-2020. [Online] 30th November 2018. https://bdp.bradford.gov.uk/media/1335/bradford-district-plan-2016-20.pdf 4. Bradford and Airedale Health and Wellbeing Board. (2018). Connecting people and place for better health and wellbeing: A Joint Health and Wellbeing Strategy for Bradford and Airedale 2018-2023. [Online] 30th November 2018. https://bdp.bradford.gov.uk/media/1331/connecting-people-and-place-for-better-health-and-wellbeing-a-joint-health-and-wellbeing-strategy-for-bradford-and-airedale-2018-23.pdf
5. Public Health England. Public Health Outcomes Framework. Public Health Health Profiles. [Online] 14th September 2018. https://fingertips.phe.org.uk/profile/public-health-outcomes-framework. 6. Lyons RA, Turner S, Lyons J, et al. All Wales Injury Surveillance System revised: development of a population-based system to evaluate single-level and multilevel interventions. Injury Prevention Published Online First: 09 December 2015. doi: 10.1136/injuryprev-2015-041814 7. Kirkwood G, Hughes TC, Pollock AM. Unintentional injury in England: an analysis of the emergency care data set pilot in Oxfordshire from 2012 to 2014. J Epidemiol Community Health 2017;71:289-295. 8. Hardy M.L. 2007. Accidental Injuries in Primary School Aged Children. PhD Thesis, University of Bradford. 9. Baker R, Tata LJ, Kendrick D, et al Identification of incident poisoning, fracture and burn events using linked primary care, secondary care and mortality data from England: implications for research and surveillance. Injury Prevention 2016;22:59-67. 10. Born in Bradford. 2018. Born in Bradford. [Online] 14th September 2018 https://borninbradford.nhs.uk/ 11. Raynor P; Born in Bradford Collaborative Group. Born in Bradford, a cohort study of babies born in Bradford, and their parents: protocol for the recruitment phase. BMC Public Health. 2008 Sep 23;8:327. doi: 10.1186/1471-2458-8-327. 12. Wright J, Small N, Raynor P, Tuffnell D, Bhopal R, Cameron N, Fairley L, Lawlor DA, Parslow R, Petherick ES, Pickett KE, Waiblinger D, West J; Born in Bradford Scientific Collaborators Group. Cohort Profile: the Born in Bradford multi-ethnic family cohort study. Int J Epidemiol. 2013 Aug;42(4):978-91. doi:10.1093/ije/dys112. [Online] 14th September 2018. 13. NICE. Strategies to prevent unintentional injuries among children and young people aged under 15. NICE public health guidance 29. 2010. guidance.nice.org.uk/PH29 Accessed on 17 March 2014. 14. NICE. Preventing unintentional injuries in the home among children and young people aged under 15: NICE public health guidance 30. 2010. guidance.nice.org.uk/PH30 Accessed on 17 March 2014 15. Hayes, Mike and Kendrick, Denise (2016) A guide for commissioners of child health services on preventing unintentional injuries among the under fives. Documentation. Child Accident Prevention Trust. [Online] 14th

24
September 2018 http://www.makingthelink.net/tools/guide-commissioners-child-health-services-preventing-unintentional-injuries-among-under-fives 16. World Health Organization. 2004. Guidelines for conducting community surveys on injuries and violence. [Online] 14th September 2018 http://www.who.int/violence_injury_prevention/publications/surveillance/06_09_2004/en/

25
A. Methods
A.1 Data Sources and Preparation
Data from three different data sources were extracted and matched by a unique ChildID variable. Born In Bradford Information on the cohort and their families was sourced from the baseline questionnaire and other sources e.g. gender, ethnicity, maternal health, education information etc held by the Born in Bradford team. The extracted data covers the full time period of the cohort. General Practice Records of attendance at General Practice in Bradford due to an injury were extracted based on ICD-10 injury codes (see Annex B). The extracted data covers the time period 07.07.2007 to 08.08.2017. Data would have been recorded by General Practice using read codes matched to ICD-10. Hospital Accident and Emergency Records of attendance at A&E at Bradford Royal Infirmary due to an injury, extracted based on ICD-10 injury codes (see Annex B). The extracted data covers the time period 02.02.2011 to 10.12.2017. It covers all injury related attendances at Bradford Royal Infirmary only. Yorkshire Ambulance Service Discussions took place with colleagues Yorkshire Ambulance Service regarding potential access to ambulance service data. The ambulance service has valuable information such as geographic location data. Recording of information which would enable data linkage with BiB data has only recently begun. For this analysis it was therefore not possible to incorporate ambulance data. Discussions are however on-going to develop future data linkages between Bradford Institute for Health Research (including BiB) and Yorkshire Ambulance Service. Data Preparation All data extraction and manipulation was undertaken using Stata SE v.13.1 unless otherwise stated. New data variables were created for injury mechanism, nature, anatomical region based on ICD-10 codes. This was undertaken in Microsoft Excel according to reference spreadsheet which is available on request. A&E entries coded as “missing” or “other” for mechanism, nature and anatomical region were reviewed manually. Additional ICD-10 codes were categorised where they occurred in the same entry as an ICD-10 code in an attempt to address incomplete data. This was subsequently followed by a manual review of “presenting complaint” free text within the dataset. Further information can be found in Annex C. Prior to analysis, all entries coded as “Allergen” were dropped. They were contained within the GP dataset only but accounted for over 700 entries. They had originally been included based on the ICD-10 codes used to extract data as reported (see Annex B) but were not felt to sufficiently describe an injury.
A.2 Data Analysis
Three areas of data analysis were undertaken to:

26
i. establish the epidemiological profile of injuries including incidence rates and potential associations/explanatory variables
ii. describe the profile of injuries (intent, mechanism, nature, anatomical region affected) iii. describe healthcare utilisation
Basic descriptive statistics were utilised for the majority of analysis including chi2 tests for significance. A regression model was built to test for potential associations which may indicate why some children in the cohort were injured compared to those who were not. This took place in three stages. Potential variables were initially explored with univariable logistic regression, any outputs with a p value greater than 0.2 were dropped from subsequent analysis. The second stage involved exploring the variable in conjunction with confounders prior to exploring all variables and confounders simultaneously in the third stage. All model output reported is from the third stage unless otherwise stated. Incidence rates and model outputs were calculated using a sub-sample of the cohort where GP records were known to be complete. For age group 0-4 there were 10397 children with complete GP records and 8609 for age group 5-10. Limitations Table A.2.1 details the limitations in the available data and corresponding impacts.
Limitation Impact
Injury events where medical attention was not sought are not captured.
Analysis may both i) not report true scale of injuries or ii) the actual profile of injuries. Seeking medical care is not always indicative of injury severity however remains the best measure available at this time.
Injury attendances at health services other than GP Practices in Bradford and Bradford Royal Infirmary A&E are not captured.
There may be an underestimation of injury attendance and therefore event. Whilst this is acknowledged as BRI is the main provider of secondary care for children in the BIB cohort this impact is expected to be limited.
A&E data for Bradford Royal Infirmary is not available for the full duration of the cohort.
It has been accounted for in the calculation of incidence rates but it is acknowledged that there are limitations with respect to the count data reported.
GP record data may not be complete. Data for cohort participants with complete GP records was used in exploring potential associations and in the calculation of incidence rates to improve accuracy of estimates.
Location at time of incident was not available.
This prevents specific recommendations for injury prevention to be made and is an acknowledged limitation.
Activity at time of incident was not available.
This prevents specific recommendations for injury prevention to be made.
Intent of injury was not coded are there was insufficient detail in the majority of the ICD-10 codes to determine injury intent.
It is not possible to separate whether the injury occurred as a result of a deliberate or unintentional act/event and is an acknowledged limitation.
Injury attendances were not categorised in accordance with an injury severity scale.
It was not possible to assign injury severity to injury attendances. This prevents an understanding of the severity profile of injuries from being established and is an acknowledged limitation.
Table A.2.1. – Data and analysis limitations.

27
B. ICD-10 Codes From Lyons et.al. (2015).

28
C. Missing A&E Data Preparation
Mechanism Nature Anatomical Region
Step 0 – Unique Attendances 9710
None Other None Other None Other
Step 1 – Coding by ICD 10 injury codes only
M 8800 7 14 569 16 5635
C 903 9127 4059
Step 2 – Coding by additional ICD 10 non-injury codes
M 8800 7 14 568 16 5625
C 903 9128 4069
Step 3 – Coding by manual review of presenting complaint
M 7801 8 14 512 15 1483
C 1901 9184 8213 M = Missing C= Complete
The table below details the additional ICD-10 non-injury codes that were present in the hospital data and were reviewed manually to address missing information (Step 2 in table above).
Code Heading Mark-up Rationale
B34 Viral infection of unspecified site Mark as non-injury code Not sufficiently specific to injury event
B99 Other and unspecified infectious diseases
Mark as non-injury code Not sufficiently specific to injury event
G96* Other disorders of central nervous system
Mechanism – mark as non-injury code Nature – Internal Region - Internal
More detail about nature and region affected, assumption is that is injury related.
H57* Other disorders of eye and adnexa
Mechanism – mark as non-injury code Nature – Other Unspecified Region – Head and Neck
More detail about nature and region affected, assumption is that is injury related.
H61** Other disorders of external ear Exclude all but H61.1, mark-up as: Mechanism – mark as non-injury code Nature – Other Unspecified Region – Head and Neck
For H61.1 only, more detail about nature and region affected, assumption is that is injury related. For others not sufficiently specific to injury event.
I61* Intracerebral haemorrhage Mechanism – mark as non-injury code Nature – Internal Region – Head and Neck
More detail about nature and region affected, assumption is that is injury related.
J03 Acute tonsillitis Mark as non-injury code Not sufficiently specific to injury event
J06 Acute upper respiratory infections of multiple and unspecified sites
Mark as non-injury code Not sufficiently specific to injury event
J22 Unspecified acute lower respiratory infection
Mark as non-injury code Not sufficiently specific to injury event
J45** Asthma Exclude all but J45.0 and J45.8, mark-up as: Mechanism – Allergy Nature – Allergic Reaction
For J45.0 and J45.8 assume is allergic reaction – issue is could be hay fever. Provides more detail about nature

29
Region – Internal - Other and region affected, assumption is that is injury related. For others not sufficiently specific to injury event.
J70** Respiratory conditions due to other external agents
Exclude all but J70.0, J70.1, J70.8, J70.9 mark-up as: Mechanism – mark as non-injury code Nature – Internal Region – Internal - Other
For J70.0, J70.1, J70.8, J70.9 only, more detail about nature and region affected, assumption is that is injury related regarding exposure to an external agent.
K04 Diseases of pulp and periapical tissues
Mark as non-injury code Not sufficiently specific to injury event, likely secondary
K08** Other disorders of teeth and supporting structures
Exclude all but K08.1 and mark-up as: Mechanism – mark as non-injury code Nature – Other-Unspecified Region – Head
K08.1 specifically references accidents. For others not sufficiently specific to injury event.
L03 Cellulitis Mark as non-injury code Not sufficiently specific to injury event, likely secondary
L08 Other local infections of skin and subcutaneous tissue
Mark as non-injury code Not sufficiently specific to injury event, likely secondary
L30 Other dermatitis Mark as non-injury code Not sufficiently specific to injury event, likely secondary
M79** Other soft tissue disorders, not elsewhere classified
Exclude all but M79.5 and mark-up as: Mechanism - Foreign body Nature – Other-Unspecified Region – NspIC
M79.5 specifically references foreign body. For others not sufficiently specific to injury event.
N39 Other disorders of urinary system Mark as non-injury code Not sufficiently specific to injury event, likely secondary
R04* Haemorrhage from respiratory passages
Mechanism – Non-injury code Nature – Other-Unspecified Region – Internal-Other
More detail about nature and region affected, assumption is that is injury related.
R10 Abdominal and pelvic pain Mark as non-injury code Not sufficiently specific to injury event
R55 Syncope and collapse Mark as non-injury code Not sufficiently specific to injury event, unclear whether primary or secondary secondary
R69 Unknown and unspecified causes of morbidity
Mark as non-injury code Not sufficiently specific to injury event