childhood lead poisoning prevention children’s environmental health conference october 16-17, 2003
TRANSCRIPT

Childhood Lead Poisoning PreventionChildren’s Environmental Health ConferenceOctober 16-17, 2003


Lead Program Team
Neal Rosenblatt, Epidemiologist/Acting Administrator
Kenny Ratliff, Environmental Lead Program Coordinator
Brian Short, Environmental Inspector
Alvin Campbell, Environmental Inspector
Cheryl Duncan, Secretary
(502)564-2154
Healthy People 2010
8-11. Eliminate elevated blood lead levels in children.
20-7. Reduce the number of persons who have elevated blood lead concentrations from work exposures.
CDC Childhood Lead Poisoning Prevention Program (CLPPP)
• Surveillance
• Screening of children at risk
• Medical & environmental follow-up
• Education & Outreach
• Primary Prevention

Clinical Issues & Assessment
What are the signs and symptoms?
Signs & Symptoms of Lead Poisoning
• Subclinical – No real symptoms!
• Clinical– Anemia
– Abdominal pain
– Headache
– Constipation
– Seizures
– Coma
– Death

Neurological and Cognitive Effects of Lead Poisoning
• Learning disabilities
• Decreased IQ
• Decreased attention span
• Hyperactivity
• Impaired hearing
• Decreased growth
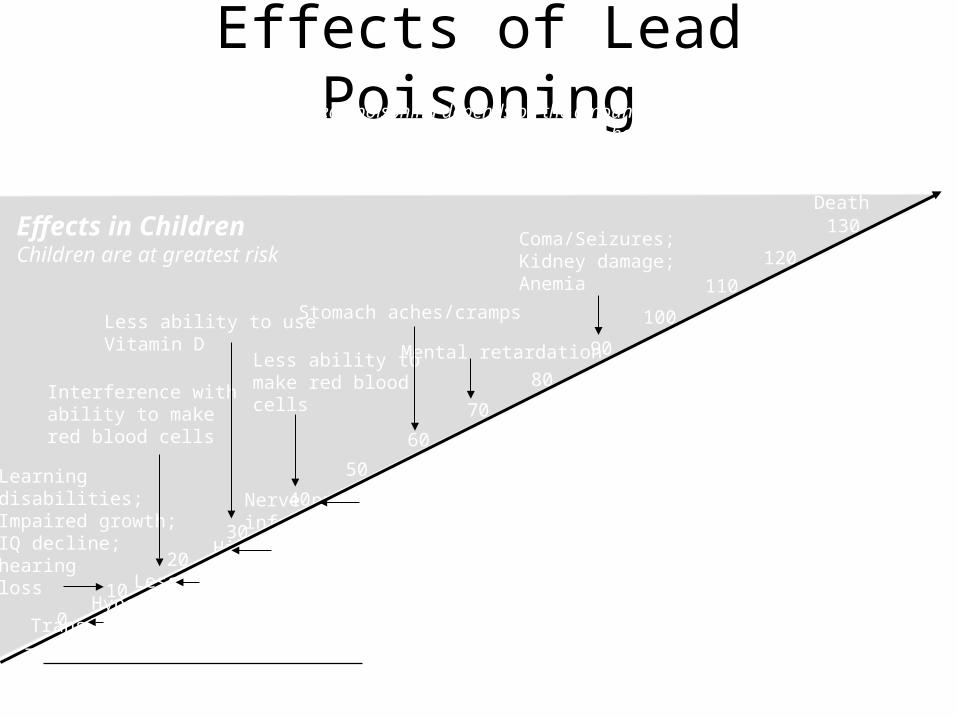
Effects of Lead Poisoning
0
70
120
80
90
100
110
130
10
20
30
40
50
60
ComaSeizures
Anemia
Nerve problems: decreased sensation; less ability to move quickly; infertility in men; kidney damage.
Higher blood pressure; hearing loss
Less ability to make red blood cells in womenHypertension/High blood pressure
Transfer of lead from mother to unborn child
The human body contains no lead naturally
Death
Coma/Seizures; Kidney damage; Anemia
Mental retardation
Stomach aches/cramps
Less ability tomake red blood cells
Less ability to use Vitamin D
Interference with ability to make red blood cells
Learning disabilities; Impaired growth;IQ decline; hearing loss
Effects in AdultsOccur at higher levels
Effects in ChildrenChildren are at greatest risk
The damage caused by lead poisoning depends on the amount of lead in the body and on how long that lead stays in the body. The effects shown here list the lowest amount
of lead at which research has shown them to occur. The numbers represent blood lead levels (micrograms per deciliter).

Kentucky Department for Public Health Screening Guidelines
“At every preventive health visit all children 6 months to 6 years of age are evaluated using the
questions on the “Verbal Risk Assessment for Lead Poisoning” to determine their exposure to and risk of lead poisoning…. a blood lead level test should be routinely done from 9-12 months
and at 24 months of age.”
NOTE: If a child is 9 months to 72 months of age and has never been tested, they should have a blood lead test.

Review these questions at each preventive health visit for all children ages 6 months to 6 years of age. Document in each child’s medical record at every preventive health visit that this assessment was done, any positive responses (s) and action taken.
1. Does the child live in or visit a building built before 1978 with peeling/chipping paint or with recent or ongoing remodeling?
2. Does child have a brother/sister/playmate who has or did have lead poisoning?
3. Do you (or a family member) work on a farm; on a bridge, tunnel, or high construction area; with batteries, ammunition, or visit a firing range?
4. Do you use any folk remedies that may contain lead or use pottery or ceramic ware for cooking, eating, or drinking?
Verbal Risk Assessment

Federal Screening Guidelines: Medicaid
• It is a FEDERAL MANDATE that children who are Medicaid recipients receive a blood lead test at 9-12 months and again at 24 months.
• Any child age 2 to 6 for whom no record of a lead test exists must also be screened.
• Medicaid pays for lead screenings and any diagnostic or treatment services for EBL cases (e.g. x-rays, medicines).
• Medicaid also reimburses for one environmental investigation per EBL household.

Lead Classification Chart
• Tool with guidelines for local health departments/private provider on assessment, interventions, and case management follow-up.
• Interventions based on blood lead results– Class I – < 10 mcg/dL– Class IIA – 10-14 mcg/dL– Class IIB – 15-19 mcg/dL– Class III – 20-44 mcg/dL– Class IV – 45-69 mcg/dL– Class V – >= 70 mcg/dL
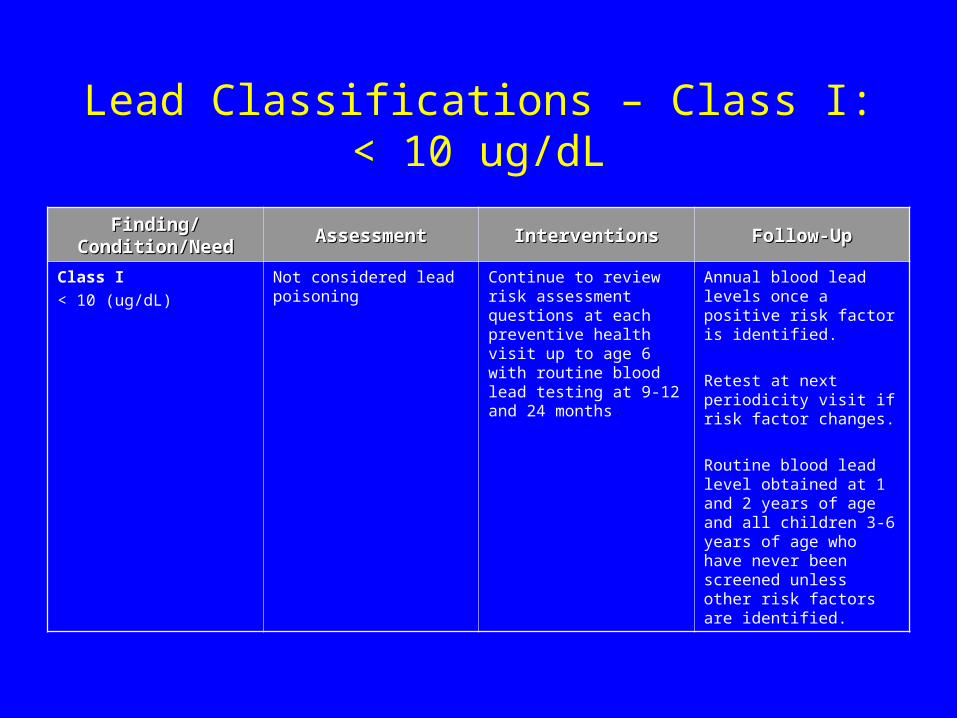
Lead Classifications – Class I: < 10 ug/dL
Finding/Condition/NeedFinding/Condition/Need AssessmentAssessment InterventionsInterventions Follow-UpFollow-Up
Class I
< 10 (ug/dL)
Not considered lead poisoning Continue to review risk assessment questions at each preventive health visit up to age 6 with routine blood lead testing at 9-12 and 24 months.
Annual blood lead levels once a positive risk factor is identified.
Retest at next periodicity visit if risk factor changes.
Routine blood lead level obtained at 1 and 2 years of age and all children 3-6 years of age who have never been screened unless other risk factors are identified.

Lead Classifications – Class IIA: 10-14 ug/dL
Finding/Condition/NeedFinding/Condition/Need AssessmentAssessment InterventionsInterventions Follow-UpFollow-Up
Class IIA
10-14 (ug/dL)
Level of concern Parent education pamphlet. Repeat blood lead levels every 12-20 weeks or until blood lead level is < 10 ug/dL.

Lead Classifications – Class IIB: 15-19 ug/dL
Finding/Condition/NeedFinding/Condition/Need AssessmentAssessment InterventionsInterventions Follow-UpFollow-Up
Class IIB
15-19 (ug/dL)
1st specimen at this level
2nd specimen remaining 15-19 ug/dL range
Parent education pamphlet.
Nurse may make home visit for visual investigation. Refer to local environmentalist for home visit investigations.
Repeat blood lead levels every 12 weeks or until level is < 10 ug/dL.
Repeat testing as for first 15-19 ug/dL specimen.
Establish a tracking system that assures retesting.

Lead Classifications – Class III: 20-44 ug/dL
Finding/Condition/NeedFinding/Condition/Need AssessmentAssessment InterventionsInterventions Follow-UpFollow-Up
Class III
20-44 (ug/dL)
Two (2) capillary specimens or one (1) venous specimen in this range or higher confirms diagnosis of lead poisoning.
Lead poisoned
Confirmatory test should be done within 1 week to 1 month. The higher the level the more urgent the confirmatory test. (NOTE: a confirmatory test is First venous specimen or capillary pair at this level)
Parent education pamphlet.
Medical Nutrition Therapy.
Refer to primary physician for medical evaluation.
Refer to environmental assessment.
Per home visiting guidelines, initial home visit by nurse is required if confirmed blood lead level is >= 20 ug/dL.
Submit 2nd specimen in one week (if capillary).
Repeat blood lead levels as advised by physician OR retest at 1-2 month intervals until children is 3 years of age AND:
(a) Blood lead level is < 15 ug/dL for 6 months.
(b) Hazards have been removed.
(c) There are no new hazards.
Jefferson County Health Department Lab will report all blood lead levels to the Lead Poisoning Prevention Program. Providers other than health departments are responsible for reporting blood lead levels to the local health department or the Lead Poisoning Prevention Program.

Lead Classifications – Class IV: 45-69 ug/dL
Finding/Condition/NeedFinding/Condition/Need AssessmentAssessment InterventionsInterventions Follow-UpFollow-Up
Class IV
45-69 (ug/dL)
Same as Class III
Same as Class III, except refer for medical evaluation within 48 hours.
Refer > 45 ug/dL for chelation therapy.
Same as Class III.
During and post-chelation, retest monthly or as ordered by the physician. Then follow retest schedule in Class III as above.

Lead Classifications – Class V: >= 70 ug/dL
Finding/Condition/NeedFinding/Condition/Need AssessmentAssessment InterventionsInterventions Follow-UpFollow-Up
Class V
>= 70 (ug/dL)
Same as Class III
Same as Class III, except refer for medical evaluation IMMEDIATELY while results of confirmatory test are awaited.
Same as Class III.

Family Teaching
• Have child tested at appropriate ages• Keep home clean, especially floors, window frames, window
sills
• Keep play areas clean (toys, pacifiers, bottles)• Keep children from chewing on painted surfaces such as cribs
and window sills

Family Teaching (continued)
• Have children play in grassy areas instead of soil• Have children wash their hands and face before
eating and going to bed• Ensure a well-balanced diet high in calcium and
iron and low fat• Clean or remove shoes before entering your home
to avoid tracking in lead from soil
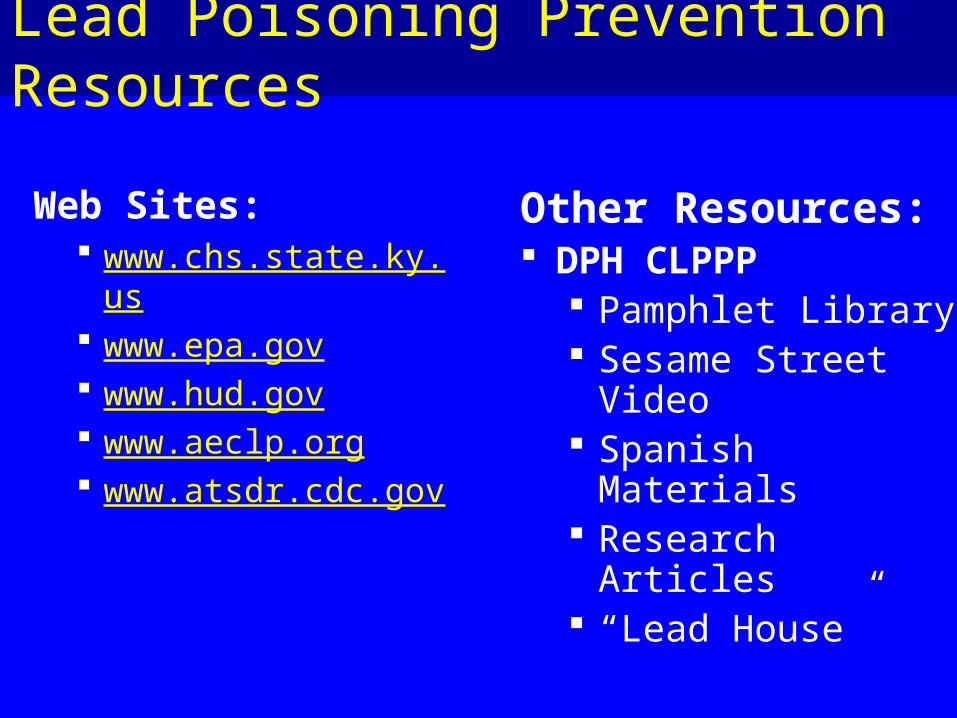
Lead Poisoning Prevention Resources
Web Sites: www.chs.state.ky.us www.epa.gov www.hud.gov www.aeclp.org www.atsdr.cdc.gov
Other Resources: DPH CLPPP
Pamphlet Library Sesame Street Video Spanish Materials Research Articles “Lead House”

Epidemiology
Identifying the sources and
defining the problem

Sources of Lead
• Deteriorated paint and paint dust (pre-1978)• Soil – Auto gas emissions (pre-1978)• Vinyl mini-blinds (pre-1996/U.S.)• Industrial emissions into air; battery factories• Home improvements (20% Remodeling)• Hobbies – Electronics; Ceramics• Folk medicine/home remedies: Azarcon, Greta• Pets
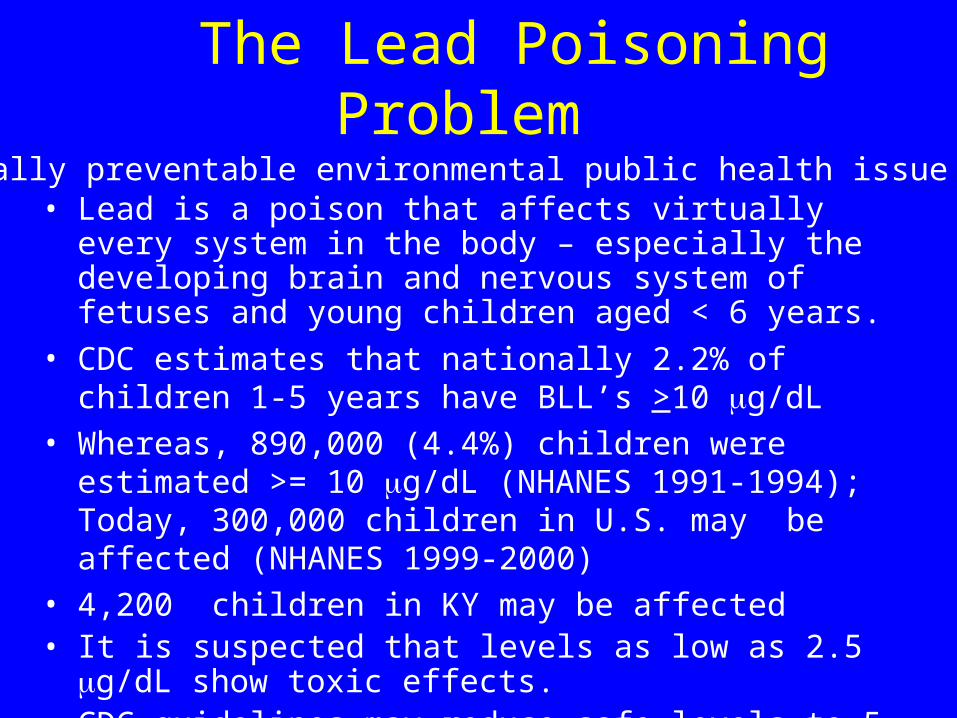
The Lead Poisoning Problem
• Lead is a poison that affects virtually every system in the body – especially the developing brain and nervous system of fetuses and young children aged < 6 years.
• CDC estimates that nationally 2.2% of children 1-5 years have BLL’s >10 g/dL
• Whereas, 890,000 (4.4%) children were estimated >= 10 g/dL (NHANES 1991-1994); Today, 300,000 children in U.S. may be affected (NHANES 1999-2000)
• 4,200 children in KY may be affected• It is suspected that levels as low as 2.5 g/dL show toxic effects. • CDC guidelines may reduce safe levels to 5 ug/dL this year.
• Totally preventable environmental public health issue

Levels of Concern – Then & Now• Since 1970 our understanding of
childhood lead poisoning has changed substantially.
BLLs considered elevated by the CDC and PHS
0
10
20
30
40
50
60
70
Year
Blo
od L
ead
Lev
el (u
g/dL
)
• Before the mid-1960s, a level above 60 g/dL was considered toxic.
• As investigators have used more sensitive measures and better study designs, the generally recognized level for lead toxicity has progressively shifted downward (>=10 g/dL < 6 years; >= 25 g/dL >= 16 years).
• Today, it is suspected that levels as low as 2.5 g/dL show toxic effects.
• CDC guidelines may reduce safe levels to 5 g/dL this year.
• As a result of new HUD regulations on lead-based paint hazards in federally owned housing, State legislatures are beginning to require health agencies to report to housing agencies addresses that lead-poison children (Indiana HEA-1171).
Pathophysiology of Lead Poisoning
How lead enters and leaves the body

Routes of Exposure
• Oral– primary route
• Inhalation
• Dermal

Exposure Periods
• Acute– 14 days or less
• Intermediate– 15 – 364 days
• Chronic– 365 days or more
NOTE: Half-life of lead in blood is 28 – 36 days.

Lead in the Body: Absorption Gastrointestinal Tract
• Gastrointestinal Tract. Primary site of lead absorption in children– Children absorb up to 50%; adults up to 10% of lead ingested
(Difference due mostly to gastrointestinal maturity)
– Approximately 68% is retained in the body of a child– Positive balance occurs when the daily ingestion of lead exceeds 5 g/kg
body weight– Lead is better absorbed with liquids than with solids, especially when the
stomach is empty Full stomach (adults) – 6% absorbed (PbB) Empty stomach (adults) – 60% – 80% absorbed (PbB)
– Deficiencies in trace minerals – Ca, Fe, Zn – enhance Pb uptake For example:
Iron deficiency 6-fold Low-mineral, high-fat diet 50-fold
Dietary fiber may facilitate lead elimination

Lead in the Body: Absorption Lungs
• Lungs. Absorption through the lungs is rapid and efficient• Up to 70% is absorbed
– if particle size is < 1 m (micrometer or micron)– 90% of lead in gasoline from inhaled motor exhaust is absorbed
• Inhaled lead that reaches the alveoli passes directly into blood circulation
• Larger particles are trapped in mucous secretions, transferred to the pharynx, and subsequently swallowed
• Primary pathway in children. Small particles of lead paint dust commonly found inside window casings and released with repeated window openings and closings are an important source of lead exposure in children

Lead in the Body: Absorption Skin
• Only a small portion of lead will pass through skin and enter the blood circulation– Usually from dust or soil
• More lead can pass through skin that has been damaged– Scrapes, scratches, wounds
• The only kinds of lead compounds that easily penetrate the skin are the additives in leaded gasoline, which is no longer sold to the general public
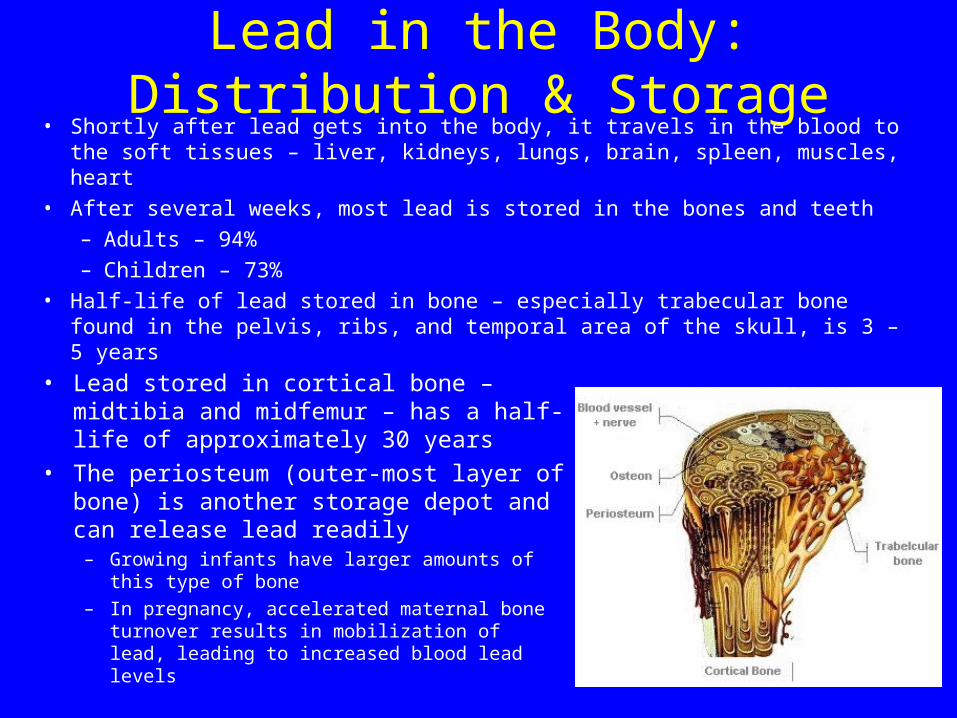
Lead in the Body: Distribution & Storage• Shortly after lead gets into the body, it travels in the blood to the soft tissues
– liver, kidneys, lungs, brain, spleen, muscles, heart
• After several weeks, most lead is stored in the bones and teeth
– Adults – 94%
– Children – 73%
• Half-life of lead stored in bone – especially trabecular bone found in the pelvis, ribs, and temporal area of the skull, is 3 – 5 years
• Lead stored in cortical bone – midtibia and midfemur – has a half-life of approximately 30 years
• The periosteum (outer-most layer of bone) is another storage depot and can release lead readily
– Growing infants have larger amounts of this type of bone
– In pregnancy, accelerated maternal bone turnover results in mobilization of lead, leading to increased blood lead levels
Lead in the Body: Distribution & Storage
• Lead tends to be more highly concentrated at bone surfaces where growth and remodeling are most active
• Physiological states – pregnancy, menopause, advanced age – or disease states – osteoporosis, prolonged immobilization – that are associated with increased bone resorption will tend to promote the release of lead from bone which, in turn, may contribute to an increase in concentrations of lead in blood

Lead in the body: Elimination
• Lead that is not stored is eliminated in urine or feces– 60% loss in urine
– 30% loss in feces
– 10% loss in hair and nail growth and sweat
• About 99% of the amount of lead taken into the body of an adult will leave in the waste within a few weeks, but only about 32% will be eliminated from a child
Lead in the Body: Protective Effects Diet & Nutrition
• Absorption of lead is influenced by dietary and nutritional calcium and iron status
• Inverse relationship between dietary calcium intake and blood lead concentrations
• Iron deficiency is associated with increased blood lead levels in children
• Lead may compete for absorption with other divalent cations such as cadmium, copper, magnesium, and zinc
• Inadequate total calories and infrequent meals (both of which are more likely to be found in children from lower socioeconomic groups) increase the absorption of ingested lead
• A high-fat diet appears to promote lead absorption

Surveillance
How do we find areas of highest risk?
Risk IndicatorsPrimary• Age of Housing
– Built prior to 1950 in concentrations of 27%
• Poverty• Elevated Blood Lead Prevalence
10 g/dL 12% of children aged 12-36 months
• Non-White Race (when prevalence data not available)– Confounds prevalence – Biases outreach activities
• Medicaid status
Other• Housing value• Pregnancy status
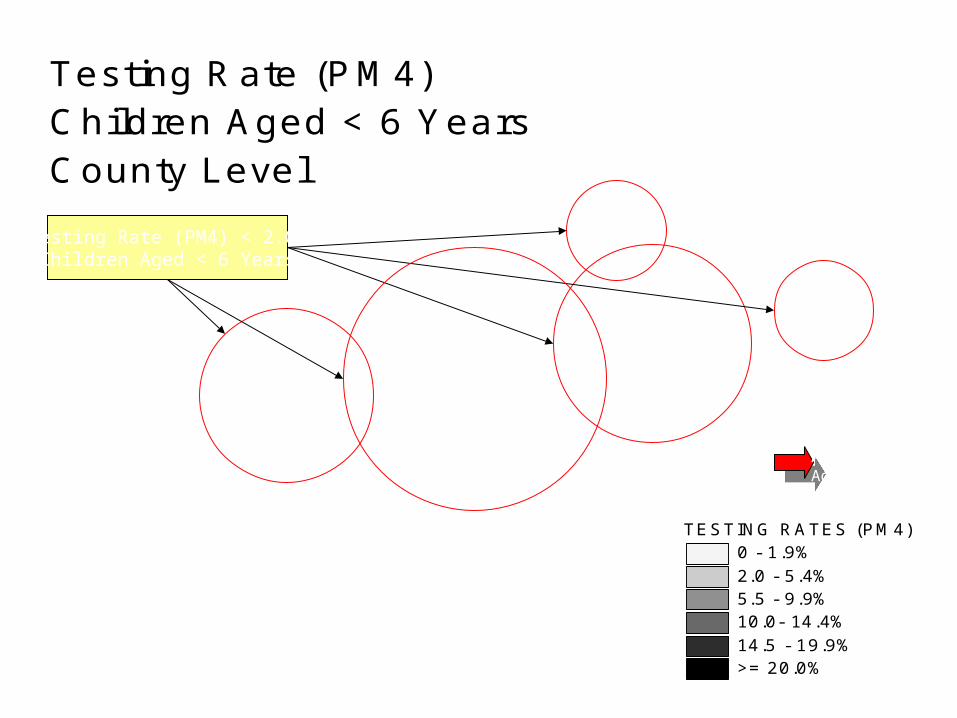
Testing Rate (PM4)Children Aged < 6 YearsCounty Level
TESTING RATES (PM4)0 - 1.9%2.0 - 5.4%5.5 - 9.9%10.0- 14.4%14.5 - 19.9%>= 20.0%
Testing Rate (PM4) < 2.0%Children Aged < 6 Years
National Testing Rate: 25.0%
Kentucky Testing Rate: 6.0%
Aged 1-2: 29.5%Aged < 6: 15.4%

Kentucky Highest Risk Counties*:Prevalence Among Children Aged 1-2 YearsBlock Groups Level (n=40)
Kentucky counties.shpBLOCK GROUPS - RISK LEVEL I & >= 12% prevalence aged 1-2 years
Highest Risk Defined As:
- Pre50 Housing >= 27% - >= 50% Children Aged < 6 Living Below Poverty - EBLL Prevalence Aged 1-2 Years >= 12%
Unit of Analysis = Block Group (County Level Significance)
Averaged Prevalence Among Children Aged 1-2 Years: 27.4%
Estimated Number of Children at Risk - Highest Risk Block Groups (n=40), (Risk Level I - County Level Significance): Aged 1-2: 1,191 Aged < 6: 3,651
N
EW
S
Louisville Metro, Phase I(27.2%, 13.0-77.3)
Harlan/Bell, Phase I(17.2%, 14.3-20.0)
Mason, Phase II-III(43.8%, 43.8)
Cumberland, Phase II-III(15.8%, 15.8)
Fulton, Phase I(35.0%, 35.0)
* Based on surveillance analysis of 37 counties significant at the county level.(Significance defined as concentration of pre50 housing >= 27% at the county level)
Kenton/Campbell, Phase II-III(28.6%, 12.5-76.9)
APPENDIX 2

TESTING RATE (PM4)AUDUBON HEAD START DISTRICTCHILDREN AGED < 6 YEARS
TESTING RATES (PM4)0 - 1.9%2.0 - 5.4%5.5 - 9.9%10.0- 14.4%14.5 - 19.9%>= 20.0%
AUDUBON HEAD START SERVICE AREA
National Testing Rate: 25.0%
Kentucky Testing Rate: 6.0%
Testing Rate (PM4)Aged 1-2: 7.0% (0.1 – 24.9%)
Aged < 6: 4.9% (0.3 – 17.0%)

TESTING RATES (PM4)0 - 1.9%2.0 - 5.4%5.5 - 9.9%10.0- 14.4%14.5 - 19.9%>= 20.0%
INDEPENDENTSPENNYRILE DISTRICTGREEN RIVER DISTRICTAUDUBON HEAD START SERVICE AREA
TESTING RATES (PM4)AUDUBON HEAD START SERVICE AREAPUBLIC HEALTH DISTRICT LEVELCHILDREN AGED < 6 YEARS
Green River (PM4)Aged 1-2: 1.5% (0.1 – 3.4%)Aged < 6: 1.5% (0.3 – 3.0%)
Independents (PM4)Aged 1-2: 3.0% (0.1 – 6.9%)Aged < 6: 2.6% (0.5 – 4.5%)
Pennyrile (PM4) Aged 1-2: 15.0% (0.1 – 24.9%)Aged < 6: 9.9% (2.1 – 17.0%)
National Testing Rate: 25.0%
Kentucky Testing Rate: 6.0%
Audubon Head Start Testing Rate: 4.9%

Louisville Metro

Jefferson County Risk AnalysisBlock Groups Level
Kentucky Department for Public HealthLead Poisoning Prevention Program
#
SHAWNEE
#
RUSSELL#
PARKLAND
#
PARK DUVALLE
#
PARK HILL
#
ALGONQUIN
#
SHELBY PARK
#
PHOENIX HILL
#
LIMERICK
#
CHICKASAW
#
CALIFORNIA
#
UNIVERSITY
#
PORTLAND (I.A)
#
OLD LOUISVILLE (I & I.A)
#
SOUTH LOUISVILLE (I.A)
#
TAYLOR BERRY (I.A)
#
SMOKETOWN JACKSON
JEFFERSON BLOCK GROUPSJEFFERSON BLOCK GROUPS - Risk Level III (>= 27% pre50; < 50% poverty; < 50% non-white)JEFFERSON BLOCK GROUPS - Risk Level II (>= 27% pre50; >= 50% poverty; < 50% non-white)
JEFFERSON BLOCK GROUPS - Risk Level I.A (>= 27% pre50; >= 50% poverty; >= 12% EBLL prevalence)
JEFFERSON BLOCK GROUPS - Risk Level I (>= 27% pre50; >= 50% poverty; >= 50% non-white; >= 12% prevalence))
JEFFERSON NE IGHBORHOODS
N
Estimated Risk - Level I Aged 1-2: 694 Aged < 6: 2,152
Estimated Risk - Level I.A Aged 1-2: 921 Aged < 6: 2,877
Estimated Risk - Level II Aged 1-2: 447 Aged < 6: 1,418
Estimated Risk - Level III Aged 1-2: 3,026 Aged < 6: 8,902
Risk defined as: I - >= 27% pre50; >= 50% poverty < 72 months; >= 50% NonWhite race; >= 12% prevalence aged 1-2 years I.A - >= 27% pre50; >= 50% poverty; >= 12% prevalence aged 1-2 years (% NonWhite race excluded) II - >= 27% pre50; >= 50% poverty; < 50% NonWhite race III - >= 27% pre50; < 50% poverty; < 50% NonW hite race
Risk indicators: Concentration of Pre50 housing >= 27% Percent of children aged < 6 living below poverty Percent of children aged < 6 of NonWhite race Prevalence of EBLL children aged 1-2 years >= 12%
Total # Block Groups: Risk Level I & I.A - 28 Targeted - 15

Harlan/Bell County

#
#
#
#
#
#
#
Field
Hulen
Pineville
ColmarMeldrum
Middlesborough
Fonde
.-,119
.-,119
.-,25
(/987
(/221
(/66
(/92
.-,25
(/225
(/74
(/186
(/190
.-,58
Bell County Lead Risk AnalysisBlock Groups Level
BELL COUNTY BLOCK GROUPSBELL BLOCK GROUPS - Risk Level IIIBELL BLOCK GROUPS - Risk Level IIMajor Roads
# CITIES & TOWNS
N
EW
S # Pre50 Housing Units: 3,497# Children Living Below Poverty: 1,205% Children Living Below Poverty: 47.5%
# Pre50 Housing Units: 3,497# Children Living Below Poverty: 1,205% Children Living Below Poverty: 47.5%
Testing Rate (PM4) Aged 1-2: 15.5% Aged < 6: 8.4%
Testing Rate (PM4) Aged 1-2: 15.5% Aged < 6: 8.4%
EBLL Prevalence Rate (PM2.4): Aged 1-2: 5.8%
EBLL Prevalence Rate (PM2.4): Aged 1-2: 5.8%
Total Estimated Risk I-III: Aged 1-2: 367 Aged < 6: 897
Total Estimated Risk I-III: Aged 1-2: 367 Aged < 6: 897
South Wallins
Loyall
Harlan
Evarts
Lynch
Benham
Cumberland
Wallins Creek
(/510
(/160
(/987
(/38(/221
.-,119
.-,421 .-,119
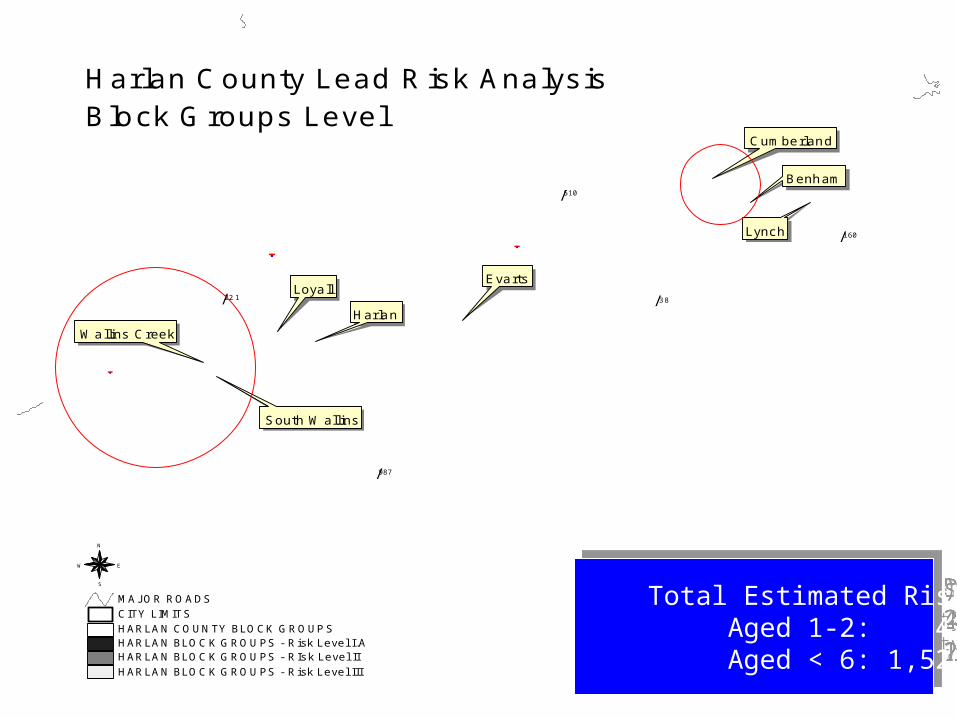
HARLAN BLOCK GROUPS - Risk Level IIIHARLAN BLOCK GROUPS - RIsk Level IIHARLAN BLOCK GROUPS - Risk Level I.AHARLAN COUNTY BLOCK GROUPSCITY LIMITSMAJOR ROADS
N
EW
S
Harlan County Lead Risk AnalysisBlock Groups Level
# Pre50 Housing Units: 5,041# Children Living Below Poverty: 1,591% Children Living Below Poverty: 49.6%
# Pre50 Housing Units: 5,041# Children Living Below Poverty: 1,591% Children Living Below Poverty: 49.6%
Testing Rate (PM4) Aged 1-2: 29.5% Aged < 6: 15.4%
Testing Rate (PM4) Aged 1-2: 29.5% Aged < 6: 15.4%
EBLL Prevalence Rate (PM2.4): Aged 1-2: 5.8% Risk Level I.A: 17.2%
EBLL Prevalence Rate (PM2.4): Aged 1-2: 5.8% Risk Level I.A: 17.2%
Total Estimated Risk I-III: Aged 1-2: 431 Aged < 6: 1,520
Total Estimated Risk I-III: Aged 1-2: 431 Aged < 6: 1,520
Green River Public Health District

#
Owensboro.-,60
.-,60
(/56
(/231
(/1389
(/144
(/54
(/140
(/554
DAVIESS BLOCK GROUPS - Risk Level IIIDAVIESS BLOCK GROUPS - Risk Level IIDAVIESS BLOCK GROUPSDAVIESS COUNTY - Major Roads
# Owensboro
N
EW
S
Daviess County Risk AnalysisBlock Groups LevelGreen River District
# Pre50 Housing Units: 7,566# Children Living Below Poverty: 1,976% Children Living Below Poverty: 25.2%
# Pre50 Housing Units: 7,566# Children Living Below Poverty: 1,976% Children Living Below Poverty: 25.2%
Testing Rate (PM4) Aged 1-2: 3.4% Aged < 6: 1.9%
Testing Rate (PM4) Aged 1-2: 3.4% Aged < 6: 1.9%
EBLL Prevalence Rate (PM2.4): Aged 1-2: 2.3%
EBLL Prevalence Rate (PM2.4): Aged 1-2: 2.3%
Total Estimated Risk I-III: Aged 1-2: 364 Aged < 6: 1,150
Total Estimated Risk I-III: Aged 1-2: 364 Aged < 6: 1,150

#
Henderson
.-,41
.-,60
(/136
(/416
(/283
(/351
(/ 1
.-,41
HENDERSON BLOCK GROUPS - Risk Level IIIHENDERSON BLOCK GROUPS - Risk Level IIHENDERSON BLOCK GROUPSHENDERSON COUNTY - Major Roads
# Henderson
N
EW
S
Henderson County Risk AnalysisBlock Groups LevelGreen River District
# Pre50 Housing Units: 4,767# Children Living Below Poverty: 784% Children Living Below Poverty: 22.5%
# Pre50 Housing Units: 4,767# Children Living Below Poverty: 784% Children Living Below Poverty: 22.5%
Testing Rate (PM4) Aged 1-2: 0.1% Aged < 6: 0.3%
Testing Rate (PM4) Aged 1-2: 0.1% Aged < 6: 0.3%
EBLL Prevalence Rate (PM2.4): Aged 1-2: Insufficient Data
EBLL Prevalence Rate (PM2.4): Aged 1-2: Insufficient Data
Total Estimated Risk I-III: Aged 1-2: 607 Aged < 6: 1,506
Total Estimated Risk I-III: Aged 1-2: 607 Aged < 6: 1,506

Pennyrile Public Health District

.-,60
.-,641
(/365
(/132
(/120
(/135
(/91
(/70
(/902
(/295
(/139
Crittenden County Risk AnalysisBlock Group LevelPennyrile District
CRITTENDEN BLOCK GROUPS - Risk Level IIICRITTENDEN BLOCK GROUPS - Risk Level IICRITTENDEN BLOCK GROUPSMAJOR ROADS
N
EW
S# Pre50 Housing Units: 1,105# Children Living Below Poverty: 208% Children Living Below Poverty: 27.3%
# Pre50 Housing Units: 1,105# Children Living Below Poverty: 208% Children Living Below Poverty: 27.3%
Testing Rate (PM4) Aged 1-2: 24.4% Aged < 6: 14.1%
Testing Rate (PM4) Aged 1-2: 24.4% Aged < 6: 14.1%
EBLL Prevalence Rate (PM2.4): Aged 1-2: 5.0%
EBLL Prevalence Rate (PM2.4): Aged 1-2: 5.0%
Total Estimated Risk I-III: Aged 1-2: 166 Aged < 6: 541
Total Estimated Risk I-III: Aged 1-2: 166 Aged < 6: 541

r ew
.-,62
.-,641
.-,24(/93
(/293
(/93
(/295
(/453
.-,24
(/139
(/295
Lyon County Risk AnalysisBlock Group LevelPennyrile District
LIVINGSTON BLOCK GROUPS - Risk Level IIILYON BLOCK GROUPSMAJOR ROADS
N
EW
S
# Pre50 Housing Units: 345# Children Living Below Poverty: 78% Children Living Below Poverty: 24.7%
# Pre50 Housing Units: 345# Children Living Below Poverty: 78% Children Living Below Poverty: 24.7%
Testing Rate (PM4) Aged 1-2: 24.9% Aged < 6: 17.0%
Testing Rate (PM4) Aged 1-2: 24.9% Aged < 6: 17.0%
EBLL Prevalence Rate (PM2.4): Aged 1-2: 6.3%
EBLL Prevalence Rate (PM2.4): Aged 1-2: 6.3%
33.3% EBLL PrevalenceAged 1-2 Years
Total Estimated Risk I-III*: Aged 1-2: 29 Aged < 6: 57* Levels I-II Insufficient Data
Total Estimated Risk I-III*: Aged 1-2: 29 Aged < 6: 57* Levels I-II Insufficient Data

.-,68
.-,24
(/124
(/126
(/276 (/128
(/126
(/272
(/164
(/139
(/139
(/93
(/453
(/164.-,68
TRIGG COUNTY BLOCK GROUPS - Risk Level IIITRIGG BLOCK GROUPSMAJOR ROADS
N
EW
S
Trigg County Risk AnalysisBlock Group LevelPennyrile District
# Pre50 Housing Units: 657# Children Living Below Poverty: 172% Children Living Below Poverty: 26.4%
# Pre50 Housing Units: 657# Children Living Below Poverty: 172% Children Living Below Poverty: 26.4%
Testing Rate (PM4) Aged 1-2: 13.0% Aged < 6: 9.2%
Testing Rate (PM4) Aged 1-2: 13.0% Aged < 6: 9.2%
EBLL Prevalence Rate (PM2.4): Aged 1-2: 8.8%
EBLL Prevalence Rate (PM2.4): Aged 1-2: 8.8%
12.5% EBLL PrevalenceAged 1-2 Years
25.0% EBLL PrevalenceAged 1-2 Years
14.3% EBLL PrevalenceAged 1-2 Years
Total Estimated Risk I-III*: Aged 1-2: 37 Aged < 6: 167* Levels I-II Insufficient Data
Total Estimated Risk I-III*: Aged 1-2: 37 Aged < 6: 167* Levels I-II Insufficient Data

Housing Issues
“Unfit for human habitation”
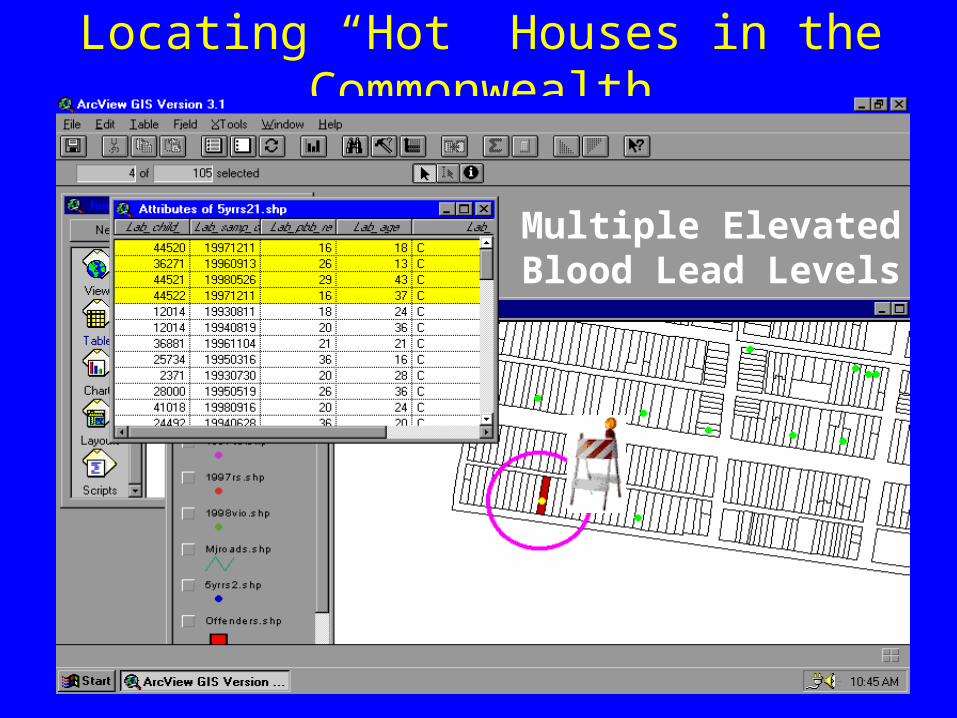
Locating “Hot” Houses in the Commonwealth
Multiple Elevated Blood Lead Levels


In Conclusion: A few facts about what we currently know
• Testing rate statewide aged < 6 years = 6.0%; 10.0% aged 1-2 years (averaged 2000-2002)
• Of those children confirmed, 30.5% are confirmed with BLL 20 ug/dL.
• Of those children who require confirmatory testing, 47.9% receive a confirmatory test.

Take Home Message:Deteriorating lead-based paint in older homes
in poor condition is our greatest concern
Most commonly, children and expectant mothers are exposed through chronic ingestion of lead-contaminated dust from deteriorating lead-based chipping, peeling or flaking paint in older homes in poor condition. Identifying and eliminating deteriorated leaded paint helps to reduce the risk that lead poses to at-risk groups. The Kentucky Lead Based Paint Law – KRS 211.905 – controls the abatement of deteriorated paint.
Lead contaminated dust from deteriorating paint in older homes is our greatest concern

Contact InformationNeal Rosenblatt
(502) 564-2154, ext. [email protected]
Kenny Ratliff(502) 564-4537, ext. 3703
Alvin Campbell(502) 564-4537, ext.3687
Brian Short(270) 785-9105