children living in poverty€¦ · children living in poverty was lower in 2012 than in 1990. from...
TRANSCRIPT

Chapter: 1/Population CharacteristicsSection: Demographics
For more information, see the Reader’s Guide and the Guide to Sources.
Page 1 of 5
Children Living in Poverty
In 2012, approximately 21 percent of school-age children in the United States were in families living in poverty. The percentage of school-age children living in poverty ranged across the United States from 11 percent in North Dakota to 32 percent in Mississippi.
In 2012, approximately 11.1 million school-age children, or children 5 to 17 years old, were in families living in poverty.1 The percentage of school-age children living in poverty in 2012 (21 percent) was higher than it was two decades earlier in 1990 (17 percent), even though
1 In this indicator, data on household income and the number of people living in the household are combined with the poverty threshold, published by the Census Bureau, to determine the poverty status of children. A household includes all families in which children are related to the householder by birth or adoption, or through marriage. The householder is the person (or one of the people) who owns or rents (maintains) the housing unit. In 2012, the poverty threshold for a family of four was $23,283. This poverty threshold is for a family of four with two related children under 18 years old (http://www.census.gov/hhes/www/poverty/data/threshld/thresh12.xls).
the poverty rate for school-age children was lower in 2000 (15 percent) than in 1990. Between the two most recent survey years, 2011 and 2012, the poverty rate for school-age children did not change measurably.
Figure 1. Percentage of 5- to 17-year-olds in families living in poverty, by region: 1990, 2000, and 2012
Region
Percent
20001990 2012
United States Northeast South Midwest West0
10
20
30
40
50
1715
21
14 14
20 1818
23
15
12
19
16 16
21
NOTE: The measure of child poverty includes families in which all children are related to the householder by birth, marriage, or adoption. 1990 data are based on 1989 incomes and family sizes collected in the 1990 census, and 2000 data are based on 1999 incomes and family sizes collected in the 2000 census. Data for both years may differ from Current Population Survey data that are shown in other tables. SOURCE: U.S. Department of Commerce, Census Bureau, 1990 Summary Tape File 3 (STF 3), “Median Household Income in 1989” and “Poverty Status in 1989 by Family Type and Age”; Decennial Census, 1990, Minority Economic Profiles, unpublished data; Decennial Census, 2000, Summary Social, Economic, and Housing Characteristics; Census 2000 Summary File 4 (SF 4), “Poverty Status in 1999 of Related Children Under 18 Years by Family Type and Age”; and American Community Survey (ACS), 2012. See Digest of Education Statistics 2013, table 102.40.
Chapter: 1/Population CharacteristicsSection: Demographics
For more information, see the Reader’s Guide and the Guide to Sources.
Page 2 of 5
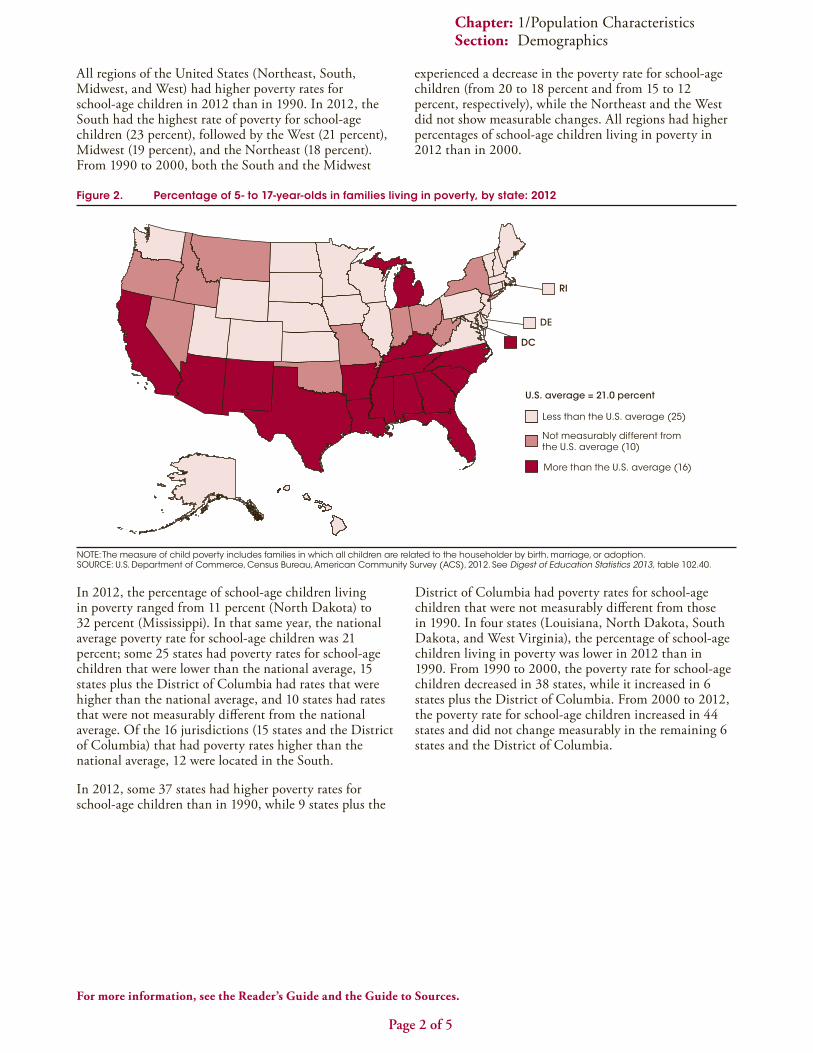
All regions of the United States (Northeast, South, Midwest, and West) had higher poverty rates for school-age children in 2012 than in 1990. In 2012, the South had the highest rate of poverty for school-age children (23 percent), followed by the West (21 percent), Midwest (19 percent), and the Northeast (18 percent). From 1990 to 2000, both the South and the Midwest
experienced a decrease in the poverty rate for school-age children (from 20 to 18 percent and from 15 to 12 percent, respectively), while the Northeast and the West did not show measurable changes. All regions had higher percentages of school-age children living in poverty in 2012 than in 2000.
Figure 2. Percentage of 5- to 17-year-olds in families living in poverty, by state: 2012
District of Columbia had poverty rates for school-age children that were not measurably different from those in 1990. In four states (Louisiana, North Dakota, South Dakota, and West Virginia), the percentage of school-age children living in poverty was lower in 2012 than in 1990. From 1990 to 2000, the poverty rate for school-age children decreased in 38 states, while it increased in 6 states plus the District of Columbia. From 2000 to 2012, the poverty rate for school-age children increased in 44 states and did not change measurably in the remaining 6 states and the District of Columbia.
NOTE: The measure of child poverty includes families in which all children are related to the householder by birth, marriage, or adoption. SOURCE: U.S. Department of Commerce, Census Bureau, American Community Survey (ACS), 2012. See Digest of Education Statistics 2013, table 102.40.
In 2012, the percentage of school-age children living in poverty ranged from 11 percent (North Dakota) to 32 percent (Mississippi). In that same year, the national average poverty rate for school-age children was 21 percent; some 25 states had poverty rates for school-age children that were lower than the national average, 15 states plus the District of Columbia had rates that were higher than the national average, and 10 states had rates that were not measurably different from the national average. Of the 16 jurisdictions (15 states and the District of Columbia) that had poverty rates higher than the national average, 12 were located in the South.
In 2012, some 37 states had higher poverty rates for school-age children than in 1990, while 9 states plus the
DE
RI
DC
RI
DC
Less than the U.S. average (25)
Not measurably different from the U.S. average (10)
More than the U.S. average (16)
U.S. average = 21.0 percent

Chapter: 1/Population CharacteristicsSection: Demographics
For more information, see the Reader’s Guide and the Guide to Sources.
Page 3 of 5
Figure 3. Percentage of children under age 18 living in poverty, by race/ethnicity: 2012
Race/ethnicity
Percent
0
10
20
30
40
50
White Black Hispanic Asian Pacific Islander American Indian/ Alaska Native
Two ormore races
13
39
33
14
25
36
22
NOTE: The measure of child poverty includes families in which all children are related to the householder by birth, marriage, or adoption. Race categories exclude persons of Hispanic ethnicity. SOURCE: U.S. Department of Commerce, Census Bureau, American Community Survey (ACS), 2012. See Digest of Education Statistics 2013, table 102.60.
In 2012, approximately 16.0 million, or 22 percent, of all children under the age of 18 were in families living in poverty; this population includes the 11.1 million 5- to 17-year-olds and 5.0 million children under age 5 living in poverty. The percentage of children under age 18 living in poverty varied across racial/ethnic groups. In 2012, the
percentage was highest for Black children (39 percent), followed by American Indian/Alaska Native children (36 percent), Hispanic children (33 percent), Pacific Islander children (25 percent), and children of two or more races (22 percent). The poverty rate was lowest for White children (13 percent) and Asian children (14 percent).
Chapter: 1/Population CharacteristicsSection: Demographics
For more information, see the Reader’s Guide and the Guide to Sources.
Page 4 of 5
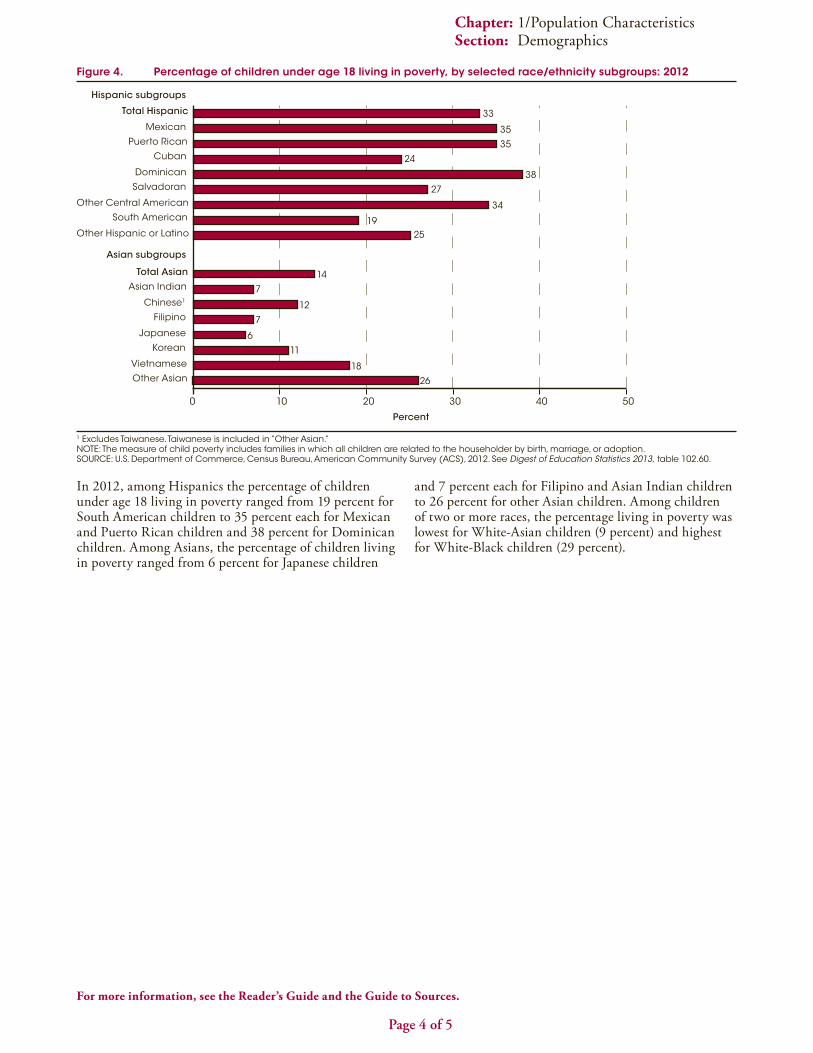
Figure 4. Percentage of children under age 18 living in poverty, by selected race/ethnicity subgroups: 2012
Percent
Hispanic subgroups
Asian subgroups
0 10 20 30 40 50
Other Asian
Vietnamese
Korean
Japanese
Filipino
Chinese1
Asian Indian
Total Asian
Other Hispanic or Latino
South American
Other Central American
Salvadoran
Dominican
Cuban
Puerto Rican
Mexican
Total Hispanic
26
18
11
6
7
12
7
14
2519
34
27
38
24
35
35
33
1 Excludes Taiwanese. Taiwanese is included in “Other Asian.” NOTE: The measure of child poverty includes families in which all children are related to the householder by birth, marriage, or adoption. SOURCE: U.S. Department of Commerce, Census Bureau, American Community Survey (ACS), 2012. See Digest of Education Statistics 2013, table 102.60.
In 2012, among Hispanics the percentage of children under age 18 living in poverty ranged from 19 percent for South American children to 35 percent each for Mexican and Puerto Rican children and 38 percent for Dominican children. Among Asians, the percentage of children living in poverty ranged from 6 percent for Japanese children
and 7 percent each for Filipino and Asian Indian children to 26 percent for other Asian children. Among children of two or more races, the percentage living in poverty was lowest for White-Asian children (9 percent) and highest for White-Black children (29 percent).

Chapter: 1/Population CharacteristicsSection: Demographics
For more information, see the Reader’s Guide and the Guide to Sources.
Page 5 of 5
Figure 5. Percentage of children under age 18 living in poverty, by family structure and race/ethnicity: 2012
Family structure
Percent
AsianHispanicWhiteTotal Black Two ormore races
PacificIslander
American Indian/Alaska Native
Married-couple household Mother-only household Father-only household0
10
20
30
40
50
60
70
80
90
100
117
15
22
10
18 19
9
46
37
53 53
3337
51
42
27
19
3834
24
35
46
30
NOTE: The measure of child poverty includes families in which all children are related to the householder by birth, marriage, or adoption. To determine family structure, children are classified by their parents’ marital status or, if no parents are present in the household, by the marital status of the householder who is related to the children. Race categories exclude persons of Hispanic ethnicity. SOURCE: U.S. Department of Commerce, Census Bureau, American Community Survey (ACS), 2012. See Digest of Education Statistics 2013, table 102.60.
Among children under age 18 living in poverty in 2012, those living in a mother-only household had the highest rate of poverty (46 percent) and those living in a father-only household had the next highest rate (27 percent). Children living in a married-couple household had the lowest rate of poverty, at 11 percent. This pattern was observed across most racial/ethnic groups. For example, among Black children under age 18 living in poverty in 2012, the poverty rates were 53 percent for children living in a mother-only household, 38 percent for those living in a father-only household, and 15 percent for those living in a married-couple household.
For all family types, the poverty rates for Black, Hispanic, and American Indian/Alaska Native children were generally higher than the national poverty rates in 2012. On the other hand, the poverty rates for White and Asian children were generally lower than the national poverty rates. For example, among children living in mother-only households in 2012 the national poverty rate was 46 percent, which was lower than the rates for Black children (53 percent), Hispanic children (53 percent), and American Indian/Alaska Native children (51 percent) but higher than the rates for White children (37 percent) and Asian children (33 percent).
Reference tables: Digest of Education Statistics 2013, tables 102.40 and 102.60
Glossary: Poverty, Racial/ethnic group