children’s health insurance program...pennsylvania’s children’s health insurance program...
TRANSCRIPT

CHILDREN’S HEALTH
INSURANCE PROGRAM
2018 ANNUAL REPORT TO THE GENERAL ASSEMBLY
Tom Wolf Governor
Teresa D. Miller
Secretary
Department of Human Services

2
2018 Children’s Health Insurance Program Annual Report
Table of Contents
History of CHIP in Pennsylvania ························································································ 3
Services ·························································································································· 4
Eligibility ·························································································································· 5
Costs and Contributions ····································································································· 5
Managed Care Organizations ······························································································ 6
Outreach ························································································································· 6
Enrollment ······················································································································· 8
Healthcare Effectiveness Data and Information Set (HEDIS) Measures ······································· 9
Changes to the CHIP State Plan Approved in CY 2018 ··························································· 10
Conclusion ····················································································································· 10
Income Guidelines ··························································································· Attachment 1
New Birth Flyer ································································································ Attachment 2
COMPASS Flyer ······························································································· Attachment 3
CHIP School Flyer ···························································································· Attachment 4
CHIP Enrollment by County ················································································ Attachment 5
HEDIS 2018 Report Card ·················································································· Attachment 6
Administrative Performance Measure Report ························································· Attachment 7

2018 Children’s Health Insurance Program Annual Report
Executive Summary
History of CHIP in Pennsylvania Pennsylvania’s Children’s Health Insurance Program (CHIP) was established through passage of Act 113 of 1992, reenacted as an amendment to The Insurance Company Law of 1921 by Act 68 of 1998, amended by Act 136 of 2006, and amended and reauthorized by Act 74 of 2013 and Act 84 of 2015 (the Act), and as amended by Act 58 of 2017. It has long been acknowledged as a national model, receiving specific recognition in the Federal Balanced Budget Act of 1997 as one of only three child health insurance programs nationwide that met Congressional specifications. In early 2007, after passage of Act 136 of 2006, Pennsylvania received approval from the federal government to expand eligibility for CHIP through the Cover All Kids initiative. As of March 2007:
• Free CHIP: Coverage has been available to eligible children in households with incomes no greater than 208 percent of the Federal Poverty Level (FPL);
• Low Cost CHIP: Coverage is available for those with incomes greater than 208 percent but not greater than 314 percent of the FPL; and
• At Cost CHIP: Families with incomes greater than 314 percent of the FPL have the opportunity to purchase coverage by paying the full rate negotiated by the state.
In February 2009, the federal Children’s Health Insurance Program Reauthorization Act (CHIPRA) reauthorized CHIP at the federal level. Historically, federal funding paid for about two- thirds of the total cost of CHIP; however, under CHIPRA, CHIP’s federal funds allotment was substantially increased. Currently, federal funds pay approximately ninety percent of CHIP’s total cost. CHIPRA contained numerous new federal program requirements, including citizenship and identity verification, a mandate to provide coverage for orthodontic services, a mandate to make supplemental payments in certain circumstances to Federally Qualified Health Centers and Rural Health Clinics, a variety of process requirements when CHIP provides coverage through managed care plans, the obligation to provide information about dental providers to be used on a new federal website, and expanded reporting. The Affordable Care Act (the Patient Protection and Affordable Care Act together with the Health Care and Education Reconciliation Act of 2010) (ACA), signed into law in March 2010, provided additional changes for CHIP. The ACA extended federal funding of CHIP through September of 2015, as well as added a requirement that states maintain the Medical Assistance (MA) and CHIP eligibility standards, methods and procedures in place on the date of passage of the ACA or refund the state’s federal stimulus funds under The American Recovery and Reinvestment Act of 2009 (ARRA). In December 2015, Governor Tom Wolf signed Act 84 reauthorizing CHIP through 2017 and moving the administration of CHIP from the Insurance Department to the Department of Human Services (DHS). As

4
of July 1, 2018, The CHIP Managed Care Organizations (MCO) were required to comply with changes to the federal managed care regulations (42 CFR chapters 457 and 438). CHIP continues to work with the CHIP MCOs to ensure organized and efficient implementation of these regulations. On January 22, 2018, the federal government passed a continuing resolution and adopted the Helping Ensure Access for Little Ones, Toddlers and Hopeful Youth by Keeping Insurance Delivery Stable Act (HEALTHY KIDS Act). CHIP was authorized on a federal level including funding appropriations through September 30, 2023. On February 9, 2018, Congress acted again to extend CHIP for an additional four years, or until September 30, 2027. Services Services covered for calendar year 2018 include those required by Section 2311(l)(6) of the Act or other laws:
• Primary and preventive care, including physician, nurse practitioner, and physician assistant services;
• Specialist care, including physician, nurse practitioner, and physician assistant services;
• Autism services;
• Diagnosis and treatment of illness or injury;
• Laboratory/pathology testing;
• X-rays;
• Injections, immunizations and medications;
• Emergency care, including emergency transportation;
• Prescription drugs;
• Emergency, preventive and routine dental care, and medically necessary orthodontia;
• Emergency, preventive, and routine vision care;
• Emergency, preventive, and routine hearing care; and
• Inpatient hospital care. Ancillary medically necessary and therapeutic services including inpatient and outpatient treatment of mental health, serious mental illness and substance disorder services, rehabilitative therapies, medical therapies, home health care, hospice care, durable medical equipment, and maternity care were also covered.
5
Eligibility
In addition to income guidelines designated in detail in Attachment #1 (Income Guidelines), eligibility for CHIP is determined on the basis of the following factors:
• Age of the child (up to age 19);
• Citizenship status (must be U.S. citizen or lawfully residing in the U.S.);
• Not eligible for Medical Assistance;
• Not currently covered through employer-based or private health care coverage; and
• For families whose incomes fall in the Full Cost CHIP range, comparable insurance must be either unavailable or unaffordable.
Costs and Contributions
CHIP continues to provide identical benefits to individuals enrolled in the Free, Low Cost, and Full Cost components of the program.
Free CHIP covers children in families with an adjusted gross household income no greater than 208 percent of the FPL. Federal financial participation is received toward the cost of this coverage. There are no premiums and no co-payments collected for enrollees in this group.
Low Cost CHIP covers children in families with an adjusted gross household income greater than 208 percent, but no greater than 314 percent of the FPL. Federal financial participation is received toward the expense of this low-cost coverage. The parent or guardian is required to pay a modest monthly premium directly to the MCO. Enrollment in Low Cost CHIP is divided into three increments with progressively increasing premiums:
• Greater than 208 percent but no greater than 262 percent – 25 percent of the per- member-per-month (PMPM) cost. The average cost to the enrollee in 2018 was approximately $55 per month.
• Greater than 262 percent but no greater than 288 percent – 35 percent of PMPM cost. The average cost to the enrollee in 2018 was approximately $77 per month.
• Greater than 288 percent but no greater than 314 percent – 40 percent of PMPM cost. The average cost per child to their families in 2018 was approximately $88 per month.
Children in Low Cost CHIP also are charged point-of-service co-payments for primary care visits ($5), specialists ($10), emergency room care ($25, waived if admitted), and prescriptions ($6 for generic and $9 for brand names). There are no co-payments for well- baby visits, well-child visits, immunizations, or emergency room care that results in an admission. Co-payments are limited to physical health and do not include routine preventive and diagnostic dental services or vision services. Cost sharing, the combination of premiums and point of service co-payments, is capped at five percent of household income.

6
The third component, Full Cost CHIP, is for children in families with adjusted gross household income greater than 314 percent of the FPL, if private insurance is unaffordable or inaccessible. Families may buy into coverage at 100 percent of the cost negotiated by the department with each of the MCOs. The average monthly premium for 2018 was $258. No federal or state dollars are used to provide coverage for families in this component. In addition, children in families with adjusted gross income greater than 314 percent FPL are charged point-of-service co-payments for primary care visits ($15), specialists ($25), emergency room care ($50, waived if admitted), and prescriptions ($10 for generic and $18 for brand names). Managed Care Organizations (MCO) DHS administers CHIP with at least two MCOs offering coverage in every county of the Commonwealth. The following MCOs are now providing managed care coverage for children in CHIP under contracts effective December 1, 2013, through March 1, 2020:
• Aetna;
• Blue Cross of Northeastern Pennsylvania (coverage provided by First Priority Health HMO);
• Capital BlueCross (coverage provided by Keystone Health Plan Central HMO);
• Geisinger Health Plan;
• Health Partners Plans;
• Highmark Inc. (coverage provided by Keystone Health Plan West HMO in the western part of the state and Premier BlueShield PPO in the central part of the state);
• Independence Blue Cross (coverage provided by Keystone Health Plan East HMO);
• United Health Care Community Plan of Pennsylvania and;
• UPMC Health Plan Outreach During 2017-2018, Pennsylvania’s CHIP continued efforts to raise awareness of the CHIP throughout the Commonwealth. Outreach strategies were focused on increasing enrollments, renewals, and reaching parents of uninsured children. The “CHIP Strong” media campaign was developed to reach a wide variety of individuals; the campaign ran from May 2018 through July 2018. The media strategy used a mix of broad reach mediums such as TV, spot radio, and digital displays. This was reinforced with layering multiple digital channels via content and behavioral targeting. Ethnically targeted media was included to reach this population by incorporating partnerships and placements with the Hispanic media to assist with promoting the “CHIP Strong” message. TV spots were aired state wide with the spot length of :30 second in all six Commonwealth designated market areas (DMAs) which included both broadcast and cable. The DMAs were Philadelphia, Pittsburgh, Erie, Johnstown Altoona, Wilkes Barre Scranton,

7
Harrisburg, Lancaster, Lebanon, and York. Spanish television stations, Telemundo and Univision also aired TV spots reaching the Hispanic population. The TV host narrated :90 second vignettes promoting CHIP. Media channels including Terrestrial Radio, TRANSIT, Social Media, and search engine optimization aired:15 second online video. The CHIP digital video campaign served 5.3 million impressions and drove 8,524 clicks for a Click Through Rate (CTR) of 0.16%. Video placements resulted in 3,644,081 100% completions and a Video Completion Rate (VCR) of 68.4%. The top performing VCR placement were parents and mothers with a 77% rate. General Market Radio and Hispanic Market Radio advertising spots had 100-125 Gross Rating Point (GRP) per week with spot lengths of :30 and :60. One hundred and twenty-five buses displayed external signage including three hundred interior signs in the Philadelphia area promoting CHIP awareness. In the Allentown-Bethlehem, Harrisburg, Lancaster, Lebanon, and York areas there were twenty-nine buses with external signages including forty interior signs. The social portion of the campaign ran on Facebook, Instagram, and Twitter. There were 16,627,352 impressions served and 23,468 link clicks with an overall CTR of 0.30%. This resulted in 23,468 link clicks and 25,595 total conversions. Conversion tracking for social media enable CHIP to track the actions users take after viewing or engaging CHIP ads. There were 1,534 new page fans on Facebook and 34 new Twitter followers and 131 conversions as a result of the media campaign. The Facebook/Instagram brand awareness campaign targeted two audiences: women and men between the ages of 25-54. CHIP used Estimated Ad Recall to estimate the number of people who may remember viewing CHIP media. Throughout the length of the campaign, the female audience generated the greater Estimated Ad Recall Lift of 46,800 and had the greater Estimated Ad Recall Lift Rate of 10.69% compared to the male audience. On Twitter, we targeted the same two audiences which yielded similar performance results. In addition, the campaign ran across Google Search, Bing Search, and the Google Display Network. The campaign drove 78,010 clicks from 7,178,464 impressions. During the month of December 2017, CHIP ad panels were placed at the Lehigh Valley mall. Additionally, a display table was manned by CHIP customer service representatives that provided one-on-one information sharing with mall patrons. The CHIP inbound call center continues to provide customer service to Pennsylvanians seeking information on the program by calling 1-800-986-KIDS. The call center also provides application assistance to those needing help applying or renewing. Below are the CHIP Call center statistics for 2018;
• Total Calls Received: 42,475
• Total Calls Answered: 41,280
• Total Calls Abandoned: 1,422
• Abandoned Rate: 3.44%
• Average Wait time for Callers: 1 minute and 3 seconds
• Average Length of Call: 3 minutes and 28 seconds

8
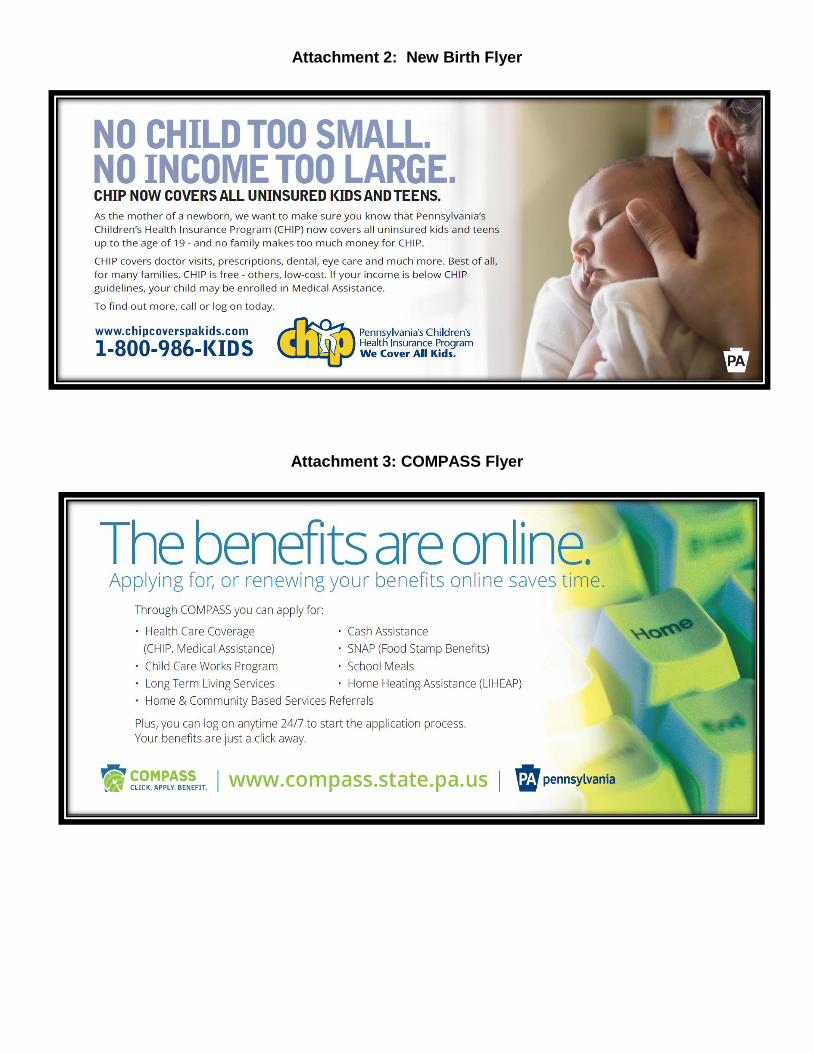
School Notices Pennsylvania Act 84 of 2015 requires that an electronic notice of the Children’s Health Insurance Program be sent to public and nonpublic schools on an annual basis. A flyer was created in English and Spanish, highlighting the benefits of CHIP. These flyers were sent prior to the start of the school year to be given to parent(s) or guardians of children potentially eligible for CHIP. New Birth Flyer/COMPASS The Pennsylvania Department of Health (DOH) has been a great partner in extending our message to new parents. CHIP printed “New Birth” and COMPASS flyers (Attachment #2 and Attachment #3) for insertion with each complimentary birth certificate that was mailed to the households of Pennsylvania newborns. MCO Outreach CHIP MCOs conduct community outreach at the local level in each of their service areas. Each county has two to six CHIP MCOs, providing coverage to underserved populations. Each CHIP MCO conducts marketing and outreach efforts in a different way, thus reaching different segments of Pennsylvania’s diverse population. By conducting different outreach efforts across a range of MCOs, CHIP has been successful in reaching a large portion of Pennsylvania’s uninsured families. Enrollment Projected Number of Eligible Children The average enrollment for the calendar year 2018 was 179,641. The projected average enrollment for CHIP in calendar year 2019 is 185,669. The projected enrollment is anticipated to be consistent with the current enrollment in terms of residence and poverty level. Number of Children Receiving Health Care Services by County and by Per Centum of the Federal Poverty Level Please refer to Attachment 4 (CHIP Enrollment by County) for county-specific data for the number of children enrolled in the program in December 2018. The total enrollment numbers for the several levels of the FPL for the period January through December 2018 were:
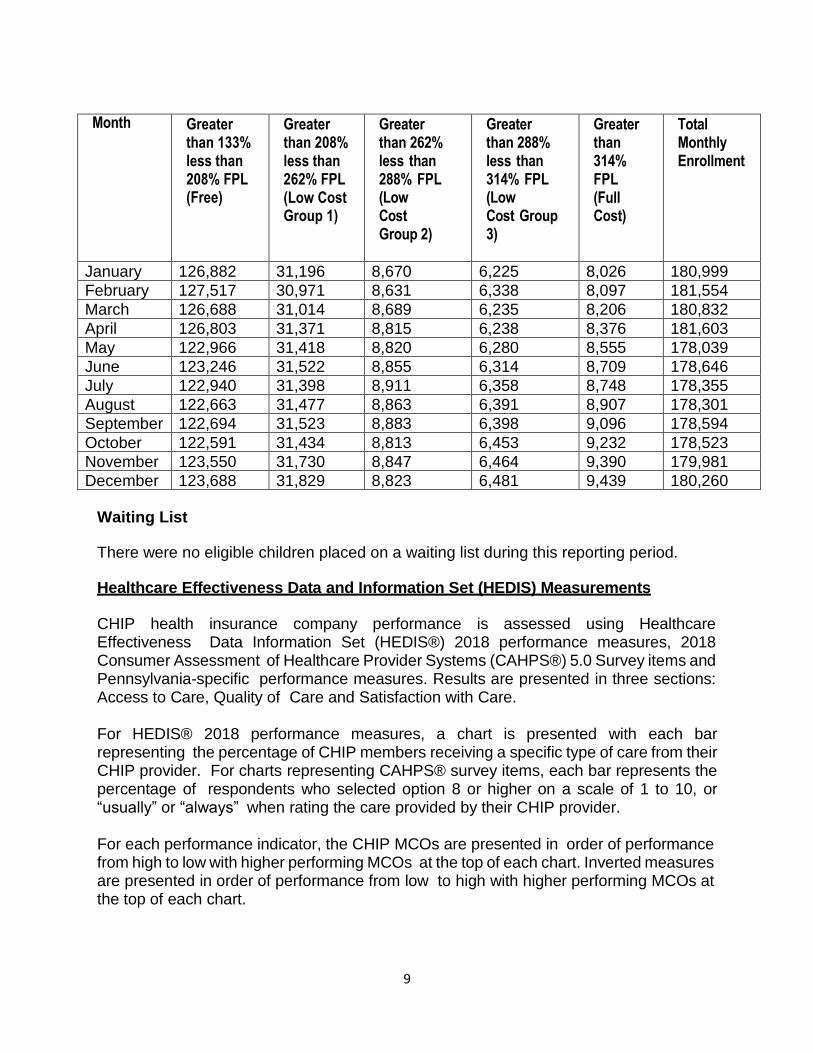
9
Month
Greater than 133% less than 208% FPL (Free)
Greater than 208% less than 262% FPL (Low Cost Group 1)
Greater than 262% less than 288% FPL (Low Cost Group 2)
Greater than 288% less than 314% FPL (Low Cost Group 3)
Greater than 314% FPL (Full Cost)
Total Monthly Enrollment
January 126,882 31,196 8,670 6,225 8,026 180,999
February 127,517 30,971 8,631 6,338 8,097 181,554
March 126,688 31,014 8,689 6,235 8,206 180,832
April 126,803 31,371 8,815 6,238 8,376 181,603
May 122,966 31,418 8,820 6,280 8,555 178,039
June 123,246 31,522 8,855 6,314 8,709 178,646
July 122,940 31,398 8,911 6,358 8,748 178,355
August 122,663 31,477 8,863 6,391 8,907 178,301
September 122,694 31,523 8,883 6,398 9,096 178,594
October 122,591 31,434 8,813 6,453 9,232 178,523
November 123,550 31,730 8,847 6,464 9,390 179,981
December 123,688 31,829 8,823 6,481 9,439 180,260
Waiting List There were no eligible children placed on a waiting list during this reporting period. Healthcare Effectiveness Data and Information Set (HEDIS) Measurements CHIP health insurance company performance is assessed using Healthcare Effectiveness Data Information Set (HEDIS®) 2018 performance measures, 2018 Consumer Assessment of Healthcare Provider Systems (CAHPS®) 5.0 Survey items and Pennsylvania-specific performance measures. Results are presented in three sections: Access to Care, Quality of Care and Satisfaction with Care. For HEDIS® 2018 performance measures, a chart is presented with each bar representing the percentage of CHIP members receiving a specific type of care from their CHIP provider. For charts representing CAHPS® survey items, each bar represents the percentage of respondents who selected option 8 or higher on a scale of 1 to 10, or “usually” or “always” when rating the care provided by their CHIP provider. For each performance indicator, the CHIP MCOs are presented in order of performance from high to low with higher performing MCOs at the top of each chart. Inverted measures are presented in order of performance from low to high with higher performing MCOs at the top of each chart.
10
In addition, the PA CHIP statewide weighted average is represented on each chart by a solid black line. The PA CHIP weighted averaged is calculated as the total number of events program-wide divided by the eligible population. Attachment 5 (The detailed HEDIS 2018® report card.) Changes to the CHIP State Plan Approved in CY 2018 During calendar year 2018, CHIP submitted a Mental Health Parity State Plan Amendment. CMS has issued the Final Rule applying the Mental Health Parity and Addiction Equity Act (MHPAEA) to CHIP. This act has aligned mental health and substance use disorder insurance coverage with medical/surgical insurance; ensuring that mental health and substance use disorder are treated equally for a more holistic approach to healthcare. Currently, CHIP’s Mental Health Parity State Plan Amendment is under CMS review. Conclusion Through creative outreach, increased administrative efficiencies, and refinements to the program, CHIP continues to serve over 180,000 Pennsylvania children and strives to increase enrollment of the uninsured population.

Attachment 1: CHIP Full Income Chart
How to use this chart:
Step 1: Locate the number of people in your household.
Step 2: Find the box that matches your household’s annual gross income and age of your children.
Step 3: Look down the row to the COST BOX to see your appropriate, average monthly cost per child and the co-payments per child, per visit.
Example: A four-person household with an annual income of $69,840 will have an average monthly premium of $77 per child, plus any co-pays for services.
INCOME* (Effective March 1, 2018)
household size
1 2 3 4 5 6 7 8
9 10
Free ages 1-5 ages 6-18
Low Cost ages 0-1 ages 1-18 ages 0-18 ages 0-18
Full Cost ages 0-18
$19,060-$25,252 $25,843-$34,237 $32,625-$43,223 $39,407-$52,208 $46,190-$61,194 $52,972-$70,180 $59,755-$79,165 $66,537-$88,151 $73,319-$97,136 $80,102-$106,122
$16,147-$25,252 $21,892-$34,237 $27,638-$43,223 $33,383-$52,208 $39,129-$61,194 $44,875-$70,180 $50,620-$79,165 $56,366-$88,151 $62,111-$97,136 $67,857-$106,122
$26,101-$31,807 $35,389-$43,126 $44,677-$54,444 $53,965-$65,762 $63,253-$77,081 $72,541-$88,399 $81,829-$99,718 $91,117-$111,036 $100,405-$122,354 $109,693-$133,673
$25,252-$31,807 $34,237-$43,126 $43,223-$54,444 $52,208-$65,762 $61,194-$77,081 $70,180-$88,399 $79,165-$99,718 $88,151-$111,036 $97,136-$122,354 $106,122-$133,673
$31,807-$34,964 $43,126-$47,405 $54,444-$59,847 $65,762-$72,288 $77,081-$84,730 $88,399-$97,172 $99,718-$109,613 $111,036-$122,055 $122,354-$134,496 $133,673-$146,938
$34,964-$38,120 $47,405-$51,685 $59,847-$65,250 $72,288-$78,814 $84,730-$92,379 $97,172-$105,944 $109,613-$119,509 $122,055-$133,074 $134,496-$146,638 $146,938-$160,203
$38,120-No Limit $51,685-No Limit $65,250-No Limit $78,814-No Limit $92,379-No Limit $105,944-No Limit $119,509-No Limit $133,074-No Limit $146,638-No Limit $160,203-No Limit
COST
average monthly premium per child
$0 $0 $55 $55 $77 $88 $258
co-payments per
child per visit
doctor visit $0 $0 $5 $5 $5 $5 $15
brand name prescription
$0 $0 $9 $9 $9 $9 $18
generic prescription $0 $0 $6 $6 $6 $6 $10
specialist visit emergency room
visits**
$0 $0 $10 $10 $10 $10 $25
$0 $0 $25 $25 $25 $25 $50
Attachment 2: New Birth Flyer
Attachment 3: COMPASS Flyer

Attachment 4: CHIP School Flyer (English)

Attachment 4: CHIP School Flyer (Spanish)

Attachment 5: CHIP Enrollment by County
CHIP Enrollment by Sub-Program and County
December - 2018 County Free Sub 1 Sub 2 Sub 3 At Cost Total
Adams 1,317 324 105 96 127 1,969
Allegheny 8,530 2,653 719 508 1,190 13,600
Armstrong 661 201 62 44 50 1,018
Beaver 1,460 413 123 75 126 2,197
Bedford 677 140 48 51 64 980
Berks 5,114 1,329 371 294 364 7,472
Blair 1,328 370 98 57 80 1,933
Bradford 595 117 39 20 24 795
Bucks 5,213 1,853 529 385 597 8,577
Butler 1,315 381 121 82 180 2,079
Cambria 1,171 341 80 64 77 1,733
Cameron 37 5 3 1 1 47
Carbon 649 136 39 25 36 885
Centre 795 195 49 35 44 1,118
Chester 3,713 1,179 305 233 446 5,876
Clarion 391 119 33 17 26 586
Clearfield 685 206 74 32 38 1,035
Clinton 313 102 15 10 12 452
Columbia 539 144 29 19 12 743
Crawford 756 196 51 21 54 1,078
Cumberland 2,128 613 155 136 174 3,206
Dauphin 2,737 685 187 179 209 3,997
Delaware 5,741 1,474 384 327 452 8,378
Elk 236 68 19 20 25 368
Erie 2,325 584 168 83 188 3,348
Fayette 1,338 330 90 90 116 1,964
Forest 23 11 4 0 3 41
Franklin 2,258 555 143 128 135 3,219
Fulton 190 37 16 9 20 272
Greene 293 67 14 11 28 413
Huntingdon 477 113 28 25 25 668
Indiana 614 165 49 41 64 933
Jefferson 499 142 42 27 28 738
Juniata 238 85 27 9 8 367
Lackawanna 1,876 400 108 72 96 2,552
Lancaster 6,665 2,039 599 418 544 10,265
Lawrence 778 186 56 53 53 1,126
Lebanon 1,782 478 118 88 94 2,560
Lehigh 5,116 1,010 279 191 288 6,884
Luzerne 3,398 606 170 99 94 4,367
Lycoming 1,085 246 54 44 36 1,465
Mckean 292 64 18 8 12 394

Mercer 857 199 70 28 49 1,203
Mifflin 478 113 20 28 25 664
Monroe 1,836 389 112 82 117 2,536
Montgomery 6,197 1,897 602 422 770 9,888
Montour 114 37 7 4 3 165
Northampton 3,100 729 193 157 211 4,390
Northumberland 949 185 43 29 20 1,226
Perry 518 122 40 21 26 727
Philadelphia 18,604 3,608 893 641 722 24,468
Pike 572 143 37 32 47 831
Potter 122 23 10 9 15 179
Schuylkill 1,383 359 100 86 57 1,985
Snyder 503 100 33 8 13 657
Somerset 698 206 52 61 67 1,084
Sullivan 39 12 3 6 0 60
Susquehanna 431 104 28 20 35 618
Tioga 382 89 21 17 11 520
Union 418 102 25 19 12 576
Venango 535 105 39 19 23 721
Warren 277 60 17 20 23 397
Washington 1,617 464 153 121 221 2,576
Wayne 473 118 22 20 25 658
Westmoreland 2,937 985 302 192 334 4,750
Wyoming 272 60 23 14 11 380
York 5,028 1,258 357 298 362 7,303
Total 123,688 31,829 8,823 6,481 9,439 180,260

Attachment 6: CHIP HEDIS Report Card 2018
Commonwealth of Pennsylvania
Department of Human Services
Children’s Health Insurance Program Report Card FINAL REPORT
December 2018
HEDIS is a registered trademark of the National Committee for Quality Assurance (NCQA).

Background
Title XXI of the Balanced Budget Act of 1997 created the State Children's Health Insurance Program (SCHIP), to address
the growing problem of children without health insurance. SCHIP was designed as a federal/state partnership, similar to
Medicaid, with the goal of expanding health insurance to children whose families earn too much money to be eligible for
Medicaid, but not enough to purchase private insurance. The current Pennsylvania Children’s Health Insurance Program
(PA CHIP) was established in 1998 following the repeal of the existing Children’s Health Care Act and enacting of Act
1998-68 by the State Senate.
PA CHIP is administered through the Pennsylvania Department of Human Services (DHS), with the CHIP program
supported by both state and federal funds. The program provides payment for health care coverage for eligible children
who meet income and other criteria. Approximately 178,000 children and teens were enrolled in PA CHIP as of October
2018.
The Cover All Kids initiative, enacted by the legislature in October 2006, led to the expansion of the CHIP program to
include all uninsured children and teens in the Commonwealth who are not eligible for Medical Assistance. On February
4, 2009, President Obama signed into law the Children’s Health Insurance Act of 2009 (CHIPRA) (Pub. L. 111-3). CHIP is
provided by the following private MCOs that are licensed and regulated by the Department of Health Services and have
contracts with the Commonwealth to offer CHIP coverage.
• Aetna, Inc.
• First Priority Health (NEPA)
• Capital Blue Cross
• Geisinger Health Plan
• Health Partners of Philadelphia
• Highmark Blue Cross Blue Shield
• Highmark Blue Shield
• Independence Blue Cross (IBC)
• UnitedHealthcare of Pennsylvania
• UPMC for Kids

Report Card Description
CHIP health insurance company performance is assessed using
Healthcare Effectiveness Data Information Set (HEDIS®) 2018
performance measures, 2018 Consumer Assessment of Healthcare
Provider Systems (CAHPS®) 5.0 Survey items and Pennsylvania-
specific performance measures. Results are presented in three
sections: Access to Care, Quality of Care and Satisfaction with Care.
For HEDIS 2018 performance measures, a chart is presented with
each bar representing the percentage of CHIP members receiving a
specific type of care from their CHIP provider. For charts representing
CAHPS survey items, each bar represents the percentage of
respondents who selected option 8 or higher on a scale of 1 to 10, or
“usually” or “always” when rating the care provided by their CHIP
provider.
For each performance indicator, the CHIP health insurance
companies are presented in order of performance from high to low
with higher performing health insurance companies at the top of
each chart. Inverted measures are presented in order of
performance from low to high with higher performing health
insurance companies at the top of each chart.
In addition, the PA CHIP statewide weighted average is represented
on each chart by a solid vertical line. The PA CHIP weighted averaged
is calculated as the total number of events program-wide divided by
the eligible population program-wide.

0% 20% 40% 60% 80% 100%
Highmark HMO
UPMC
Highmark PPO
ABH
UHC
NEPA
IBC
CBC
GEI
HPHP
0% 20% 40% 60% 80% 100%
Highmark PPO
UPMC
CBC
HPHP
NEPA
ABH
IBC
GEI
UHC
Highmark HMO
0% 20% 40% 60% 80% 100%
Highmark HMO
UPMC
Highmark PPO
CBC
HPHP
UHC
GEI
ABH
NEPA
IBC
0% 20% 40% 60% 80% 100%
Highmark HMO
Highmark PPO
CBC
NEPA
IBC
HPHP
GEI
UHC
ABH
UPMC
Satisfaction with Your Child’s
Health Care Parent/Guardian rated their
child’s health care 8 or higher on
a scale of 0 through 10
CHIP weighted average = 87.45%
Courteous Treatment by
Customer Service Parent/Guardian “usually” or “always”
received courteous treatment from
customer service
CHIP weighted average = 94.62%
Satisfaction with Your Child’s
Health Plan Parent/Guardian rated their child’s
health plan 8 or higher on a scale of 0
through 10
CHIP weighted average = 86.49%
Satisfaction with Care: Is the care meeting your needs?
0% 20% 40% 60% 80% 100%
Highmark PPO
Highmark HMO
UPMC
NEPA
UHC
GEI
ABH
IBC
HPHP
CBC
Satisfaction with Your Child’s
Personal Doctor Parent/Guardian rated their
child’s personal doctor 8 or higher
on a scale of 0 through 10
CHIP weighted average = 89.78%
Satisfaction with Your Child’s
Specialist Parent/Guardian rated their child’s
specialist 8 or higher on a scale of 0
through 10
CHIP weighted average = 86.52%
0% 20% 40% 60% 80% 100%
Highmark HMO
UPMC
GEI
Highmark PPO
CBC
ABH
UHC
IBC
HPHP
NEPA
Child is Able to Get Urgent Care
as soon as is Necessary Parent/Guardian “usually” or
“always” able to get urgent care for
the child when needed
CHIP weighted average = 93.97%

Access to Care: Are children receiving care?
0% 20% 40% 60% 80% 100%
Highmark PPO
CBC
GEI
IBC
UPMC
HPHP
Highmark HMO
ABH
NEPA
UHC
0% 20% 40% 60% 80% 100%
Highmark HMO
CBC
NEPA
UHC
UPMC
GEI
IBC
ABH
HPHP
Highmark PPO
0% 20% 40% 60% 80% 100%
UPMC
Highmark HMO
GEI
ABH
Highmark PPO
CBC
UHC
HPHP
NEPA
IBC
0% 20% 40% 60% 80% 100%
NEPA
GEI
Highmark PPO
CBC
ABH
UPMC
IBC
UHC
HPHP
Highmark HMO
0% 20% 40% 60% 80% 100%
HPHP
UHC
ABH
UPMC
IBC
Highmark HMO
NEPA
H PPO
CBC
GEI
Regular Checkups for Children in
the First 15 Months Percentage of children who had 6 or
more well-child visits with a PCP
before turning 15 months old
CHIP weighted average = 80.02%
Childhood Immunization Status
Combination 3 Percentage of children who received a
combination of 7 recommended
vaccines prior to their 2nd birthday
CHIP weighted average = 79.49%
Testing for Children with
Pharyngitis (Sore Throat) Percentage of children 2 – 18 years old
with a sore throat who were prescribed
antibiotic & tested for streptococcus.
CHIP weighted average = 86.70%
Medication Management for
People with Asthma Percentage of members 5-19 years old
who were identified as having persistent
asthma and were dispensed medication
CHIP weighted average = 59.35%
Lead Screening for Children Percentage of children who were
tested for elevated blood lead levels
prior to their 2nd birthday
CHIP weighted average = 61.91%

Quality of Care I: How good is the care being provided?
0% 20% 40% 60% 80% 100%
IBC
HPHP
CBC
Highmark HMO
ABH
UPMC
Highmark PPO
NEPA
GEI
UHC
0% 20% 40% 60% 80% 100%
UPMC
IBC
ABH
UHC
CBC
Highmark PPO
Highmark HMO
GEI
NEPA
HPHP
0% 20% 40% 60% 80% 100%
UPMC
Highmark HMO
UHC
GEI
Highmark PPO
IBC
ABH
CBC
HPHP
NEPA
0% 20% 40% 60% 80% 100%
NEPA
Highmark HMO
IBC
UHC
GEI
HPHP
H PPO
CBC
ABH
UPMC
0% 20% 40% 60% 80% 100%
HPHP
IBC
GEI
UHC
Highmark PPO
CBC
UPMC
Highmark HMO
NEPA
ABH
0.00 10.00 20.00 30.00
UPMC
UHC
HPHP
Highmark HMO
ABH
NEPA
IBC
CBC
Highmark PPO
GEI
Regular Checkups for Adolescents Percentage of adolescents 12-19 years old
who had at least one well-care visit with a
PCP or OB/GYN
CHIP weighted average = 70.44%
Regular Checkups for Children
3 – 6 Years Old Percentage of children 3 – 6 years old who
had one or more well-child visits with a PCP
CHIP weighted average = 86.54%
Attention Deficit Hyperactivity
Disorder Follow Up Care:
Initiation Phase Percentage of children 6-12 years old with one
follow up visit within 30 days of being
prescribed medication for ADHD
CHIP weighted average = 50.15%
Attention Deficit Hyperactivity
Disorder Follow Up Care:
Continuation & Maintenance Percentage of children 6-12 years old on
ADHD medication who had one follow up
visit during initiation and 2 additional follow
ups
CHIP weighted average = 62.64%
Appropriate Treatment for Upper
Respiratory Infection Percentage of children and adolescents 3
months – 18 years old with the common
cold who were not prescribed antibiotics
CHIP weighted average = 89.71%
Emergency Department Visits for
Children <1 – 19 Years Old Number of ED visits per 1000-member
months by members <1 – 19 years old (a
lower rate indicates better performance)
CHIP weighted average = 28.50%

Quality of Care II: How good is the care being provided?
0% 20% 40% 60% 80% 100%
IBC
Highmark PPO
UPMC
Highmark HMO
NEPA
GEI
HPHP
ABH
UHC
CBC
0% 20% 40% 60% 80% 100%
IBC
Highmark PPO
Highmark HMO
UHC
GEI
UPMC
HPHP
CBC
ABH
NEPA
0% 20% 40% 60% 80% 100%
IBC
Highmark PPO
NEPA
UPMC
GEI
UHC
HPHP
CBC
ABH
Highmark HMO
0% 10% 20%
UPMC
UHC
ABH
IBC
HMO
CBC
PPO
GEI
NEPA
HPHP
0% 20% 40% 60% 80% 100%
UPMC
UHC
IBC
NEPA
Highmark HMO
GEI
ABH
CBC
HPHP
Highmark PPO
0% 20% 40% 60% 80% 100%
Highmark PPO
CBC
GEI
IBC
HPHP
NEPA
UHC
UPMC
ABH
Highmark HMO
Immunizations for Adolescents:
Tdap/Td Percentage of members who received one
Tdap or Td vaccine between their 10th and
13th birthdays
CHIP weighted average = 93.02%
Immunizations for Adolescents:
Meningococcal Percentage of members who received one
meningococcal vaccine between their 10th
and 13th birthdays
CHIP weighted average = 90.78%
Immunizations for Adolescents:
Combination 1 Percentage of members who received one
meningococcal vaccine and one Tdap or Td
vaccine on or between their 10th and 13th
birthdays
CHIP weighted average = 89.52%
Emergency Department Visits for
Asthma Percentage of children with asthma who
had one or more asthma-related ED visits
(a lower rate indicates better performance)
CHIP weighted average = 7.10%
Children’s Access to Practitioners:
12 months to 6 years Percentage of children 12 months to 6
years old who had a visit with a PCP during
2017
CHIP weighted average = 94.54%
Children’s Access to Practitioners:
7 to 19 years Percentage of children 7 to 19 years old
who had a visit with a PCP during 2017
CHIP weighted average = 96.76%

Quality of Care III: How good is the care being provided?
0% 20% 40% 60% 80% 100%
IBC
Highmark HMO
NEPA
CBC
ABH
HPHP
UPMC
UHC
GEI
Highmark PPO
0% 20% 40%
GEI
UPMC
ABH
NEPA
IBC
HPHP
UHC
HMO
PPO
CBC
0% 20% 40%
GEI
UPMC
ABH
NEPA
IBC
HPHP
UHC
H HMO
H PPO
CBC
0% 20% 40% 60% 80% 100%
CBC
ABH
Highmark HMO
IBC
NEPA
UPMC
UHC
Highmark PPO
HPHP
GEI
0% 20% 40% 60% 80% 100%
UPMC
Highmark PPO
CBC
GEI
IBC
NEPA
ABH
UHC
HPHP
Highmark HMO
0% 20% 40%
Highmark HMO
Highmark PPO
ABH
GEI
UHC
HPHP
IBC
UPMC
CBC
NEPA
Annual Dental Visits
Percentage of children and adolescents 2 –
19 years old who had a dental visit in the
past year
CHIP weighted average = 72.33%
Dental Sealants:
MCO Rates Percentage of children 6-9 years old at elevated
risk of dental caries who had a sealant on a
permanent first molar during 2016. Rate is
calculated using MCO data.
CHIP weighted average = 25.21%
Dental Sealants:
Enhanced Rates Percentage of children 6-9 years old at elevated
risk of dental caries who had a sealant on a
permanent first molar during 2016. Rate is
calculated using statewide data.
CHIP weighted average = 25.17%
Child’s Overall Mental or
Emotional Health Parent/Guardian rated their child’s overall
mental or emotional health as “very good”
or “excellent”
CHIP weighted average = 83.79%
Child’s Overall Health Parent/Guardian rated their child’s overall
health as “very good” or “excellent”
CHIP weighted average = 85.79%
Contraceptive Care for All Women Percentage of females ages 15-20 at risk of
unintended pregnancy and provided
most/moderately effective contraception
CHIP weighted average = 17.90%

Quality of Care IV: How good is the care being provided?
0% 20% 40% 60% 80% 100%
NEPA
UPMC
HPHP
Highmark PPO
IBC
UHC
Highmark HMO
GEI
ABH
CBC
0% 20% 40% 60% 80% 100%
Highmark PPO
UPMC
UHC
GEI
HPHP
Highmark HMO
NEPA
IBC
ABH
CBC
0% 20% 40% 60% 80% 100%
IBC
UHC
ABH
GEI
NEPA
UPMC
CBC
H PPO
H HMO
HPHP
0% 20% 40% 60% 80% 100%
UHC
GEI
Highmark HMO
CBC
UPMC
ABH
HPHP
IBC
NEPA
Highmark PPO
0% 20% 40% 60% 80% 100%
UHC
Highmark HMO
UPMC
ABH
Highmakr PPO
IBC
CBC
GEI
NEPA
HPHP
0% 20% 40% 60% 80% 100%
UHC
HPHP
UPMC
IBC
ABH
Highmark PPO
GEI
CBC
NEPA
Highmark HMO
Follow Up After Hospitalization
for Mental Illness: 7 Days Percentage of children 6 or older who
were hospitalized for a mental illness, who
had a follow-up within 7 days of discharge
CHIP weighted average = 53.63%
Follow Up After Hospitalization for
Mental Illness: 30 Days Percentage of children 6 or older who were
hospitalized for a mental illness, who had a
follow-up in 30 days of discharge
CHIP weighted average = 77.34%
Chlamydia Screening in Women
Percentage of women 16 – 19 who were
identified as sexually active and who had
at least one test for chlamydia in 2016
CHIP weighted average = 38.59%
Weight Assessment & Counseling for
Nutrition & Physical Activity: BMI Percentage of children 3-17 who had a
BMI percentile documented at an
outpatient visit with a PCP or OB/GYN
CHIP weighted average = 79.96%
Weight Assessment & Counseling for
Nutrition & Physical Activity:
Nutrition Percentage of children 3-17 who were
counseled for nutrition at an outpatient visit
with a PCP or OB/GYN
CHIP weighted average = 76.90%
Weight Assessment & Counseling for
Nutrition & Physical Activity:
Physical Activity Percentage of children 3-17 who were
counseled for physical activity at an outpatient
visit with a PCP or OB/GYN
CHIP weighted average = 72.29%

CHIP Provider Contact Information
AETNA
WWW.AETNABETTERHEALTH.COM/PENNSYLVANIA
1-800-822-2447
TDD/TTY 1-800-628-3323
CAPITAL BLUE CROSS
WWW.CAPBLUECROSS.COM/CHIP
1-800-543-7101
TTY/TDD: 711
FIRST PRIORITY HEALTH (BCNEPA)
WWW.DISCOVERHIGMARK.COM/NORTHEASTPA
800-547-9378
TTY/TDD: 711
GEISINGER HEALTH PLAN
WWW.CHIP.THEHEALTHPLAN.COM
1-866-621-5235
Hearing-Impaired: 711
HEALTH PARTNERS (KIDZPARTNERS)
WWW.HEALTHPARTNERSPLANS.COM
1-888-888-1211
TTY: 711
HIGHMARK BLUE SHIELD (CENTRAL PA)
WWW.DISCOVERHIGHMARK.COM/CENTRAL
PA
800-543-7105
TTY/TDD: 711
KEYSTONE HEALTH PLAN WEST (HIGHMARK)
WWW.DISCOVERHIGHMARK.COM/WESTER
NPA
800-543-7105
TTY/TDD: 711
INDEPENDENCE BLUE CROSS
WWW.IBX.COM/INDIVIDUALS/FIND_PLAN/C
HIP/INDEX.HTML
1-800-464-5437
TTY/TDD: 711
UNITEDHEALTHCARE COMMUNITY PLAN
WWW.UHCCOMMUNITYPLAN.COM
1-800-414-9025
Hearing-Impaired: 711
UPMC HEALTH PLAN
WWW.UPMCHEALTHPLAN.COM/UPMCFOR
KIDS
1-800-978-8762
TDD/TTY 1-800-361-2629

Attachment 7: CHIP Administrative Performance Measure Report
Commonwealth of Pennsylvania Department of Human Services
Children’s Health Insurance Program Administrative Performance Measure Report
January 2019

Administrative Performance Measures
In the 2018 reporting year, Pennsylvania Children’s Health Insurance Program (CHIP) Managed Care Organizations
(MCO) reported the following Pennsylvania (PA) specific Performance Measures covering services delivered
prior to and including calendar year (CY) 2017:
• Annual Number of Asthma Patients with One or More Asthma Related ER Visits • Dental Sealants for 6-9-Year-Old Children at Elevated Caries Risk Developmental
Screening in the First Three Years of Life • Total Eligible Who Received Preventive Dental Services
PA CHIP Health Plans Included This report presents data collected from 10 health plans (MCOs) that provide health care benefits for PA
CHIP enrollees:
• Aetna Health, Inc.
• Capital Blue Cross (CBC): Capital Blue Cross through Keystone Health Plan Central
• First Priority Health (NEPA): Highmark Inc. through First Priority Health
• Geisinger Health Plan (GHP)
• Highmark HMO: Highmark Inc. through Highmark Blue Cross Blue Shield
• Highmark PPO: Highmark Inc. through Highmark Blue Shield
• Independence Blue Cross (IBC)
• Health Partners (HPHP): Health Partners of Philadelphia, Inc
• UnitedHealthcare Community Plan (UHC)
• UPMC for Kids (UPMC): UPMC Health Plan
Methodology
Data included in this report are drawn from PA specific performance measure data consisting of claims/encounter data collected using administrative data collection methodology. For each performance measure, a measure description is provided along with narrative analyses, comparison tables and charts.
For each measure, the PA CHIP program average and weighted average is presented along with the PA MMC weighted average. The weighted average is calculated by dividing the sum of the total numerators by the sum of the total denominators. The average is calculated by dividing the sum of MCO rates by the number of MCOs. Rates are not presented in instances where less than 30 members received a service, due to the variability associated with small denominators, which prevents direct comparisons.

PA Specific Administrative Measures
Developmental Screening in the First Three Years of Life– CHIPRA Core Set This performance measure assesses the percentage of children screened for risk of developmental, behavioral, and social delays using a standardized screening tool in the 12 months preceding their first, second, or third birthday. Four rates, one for each group and a combined rate, are to be calculated and reported for each numerator. Figure 1: Developmental Screening 1 year old
❖ Note: N/A is reported for MCOs where denominators are low.
37
.50
%
30
.91
%
68
.94
%
NA
NA
40
.00
% 54
.17
%
NA
50
.00
%
56
.44
%
50
.15
%
NA
21
.82
%
69
.34
%
NA
NA
NA
61
.48
%
NA
61
.15
%
54
.29
%
59
.10
%
0.00%
10.00%
20.00%
30.00%
40.00%
50.00%
60.00%
70.00%
80.00%
90.00%
100.00%
Developmental Screening in the First Three Years of Life – 1 year
2018 Rate 2017 Rate

Figure 2: Developmental Screening 2-year-old
56
.74
%
40
.78
%
40
.21
%
64
.56
%
49
.60
%
58
.45
% 71
.51
%
47
.95
%
56
.66
%
65
.01
%
56
.36
%
71
.70
%
41
.32
%
45
.97
%
52
.38
%
33
.90
% 46
.75
% 57
.04
%
NA
59
.35
%
55
.49
%
55
.05
%
0.00%
10.00%
20.00%
30.00%
40.00%
50.00%
60.00%
70.00%
80.00%
90.00%
100.00%
Developmental Screening in the First Three Years of Life – 2 years
2018 Rate 2017 Rate

Figure 3: Developmental Screening 3-year-old
64
.64
%
33
.71
%
37
.08
%
60
.00
%
34
.01
% 46
.03
%
67
.18
%
26
.09
%
52
.00
%
59
.72
%
51
.41
%
60
.48
%
32
.00
% 44
.04
%
41
.44
%
34
.86
%
54
.31
%
37
.32
%
26
.67
%
53
.41
%
42
.10
%
43
.75
%
0.00%
10.00%
20.00%
30.00%
40.00%
50.00%
60.00%
70.00%
80.00%
90.00%
100.00%
Developmental Screening in the First Three Years of Life – 3 years
2018 Rate 2017 Rate

Figure 4: Developmental Screening – Total Rate
59
.61
%
35
.84
%
43
.94
% 58
.88
%
38
.55
% 49
.50
%
67
.40
%
34
.68
%
53
.72
%
61
.22
%
53
.11
%64
.50
%
34
.00
%
50
.00
%
44
.44
%
33
.75
%
51
.60
%
50
.35
%
29
.21
%
56
.47
%
46
.18
%
49
.62
%
0.00%
10.00%
20.00%
30.00%
40.00%
50.00%
60.00%
70.00%
80.00%
90.00%
100.00%
Developmental Screening in the First Three Years of Life – Total
2018 Rate 2017 Rate

Dental Sealants for 6-9-Year-Old Children at Elevated Caries Risk – CHIPRA Core Set This performance measure assesses the percentage of enrolled children ages 6-9 years at elevated risk of dental caries who received a sealant on a permanent first molar tooth within the measurement year. Three rates are reported:
• CHIPRA – which utilized CHIPRA provider inclusion criteria Additionally, to be more closely aligned to the CHIPRA Core Set Measure specifications, this measure is enhanced for the state with additional available dental data (Dental-enhanced). Figure 5: Dental Sealants for Children (CHIPRA)
26
.81
%
31
.11
%
36
.72
%
19
.94
%
16
.59
%
22
.79
%
24
.40
%
25
.56
%
22
.09
%
27
.06
%
25
.21
%
21
.91
%
29
.92
%
21
.43
%
17
.16
%
20
.17
%
32
.06
%
24
.72
%
19
.90
%
22
.95
%
27
.12
%
24
.39
%
0.00%
10.00%
20.00%
30.00%
40.00%
50.00%
60.00%
70.00%
80.00%
90.00%
100.00%
Dental Sealants for 6-9 Year Old Children at Elevated Caries Risk (CHIPRA)
2018 Rate 2017 Rate

Figure 6: Dental Sealants for Children (CHIPRA: Dental-Enhanced)
26
.40
%
31
.11
%
36
.54
%
19
.58
%
16
.63
%
22
.66
%
24
.53
%
25
.50
%
22
.32
%
27
.02
%
25
.17
%
21
.63
%
29
.92
%
20
.41
%
17
.11
%
20
.02
%
30
.43
%
24
.57
%
19
.81
%
20
.10
%
26
.21
%
23
.12
%
0.00%
10.00%
20.00%
30.00%
40.00%
50.00%
60.00%
70.00%
80.00%
90.00%
100.00%
Dental Sealants for 6-9 Year Old Children at Elevated Caries Risk (CHIPRA: Dental-Enhanced)
2018 Rate 2017 Rate

Annual Number of Asthma Patients with One or More Asthma-Related Emergency Room Visits This performance measure assesses the percentage of children and adolescents, 2 years of age through 19 years of age, with an asthma diagnosis who have ≥1 emergency department (ED) visit during the measurement year.
For this measure a lower rate indicates better performance.
Figure 7: Annual Number of Asthma Patients with One or More Asthma Related Emergency Department Visits
8.7
5%
4.5
5%
4.7
6% 6.2
2%
3.5
5%
11
.18
%
9.8
0%
6.6
2%
8.7
7%
7.1
2%
7.7
1%9.1
0%
5.2
5%
4.3
7%
5.3
3%
4.4
5%
9.8
3%
8.9
1%
3.7
2%
9.3
2%
15
.34
%
8.4
0%
0.00%
2.00%
4.00%
6.00%
8.00%
10.00%
12.00%
14.00%
16.00%
18.00%
ABH CBC GEI HighmarkHMO
HighmarkPPO
HPP IBC NEPA UHC UPMC WeightedAverage
Annual Number of Asthma Patients with One or More Asthma-Related Emergency Room Visits (Age 2 – 19 years)
2018 Rate 2017 Rate

Contraceptive Care for All Women This performance measure assesses the percentage of women ages 15 through 20 at risk of unintended pregnancy and were provided a most effective/moderately effective contraception method or a long-acting reversible method of contraception (LARC). For the CMS Core measures, two rates are reported: one each for (1) the provision of most/moderately effective contraception and for (2) the provision of LARC. Figure 8: Contraceptive Care for All Women (Age 15 – 20 years): Most or Moderately Effective
21
.73
%
2.8
6%
21
.65
%
32
.66
%
27
.89
%
17
.79
%
14
.43
%
30
.77
%
18
.52
%
13
.14
%
17
.93
%
0.00%
5.00%
10.00%
15.00%
20.00%
25.00%
30.00%
35.00%
ABH CBC GEI HighmarkHMO
HighmarkPPO
HPP IBC NEPA UHC UPMC WeightedAverage
Contraceptive Care for All Women (Age 15 – 20 years): Most or Moderately Effective
2018 Rate

Figure 9: Contraceptive Care for All Women (Age 15-20 years): LARC
Contraceptive Care for Postpartum Women This performance measure assesses the percentage of women ages 15 through 20 who had a live birth and were provided a most effective/moderately effective contraception method or a long-acting reversible method of contraception (LARC), within 3 days and within 60 days of delivery. For the CMS Core measures, four rates are reported in total (1) Most or moderately effective contraception – 3 days, (2) Most or moderately effective contraception – 60 days, (3) LARC – 3 days, and (4) LARC – 60 days. Note: There are no figures for the Contraceptive Care for Postpartum Women (Age 15-20 years) PA PM, as denominators for all MCOs across all indicators are less than 30.
2.4
3%
1.7
8%
1.9
6%
2.0
1%
2.1
4% 2.4
3%
1.5
6%
1.6
7%
2.3
5%
3.6
5%
2.2
7%
0.00%
0.50%
1.00%
1.50%
2.00%
2.50%
3.00%
3.50%
4.00%
ABH CBC GEI HighmarkHMO
HighmarkPPO
HPP IBC NEPA UHC UPMC WeightedAverage
Contraceptive Care for All Women (Age 15 – 20 years): LARC
2018 Rate

HEDIS Performance Measure Selection and Descriptions
Each MCO underwent a full HEDIS compliance audit in 2018. As indicated previously, performance on selected HEDIS measures is included in this year’s EQR report. Development of HEDIS measures and the clinical rationale for their inclusion in the HEDIS measurement set can be found in HEDIS 2018, Volume 2 Narrative. The measurement year for HEDIS 2018 measures is 2017, as well as prior years for selected measures. Each year, DHS updates its requirements for the MCOs to be consistent with NCQA’s requirement for the reporting year. MCOs are required to report the complete set of CHIP measures, as specified in the HEDIS Technical Specifications, Volume 2. In addition, DHS does not require the MCOs to produce the Chronic Conditions component of the CAHPS 5.0 – Child Survey. Children and Adolescents’ Access to Primary Care Practitioners
This measure assesses the percentage of members 12 months–19 years of age who had a visit with a PCP. The organization reports four separate percentages for each product line.
Children 12–24 months and 25 months–6 years who had a visit with a PCP during the measurement year.
Children 7–11 years and adolescents 12–19 years who had a visit with a PCP during the measurement year or the year prior to the measurement year.
Figure 10: Children and Adolescents’ Access to Primary Care Practitioners Ages 12-24 Months
97
.41
%
96
.55
%
97
.99
%
10
0.0
0%
10
0.0
0%
94
.59
%
98
.36
%
97
.56
%
98
.51
%
99
.69
%
98
.24
%
99
.22
%
10
0.0
0%
99
.12
%
94
.87
%
10
0.0
0%
95
.16
%
10
0.0
0%
96
.77
%
98
.93
%
99
.37
%
98
.98
%
0.00%
10.00%
20.00%
30.00%
40.00%
50.00%
60.00%
70.00%
80.00%
90.00%
100.00%
Children and Adolescents' Access To PCP (12-24 Months)
2018 Rate 2017 Rate

Figure 11: Children and Adolescents’ Access to Primary Care Practitioners Ages 25 Months - 6 Years
93
.00
%
93
.20
%
93
.89
%
93
.94
%
95
.16
%
92
.90
%
94
.29
%
94
.15
%
94
.30
%
95
.65
%
94
.30
%
94
.80
%
95
.53
%
94
.68
%
96
.02
%
96
.10
%
91
.85
%
94
.54
%
93
.39
%
93
.22
%
95
.66
%
94
.54
%
0.00%
10.00%
20.00%
30.00%
40.00%
50.00%
60.00%
70.00%
80.00%
90.00%
100.00%
Children and Adolescents' Access To PCP (25 Months-6 Yrs)
2018 Rate 2017 Rate

Figure 12: Children and Adolescents’ Access to Primary Care Practitioners Ages 7-11 Years
96
.15
%
96
.51
%
96
.79
%
97
.01
%
98
.38
%
95
.98
%
97
.43
%
96
.48
%
96
.93
%
97
.00
%
96
.92
%
96
.37
%
96
.39
%
96
.44
%
97
.50
%
97
.39
%
97
.41
%
96
.99
%
96
.48
%
96
.50
%
95
.86
%
96
.60
%
0.00%
10.00%
20.00%
30.00%
40.00%
50.00%
60.00%
70.00%
80.00%
90.00%
100.00%
ABH CBC GEI HighmarkHMO
HighmarkPPO
HPP IBC NEPA UHC UPMC WeightedAverage
Children and Adolescents' Access To PCP (7-11 Yrs)
2018 Rate 2017 Rate

Figure 13: Children and Adolescents’ Access to Primary Care Practitioners Ages 12-19 Years
95
.31
%
96
.79
%
96
.56
%
97
.23
%
98
.28
%
95
.56
%
97
.33
%
97
.45
%
96
.18
%
96
.30
%
96
.66
%
95
.03
%
97
.05
%
96
.40
%
97
.32
%
97
.40
%
95
.44
%
96
.04
%
96
.00
%
95
.47
%
95
.76
%
96
.20
%
0.00%
10.00%
20.00%
30.00%
40.00%
50.00%
60.00%
70.00%
80.00%
90.00%
100.00%
ABH CBC GEI HighmarkHMO
HighmarkPPO
HPP IBC NEPA UHC UPMC WeightedAverage
Children and Adolescents' Access To PCP (12-19 Yrs)
2018 Rate 2017 Rate

Well-Child Visits in the First 15 Months of Life
This measure assessed the percentage of enrollees who turned 15 months old during the measurement year, who were continuously enrolled from 31 days of age through 15 months of age who received six or more well-child visits with a PCP during their first 15 months of life. Figure 14: Well Child Visits in the First 15 Months – 6 or more Visits
63
.33
%
83
.33
%
80
.13
%
65
.22
%
87
.88
%
72
.16
% 80
.00
%
63
.16
%
85
.63
%
80
.00
%
80
.02
%
67
.16
% 76
.27
%
80
.36
% 90
.00
%
85
.37
%
NA
73
.13
%
NA
70
.95
% 78
.91
%
75
.98
%
0.00%
10.00%
20.00%
30.00%
40.00%
50.00%
60.00%
70.00%
80.00%
90.00%
100.00%
ABH CBC GEI HighmarkHMO
HighmarkPPO
HPP IBC NEPA UHC UPMC WeightedAverage
Well-Child Visits in the first 15 Months of Life (6 or more visits)
2018 Rate 2017 Rate
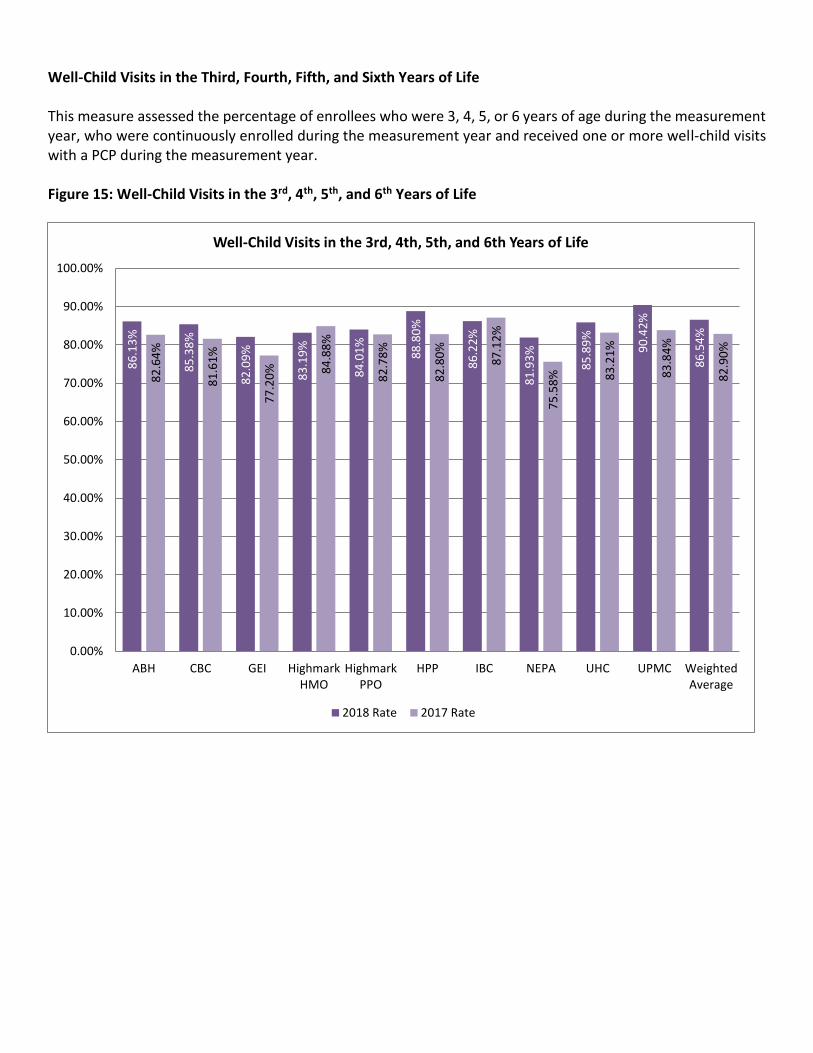
Well-Child Visits in the Third, Fourth, Fifth, and Sixth Years of Life This measure assessed the percentage of enrollees who were 3, 4, 5, or 6 years of age during the measurement year, who were continuously enrolled during the measurement year and received one or more well-child visits with a PCP during the measurement year. Figure 15: Well-Child Visits in the 3rd, 4th, 5th, and 6th Years of Life
86
.13
%
85
.38
%
82
.09
%
83
.19
%
84
.01
%
88
.80
%
86
.22
%
81
.93
%
85
.89
%
90
.42
%
86
.54
%
82
.64
%
81
.61
%
77
.20
% 84
.88
%
82
.78
%
82
.80
%
87
.12
%
75
.58
% 83
.21
%
83
.84
%
82
.90
%
0.00%
10.00%
20.00%
30.00%
40.00%
50.00%
60.00%
70.00%
80.00%
90.00%
100.00%
ABH CBC GEI HighmarkHMO
HighmarkPPO
HPP IBC NEPA UHC UPMC WeightedAverage
Well-Child Visits in the 3rd, 4th, 5th, and 6th Years of Life
2018 Rate 2017 Rate

Childhood Immunization Status This measure assessed the percentage of children who turned two years of age in the measurement year who were continuously enrolled for the 12 months preceding their second birthday and who received one or both of two immunization combinations on or before their second birthday. Separate rate were calculated for each Combination. Combination 2 and 3 consists of the following immunizations: (4) Diphtheria and Tetanus, and Pertussis Vaccine/Diphtheria and Tetanus (DTaP/DT) (3) Injectable Polio Vaccine (IPV) (1) Measles, Mumps, and Rubella (MMR) (3) Haemophilius Influenza Type B (HiB) (3) Hepatitis B (HepB) (1) Chicken Pox (VZV) (4) Pneumococcal Conjugate Vaccine – Combination 3 only Figure 16: Childhood Immunization Status – Combination 2
78
.50
%
82
.35
%
81
.66
%
89
.61
%
85
.48
%
77
.67
%
79
.07
%
80
.82
%
82
.24
%
82
.00
%
81
.58
%
88
.05
%
77
.14
%
83
.13
%
89
.55
%
80
.61
%
79
.22
%
78
.75
%
63
.83
%
80
.05
%
80
.78
%
80
.71
%0.00%
10.00%
20.00%
30.00%
40.00%
50.00%
60.00%
70.00%
80.00%
90.00%
100.00%
Childhood Immunization Status - Combo 2
2018 Rate 2017 Rate

Figure 17: Childhood Immunization Status – Combination 3
77
.57
%
81
.96
%
79
.29
%
85
.71
%
82
.26
%
75
.73
%
77
.67
%
80
.82
%
79
.56
%
79
.56
%
79
.49
%
84
.91
%
76
.19
%
81
.48
%
88
.06
%
75
.51
%
74
.03
%
76
.88
%
63
.83
%
78
.10
%
77
.86
%
78
.40
%
0.00%
10.00%
20.00%
30.00%
40.00%
50.00%
60.00%
70.00%
80.00%
90.00%
100.00%
ABH CBC GEI HighmarkHMO
HighmarkPPO
HPP IBC NEPA UHC UPMC WeightedAverage
Childhood Immunization Status - Combo 3
2018 Rate 2017 Rate

Figure 18: Childhood Immunization Status – Combination 4
76
.17
%
77
.65
%
73
.37
% 84
.42
%
78
.23
%
74
.76
%
74
.88
%
67
.12
% 78
.35
%
77
.62
%
76
.72
%
83
.65
%
69
.52
%
75
.31
% 83
.58
%
64
.29
%
71
.43
%
72
.50
%
53
.19
%
74
.45
%
75
.43
%
74
.06
%
0.00%
10.00%
20.00%
30.00%
40.00%
50.00%
60.00%
70.00%
80.00%
90.00%
100.00%
ABH CBC GEI HighmarkHMO
HighmarkPPO
HPP IBC NEPA UHC UPMC WeightedAverage
Childhood Immunization Status - Combo 4
2018 Rate 2017 Rate

Figure 19: Childhood Immunization Status – Combination 5
67
.76
%
72
.94
%
68
.93
% 77
.92
%
70
.16
%
68
.45
%
72
.09
%
72
.60
%
68
.37
%
72
.75
%
70
.46
%
73
.58
%
62
.38
%
73
.25
% 80
.60
%
59
.18
%
59
.74
%
57
.50
%
55
.32
%
64
.96
%
69
.34
%
66
.51
%
0.00%
10.00%
20.00%
30.00%
40.00%
50.00%
60.00%
70.00%
80.00%
90.00%
100.00%
ABH CBC GEI HighmarkHMO
HighmarkPPO
HPP IBC NEPA UHC UPMC WeightedAverage
Childhood Immunization Status - Combo 5
2018 Rate 2017 Rate

Figure 20: Childhood Immunization Status – Combination 6
54
.67
%
54
.51
%
42
.01
% 51
.95
%
56
.45
%
56
.31
%
63
.26
%
50
.68
%
56
.69
%
53
.53
%
54
.11
%64
.78
%
45
.71
%
47
.74
% 56
.72
%
51
.02
%
51
.95
% 60
.00
%
38
.30
%
51
.82
%
52
.55
%
52
.31
%
0.00%
10.00%
20.00%
30.00%
40.00%
50.00%
60.00%
70.00%
80.00%
90.00%
100.00%
Childhood Immunization Status - Combo 6
2018 Rate 2017 Rate

Figure 21: Childhood Immunization Status – Combination 7
66
.82
%
70
.59
%
64
.50
%
77
.92
%
68
.55
%
67
.96
%
70
.23
%
60
.27
% 67
.40
%
71
.78
%
68
.63
%
73
.58
%
60
.00
% 67
.90
%
77
.61
%
54
.08
%
58
.44
%
55
.00
%
46
.81
%
63
.50
%
68
.13
%
64
.24
%
0.00%
10.00%
20.00%
30.00%
40.00%
50.00%
60.00%
70.00%
80.00%
90.00%
100.00%
ABH CBC GEI HighmarkHMO
HighmarkPPO
HPP IBC NEPA UHC UPMC WeightedAverage
Childhood Immunization Status - Combo 7
2018 Rate 2017 Rate

Figure 22: Childhood Immunization Status – Combination 8
53
.27
%
52
.55
%
40
.53
%
51
.95
%
54
.84
%
55
.83
%
62
.33
%
47
.95
% 56
.69
%
53
.53
%
53
.40
%
64
.15
%
43
.81
%
46
.50
% 55
.22
%
46
.94
%
51
.95
%
58
.13
%
31
.91
%
50
.36
%
51
.82
%
50
.85
%
0.00%
10.00%
20.00%
30.00%
40.00%
50.00%
60.00%
70.00%
80.00%
90.00%
100.00%
ABH CBC GEI HighmarkHMO
HighmarkPPO
HPP IBC NEPA UHC UPMC WeightedAverage
Childhood Immunization Status - Combo 8
2018 Rate 2017 Rate

Figure 23: Childhood Immunization Status – Combination 9
49
.53
%
49
.41
%
37
.28
%
49
.35
%
47
.58
%
52
.91
% 59
.07
%
47
.95
%
50
.85
%
49
.64
%
49
.27
%55
.97
%
38
.57
%
43
.62
%
53
.73
%
40
.82
%
44
.16
%
49
.38
%
31
.91
%
44
.04
%
48
.42
%
45
.58
%
0.00%
10.00%
20.00%
30.00%
40.00%
50.00%
60.00%
70.00%
80.00%
90.00%
100.00%
ABH CBC GEI HighmarkHMO
HighmarkPPO
HPP IBC NEPA UHC UPMC WeightedAverage
Childhood Immunization Status - Combo 9
2018 Rate 2017 Rate
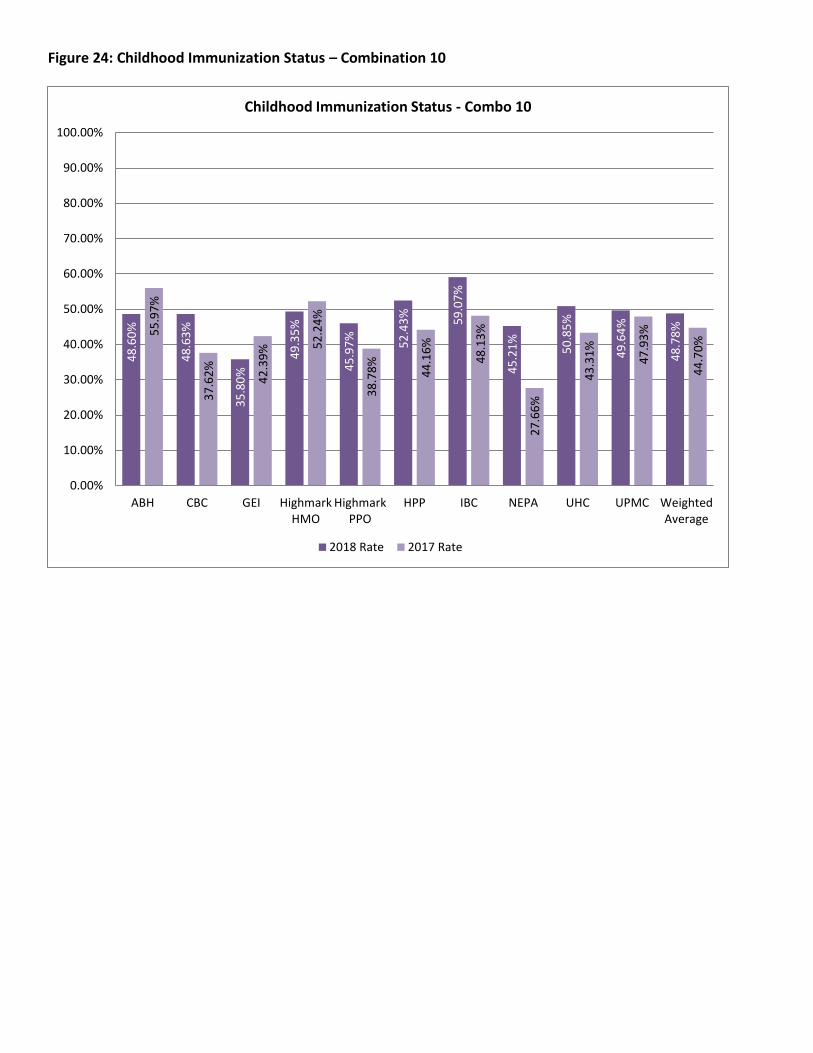
Figure 24: Childhood Immunization Status – Combination 10
48
.60
%
48
.63
%
35
.80
%
49
.35
%
45
.97
%
52
.43
%
59
.07
%
45
.21
%
50
.85
%
49
.64
%
48
.78
%55
.97
%
37
.62
%
42
.39
% 52
.24
%
38
.78
%
44
.16
%
48
.13
%
27
.66
%
43
.31
%
47
.93
%
44
.70
%
0.00%
10.00%
20.00%
30.00%
40.00%
50.00%
60.00%
70.00%
80.00%
90.00%
100.00%
ABH CBC GEI HighmarkHMO
HighmarkPPO
HPP IBC NEPA UHC UPMC WeightedAverage
Childhood Immunization Status - Combo 10
2018 Rate 2017 Rate

Adolescent Well-Care Visits
This measure assessed the percentage of enrolled members 12–21 years of age who had at least one comprehensive well-care visit with a PCP or an OB/GYN practitioner during the measurement year.
Figure 25: Adolescent Well-Care Visits
68
.86
%
70
.62
%
63
.39
%
69
.54
%
67
.06
%
71
.31
%
76
.44
%
65
.74
% 73
.72
%
67
.82
%
70
.44
%
67
.36
%
69
.67
%
67
.97
%
65
.49
%
65
.06
%
67
.36
%
70
.50
%
62
.71
%
69
.10
%
65
.54
%
67
.62
%
0.00%
10.00%
20.00%
30.00%
40.00%
50.00%
60.00%
70.00%
80.00%
90.00%
100.00%
ABH CBC GEI HighmarkHMO
HighmarkPPO
HPP IBC NEPA UHC UPMC WeightedAverage
Adolescent Well-Care Visits
2018 Rate 2017 Rate

Weight assessment and Counseling for Nutrition and Physical Activity for Children/Adolescents
The percentage of members 3–17 years of age who had an outpatient visit with a PCP or OB/GYN and who had evidence of the following during the measurement year.
BMI percentile documentation.
Counseling for nutrition.
Counseling for physical activity
*Because BMI norms for youth vary with age and gender, this measure evaluates whether BMI percentile is assessed rather than an absolute BMI value.
Figure 26: Weight Assessment and Counseling – Body Mass Index 3-17 Years
80
.05
%
80
.93
%
82
.29
%
81
.62
%
83
.33
%
74
.47
%
69
.01
%
63
.29
%
87
.35
%
80
.28
%
79
.96
%
68
.06
%
65
.83
%
82
.22
%
86
.62
%
84
.44
%
72
.68
%
63
.13
% 71
.50
%
76
.40
%
76
.72
%
74
.28
%0.00%
10.00%
20.00%
30.00%
40.00%
50.00%
60.00%
70.00%
80.00%
90.00%
100.00%
ABH CBC GEI HighmarkHMO
HighmarkPPO
HPP IBC NEPA UHC UPMC WeightedAverage
Weight Assessment and Counseling – Body Mass Index 3-17 Years
2018 Rate 2017 Rate

Figure 27: Weight Assessment and Counseling – Nutrition 3-17 Years
74
.70
%
71
.65
%
70
.83
%
76
.95
%
74
.32
%
81
.38
%
73
.18
%
64
.81
%
86
.62
%
75
.83
%
76
.90
%
70
.14
%
66
.33
%
74
.57
%
76
.16
%
74
.74
%
74
.69
%
68
.43
%
69
.53
%
74
.94
%
73
.56
%
72
.42
%
0.00%
10.00%
20.00%
30.00%
40.00%
50.00%
60.00%
70.00%
80.00%
90.00%
100.00%
Weight Assessment and Counseling – Nutrition 3-17 Years
2018 Rate 2017 Rate
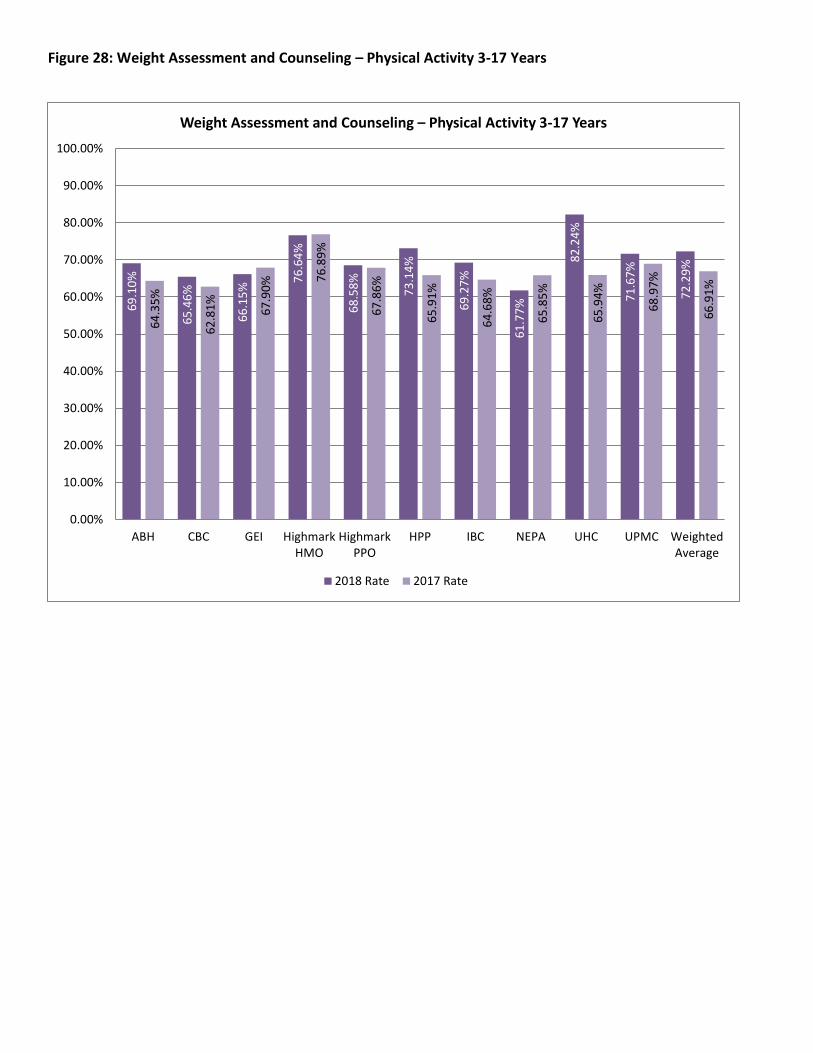
Figure 28: Weight Assessment and Counseling – Physical Activity 3-17 Years
69
.10
%
65
.46
%
66
.15
%
76
.64
%
68
.58
%
73
.14
%
69
.27
%
61
.77
%
82
.24
%
71
.67
%
72
.29
%
64
.35
%
62
.81
%
67
.90
% 76
.89
%
67
.86
%
65
.91
%
64
.68
%
65
.85
%
65
.94
%
68
.97
%
66
.91
%
0.00%
10.00%
20.00%
30.00%
40.00%
50.00%
60.00%
70.00%
80.00%
90.00%
100.00%
ABH CBC GEI HighmarkHMO
HighmarkPPO
HPP IBC NEPA UHC UPMC WeightedAverage
Weight Assessment and Counseling – Physical Activity 3-17 Years
2018 Rate 2017 Rate

Immunization for Adolescents This measure assessed the percentage of adolescents 13 years of age who had one dose of meningococcal conjugate vaccine and one tetanus, diphtheria toxoids and acellular pertussis (Tdap) vaccine by their 13th birthday. The measure calculates a rate for each vaccine and two combination rates.
• Combination 1: Meningococcal and Tdap
• Combination 2: Meningococcal, Tdap, and HPV Figure 29: Immunizations for Adolescents – Meningococcal Vaccination
88
.08
%
88
.32
%
90
.75
%
91
.97
%
92
.21
%
89
.49
%
92
.94
%
92
.34
%
91
.24
%
90
.27
%
90
.78
%
91
.86
%
89
.78
%
91
.28
%
93
.43
%
93
.43
%
87
.62
%
88
.96
%
89
.96
%
92
.21
%
90
.02
%
90
.92
%
0.00%
10.00%
20.00%
30.00%
40.00%
50.00%
60.00%
70.00%
80.00%
90.00%
100.00%
ABH CBC GEI HighmarkHMO
HighmarkPPO
HPP IBC NEPA UHC UPMC WeightedAverage
Immunizations for Adolescents - Meningococcal
2018 Rate 2017 Rate

Figure 30: Immunizations for Adolescents – Tdap/Td
91
.48
%
94
.89
%
92
.21
%
93
.19
%
93
.97
%
91
.69
%
95
.38
%
93
.15
%
91
.00
%
93
.43
%
93
.02
%
93
.64
%
91
.48
%
93
.08
%
94
.65
%
93
.19
%
91
.90
%
90
.95
%
89
.54
%
93
.43
%
91
.48
%
92
.36
%
0.00%
10.00%
20.00%
30.00%
40.00%
50.00%
60.00%
70.00%
80.00%
90.00%
100.00%
ABH CBC GEI HighmarkHMO
HighmarkPPO
HPP IBC NEPA UHC UPMC WeightedAverage
Immunizations for Adolescents - Tdap
2018 Rate 2017 Rate

Figure 31: Immunizations for Adolescents – HPV
32
.60
%
29
.20
%
24
.33
%
29
.68
%
28
.64
%
38
.88
%
38
.44
%
24
.19
%
39
.66
%
25
.79
% 32
.27
%
23
.66
%
21
.41
%
15
.38
%
21
.17
%
20
.44
%
25
.71
%
21
.85
%
12
.97
%
25
.30
%
24
.82
%
22
.35
%
0.00%
10.00%
20.00%
30.00%
40.00%
50.00%
60.00%
70.00%
80.00%
90.00%
100.00%
ABH CBC GEI HighmarkHMO
HighmarkPPO
HPP IBC NEPA UHC UPMC WeightedAverage
Immunizations for Adolescents - HPV
2018 Rate 2017 Rate

Figure 32: Immunizations for Adolescents – Combination 1
86
.13
%
87
.59
%
88
.56
%
91
.48
%
91
.46
%
88
.02
%
92
.46
%
90
.73
%
88
.56
%
90
.02
%
89
.52
%
90
.84
%
87
.83
%
90
.51
%
93
.19
%
90
.75
%
84
.76
%
87
.20
%
87
.45
%
90
.51
%
88
.32
%
89
.28
%
0.00%
10.00%
20.00%
30.00%
40.00%
50.00%
60.00%
70.00%
80.00%
90.00%
100.00%
ABH CBC GEI HighmarkHMO
HighmarkPPO
HPP IBC NEPA UHC UPMC WeightedAverage
Immunizations for Adolescents - Combination 1
2018 Rate 2017 Rate

Figure 33: Immunizations for Adolescents – Combination 2
29
.68
%
26
.76
%
22
.87
% 29
.20
%
27
.64
% 36
.67
%
35
.52
%
22
.58
%
38
.20
%
24
.33
% 30
.46
%
23
.16
%
20
.68
%
14
.87
% 21
.17
%
19
.95
%
23
.33
%
20
.31
%
12
.55
%
24
.33
%
22
.87
%
21
.30
%
0.00%
10.00%
20.00%
30.00%
40.00%
50.00%
60.00%
70.00%
80.00%
90.00%
100.00%
ABH CBC GEI HighmarkHMO
HighmarkPPO
HPP IBC NEPA UHC UPMC WeightedAverage
Immunizations for Adolescents - Combination 2
2018 Rate 2017 Rate

Lead Screening in Children This measure assessed the percentage of children 2 years of age who had one or more capillary or venous lead blood tests for lead poisoning by their second birthday. Figure 34: Lead Screening in Children
65
.42
%
35
.69
%
70
.41
%
59
.74
%
37
.90
%
72
.82
%
62
.04
%
45
.21
%
66
.18
%
65
.21
%
61
.91
%
73
.58
%
41
.43
%
77
.78
%
53
.73
%
28
.57
%
58
.44
%
53
.75
%
46
.81
%
64
.72
%
61
.07
%
60
.37
%
0.00%
10.00%
20.00%
30.00%
40.00%
50.00%
60.00%
70.00%
80.00%
90.00%
100.00%
ABH CBC GEI HighmarkHMO
HighmarkPPO
HPP IBC NEPA UHC UPMC WeightedAverage
Lead Screening in Children
2018 Rate 2017 Rate

Follow-up Care for Children Prescribed ADHD Medication
This measure assessed the percentage of children newly prescribed attention-deficit/hyperactivity disorder (ADHD) medication who had at least three follow-up care visits within a 10-month period, one of which was within 30 days of when the first ADHD medication was dispensed. Two rates are reported.
Initiation Phase. The percentage of members 6–12 years of age as of the IPSD with an ambulatory prescription dispensed for ADHD medication, who had one follow-up visit with practitioner with prescribing authority during the 30-day Initiation Phase.
Continuation and Maintenance (C&M) Phase. The percentage of members 6–12 years of age as of the IPSD with an ambulatory prescription dispensed for ADHD medication, who remained on the medication for at least 210 days and who, in addition to the visit in the Initiation Phase, had at least two follow-up visits with a practitioner within 270 days (9 months) after the Initiation Phase ended.
Figure 35: Follow-up Care for Children Prescribed ADHD Medication - Initiation Phase
40
.00
%
35
.82
%
50
.00
% 60
.00
%
46
.34
%
36
.21
%
43
.14
%
62
.07
%
54
.04
% 63
.71
%
50
.15
%
46
.30
%
42
.19
%
56
.36
%
58
.11
%
58
.23
%
17
.65
%
47
.83
%
NA
50
.49
%
55
.39
%
50
.32
%0.00%
10.00%
20.00%
30.00%
40.00%
50.00%
60.00%
70.00%
80.00%
90.00%
100.00%
ABH CBC GEI HighmarkHMO
HighmarkPPO
HPP IBC NEPA UHC UPMC WeightedAverage
Follow Up Care for Children Prescribed ADHD Medication - Initiation Phase
2018 Rate 2017 Rate

Figure 36: Follow-up Care for Children Prescribed ADHD Medication – Continuation and Maintenance Phase
16
.67
% 29
.03
%
55
.00
%
71
.43
%
33
.33
%
33
.33
%
61
.11
%
88
.89
%
56
.67
%
78
.02
%
62
.64
%
NA
NA
NA
NA
NA
NA
NA
NA
62
.50
%
63
.08
%
62
.83
%
0.00%
10.00%
20.00%
30.00%
40.00%
50.00%
60.00%
70.00%
80.00%
90.00%
100.00%
ABH CBC GEI HighmarkHMO
HighmarkPPO
HPP IBC NEPA UHC UPMC WeightedAverage
Follow Up Care for Children Prescribed ADHD Medication - Continuation & Maintenance Phase
2018 Rate 2017 Rate
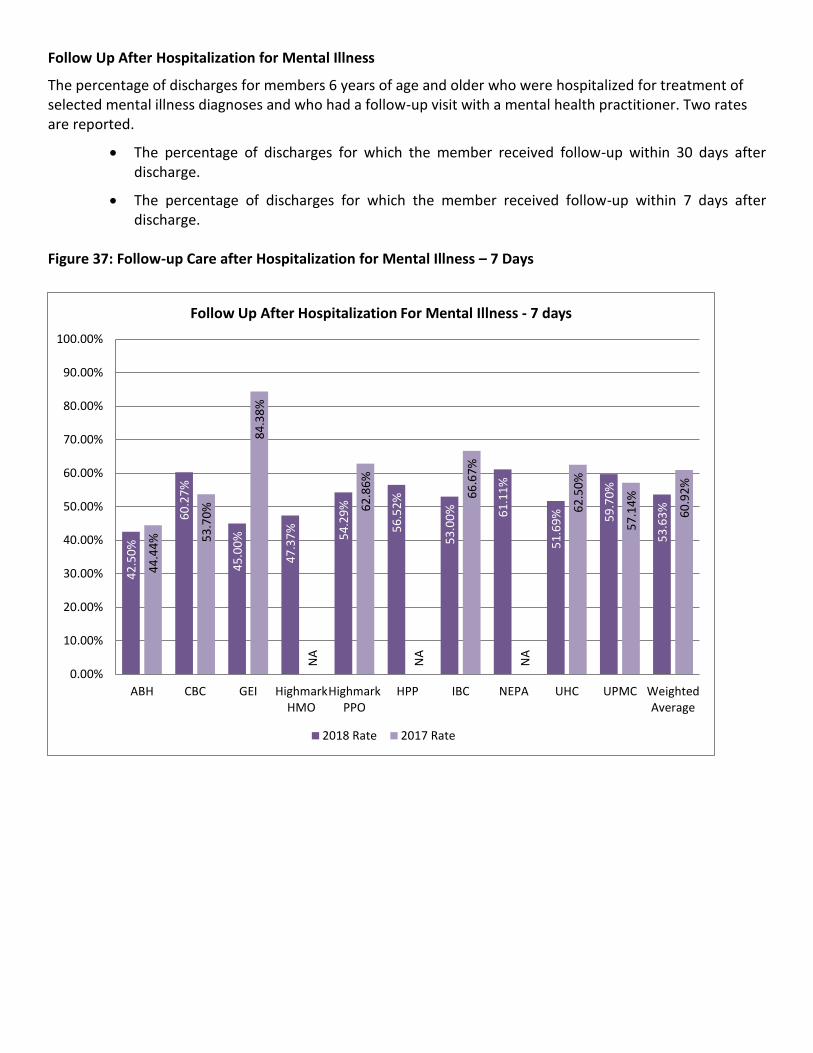
Follow Up After Hospitalization for Mental Illness
The percentage of discharges for members 6 years of age and older who were hospitalized for treatment of selected mental illness diagnoses and who had a follow-up visit with a mental health practitioner. Two rates are reported.
• The percentage of discharges for which the member received follow-up within 30 days after discharge.
• The percentage of discharges for which the member received follow-up within 7 days after discharge.
Figure 37: Follow-up Care after Hospitalization for Mental Illness – 7 Days
42
.50
%
60
.27
%
45
.00
%
47
.37
%
54
.29
%
56
.52
%
53
.00
% 61
.11
%
51
.69
% 59
.70
%
53
.63
%
44
.44
% 53
.70
%
84
.38
%
NA
62
.86
%
NA
66
.67
%
NA
62
.50
%
57
.14
%
60
.92
%0.00%
10.00%
20.00%
30.00%
40.00%
50.00%
60.00%
70.00%
80.00%
90.00%
100.00%
ABH CBC GEI HighmarkHMO
HighmarkPPO
HPP IBC NEPA UHC UPMC WeightedAverage
Follow Up After Hospitalization For Mental Illness - 7 days
2018 Rate 2017 Rate

Figure 38: Follow-Up Care after Hospitalization for Mental Illness – 30 Days
57
.50
%
86
.30
%
75
.00
%
73
.68
%
91
.43
%
73
.91
%
65
.00
%
66
.67
%
77
.97
% 85
.07
%
77
.34
%
66
.67
%
83
.33
%
96
.88
%
NA
80
.00
%
NA
73
.91
%
NA
81
.73
%
80
.00
%
80
.00
%
0.00%
10.00%
20.00%
30.00%
40.00%
50.00%
60.00%
70.00%
80.00%
90.00%
100.00%
ABH CBC GEI HighmarkHMO
HighmarkPPO
HPP IBC NEPA UHC UPMC WeightedAverage
Follow Up After Hospitalization For Mental Illness - 30 days
2018 Rate 2017 Rate

Annual Dental Visit This measure assessed the percentage of children and adolescents between the ages of 2 and 20 years of age who were continuously enrolled in the MCO for the measurement year who had a dental visit during the measurement year. Figure 39: Annual Dental Visits Ages 2-19 Years
73
.32
%
76
.98
%
62
.60
%
77
.79
%
78
.02
%
70
.83
% 79
.16
%
77
.67
%
69
.12
%
69
.28
%
72
.33
%
74
.50
%
78
.04
%
64
.08
%
79
.44
%
80
.60
%
71
.72
%
77
.41
%
81
.40
%
66
.10
%
68
.07
%
72
.15
%
0.00%
10.00%
20.00%
30.00%
40.00%
50.00%
60.00%
70.00%
80.00%
90.00%
100.00%
ABH CBC GEI HighmarkHMO
HighmarkPPO
HPP IBC NEPA UHC UPMC WeightedAverage
Annual Dental Visits Ages 2-19 Years
2018 Rate 2017 Rate

Chlamydia Screening in Women This measure assessed the percentage of women 16–19 years of age who were identified as sexually active and who had at least one test for chlamydia during the measurement year. Figure 40: Chlamydia Screening in Women – 16-19 Years Total Rate
38
.86
%
31
.40
% 35
.74
%
29
.26
%
31
.17
%
50
.26
% 56
.41
%
33
.33
%
42
.19
%
33
.02
% 38
.59
%
45
.69
%
25
.94
% 30
.74
%
26
.17
%
27
.60
%
50
.00
%
56
.75
%
22
.93
%
40
.97
%
31
.57
% 36
.44
%
0.00%
10.00%
20.00%
30.00%
40.00%
50.00%
60.00%
ABH CBC GEI HighmarkHMO
HighmarkPPO
HPP IBC NEPA UHC UPMC WeightedAverage
Chlamydia Screening in Women - 16-19 Years Total
2018 Rate 2017 Rate

Appropriate Testing for Children with Pharyngitis This measure assessed the percentage of children 3–18 years of age who were diagnosed with pharyngitis, dispensed an antibiotic and received a group A streptococcus (strep) test for the episode. A higher rate represents better performance (i.e., appropriate testing). Figure 41: Appropriate Testing for Children with Pharyngitis
87
.53
%
83
.66
%
87
.83
%
89
.08
%
87
.31
%
81
.77
%
89
.08
%
79
.71
%
83
.46
%
90
.20
%
86
.70
%
86
.62
%
83
.54
%
82
.60
%
87
.46
%
85
.52
%
79
.80
%
82
.72
%
75
.38
%
82
.26
%
85
.35
%
83
.64
%
0.00%
10.00%
20.00%
30.00%
40.00%
50.00%
60.00%
70.00%
80.00%
90.00%
100.00%
Appropriate Testing for Children With Pharyngitis
2018 Rate 2017 Rate

Appropriate Treatment for Children with Upper Respiratory Infection This measure assessed the percentage of children 3 months–18 years of age who were given a diagnosis of upper respiratory infection (URI) and were not dispensed an antibiotic prescription. Figure 42: Appropriate Testing for Children with Upper Respiratory Infection
92
.77
%
88
.29
%
91
.84
%
85
.30
%
88
.91
%
93
.98
%
92
.65
%
81
.30
%
90
.65
%
87
.95
%
89
.71
%
93
.25
%
90
.15
% 92
.15
%
81
.94
%
85
.97
%
90
.79
%
91
.80
%
88
.89
%
89
.04
%
87
.27
%
88
.98
%
74.00%
76.00%
78.00%
80.00%
82.00%
84.00%
86.00%
88.00%
90.00%
92.00%
94.00%
96.00%
Appropriate Treatment for Children With Upper Respiratory Infection
2018 Rate 2017 Rate

Medication Management for People with Asthma - 75% Compliance This measure assessed the percentage of members 5–19 years of age during the measurement year who were identified as having persistent asthma and were dispensed appropriate medications that they remained on during the treatment period and remained on an asthma controller medication for at least 75% of their treatment period. Figure 43: Medication Management for People with Asthma – Ages 5-19 Years
30
.28
% 35
.36
%
39
.39
% 45
.37
%
40
.88
%
29
.25
% 34
.35
%
37
.93
%
33
.04
%
33
.08
%
35
.15
%41
.03
%
34
.10
%
37
.29
%
32
.59
%
40
.43
%
30
.00
%
30
.89
%
44
.07
%
34
.24
% 39
.18
%
35
.49
%
0.00%
5.00%
10.00%
15.00%
20.00%
25.00%
30.00%
35.00%
40.00%
45.00%
50.00%
ABH CBC GEI HighmarkHMO
HighmarkPPO
HPP IBC NEPA UHC UPMC WeightedAverage
Medication Management for People With Asthma - Medication Compliance 75% Ages 5-19 Years
2018 Rate 2017 Rate