chilled water plant design and contro - utah ashrae
TRANSCRIPT
March 2, 2012
Kent W. Peterson, PE, FASHRAE
P2S Engineering, Inc. Long Beach, CA
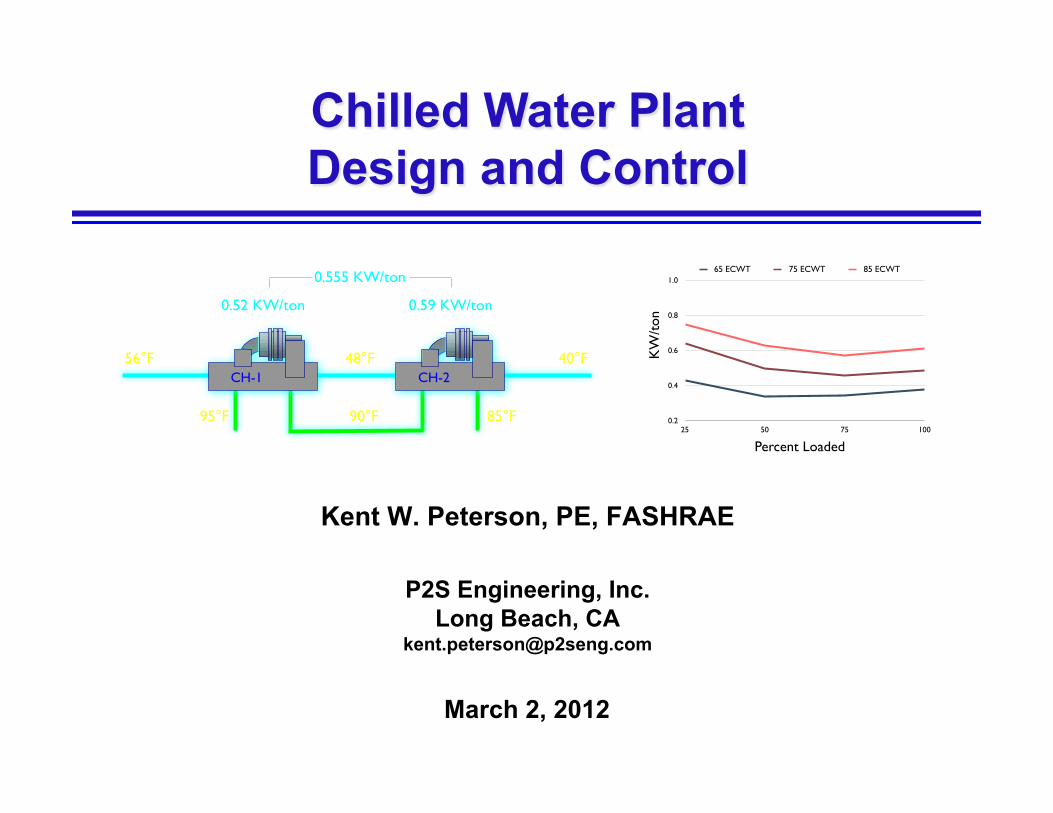
Chilled Water Plant Design and Control
CH-1 CH-2
95°F 85°F90°F
0.52 KW/ton 0.59 KW/ton
0.555 KW/ton
40°F56°F 48°F
0.2
0.4
0.6
0.8
1.0
25 50 75 100
65 ECWT 75 ECWT 85 ECWT
Percent Loaded
KW
/ton

2
Handouts
A copy of the today’s slides in PDF format will be available from Trent Hunt
3
Agenda
CHW Distribution Systems CHW Distribution System Balancing CW Distribution Systems Break Selecting CHW Distribution Systems Selecting CHW ΔT Selecting CW ΔT Selecting Chillers Optimizing Control Sequences Questions
4
Optimizing Energy Usage
Chillers • Type, efficiency, size, VFD
Cooling Towers • Fan type, efficiency, approach, range, speed control,
flow turndown Chilled Water Pumps
• Arrangement, flow rate (delta-T), pressure drop, VFD Condenser Water Pumps
• Flow rate (delta-T), pressure drop, VFD Air Handling Units
• Coil sizing, air-side pressure drop, water-side pressure drop
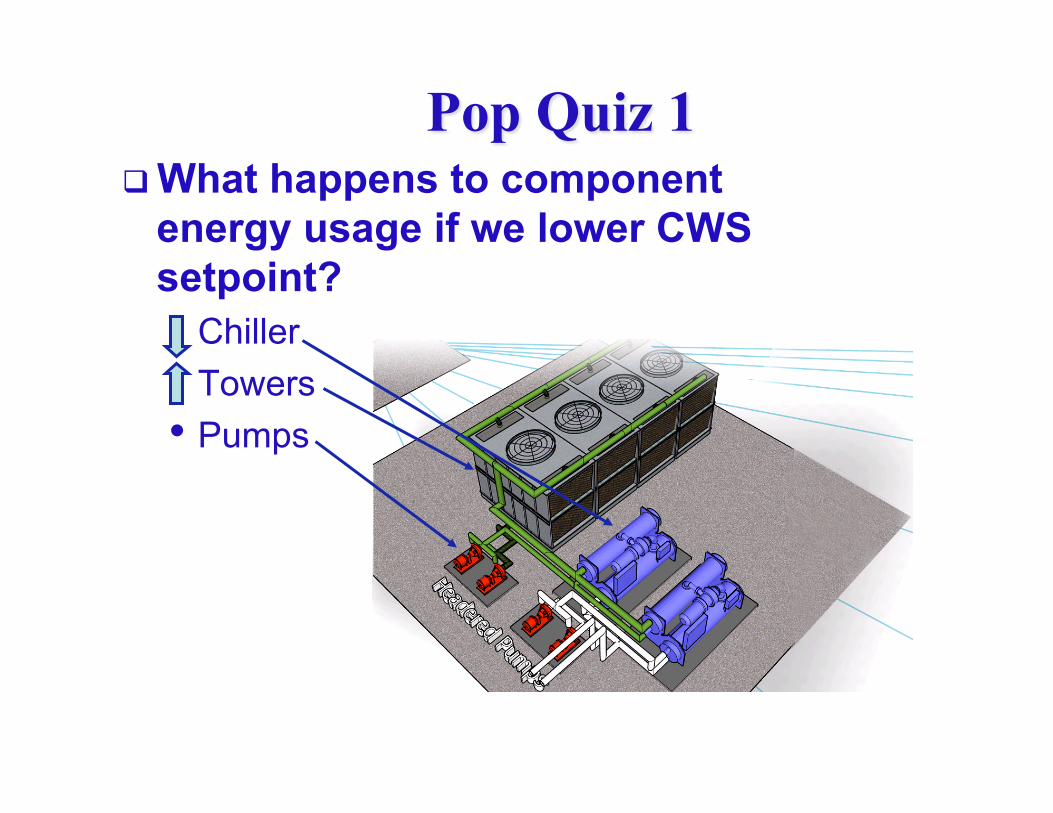
Pop Quiz 1 What happens to component
energy usage if we lower CWS setpoint? • Chiller • Towers • Pumps
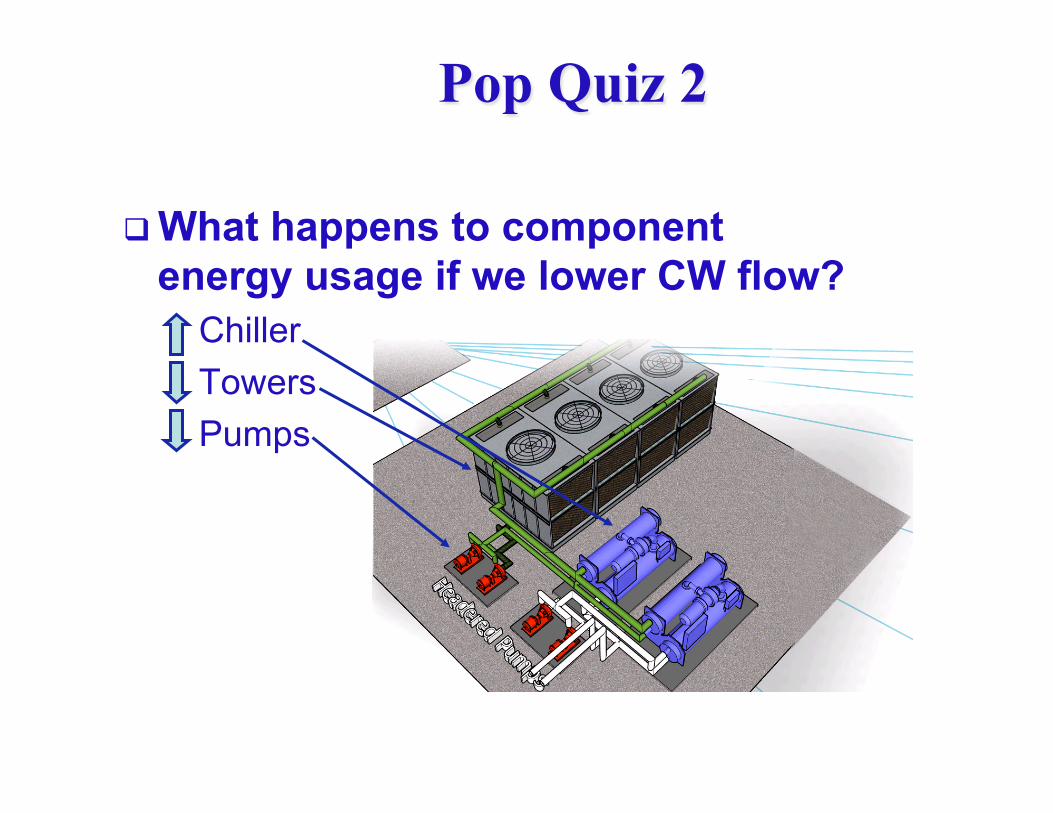
Pop Quiz 2
What happens to component energy usage if we lower CW flow? • Chiller • Towers • Pumps
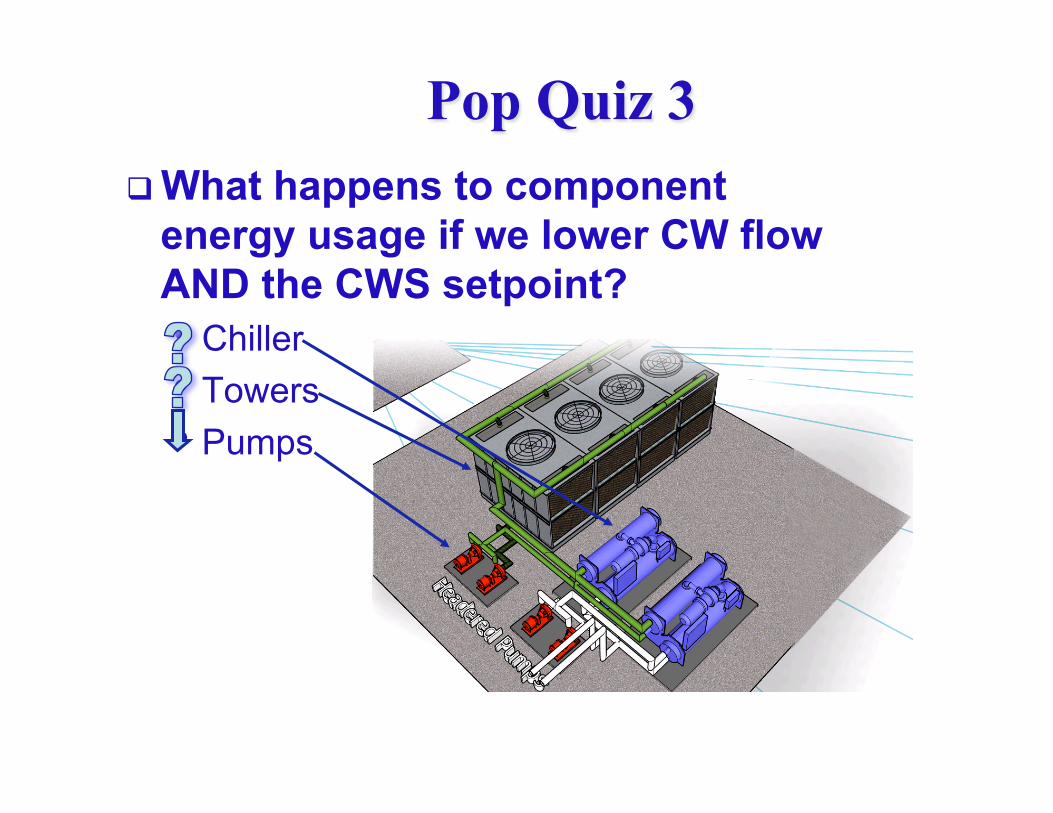
Pop Quiz 3 What happens to component
energy usage if we lower CW flow AND the CWS setpoint? • Chiller • Towers • Pumps

8
Optimizing CHW Plant Design
Ideal: Design a plant with lowest life cycle costs (first cost plus lifelong operating costs) accounting for all the complexities and interaction among plant components
Practical: Design plant subsystems to be near-life cycle cost optimum using techniques that are simple and practical enough to be used without a significant increase in design time

9
Chilled Water Distribution Systems
10
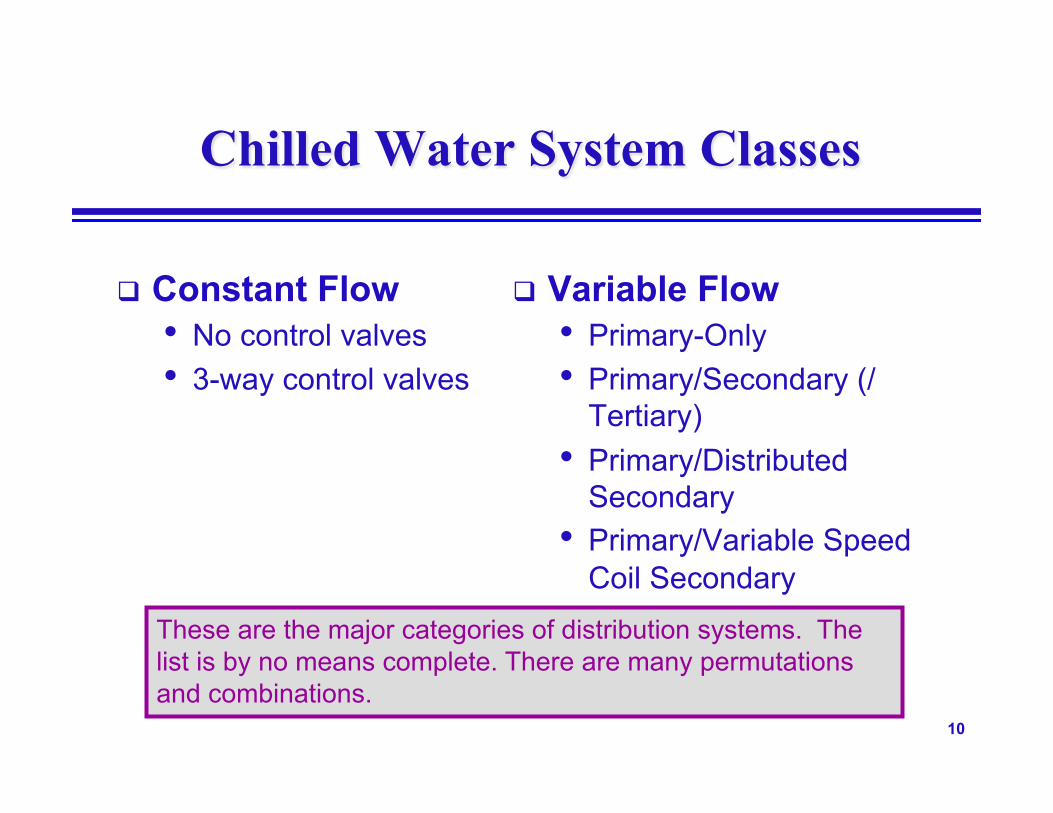
Chilled Water System Classes
Constant Flow • No control valves • 3-way control valves
Variable Flow • Primary-Only • Primary/Secondary (/
Tertiary) • Primary/Distributed
Secondary • Primary/Variable Speed
Coil Secondary These are the major categories of distribution systems. The list is by no means complete. There are many permutations and combinations.

11
Constant Flow Single Chiller, Single Coil, No Control Valve
12
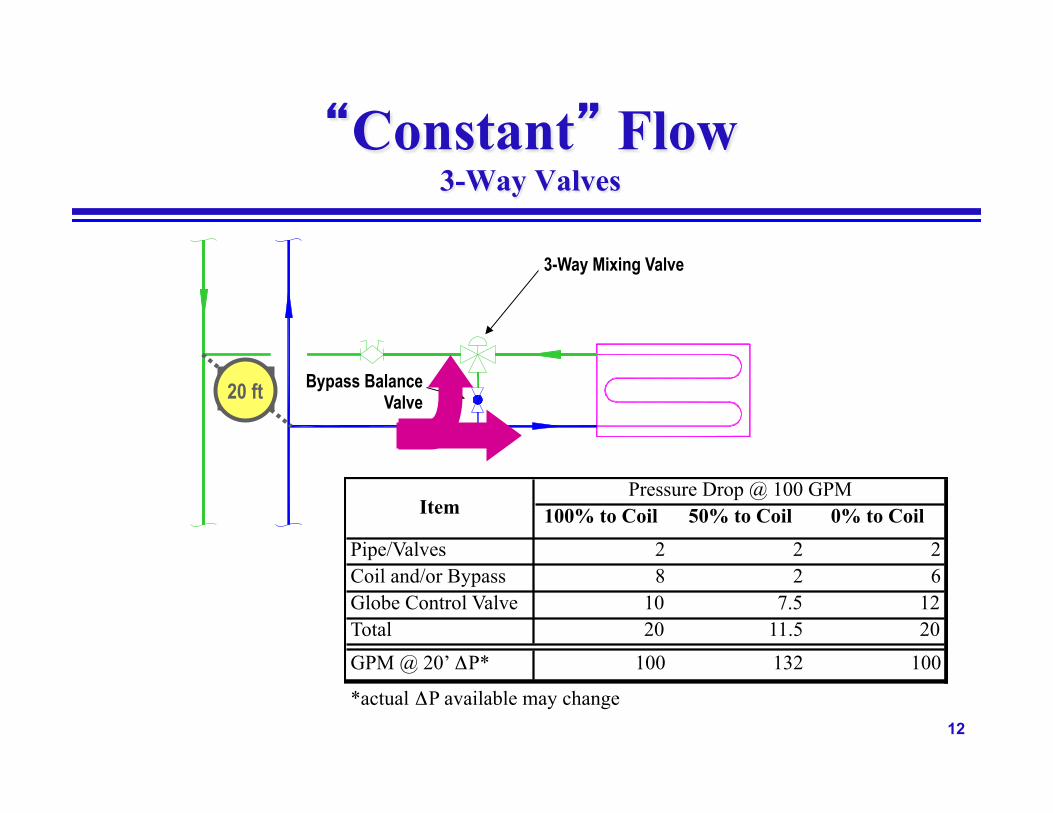
“Constant” Flow 3-Way Valves
100% to Coil 50% to Coil 0% to Coil
Pipe/Valves 2 2 2Coil and/or Bypass 8 2 6Globe Control Valve 10 7.5 12Total 20 11.5 20
GPM @ 20’ ΔP* 100 132 100
Pressure Drop @ 100 GPM
*actual ΔP available may change
Item
3-Way Mixing Valve
Bypass Balance Valve
DP 20 ft

13
Constant Flow Single Chiller, Multiple Coils
14
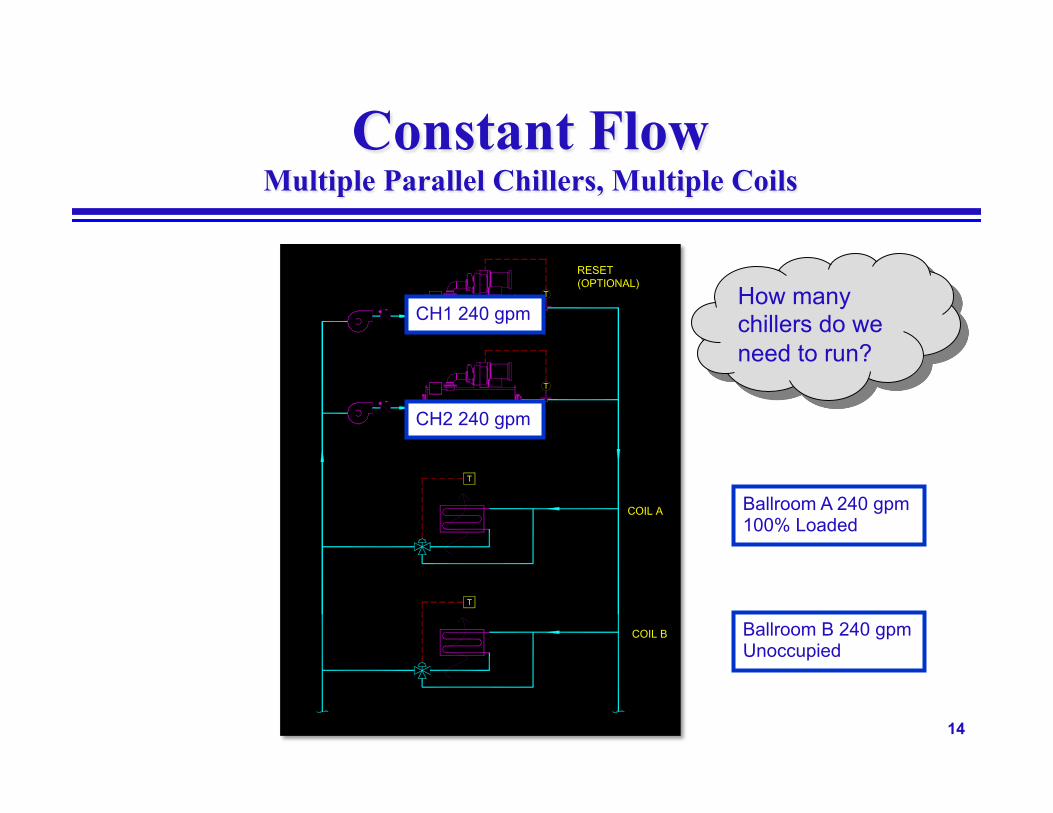
Constant Flow Multiple Parallel Chillers, Multiple Coils
CH2 240 gpm
CH1 240 gpm How many chillers do we need to run?
Ballroom A 240 gpm 100% Loaded
Ballroom B 240 gpm Unoccupied

15
Variable Flow
Vary Flow Through Coil Circuit • Two-way valves • Variable speed coil pump
Configurations • Primary-secondary • Primary-secondary variations • Primary-secondary-tertiary • Primary-only

16
Variable Flow Chilled Water Systems
Old Paradigm • Controls respond to changes in CHW
temperature • Variable flow causes low temperature
trips, locks out chiller, requires manual reset (may even freeze)
• Hence: Maintain constant flow through chillers
17
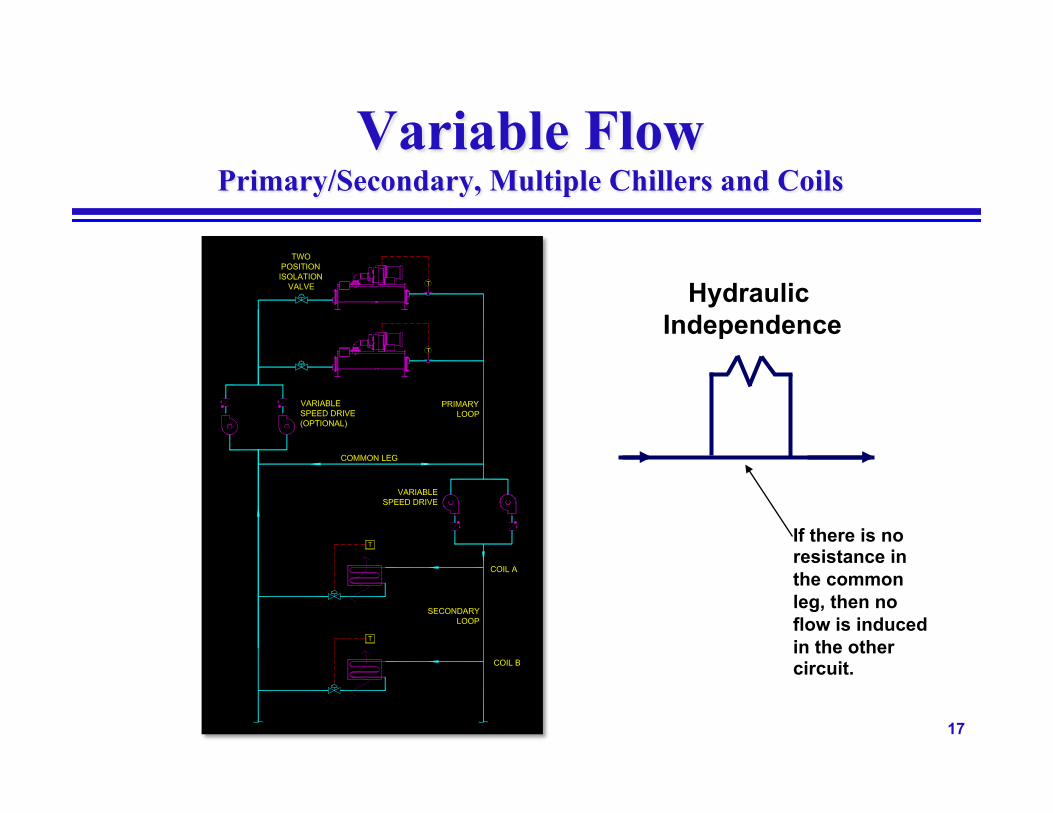
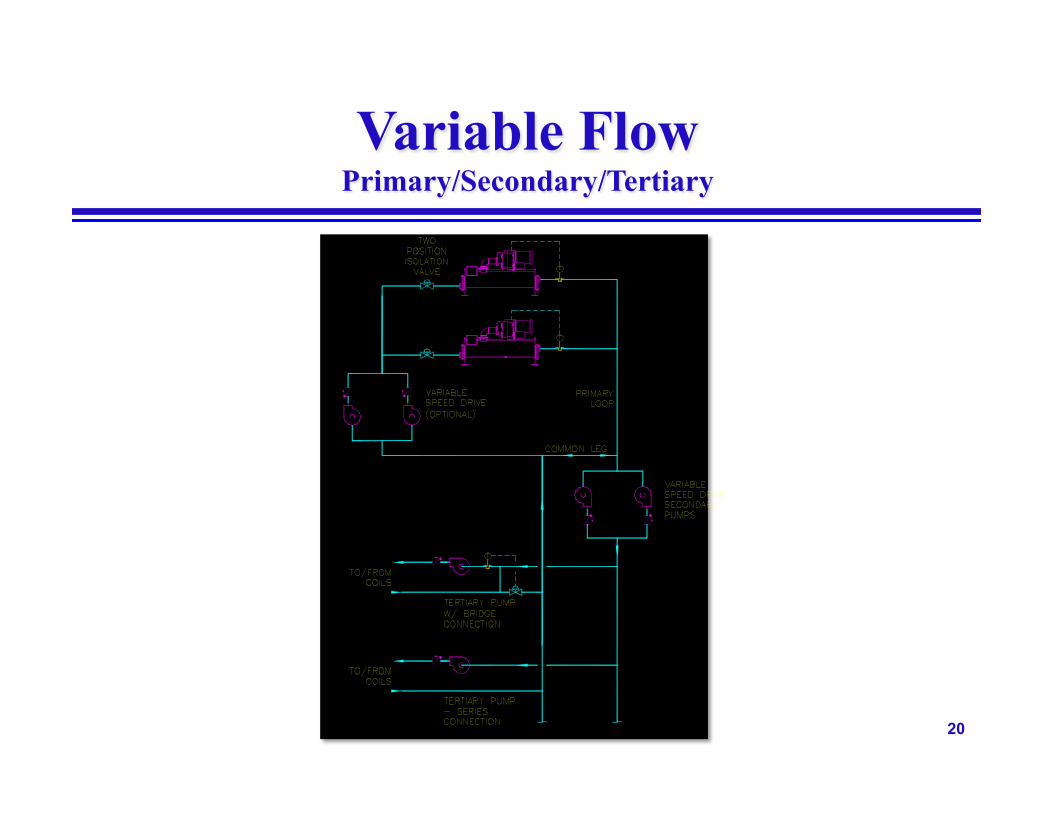
Variable Flow Primary/Secondary, Multiple Chillers and Coils
If there is no resistance in the common leg, then no flow is induced in the other circuit.
Hydraulic Independence
18
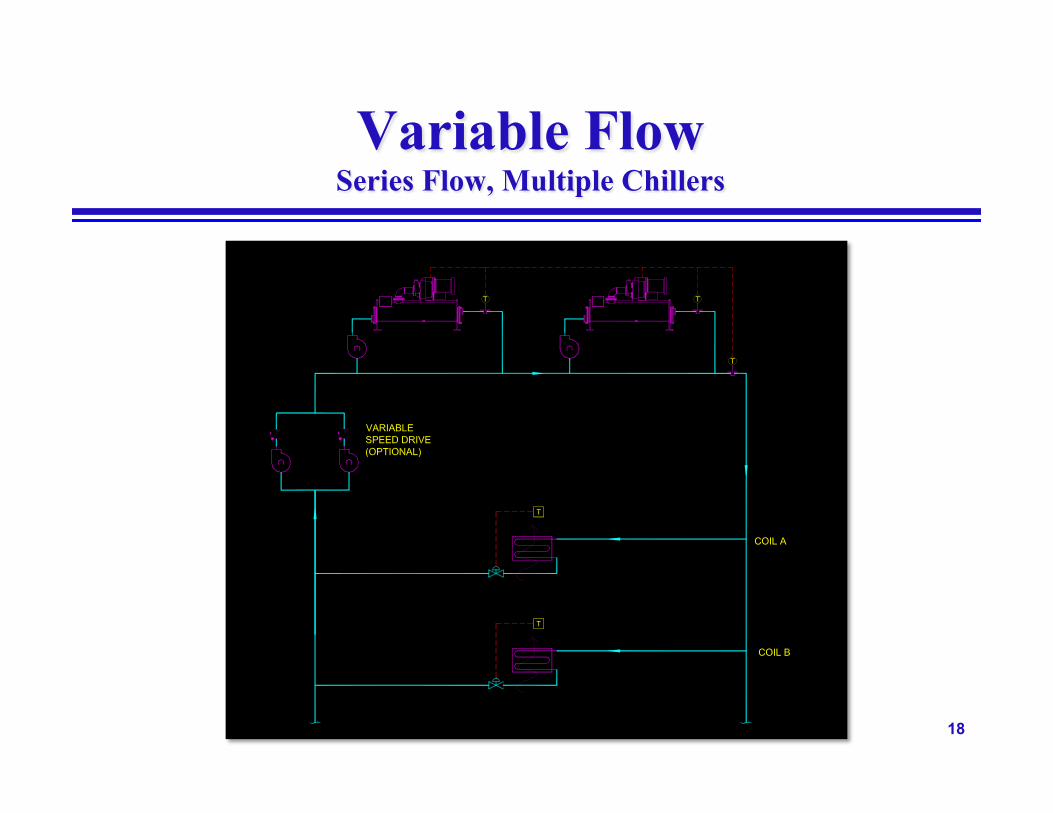
Variable Flow Series Flow, Multiple Chillers
19
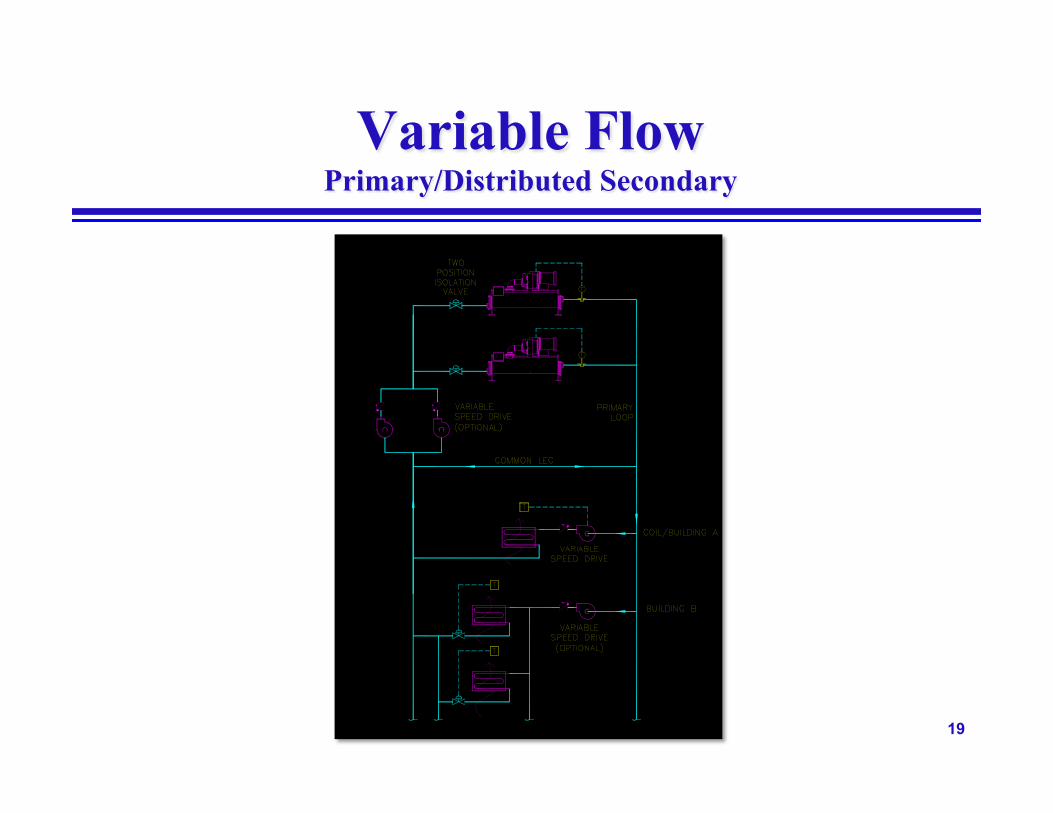
Variable Flow Primary/Distributed Secondary
20
Variable Flow Primary/Secondary/Tertiary
21
Variable Flow Chilled Water Systems
New Paradigm • Modern controls are robust and very
responsive to both flow and temperature variations
• Variable flow OK within range and rate-of-change spec’d by chiller manufacturer

22
Variable Flow Primary-only, Multiple Chillers

23
Variable Flow Primary, Bypass Valve
Location • Near chillers
Best for energy Controls less expensive Control more difficult to
tune – fast response • Remote
Smaller pressure fluctuations (easier to control)
Keeps loop cold for fast response
Sizing • Sizing critical when at
chillers/pumps • Different size if pump has
VFD or not
Flow measurement • Flow meter
Most accurate Needed for Btu calc for
staging • DP across chiller
Less expensive Accuracy reduced as tubes
foul One required for each chiller

24
Primary CHW Pump Options
Dedicated Pumping Advantages: • Less control complexity • Custom pump heads w/ unmatched chillers • Usually less expensive if each pump is adjacent to chiller served • Pump failure during operation does not cause multiple chiller trips
Headered Pumping Advantages: • Better redundancy • Valves can “soft load” chillers with primary-only systems • Easier to incorporate stand-by pump
25
Balancing Variable Flow Systems
26
Balancing Issues
Ensure “adequate” flow available at all coils to meet loads • Less than design flow may be “adequate” most of the
time Ensure differential pressure across control valves
is not so high as to cause erratic control • “Two-positioning” • Unstable control at low loads
Cost considerations • First costs (installed costs and start-up costs) • Pump energy costs (peak demand and annual) • Rebalancing costs (if any) as coils are added to system
27
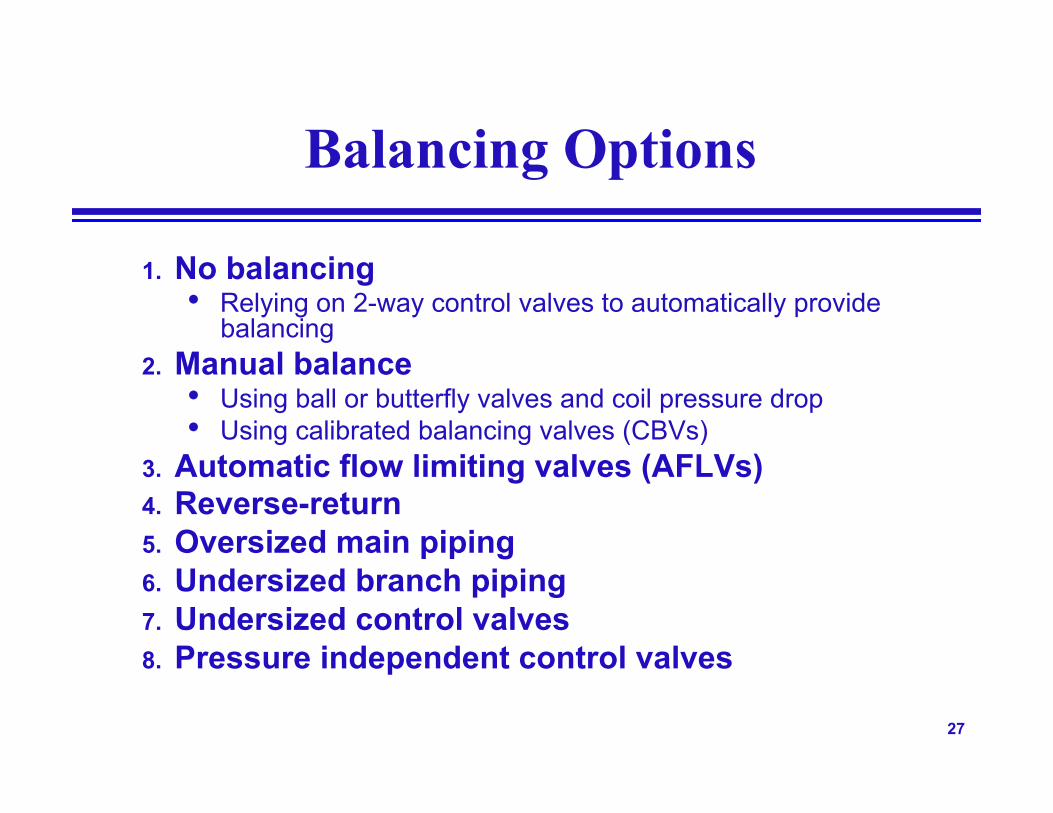
Balancing Options
1. No balancing • Relying on 2-way control valves to automatically provide
balancing 2. Manual balance
• Using ball or butterfly valves and coil pressure drop • Using calibrated balancing valves (CBVs)
3. Automatic flow limiting valves (AFLVs) 4. Reverse-return 5. Oversized main piping 6. Undersized branch piping 7. Undersized control valves 8. Pressure independent control valves
28
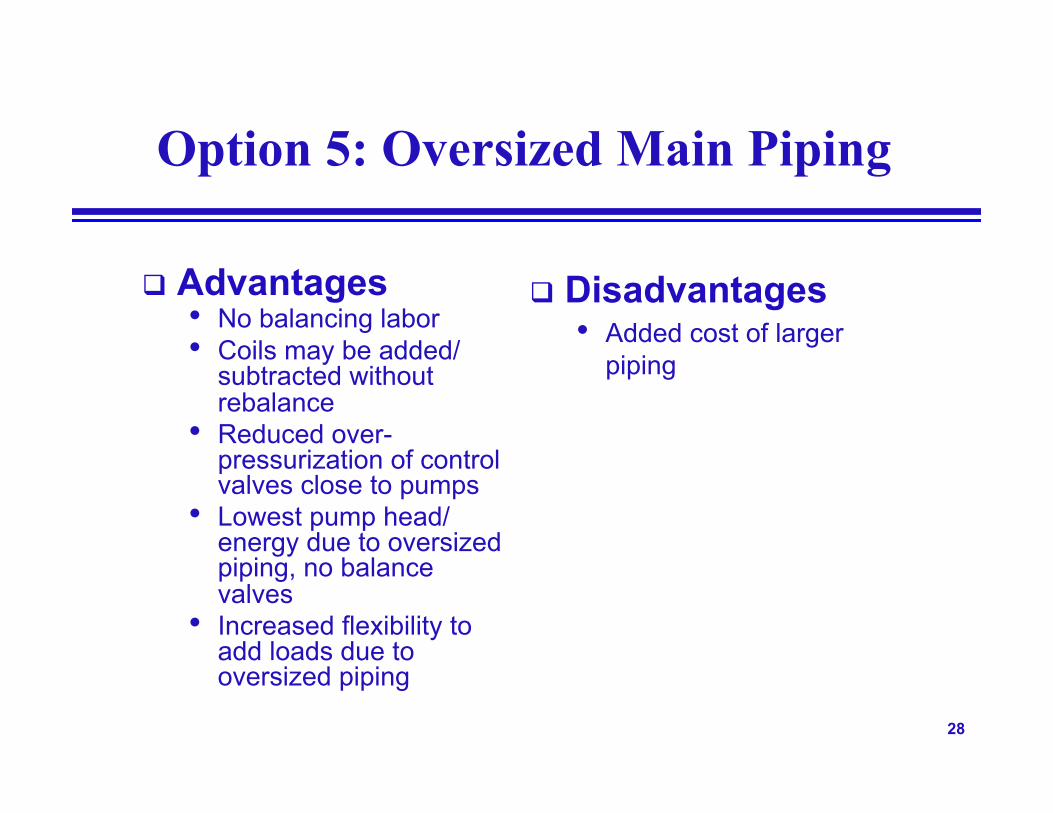
Option 5: Oversized Main Piping
Advantages • No balancing labor • Coils may be added/
subtracted without rebalance
• Reduced over-pressurization of control valves close to pumps
• Lowest pump head/energy due to oversized piping, no balance valves
• Increased flexibility to add loads due to oversized piping
Disadvantages • Added cost of larger
piping

29
Option 6: Undersized Branch Piping
Advantages • No balancing labor • Reduced cost of smaller
piping • Coils may be added/
subtracted without rebalance
• Reduced over-pressurization of control valves close to pumps where piping has been undersized
Disadvantages • Limited effectiveness and
applicability due to limited available pipe sizes
• High design and analysis cost to determine correct pipe sizing
• Reduced flexibility to add coils where piping has been undersized
• Coils may be starved if variable speed drives are used without DP reset
• Slightly higher pump energy depending on flow variations and pump controls

30
Option 7: Undersized Control Valves
Advantages • No balancing labor • Reduced cost of smaller
control valves • Coils may be added/
subtracted without rebalance
• Reduced over-pressurization of control valves close to pumps where control valves have been undersized
• Improved valve authority which could improve controllability where control valves have been undersized
Disadvantages • Limited effectiveness and
applicability due to limited available control valve sizes (Cv)
• High design and analysis cost to determine correct control valve sizing
• Coils may be starved if variable speed drives are without DP reset
• Slightly higher pump energy depending on flow variations and pump controls
31
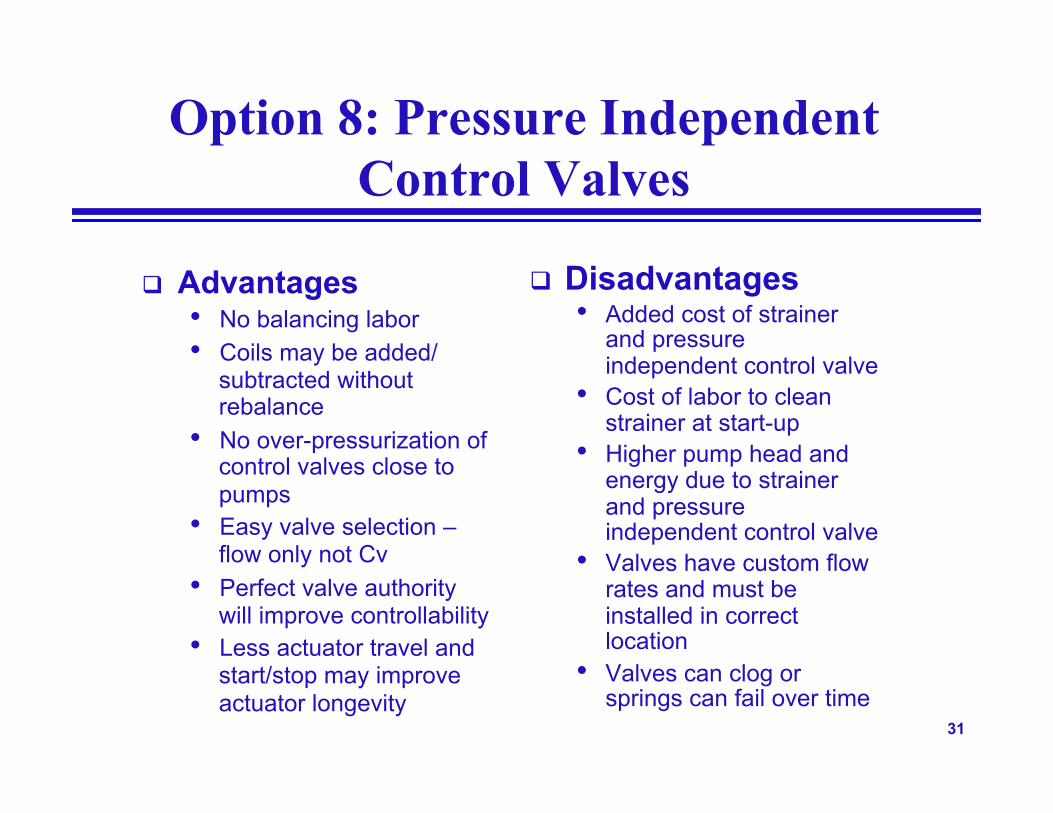
Option 8: Pressure Independent Control Valves
Advantages • No balancing labor • Coils may be added/
subtracted without rebalance
• No over-pressurization of control valves close to pumps
• Easy valve selection – flow only not Cv
• Perfect valve authority will improve controllability
• Less actuator travel and start/stop may improve actuator longevity
Disadvantages • Added cost of strainer
and pressure independent control valve
• Cost of labor to clean strainer at start-up
• Higher pump head and energy due to strainer and pressure independent control valve
• Valves have custom flow rates and must be installed in correct location
• Valves can clog or springs can fail over time
32
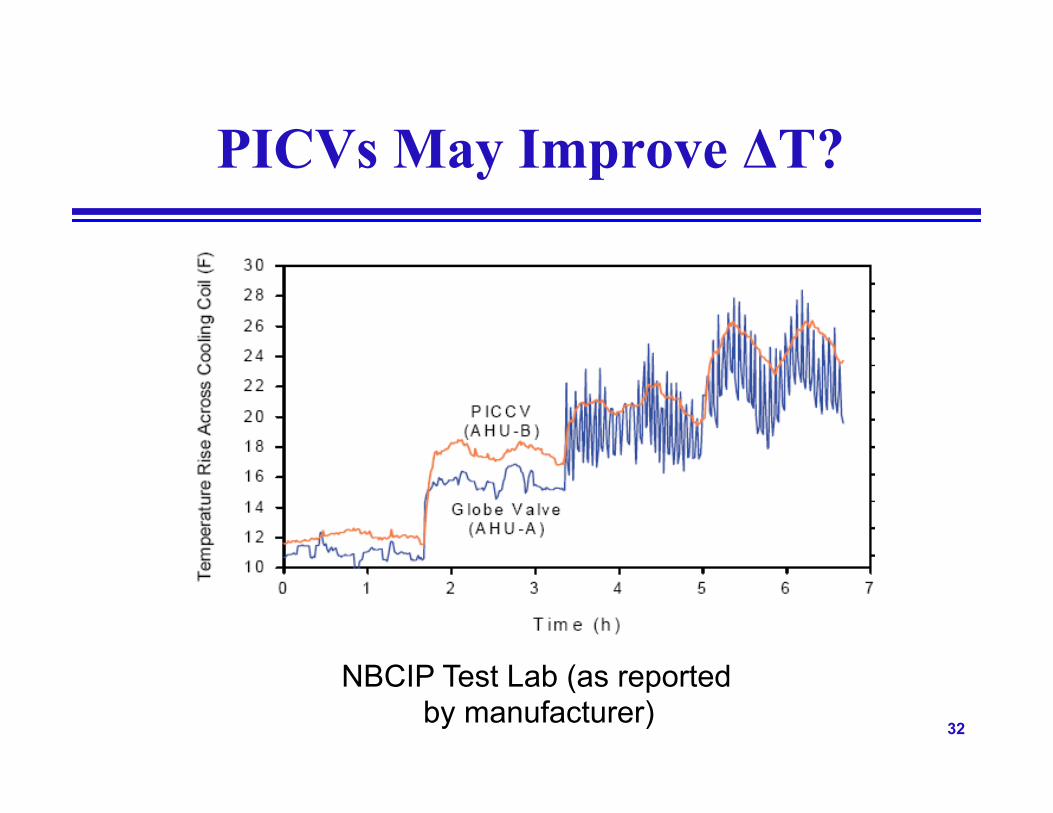
PICVs May Improve ΔT?
NBCIP Test Lab (as reported by manufacturer)
33
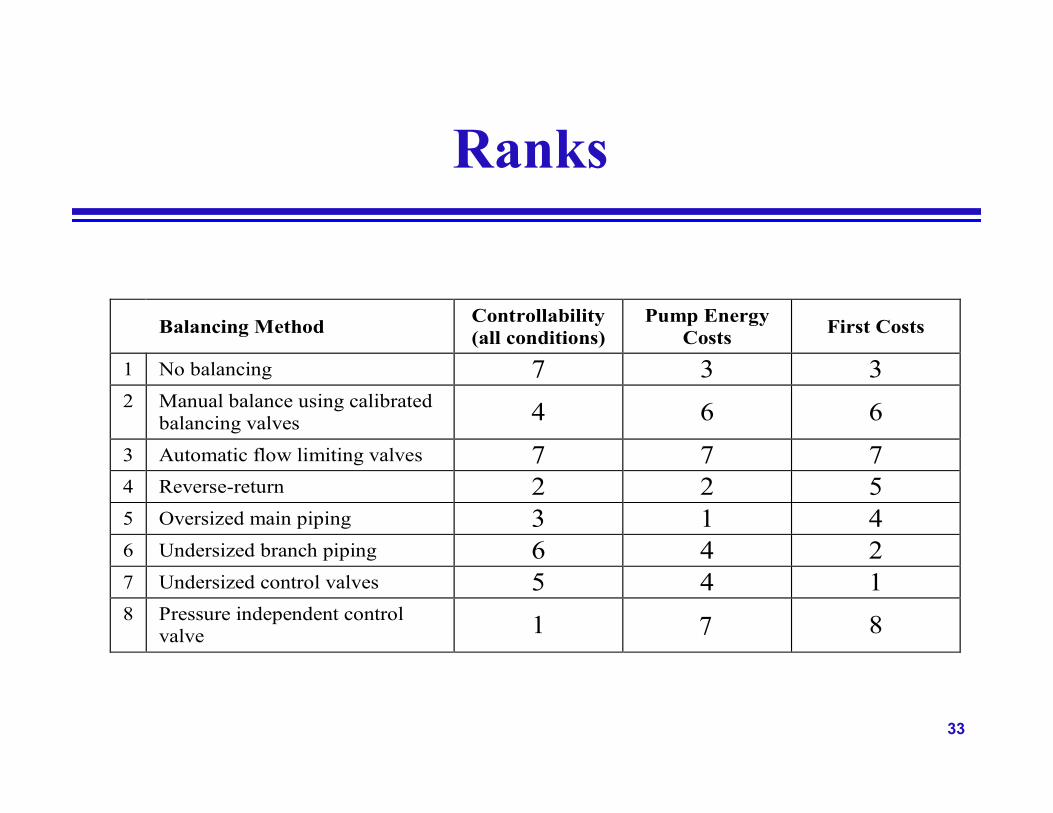
Ranks
Balancing Method Controllability (all conditions)
Pump Energy Costs First Costs
1 No balancing 7 3 3 2 Manual balance using calibrated
balancing valves 4 6 6 3 Automatic flow limiting valves 7 7 7 4 Reverse-return 2 2 5 5 Oversized main piping 3 1 4 6 Undersized branch piping 6 4 2 7 Undersized control valves 5 4 1 8 Pressure independent control
valve 1 8 8
7

34
Conclusions & Recommendations for Variable Flow Hydronic Systems
Automatic flow-limiting valves and calibrated balancing valves are not recommended on any variable flow system • Few advantages and high first costs and energy costs
Reverse-return and oversized mains may have reasonable pump energy savings payback on 24/7 chilled water systems
Undersizing piping and valves near pumps improves balance and costs are reduced, but significant added engineering time required
Pressure independent valves should be considered on very large systems for coils near pumps • Cost is high but going down now with competition • When costs are competitive, this may be best choice for all jobs
For other than very large distribution systems, option 1 (no balancing) appears to be a reasonable option to consider • Low first costs with minimal or insignificant operational problems

35
Problems Caused by Degrading ∆T
For a given load Q, when ΔT goes down, GPM goes up
Q= 500 X GPM X ΔT
Result: • Increases pump energy • Can require more chillers to run at low load, or coils will be
starved of flow • Can result in reduced plant effective capacity: chiller capacity
without the capability of delivering it
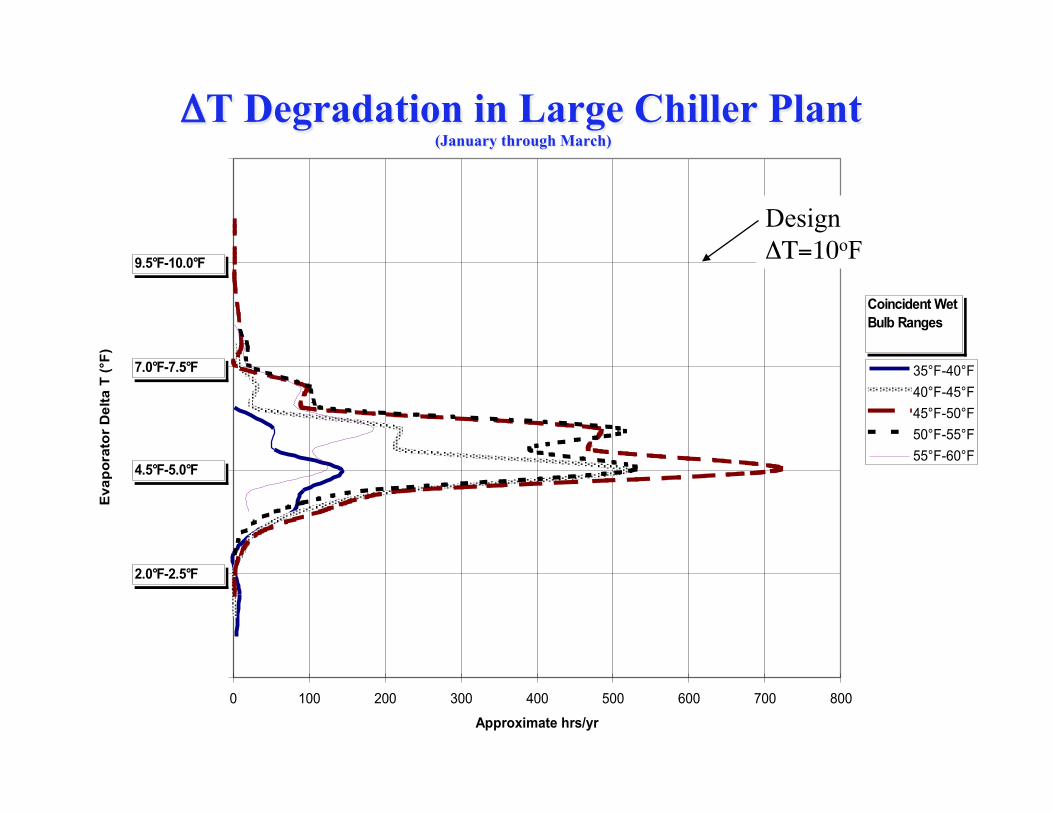
ΔT Degradation in Large Chiller Plant (January through March)
0 100 200 300 400 500 600 700 800
Approximate hrs/yr
Eva
pora
tor
Del
ta T
(°F)
35°F-40°F40°F-45°F45°F-50°F50°F-55°F55°F-60°F
2.0°F-2.5°F
4.5°F-5.0°F
7.0°F-7.5°F
9.5°F-10.0°F
Coincident Wet Bulb Ranges
Design ΔΤ=10oF
37
∆T Conclusions
Design, construction, and operation errors that cause low ΔT can and should be avoided
But other causes for low ΔT can never be eliminated
Conclusion: At least some ΔT degradation is inevitable
Therefore: Design the CHW Plant to allow for efficient chiller staging despite degrading ΔT

38
Some Solutions
Design CHW distribution system so chillers can have increased flow so they can be more fully loaded at low ΔT • Primary-only pumping • Unequal chiller and primary pump sizes, headered
pumps so large pump can serve small chiller • Low design delta-T in primary loop
Insures low ΔT in secondary Higher primary loop first costs & energy costs
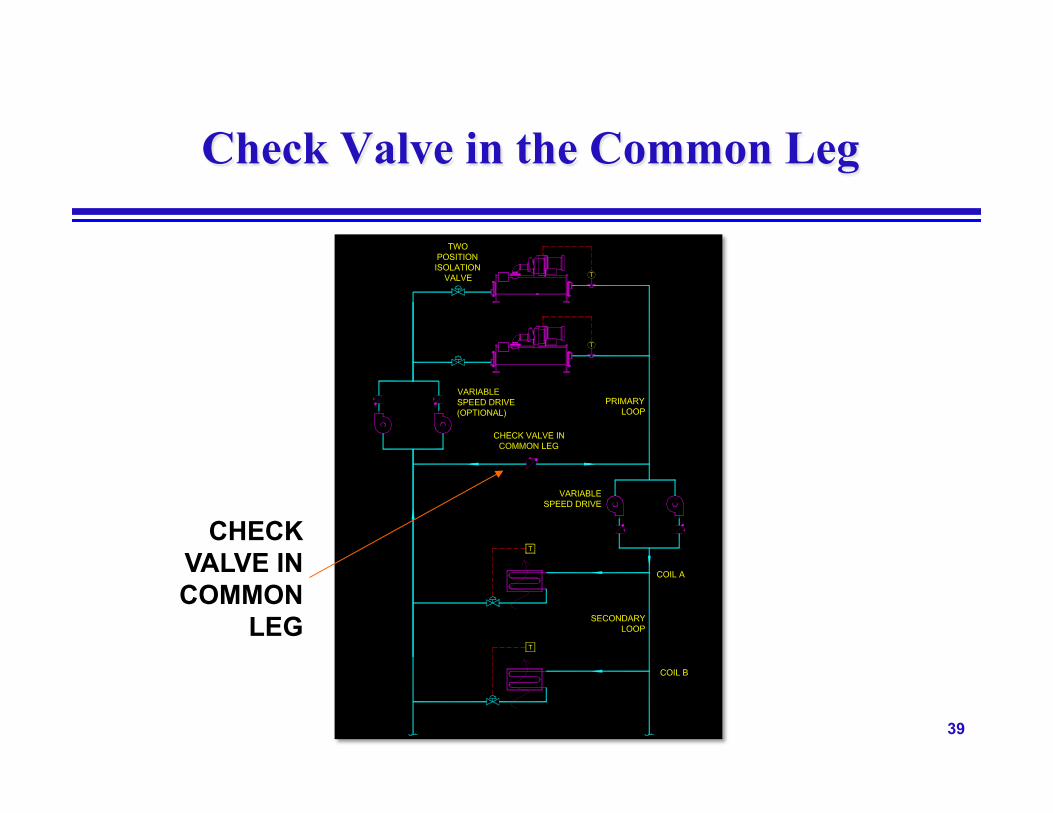
• Primary/secondary pumping with check valve in common leg
39
Check Valve in the Common Leg
CHECK VALVE IN COMMON
LEG
40
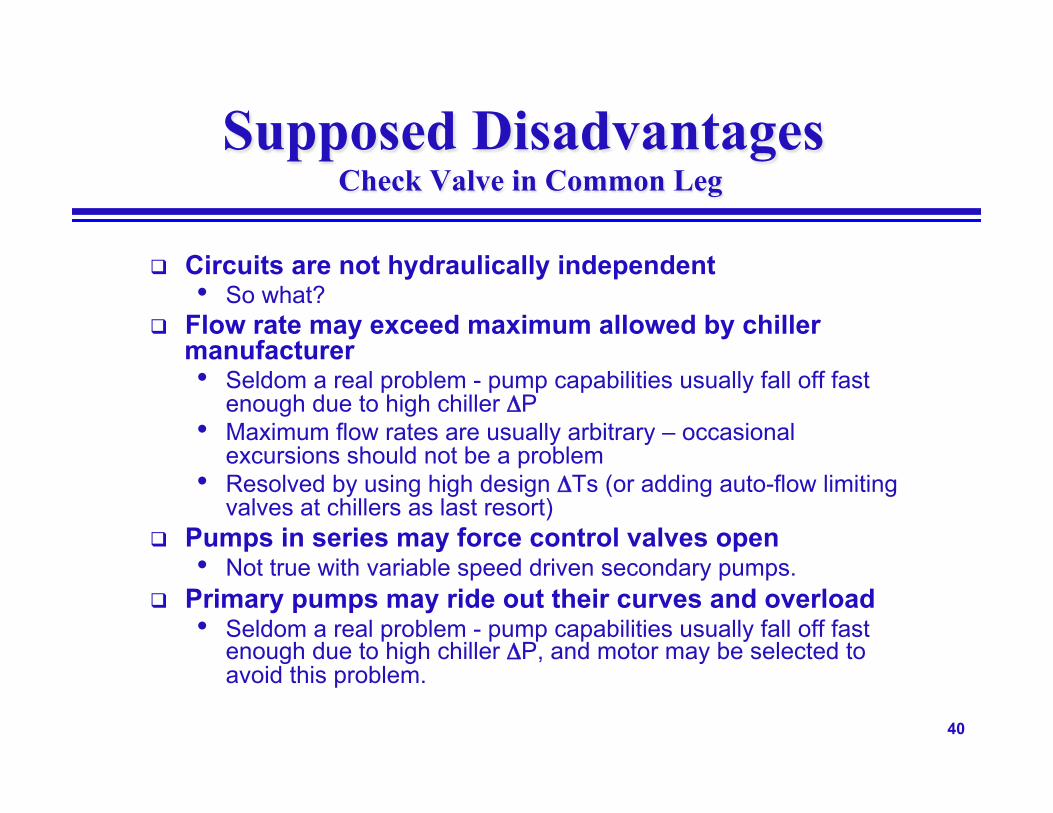
Supposed Disadvantages Check Valve in Common Leg
Circuits are not hydraulically independent • So what?
Flow rate may exceed maximum allowed by chiller manufacturer • Seldom a real problem - pump capabilities usually fall off fast
enough due to high chiller ΔP • Maximum flow rates are usually arbitrary – occasional
excursions should not be a problem • Resolved by using high design ΔTs (or adding auto-flow limiting
valves at chillers as last resort) Pumps in series may force control valves open
• Not true with variable speed driven secondary pumps. Primary pumps may ride out their curves and overload
• Seldom a real problem - pump capabilities usually fall off fast enough due to high chiller ΔP, and motor may be selected to avoid this problem.
41
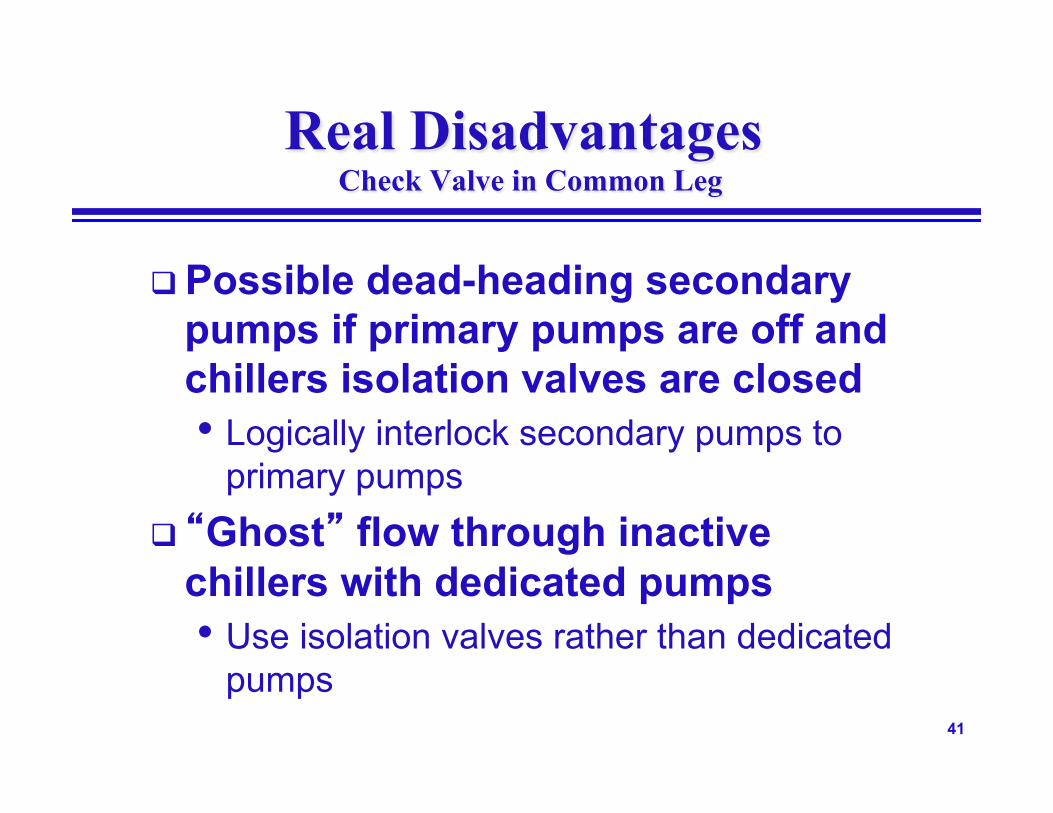
Real Disadvantages Check Valve in Common Leg
Possible dead-heading secondary pumps if primary pumps are off and chillers isolation valves are closed • Logically interlock secondary pumps to
primary pumps “Ghost” flow through inactive
chillers with dedicated pumps • Use isolation valves rather than dedicated
pumps

42
Check Valve in the Common Leg
Recommendation • For fixed speed chillers with ∆T problems, a check
valve in the common leg can help. Make sure pump design/controls address secondary pump dead-heading and ghost-flow issues. Select a check valve with low pressure drop (i.e. swing check, not spring)
• For variable speed chillers, do not put check valve in common leg. It has little value (unless ΔT degradation is severe) since chiller plant will not be inefficient by staging chillers on before they are fully loaded
43
Condenser Water Distribution Systems
44
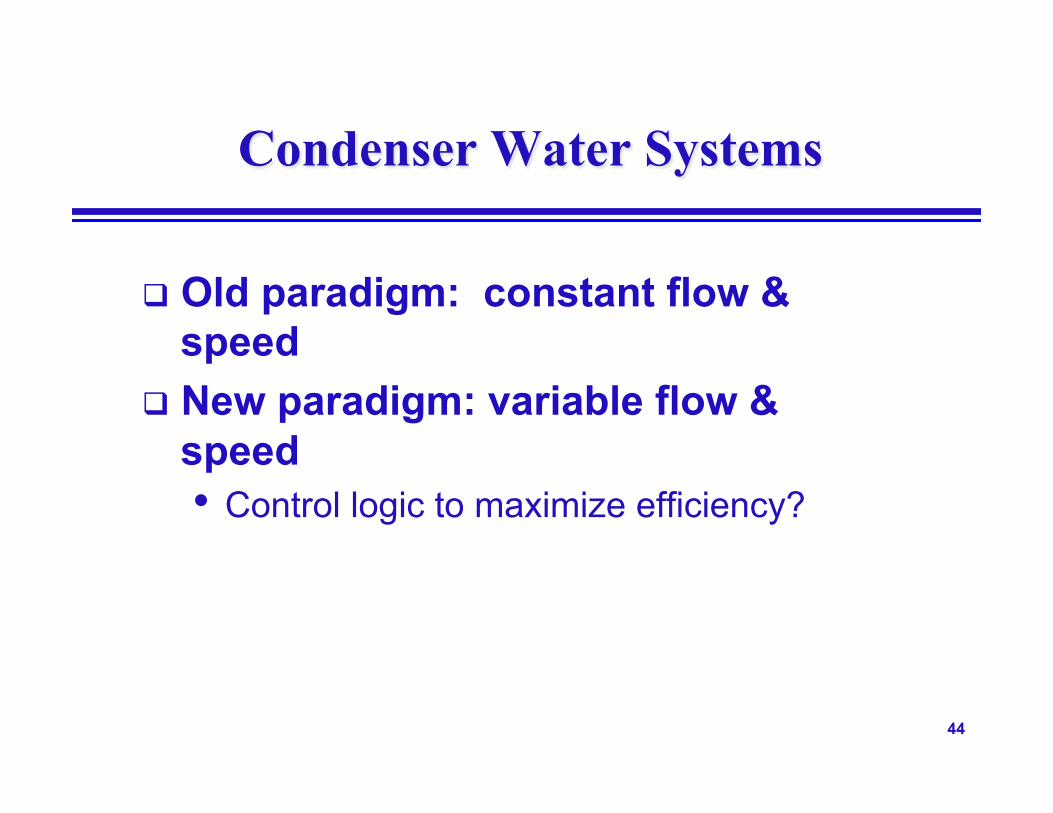
Condenser Water Systems
Old paradigm: constant flow & speed
New paradigm: variable flow & speed • Control logic to maximize efficiency?
45
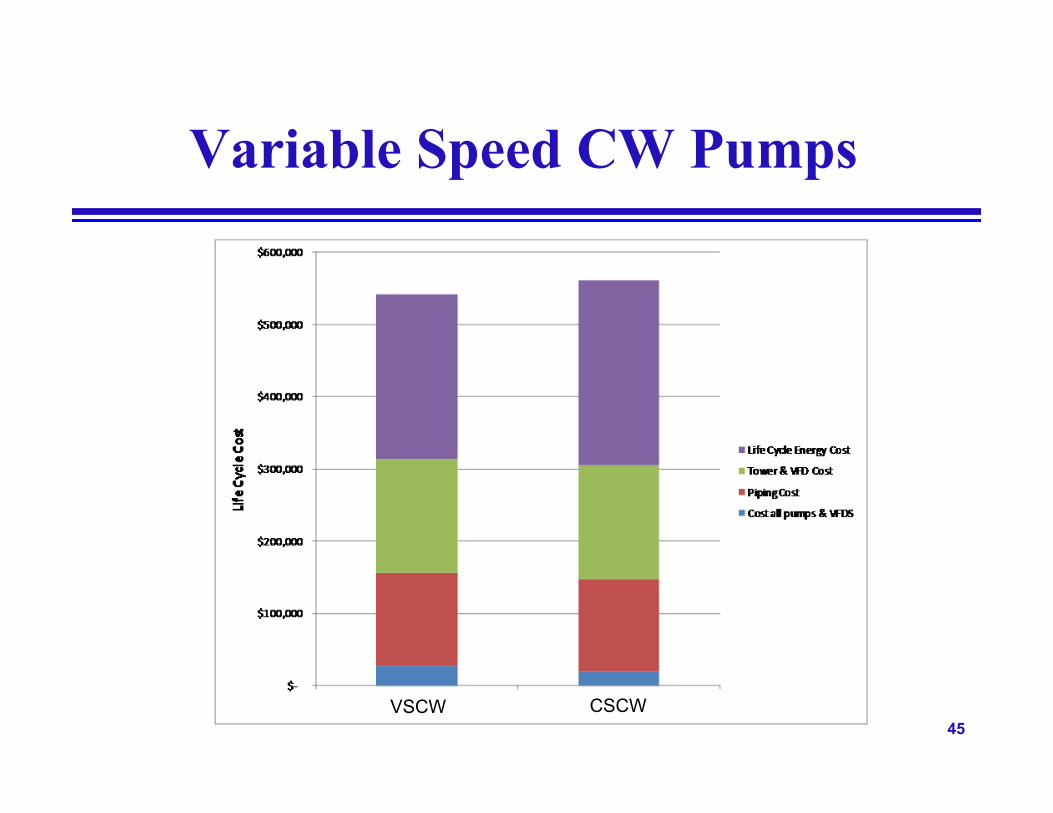
Variable Speed CW Pumps
VSCW CSCW

46
Condenser Water Pump Options
Dedicated Pumping Advantages: • Less control complexity • Custom pump heads w/ unmatched chillers • Usually less expensive if each pump is adjacent to chiller served and head pressure control not required
Headered Pumping Advantages: • Better redundancy • Valves can double as head pressure control • Easier to incorporate stand-by pump • Can operate fewer CW pumps than chillers for fixed speed pumps
47
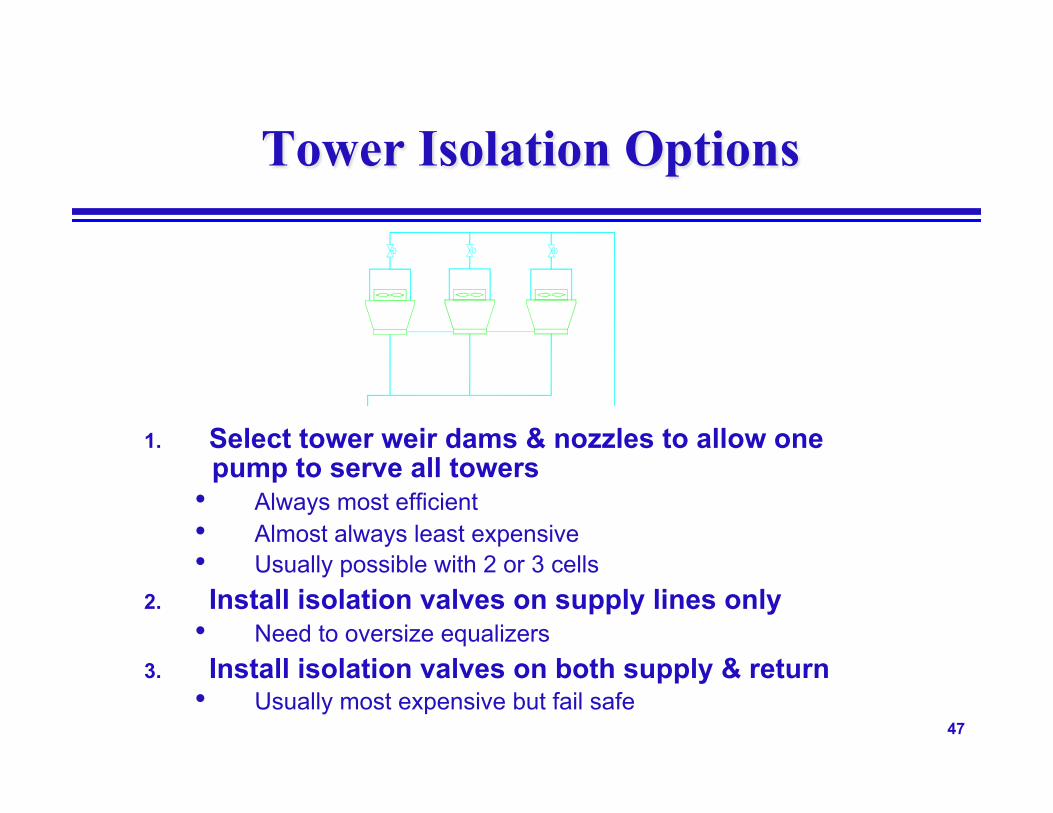
Tower Isolation Options
1. Select tower weir dams & nozzles to allow one pump to serve all towers
• Always most efficient • Almost always least expensive • Usually possible with 2 or 3 cells
2. Install isolation valves on supply lines only • Need to oversize equalizers
3. Install isolation valves on both supply & return • Usually most expensive but fail safe
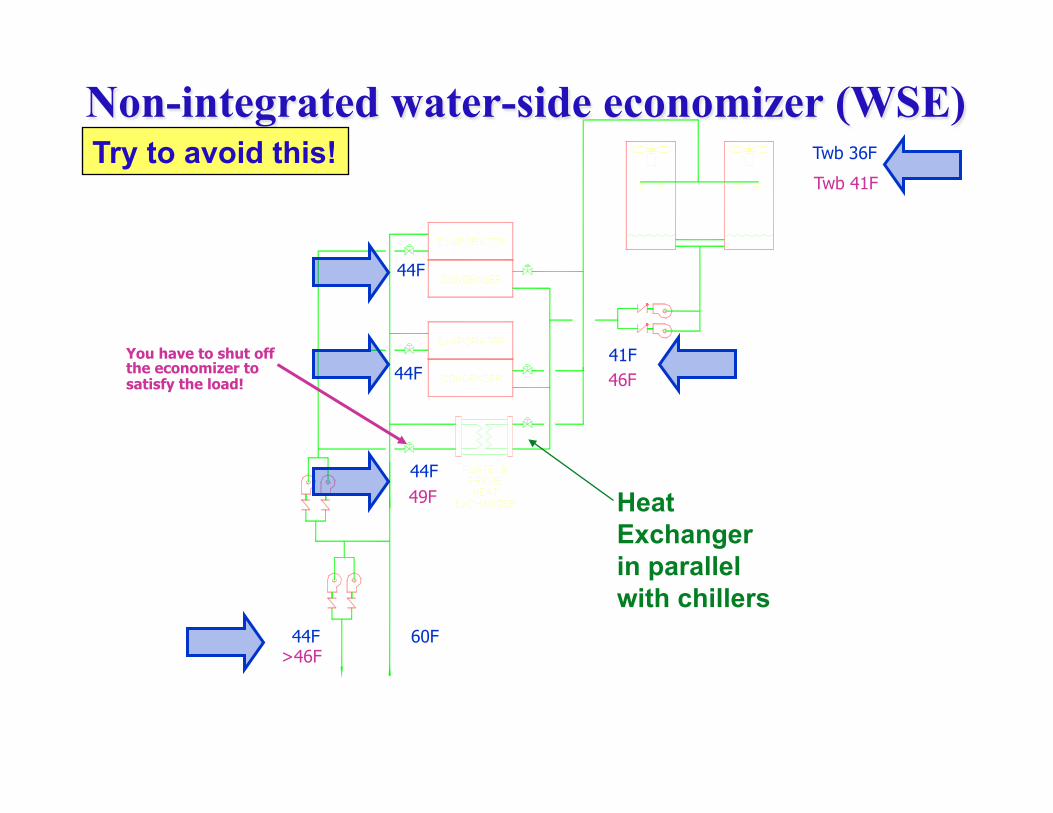
Non-integrated water-side economizer (WSE) Try to avoid this!
Heat Exchanger in parallel with chillers
44F 60F
44F
41F
Twb 36F
Twb 41F
46F
49F
44F
44F
>46F
You have to shut off the economizer to satisfy the load!
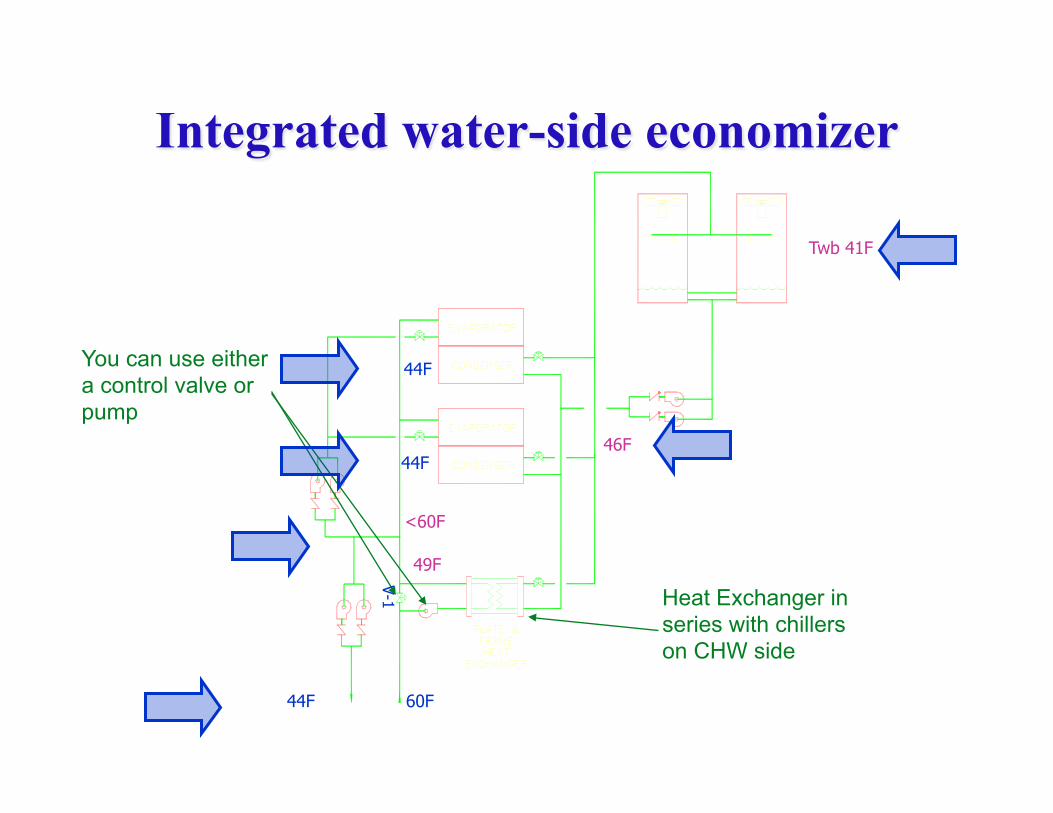
Heat Exchanger in series with chillers on CHW side
Integrated water-side economizer
You can use either a control valve or pump
44F 60F
Twb 41F
46F
49F
44F
44F
<60F
V-1
50
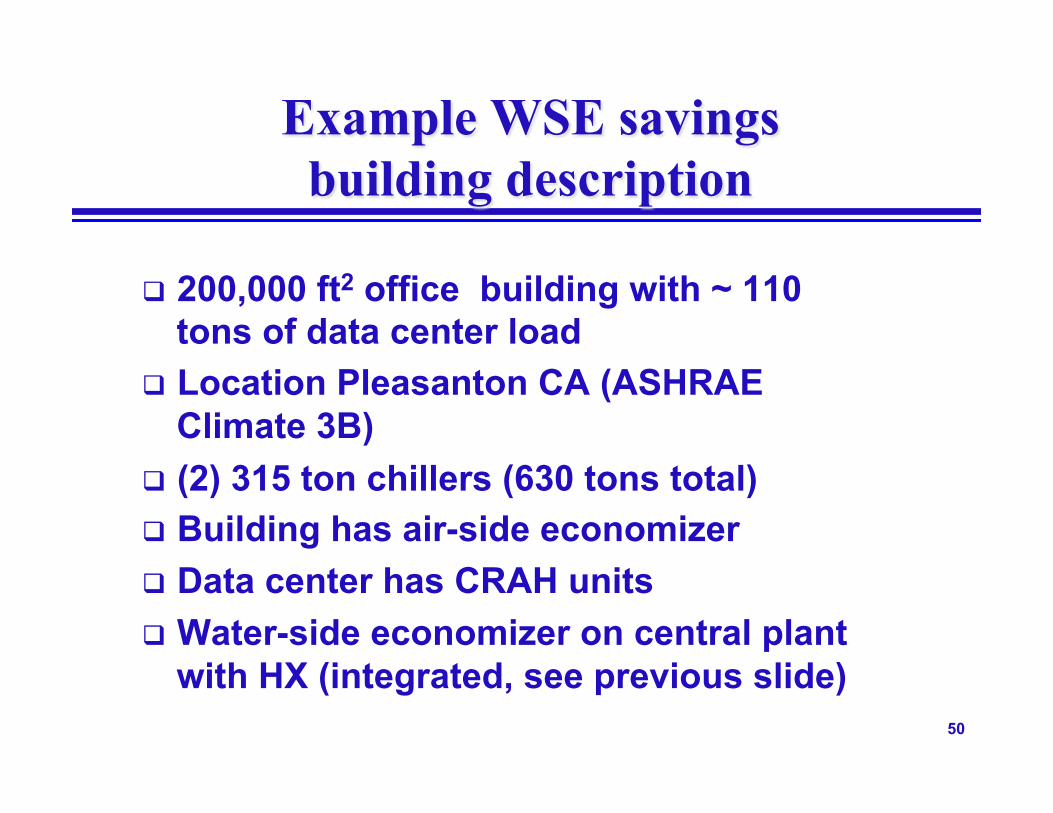
Example WSE savings building description
200,000 ft2 office building with ~ 110 tons of data center load
Location Pleasanton CA (ASHRAE Climate 3B)
(2) 315 ton chillers (630 tons total) Building has air-side economizer Data center has CRAH units Water-side economizer on central plant
with HX (integrated, see previous slide)
51
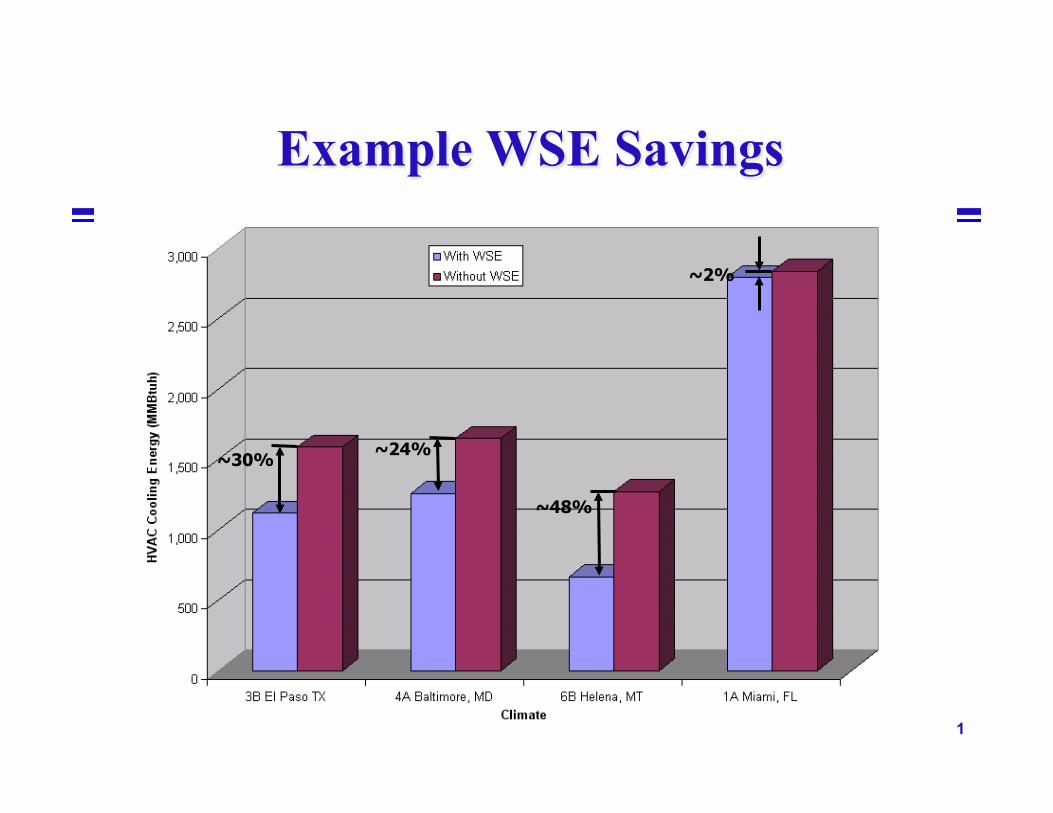
Example WSE Savings
~30% ~24%
~48%
~2%
Break

Design Procedure
54
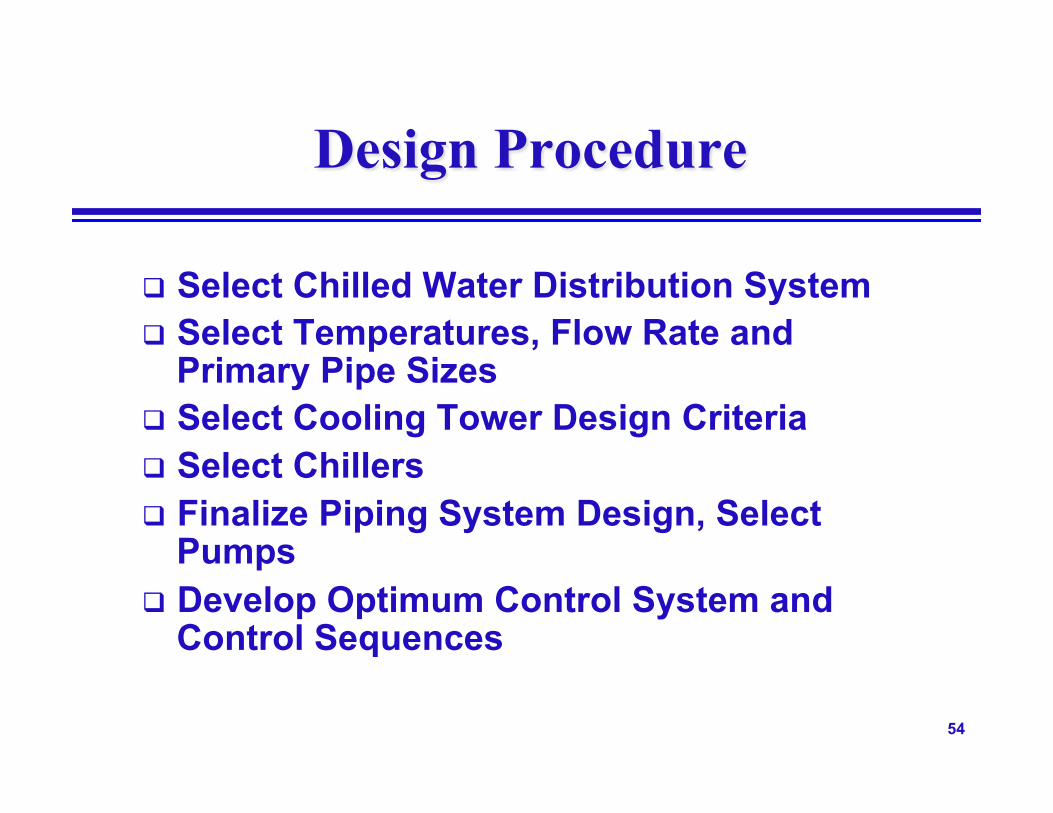
Design Procedure
Select Chilled Water Distribution System Select Temperatures, Flow Rate and
Primary Pipe Sizes Select Cooling Tower Design Criteria Select Chillers Finalize Piping System Design, Select
Pumps Develop Optimum Control System and
Control Sequences
55
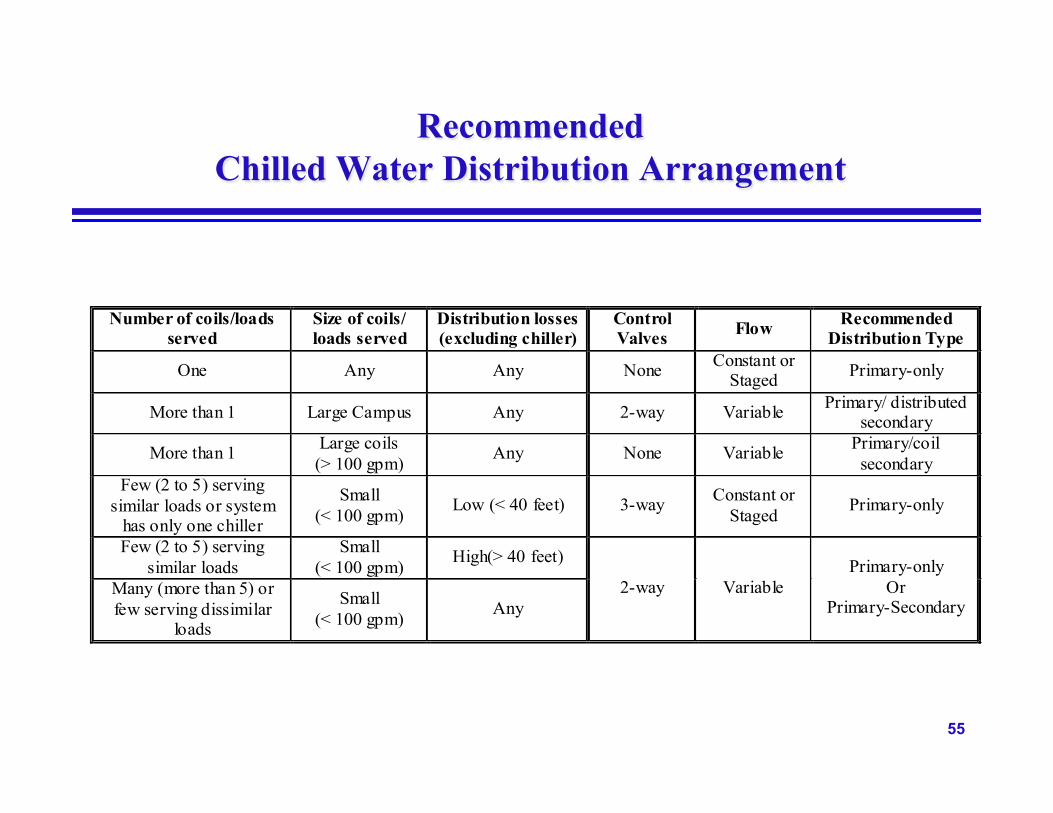
Recommended Chilled Water Distribution Arrangement
Number of coils/loads served
Size of coils/ loads served
Distribution losses (excluding chiller)
Control Valves Flow Recommended
Distribution Type
One Any Any None Constant or Staged Primary-only
More than 1 Large Campus Any 2-way Variable Primary/ distributed secondary
More than 1 Large coils (> 100 gpm) Any None Variable Primary/coil
secondary Few (2 to 5) serving
similar loads or system has only one chiller
Small (< 100 gpm) Low (< 40 feet) 3-way Constant or
Staged Primary-only
Few (2 to 5) serving similar loads
Small (< 100 gpm) High(> 40 feet)
Many (more than 5) or few serving dissimilar
loads
Small (< 100 gpm) Any
2-way Variable Primary-only
Or Primary-Secondary
56
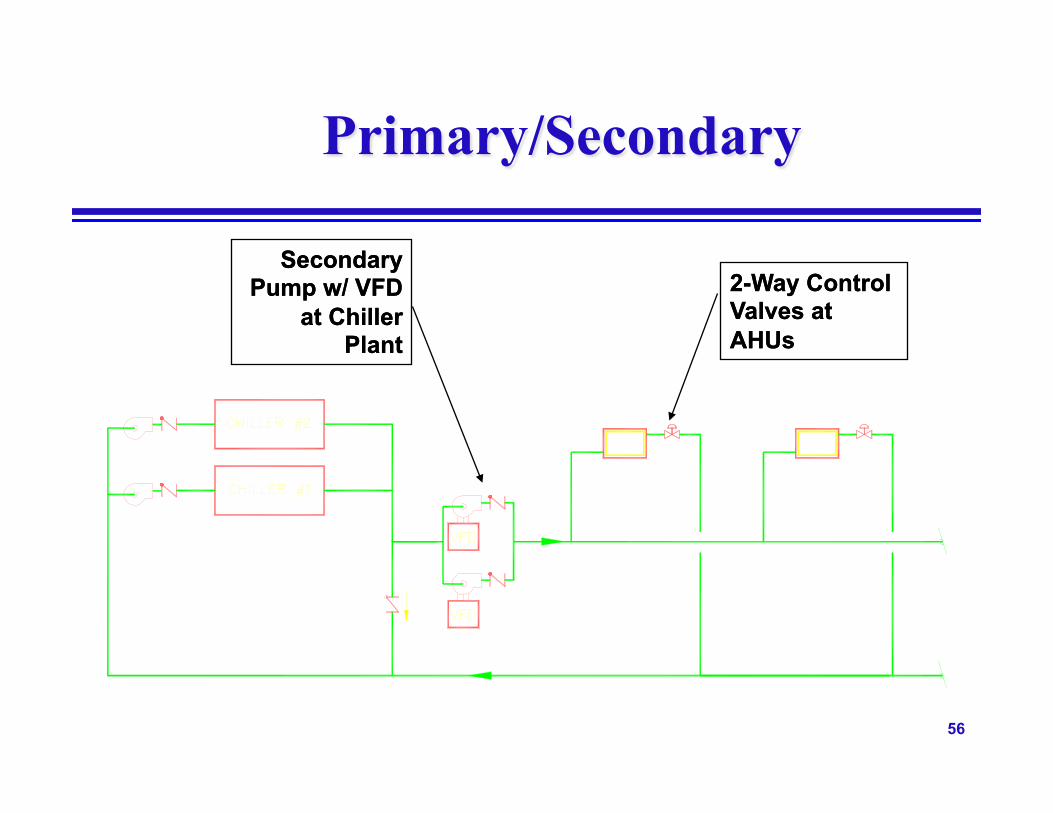
Primary/Secondary
Secondary Pump w/ VFD
at Chiller Plant
2-Way Control Valves at AHUs
Secondary Pump w/ VFD
at Chiller Plant
2-Way Control Valves at AHUs
57
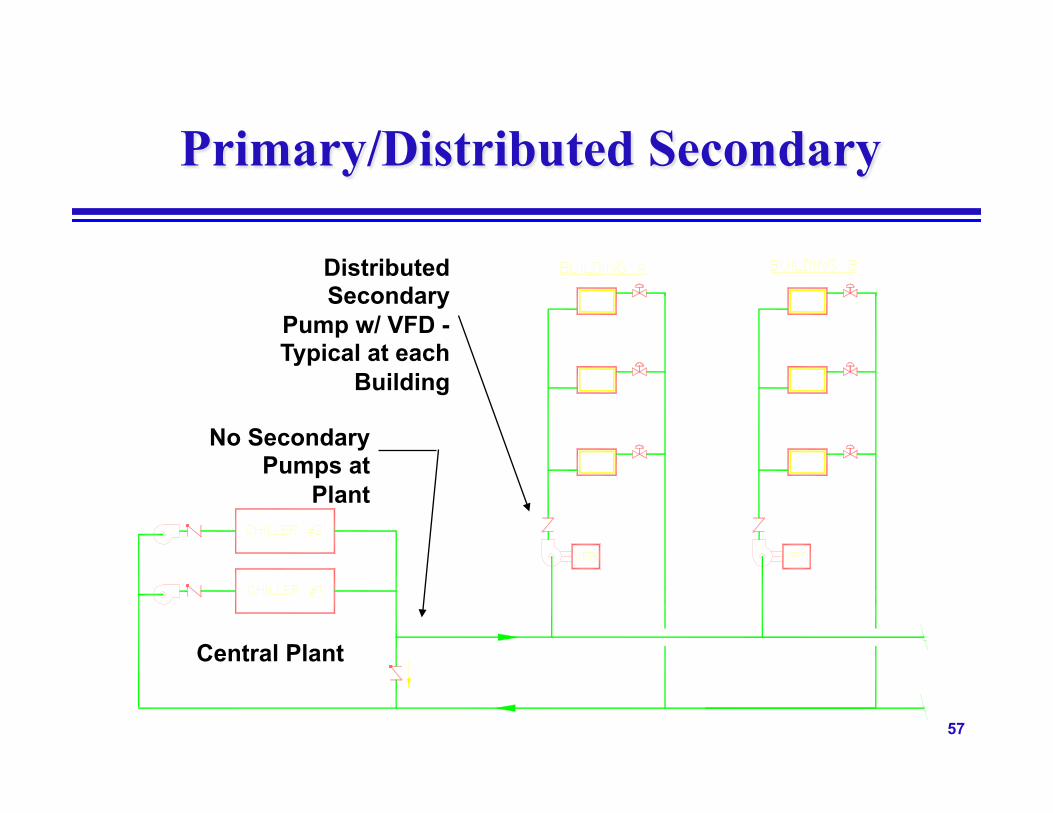
Primary/Distributed Secondary
Central Plant
Distributed Secondary
Pump w/ VFD - Typical at each
Building
No Secondary Pumps at
Plant
58
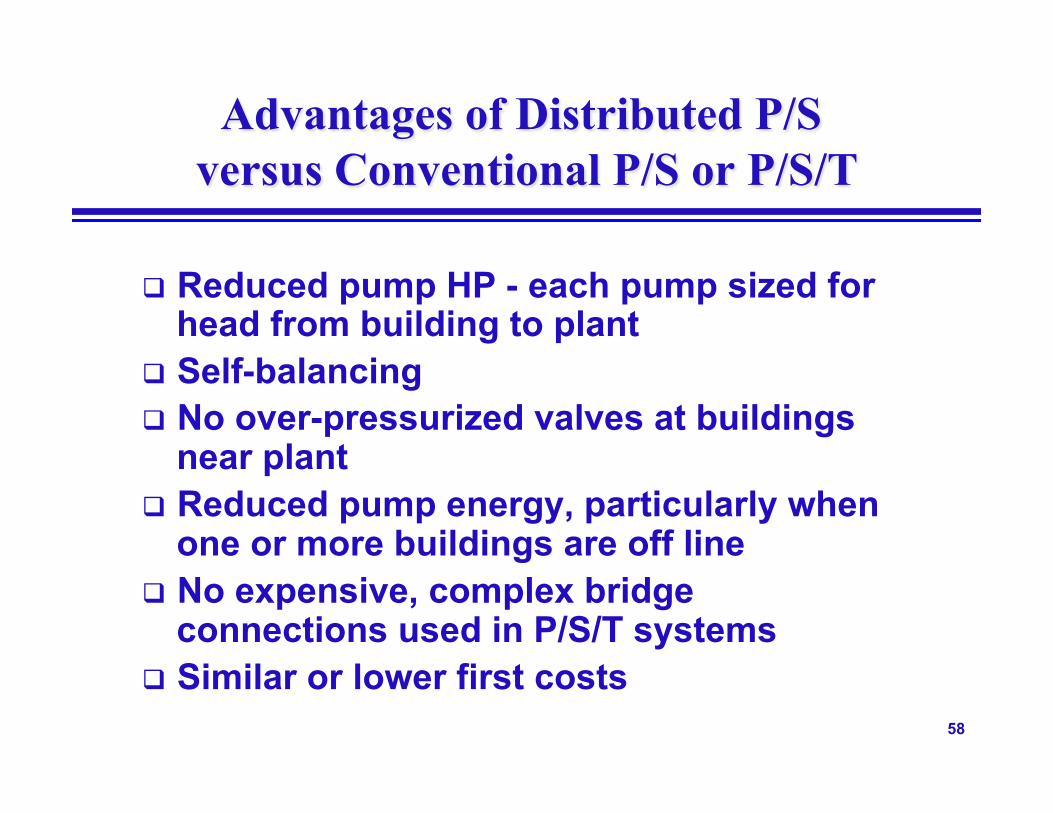
Advantages of Distributed P/S versus Conventional P/S or P/S/T
Reduced pump HP - each pump sized for head from building to plant
Self-balancing No over-pressurized valves at buildings
near plant Reduced pump energy, particularly when
one or more buildings are off line No expensive, complex bridge
connections used in P/S/T systems Similar or lower first costs
59
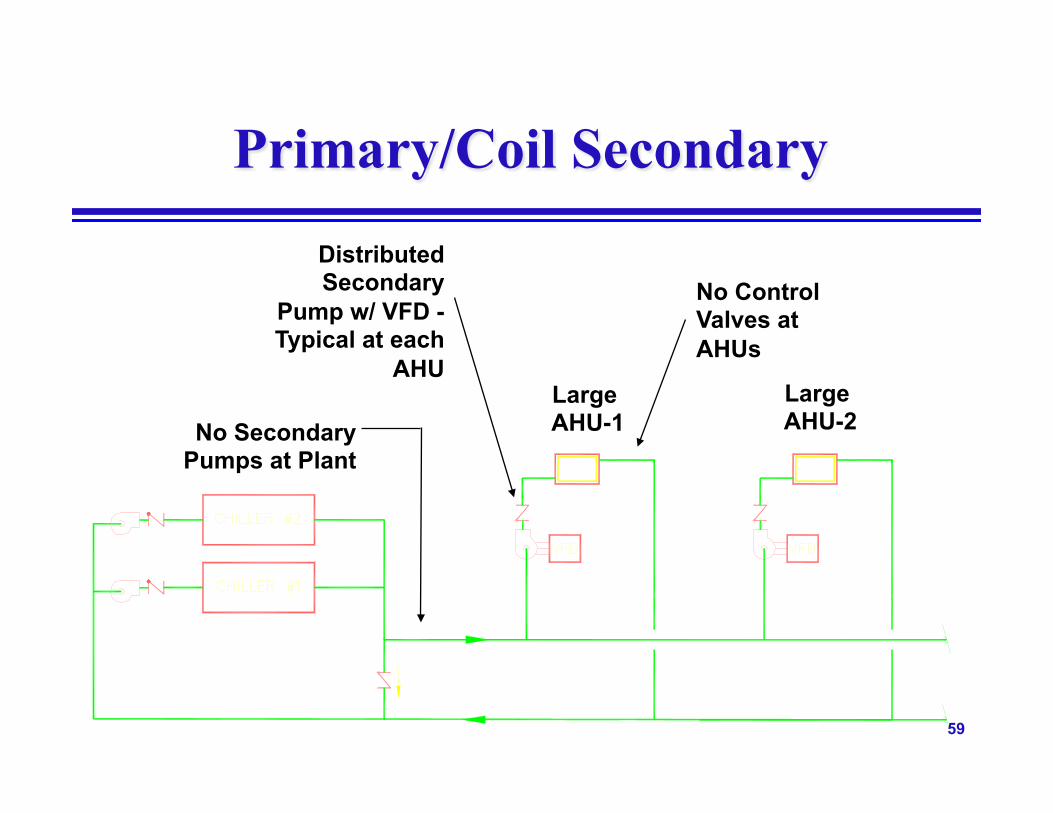
Primary/Coil Secondary
Large AHU-1
Distributed Secondary
Pump w/ VFD - Typical at each
AHU
No Secondary Pumps at Plant
Large AHU-2
No Control Valves at AHUs
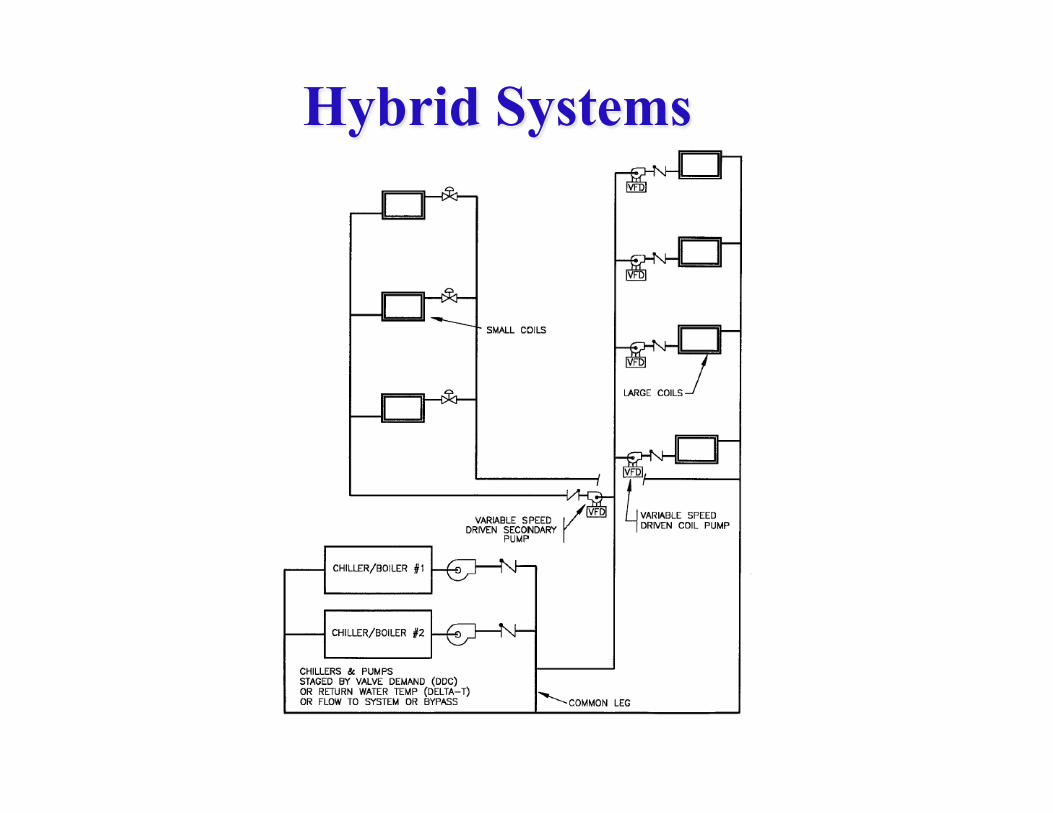
Hybrid Systems
61
Advantages of VFD Coil Pumps versus Conventional P/S system
Reduced pump HP • Each pump sized for head from coil to plant • Eliminated 10 feet or so for control valves
Self-balancing • No need for or advantages to balancing valves, reverse
return Lower pump energy
• No minimum DP setpoint • Pump efficiency constant
Better control • Smoother flow control - no valve hysteresis • No valve over-pressurization problems
Usually lower first costs due to eliminated control valves, reduced pump and VFD HP
62
Disadvantages of VFD Coil Pumps Versus Conventional P/S system
Cannot tap into distribution system without pump • May be problem with small coils (low flow, high
head pump) Possible reduced redundancy/reliability
unless duplex coil pumps are added Possible low load temperature
fluctuations • Minimum speed on pump motor • May need to cycle pump at very low loads

63
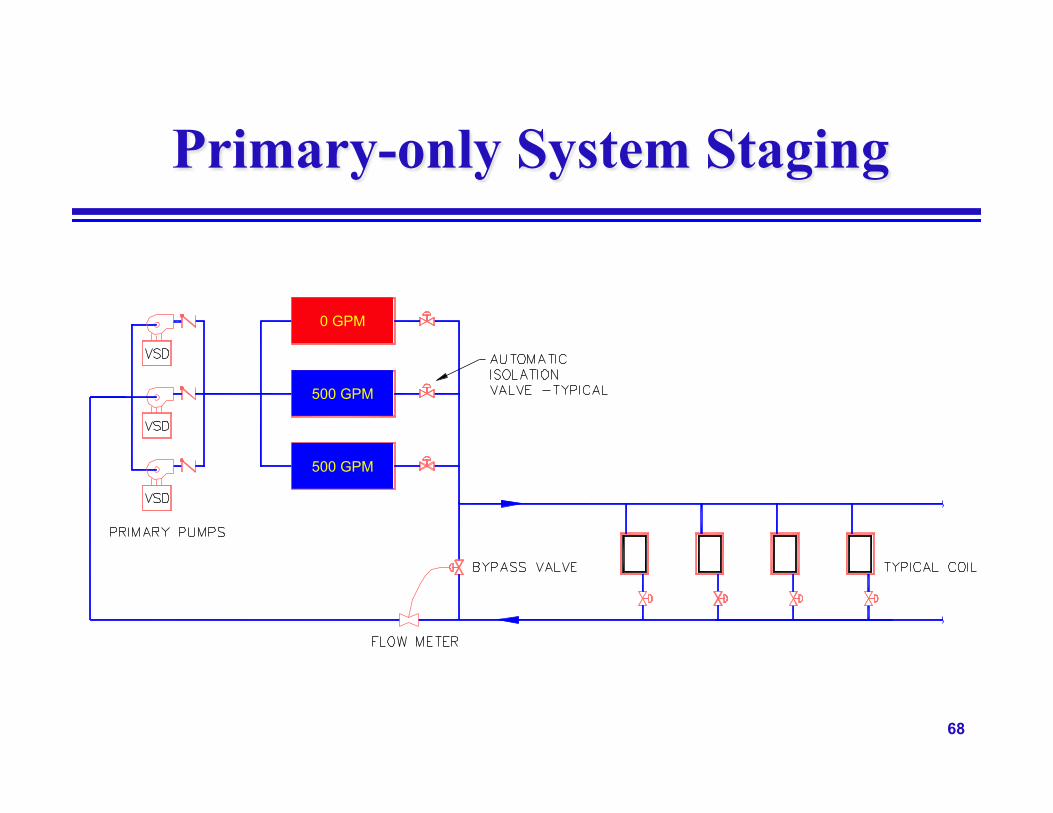
Primary-only System
BYPASS VALVE
Headered Pumps & Auto Isolation Valves Preferred to Dedicated Pumps: • Allows slow staging • Allows 1 pump/2 chiller operation • Allows 2 pump/1 chiller operation if there is low ΔT
Flow Meter or DP Sensor Across Chiller

64
Advantages of Primary-only Versus Primary/Secondary System
Lower first costs Less plant space required Reduced pump HP
Reduced pressure drop due to fewer pump connections, less piping
Higher efficiency pumps (unless more expensive reduced speed pumps used on primary side)
Lower pump energy Reduced connected HP “Cube Law” savings due to VFD and variable flow
through both primary and secondary circuit
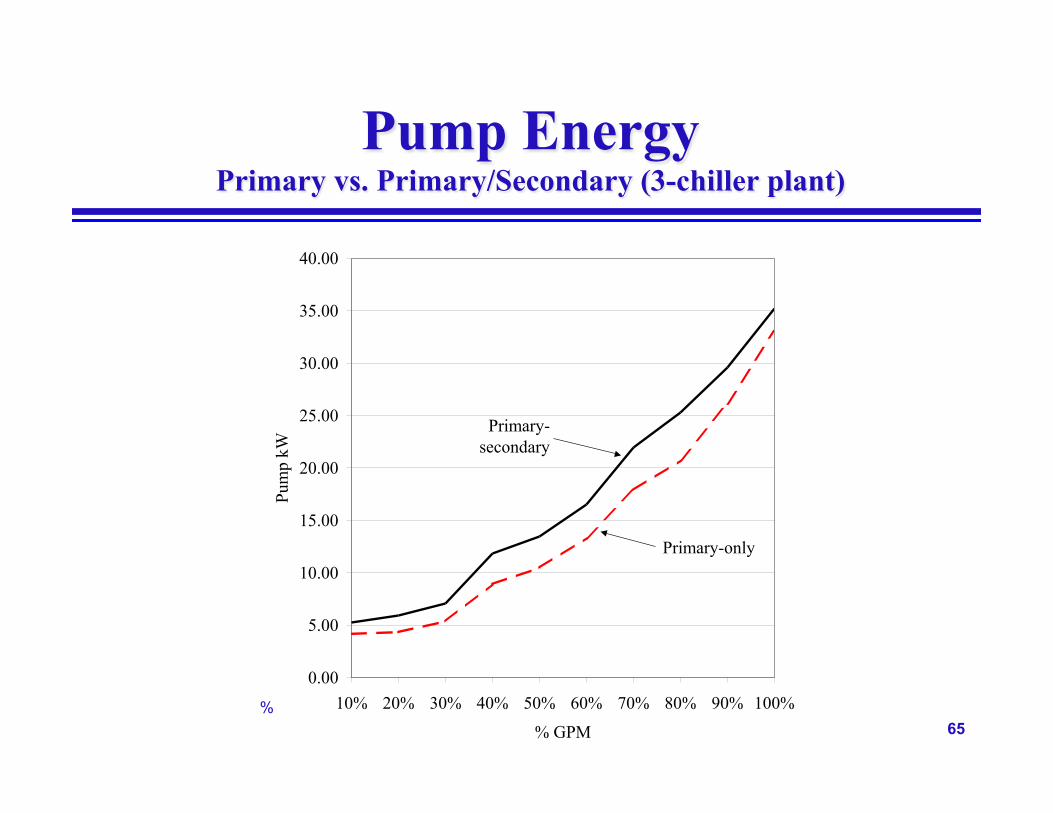
65
Pump Energy Primary vs. Primary/Secondary (3-chiller plant)
%
0.00
5.00
10.00
15.00
20.00
25.00
30.00
35.00
40.00
10% 20% 30% 40% 50% 60% 70% 80% 90% 100%
% GPM
Pum
p kW
Primary-only
Primary-secondary

66
Disadvantages of Primary-only Versus Primary/Secondary System
Failure of bypass control • Not as fail-safe - what if valve or controls fail? • Must avoid abrupt flow shut-off (e.g. valves interlocked
with AHUs all timed to stop at same time) • Must be well tuned to avoid chiller short-cycling
Flow fluctuation when staging chillers on • Flow drops through operating chillers • Possible chiller trips, even evaporator freeze-up • Must first reduce demand on operating chillers and/or
slowly increase flow through starting chiller; causes temporary high CHWS temperatures
(Problems above are seldom an issue with very large plants, e.g. more than 3 chillers)

67
Primary-only System Staging
1000 GPM
0 GPM
0 GPM
68
Primary-only System Staging
500 GPM
500 GPM
0 GPM

69
Variable Flow Primary/Secondary with CHW Storage
Advantages • Peak shaving • Simplifies chiller staging • Provides back-up for chiller
failure • Secondary water source for
fire department • Secondary water source for
cooling towers Disadvantages
• Installed cost • Space

70
Primary-only vs. Primary/Secondary
Use primary-only systems for: • Plants with many chillers (more than three) and with
fairly high base loads where the need for bypass is minimal or nil and flow fluctuations during staging are small due to the large number of chillers; and
• Plants where design engineers and future on-site operators understand the complexity of the controls and the need to maintain them.
Otherwise use primary-secondary • Also for plants with CHW storage
Pipe Sizing

72
Pipe Sizing
Need to balance • Cost of pipe and its installation • Cost of pump energy • Longevity of piping (erosion) • Noise • Sometimes space limitations
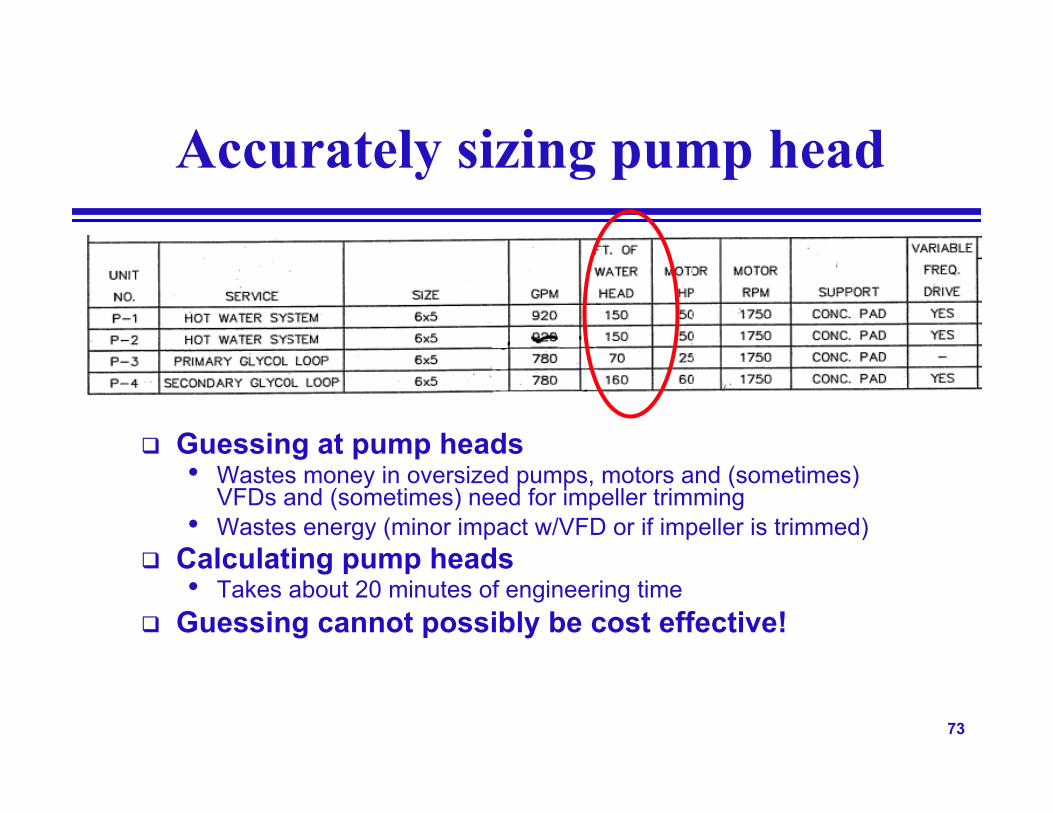
73
Accurately sizing pump head
Guessing at pump heads • Wastes money in oversized pumps, motors and (sometimes)
VFDs and (sometimes) need for impeller trimming • Wastes energy (minor impact w/VFD or if impeller is trimmed)
Calculating pump heads • Takes about 20 minutes of engineering time
Guessing cannot possibly be cost effective!

Optimum ΔT
75
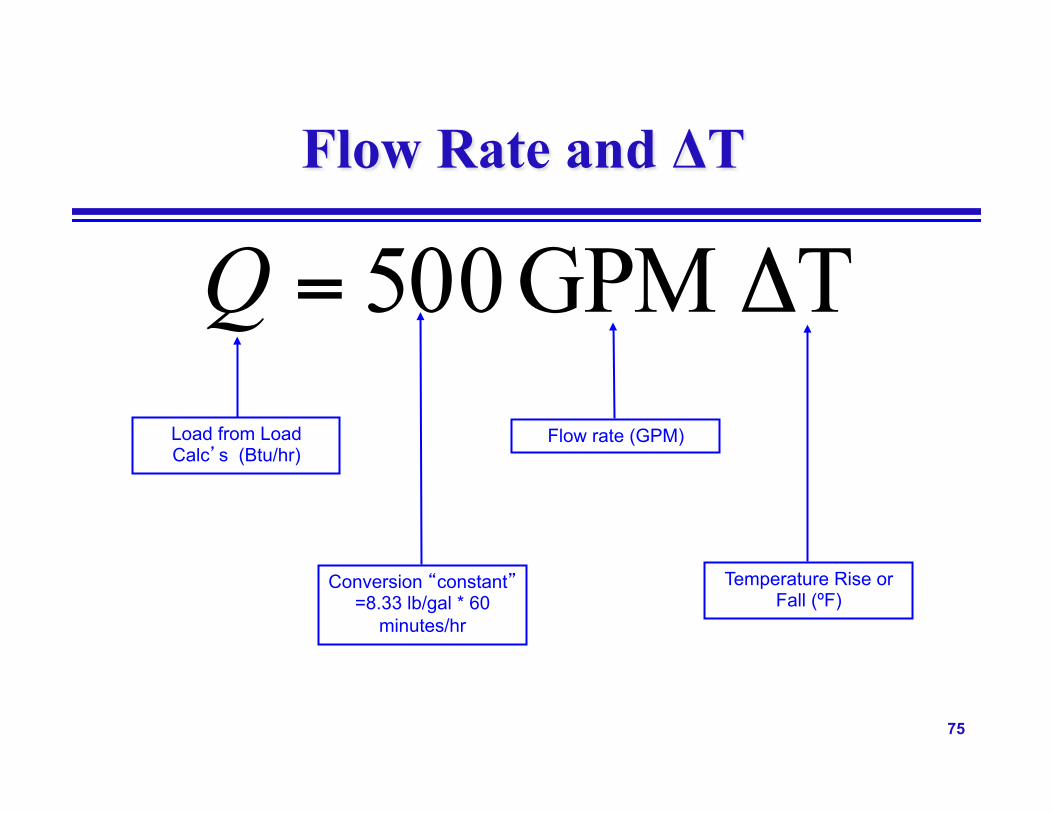
Flow Rate and ΔT
TGPM 500 Δ=QLoad from Load Calc’s (Btu/hr)
Conversion “constant” =8.33 lb/gal * 60
minutes/hr
Flow rate (GPM)
Temperature Rise or Fall (ºF)

76
CHW ΔT Tradeoffs
ΔT
Low
High
Typical Range
8°F
25°F
First Cost Impact
smaller condenser
smaller pipe smaller pump
smaller pump motor
Energy Cost Impact
lower fan energy
lower pump energy

77
Coil Performance with ΔT
Chilled Water ΔT 11 13 15 18 20Coil water pressure drop, feet H2O
28 20 15 10 8.1
Coil airside pressure drop, inches H2O
0.46 0.48 0.49 0.52 0.54
43°F chilled water supply temperature, 78°F/62°F entering air and 53°F leaving air temperature.

78
0
200
400
600
800
1000
1200
11 13 15 18 20CHW Delta-T
kWh/
ton/
year
CHP Energy kWh/yearChiller Energy kWh/yearFan Energy kWh/year
System Performance With ΔT Varying Airside Pressure
CHWST = 44F
79
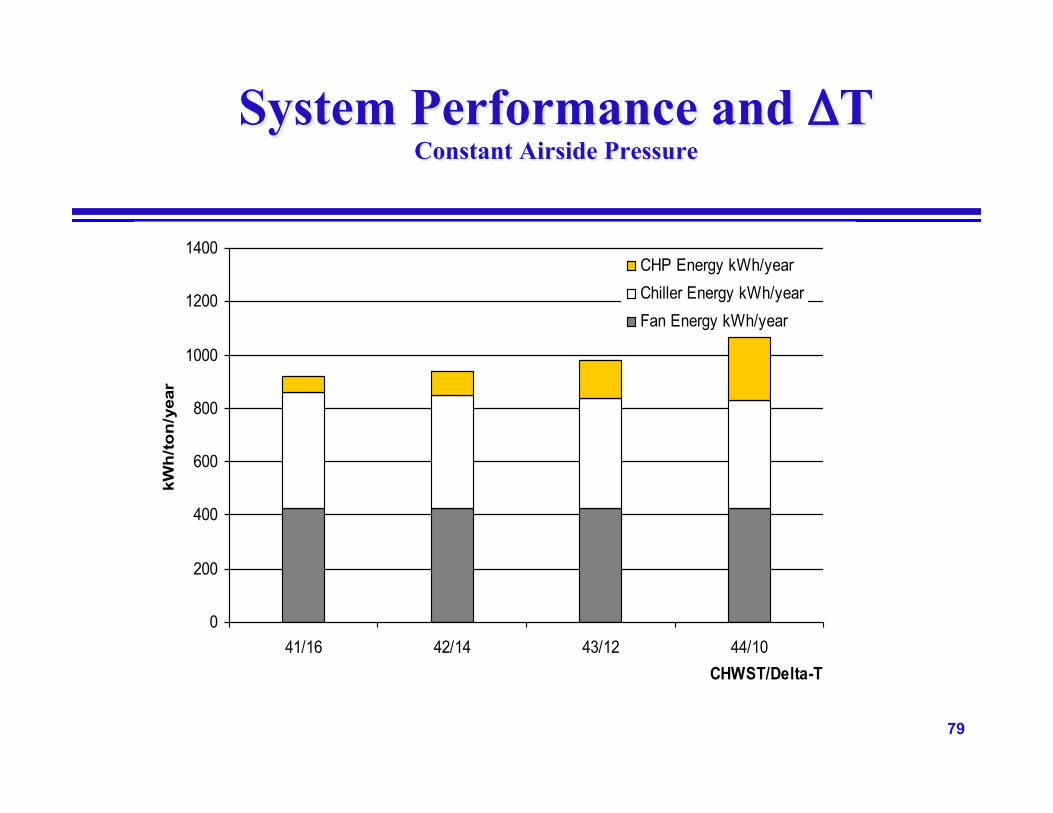
System Performance and ΔT Constant Airside Pressure
0
200
400
600
800
1000
1200
1400
41/16 42/14 43/12 44/10CHWST/Delta-T
kWh/ton/year
CHP Energy kWh/yearChiller Energy kWh/yearFan Energy kWh/year

80
Choosing the “Right” CHW ΔT
Both energy and first costs are almost always minimized by picking a very high ΔT (>18°F to 25°F)
Savings even greater with systems that have • Large distribution piping network • Water-side economizers • CHW thermal energy storage

81
Condenser Water (Tower) Range at Constant CWST
ΔT
Low
High
Typical Range
8°F
18°F
First Cost Impact
smaller condenser
smaller pipe smaller pump
smaller pump motor smaller cooling tower
smaller cooling tower motor Energy Cost
impact
lower chiller energy
lower pump energy lower cooling tower energy
82
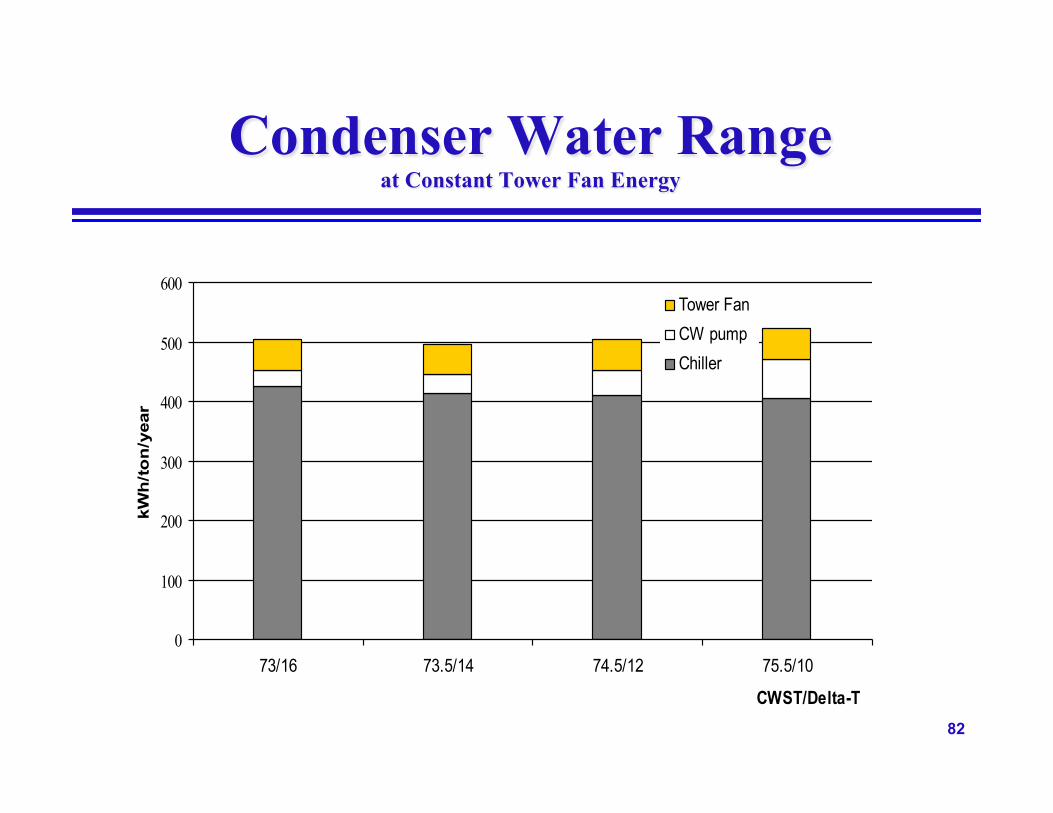
Condenser Water Range at Constant Tower Fan Energy
0
100
200
300
400
500
600
73/16 73.5/14 74.5/12 75.5/10
CWST/Delta-T
kWh/ton/year
Tower Fan CW pumpChiller

83
COOLING TOWER SELECTION
5
7
9
11
13
151719
1110
98
76
54
32
10%10%20%30%40%50%60%70%80%90%100%110%120%130%140%150%160%170%180%190%200%210%
% D
esig
n C
apac
ity
Approach (°F)
Range (°F)
DOE 2 Curve: Percent rated capacity at 70.0°F wet bulb
200%-210%190%-200%180%-190%170%-180%160%-170%150%-160%140%-150%130%-140%120%-130%110%-120%100%-110%90%-100%80%-90%70%-80%60%-70%50%-60%40%-50%30%-40%20%-30%10%-20%0%-10%
Design capacity
2 X design capacity
1/2 of design capacity
84
Cooling Tower Selection
Fan Control Efficiency Approach
85
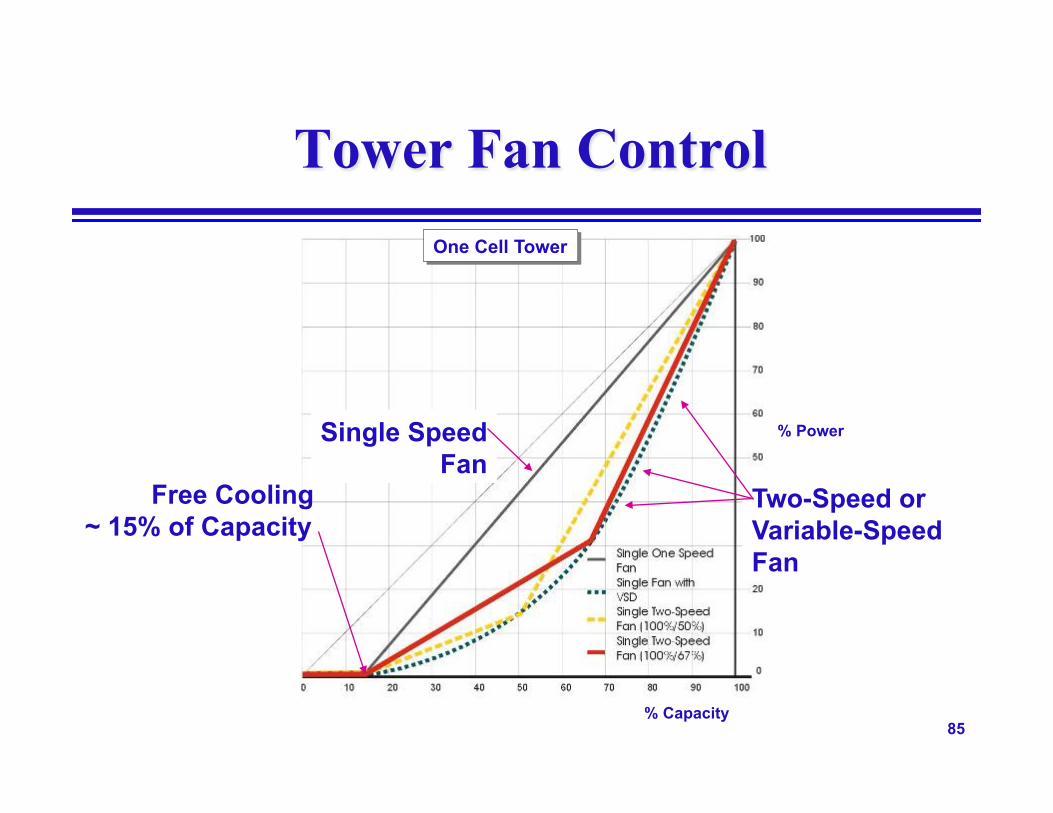
Tower Fan Control
Free Cooling ~ 15% of Capacity
Single Speed Fan
Two-Speed or Variable-Speed Fan
% Capacity
% Power
One Cell Tower

86
Tower Fan Control Two Cell Tower
0%
10%
20%
30%
40%
50%
60%
70%
80%
90%
100%
0% 5% 10% 15% 20% 25% 30% 35% 40% 45% 50% 55% 60% 65% 70% 75% 80% 85% 90% 95% 100%
% Capacity
% P
ower
Two 1-Speed Fans
Two 2-Speed Fans
One 1-Speed Fan andOne 2-Speed Fan
Free Cooling Below 15% Capacity
Two Variable Speed
Two Cell Tower
87
Tower Fan Control
One-speed control is almost never the optimum strategy regardless of size, weather, or application
VFD fan speed control is best choice now • Costs now comparable to two speed motors & starters • Soft start reduces belt wear • Lower noise • Control savings for DDC systems (network card options) • More precise control
Multiple cell towers should have speed modulation on at least 2/3 of cells (required by ASHRAE 90.1). For redundancy, use VFDs on all cells
88
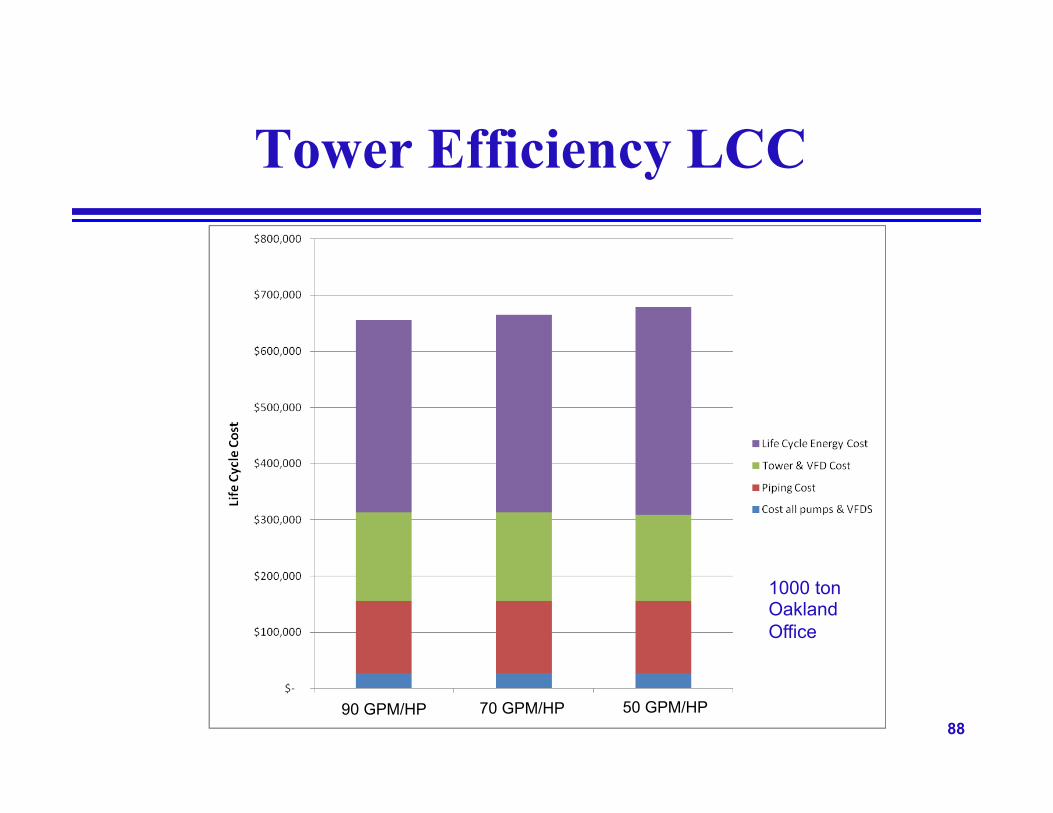
Tower Efficiency LCC
90 GPM/HP 70 GPM/HP 50 GPM/HP
1000 ton Oakland Office
89
Tower Efficiency Guidelines
Use Propeller Fans • Avoid centrifugal except where high static needed or
where low-profile is needed and no prop-fan options available
• Consider low-noise propeller blade option and high efficiency tower where low sound power is required
Efficiency • Minimum 80 gpm/hp for commercial occupancies • Minimum 100 gpm/hp for 24/7 plants (data centers)
Approach • Maximum 10°F for large central plants • 3°F for 24/7 plants (data centers)

Break

91
CHILLER SELECTION
Part-Load Ratio
92
Chiller Procurement Approaches
Most Common Approach • Pick number of chillers, usually arbitrarily or as
limited by program or space constraints • Take plant load and divide by number of chillers
to get chiller size (all equal) • Pick favorite vendor • Have vendor suggest one or two chiller options • Pick option based on minimal or no analysis • Bid the chillers along with the rest of the job and
let market forces determine which chillers you actually end up installing

93
Chiller Procurement Approaches
Better Approach • Estimate plant annual load profile • Understand chiller efficiency curves • Request chiller options from multiple
manufacturers based on a performance desired. Multiple options encouraged.
• Estimate energy usage of options with a detailed computer model of the building/plant
94
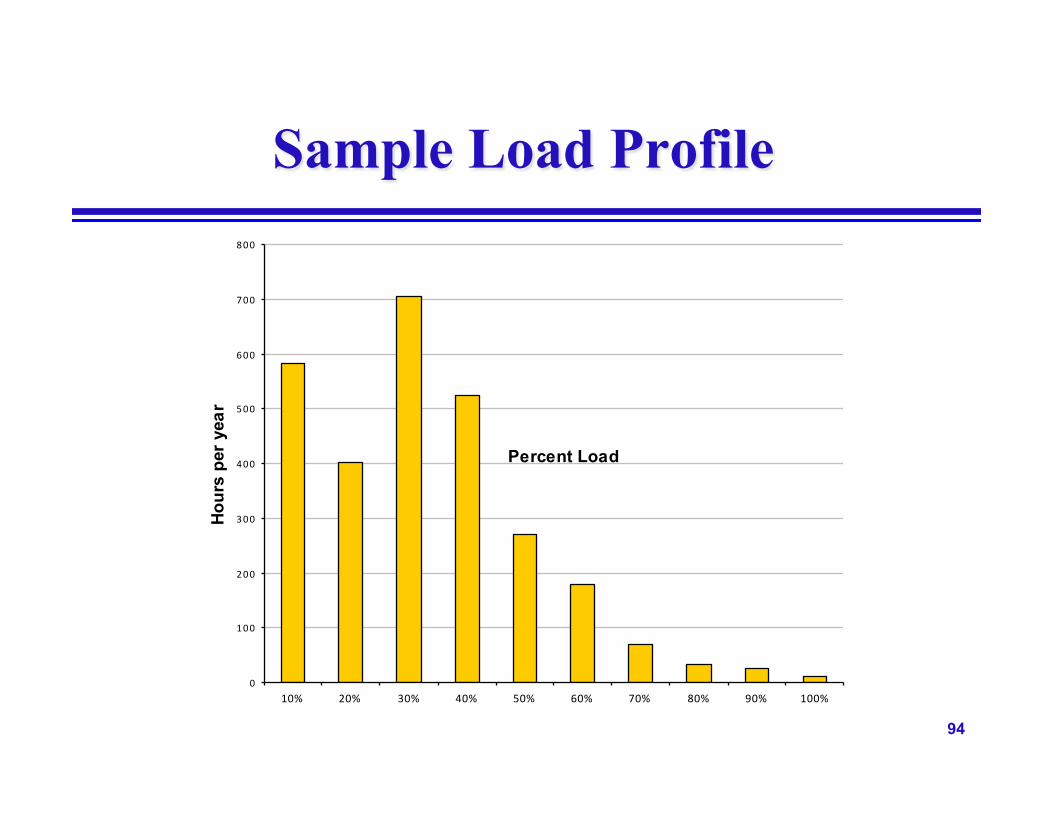
Sample Load Profile
0
100
200
300
400
500
600
700
800
10% 20% 30% 40% 50% 60% 70% 80% 90% 100%
Percent Load
Hour
s pe
r yea
r

95
Chiller Procurement Approaches
Another Option • Pick a short list of vendors based on past
experience, local representation, etc. • Request chiller bids based on a performance
specification. Multiple options encouraged. • Adjust bids for other first cost impacts • Estimate energy usage of options with a detailed
computer model of the building/plant • Select chillers based on lowest life cycle cost • Bid the chillers at end of design development
phase
96
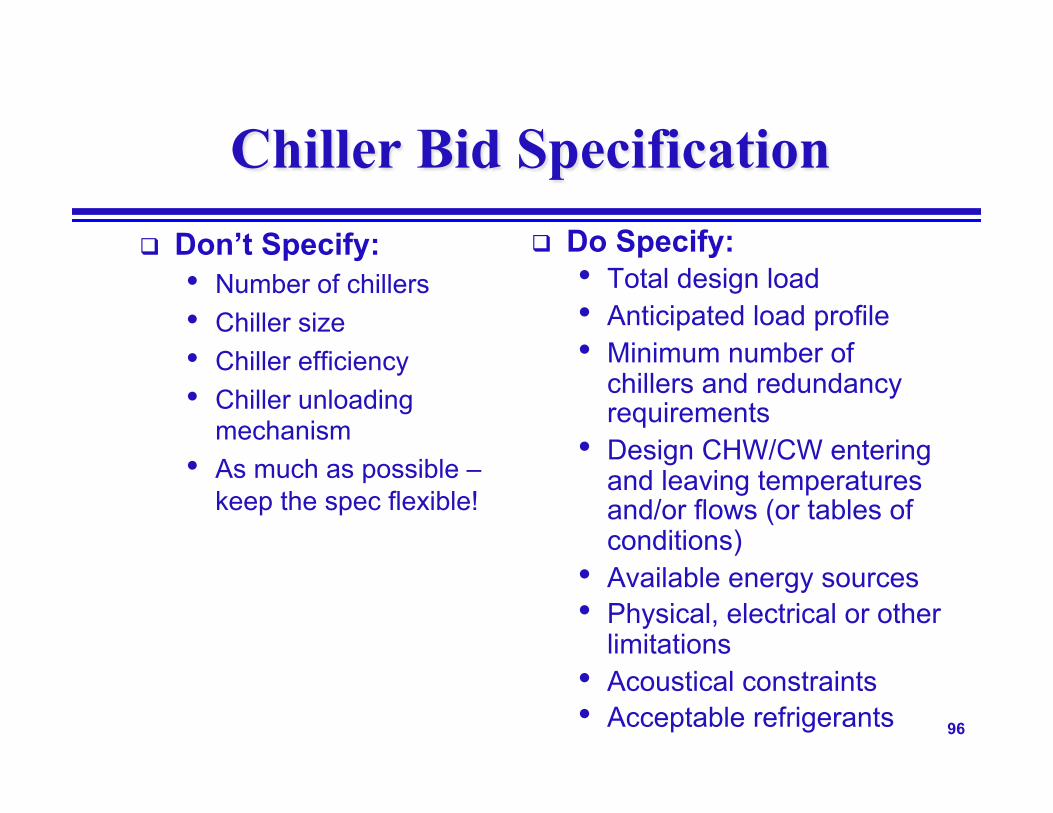
Chiller Bid Specification Don’t Specify:
• Number of chillers • Chiller size • Chiller efficiency • Chiller unloading
mechanism • As much as possible –
keep the spec flexible!
Do Specify: • Total design load • Anticipated load profile • Minimum number of
chillers and redundancy requirements
• Design CHW/CW entering and leaving temperatures and/or flows (or tables of conditions)
• Available energy sources • Physical, electrical or other
limitations • Acoustical constraints • Acceptable refrigerants
97
Zero Tolerance Data
Do NOT allow tolerance to be taken in accordance with ARI 550/590
Why insist on zero tolerance? • Levels playing field – tolerances applied
inconsistently among manufacturers • Modeled energy costs will be more accurate • High tolerance at low loads makes chillers
appear to be more efficient than they will be, affecting comparison with unequally sized, VFD-driven, or multiple chiller options

98
Zero Tolerance Data
0%
5%
10%
15%
20%
25%
30%
35%
40%
45%
0% 20% 40% 60% 80% 100% 120%
% of Full Load
% T
oler
ance
10F Delta-T15F Delta-T20F Delta-T
ARI 550/590 Tolerance Curve

99
Factory Tests
Certified Factory Tests • Need to verify performance to ensure accurate
claims by chiller vendors in performance bids • Field tests are difficult or impossible and less
accurate • Last chance to reject equipment

100
Chiller Bid Evaluation
Adjust for First Cost Impacts Estimate Maintenance Costs Calculate Energy Costs
• Energy model of building(s) and plant Calculate Life Cycle Costs Temper Analysis with Consideration for “Soft” Factors
Final Selection
101
Advantages & Disadvantages OF RECOMMENDED CHILLER SELECTION APPROACH
Disadvantages • Extra work for both engineer and vendor • Difficult to include maintenance impact • Assumes energy rate schedules will remain as they
are now with simplistic adjustments for escalation Advantages
• Allows manufacturers to each find their own “sweet” spots, both for cost and efficiency
• Usually higher energy efficiency • More rational than typical selection approaches
102
OPTIMIZING CONTROLS
103
Optimizing Control Sequences
Cookbook Solution • Staging Chillers • Controlling Pumps • Chilled Water Reset • Condenser Water Reset
Relational Control Approach
104
Staging Chillers
Fixed Speed Chillers • Operate no more chillers than required to meet the
load • Stage on when operating chillers maxed out as
indicated by measured load (GPM, ΔT), CHWST, flow, or other load indicator
• For primary-secondary systems w/o check valve in the decoupler, start chiller to ensure primary-flow > secondary-flow
• Stage off when measured load/flow indicates load is less than operating capacity less one chiller – be conservative to prevent short cycling
105
Staging Chillers, continued
Variable Speed Chillers • Operate as many chillers as possible provided
load on each exceeds 30% to 40% load • Energy impact small regardless of staging logic • You MUST use condenser water reset to get the
savings

106
Part Load Chiller Performance w/ Zero ARI Tolerance
0%
10%
20%
30%
40%
50%
60%
70%
80%
90%
100%
0% 10% 20% 30% 40% 50% 60% 70% 80% 90% 100%
% Load (with Condenser Relief)
%kW
Fixed SpeedVariable Speed

107
Controlling CHW Pumps
Primary-only and Secondary CHW Pumps • Control speed by differential pressure measured
as far out in system as possible and/or reset setpoint by valve demand
• Stage pumps by differential pressure PID loop speed signal: Start lag pump at 90% speed Stop lag pump at 40% speed For large HP pumps, determine flow and speed
setpoints with detailed energy analysis
108
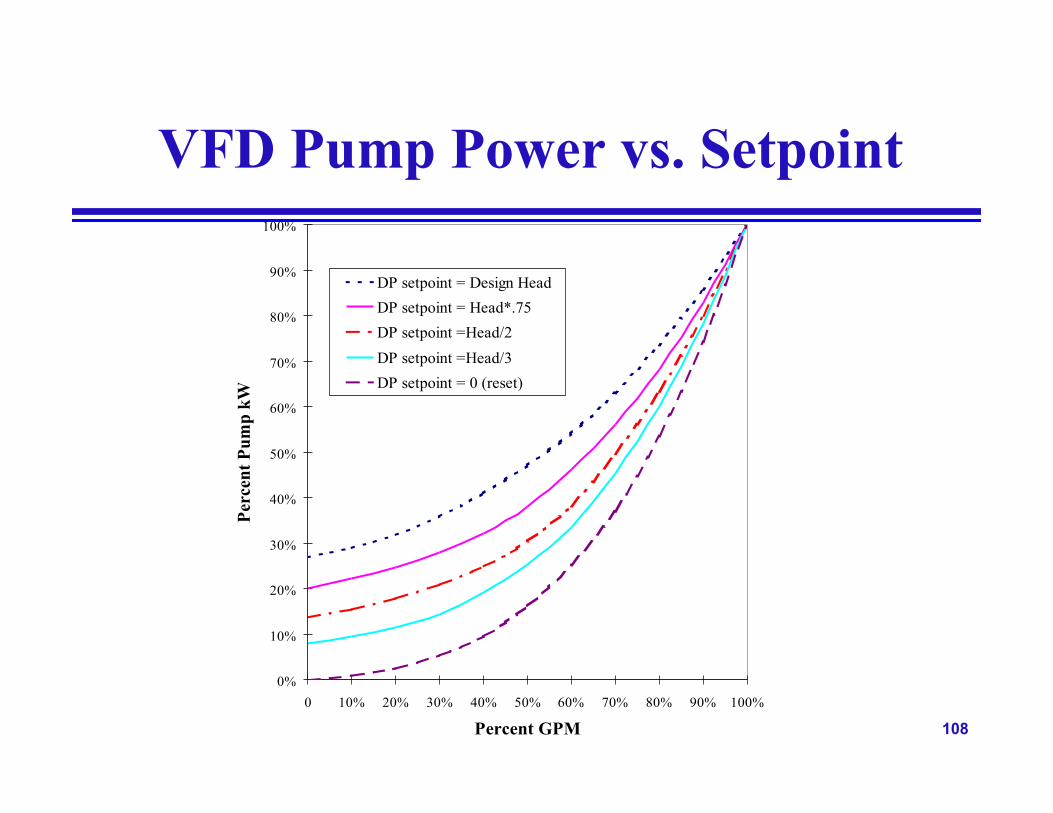
VFD Pump Power vs. Setpoint
0%
10%
20%
30%
40%
50%
60%
70%
80%
90%
100%
0 10% 20% 30% 40% 50% 60% 70% 80% 90% 100%
Percent GPM
Perc
ent P
ump
kW
DP setpoint = Design HeadDP setpoint = Head*.75DP setpoint =Head/2DP setpoint =Head/3DP setpoint = 0 (reset)

109
Chilled Water Setpoint Reset
Reset Impacts • Resetting CHWST upwards reduces chiller energy but will
increase pump energy in VFD variable flow systems • Dehumidification
Reset with “open” or indirect control loops (e.g. OAT) can starve coils and reduce dehumidification
Reset by control valve position will never hurt dehumidification − humidity of supply determined almost entirely by supply air temperature setpoint, not CHWST
Recommendations • Reset from control valve position using Trim & Respond logic • For variable flow systems with VFDs
Reset of CHWST and VFD differential pressure setpoint should be sequenced − not independent like VAV systems since control valves are pressure-dependent
Sequence reset of CHWST and DP − next slide…

110
CHWST/DP Setpoint Reset for VSD CHW System
Back off on CHWST first Then back off on DP setpoint
Tmin+ 15ºF
Tmin
DPmax
5 psi
CHW setpoint
CHW setpoint
DP setpoint
DP setpoint
CHW Plant Reset 0 100% 50%
111
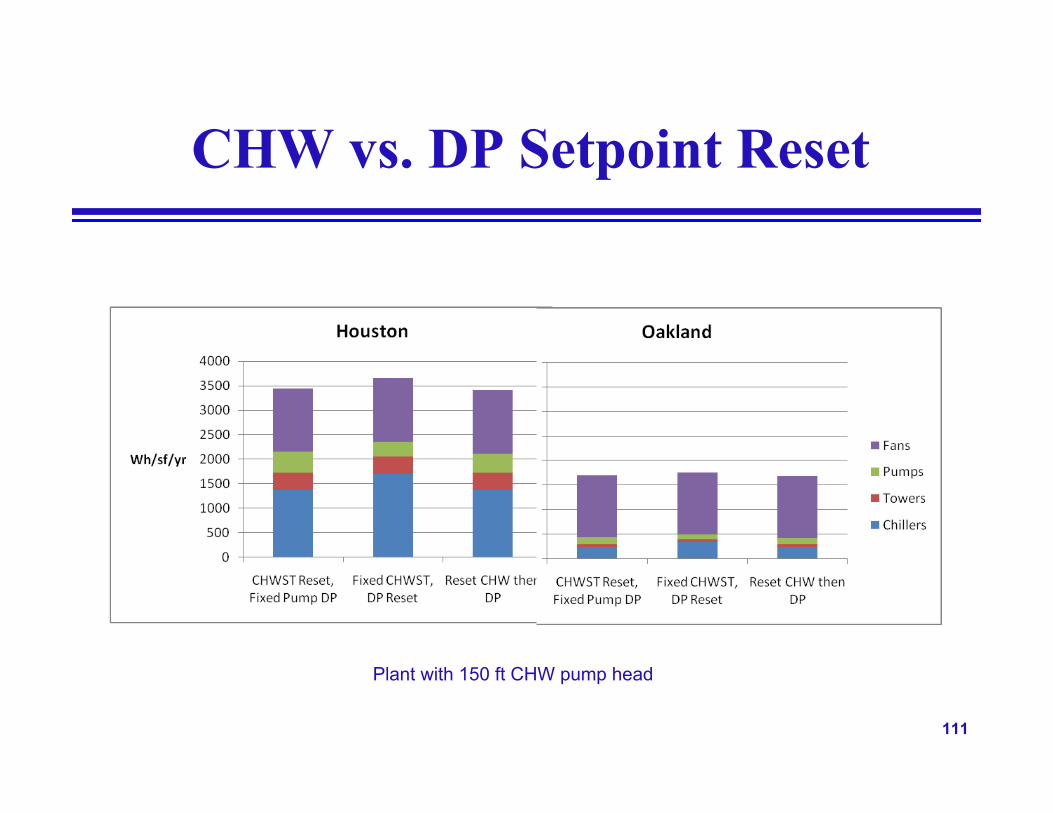
CHW vs. DP Setpoint Reset
Plant with 150 ft CHW pump head
112
Condenser Water Setpoint Reset
Optimum Strategy Cannot Easily Be Generalized • Depends on efficiency/sizing of tower and type of chiller • Relational control by monitoring plant efficiency
Recommendations • CWS reset by plant load from [as low as manufacturer
recommends] at 30% plant load up to [design CWST] at 80% load
• Reset based on wetbulb temperature not effective given inaccuracy of sensors

113
Optimum Sequences
All plants are different • Tower efficiency, approach • Chiller efficiency, unloading control • Pump efficiency, head, unloading control • Number of chillers, pumps, towers
A generalized sequence can be developed but it will not be optimum
Solution?

114
Summary
In this course, you have learned techniques to design and control chiller plants for near-minimum life cycle costs, including: • Selecting optimum chilled water distribution system • Selecting optimum CHW supply & return temperatures • Selecting optimum CW and tower range and approach
temperatures, tower efficiency, and fan speed controls • Selecting optimum chillers using a performance bid and
LCC analysis • Optimizing control sequences and setpoints

115
Questions