chilton and chilton lane community plan 2011 2014
DESCRIPTION
ÂTRANSCRIPT
livin Chilton and Chilton Lane
Community Plan 2011-14
Neighbourhood Plan 2011-14
And
with the community at heart Revised March 2013

2
Equality and Diversity livin aims to ensure that Equality and Diversity lies at the heart of our business and allows our customers to access high quality services tailored to their individual diverse needs. It is our policy to provide access to services and employment equality to all, irrespective of age, race or ethnic origin, gender, marital or family status, religious or philosophical belief or political opinion, disability, nationality or sexual orientation. As part of our commitment we, and our working partners, aim to treat everyone as equal citizens and recognise, support and value the diversity of the communities in which they live.
Contact Us
Communities Team
livin, Farrell House, Arlington Way
DurhamGate, Spennymoor, Co Durham, DL16 6NL
0800 587 4538 (free from a landline) or 0300 111 2234 (low rate
call from a mobile phone depending on your network)
3
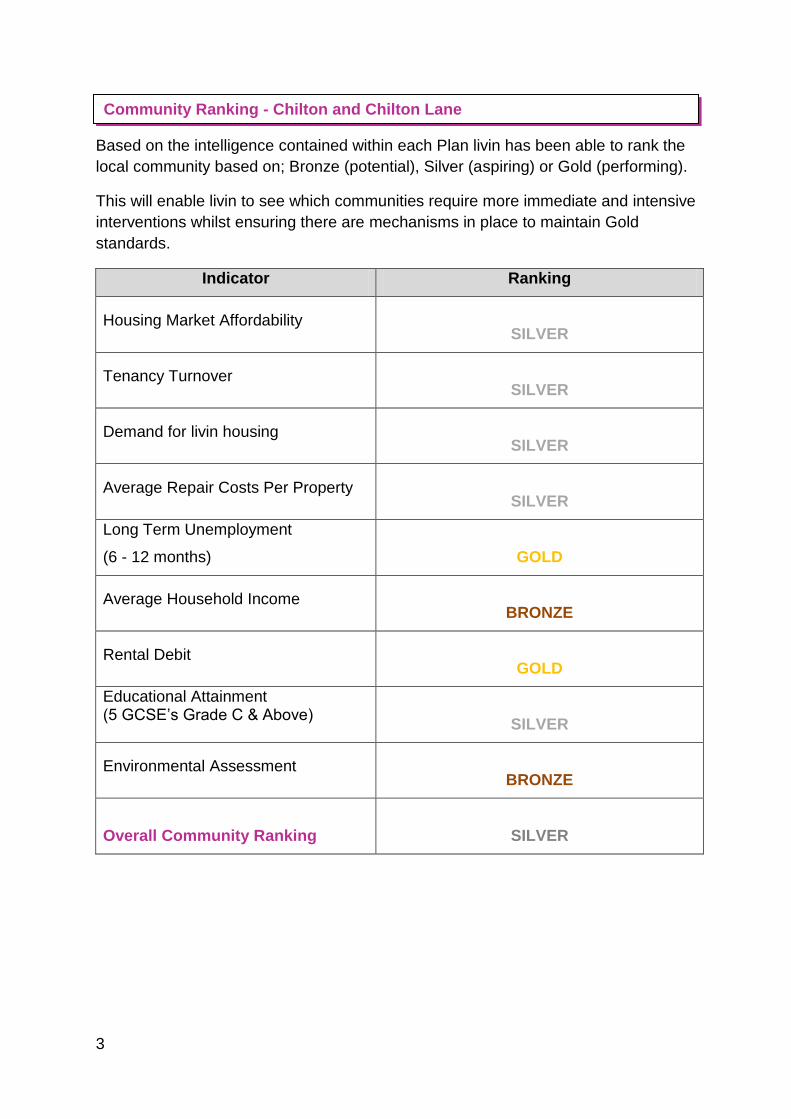
Based on the intelligence contained within each Plan livin has been able to rank the
local community based on; Bronze (potential), Silver (aspiring) or Gold (performing).
This will enable livin to see which communities require more immediate and intensive
interventions whilst ensuring there are mechanisms in place to maintain Gold
standards.
Indicator Ranking
Housing Market Affordability SILVER
Tenancy Turnover SILVER
Demand for livin housing SILVER
Average Repair Costs Per Property SILVER
Long Term Unemployment
(6 - 12 months) GOLD
Average Household Income BRONZE
Rental Debit GOLD
Educational Attainment (5 GCSE’s Grade C & Above)
SILVER
Environmental Assessment BRONZE
Overall Community Ranking SILVER
Community Ranking - Chilton and Chilton Lane
4
Page No.
Section 1 Community profile 7
1.1 Demographics 8
1.1.1 Population – now and in the future 8
1.1.2 Religion and Ethnicity 12
1.2 Housing 14
1.2.1 Housing tenure 14
1.2.2 Average house prices 16
1.2.3 Current supply and demand for housing 19
1.2.4 livin tenancy sustainment 24
1.2.5 Vacant/Abandoned properties 25
1.2.6 Future demand for housing 27
1.2.7 Average cost of repairs to livin properties 29
1.2.8 Average cost of improvement programmes 29 for livin properties
1.3 Crime and Antisocial Behaviour 30
1.4 Economy and Employment 33
1.4.1 Economic activity 33
1.4.2 Jobseekers Allowance claimants 38
1.4.3 Department for Works and Pensions key benefit claimants 39
1.4.4 Household income 39
1.4.5 Vehicle ownership and cost of travel 40
1.4.6 Rental debit in livin properties 41
1.5 Access to services and facilities 43
Contents
5
1.6 Health and wellbeing 48
1.7 Education and training 50
1.8 Reputation of the local area and community cohesion 53
1.9 Local environment 54
Section 2 Community priorities 57
Section 3 Review of the community plan 58
Appendix 1 livin Strategic framework and regulatory requirements 59
Appendix 2 Methodology 65
6
Page No.
Figure 1.1 Aerial overview of Chilton 7
Figure 1.2 Aerial overview of Chilton Lane 8
Figure 1.3 Age Profile of population in Chilton and Chilton Lane 9
Figure 1.4 Household profile for Chilton and Chilton Lane 9
Figure 1.5 Population projections for Durham County 10
Figure 1.6 Age pyramid projections for Durham County 11
Figure 1.7 Housing tenure in Chilton and Chilton Lane 14
Figure 1.8 Average house prices in Chilton and Chilton Lane 16
Figure 1.9 livin stock in Chilton and Chilton Lane 20
Figure 1.10 Age profile of livin lead tenants in Chilton and Chilton Lane 21
Figure 1.11 livin properties available for let during the period 1 October 2009 22
to 30 September 2010 in Chilton and Chilton Lane
Figure 1.12 livin tenancy sustainment in Chilton and Chilton Lane 25
Figure 1.13 Chilton Ward Police beat area 30
Figure 1.14 Reported cases of nuisance and antisocial behaviour to livin 31
within Chilton and Chilton Lane during the period 1 April 2010 to
31March 2011
Figure 1.15 Economic activity in Chilton and Chilton Lane 34
Figure 1.16 Occupation profile of 16 to 74 year old residents in Chilton and 36
Chilton Lane
Figure 1.17 Economic inactivity in Chilton and Chilton Lane 37
Figure 1.18 Jobseekers Allowance claimants in Chilton and Chilton Lane 38
Figure 1.19 Breakdown of persons residing in Chilton and Chilton Lane 39
claiming key DWP benefits
Figure 1.20 Levels of health levels in Chilton and Chilton Lane 48
Figure 1.21 Educational attainment within Chilton and Chilton Lane 51
Figure 1.22 Route of environmental assessment for Chilton 55
Figure 1.23 Route of environmental assessment for Chilton Lane 55
List of Figures
7
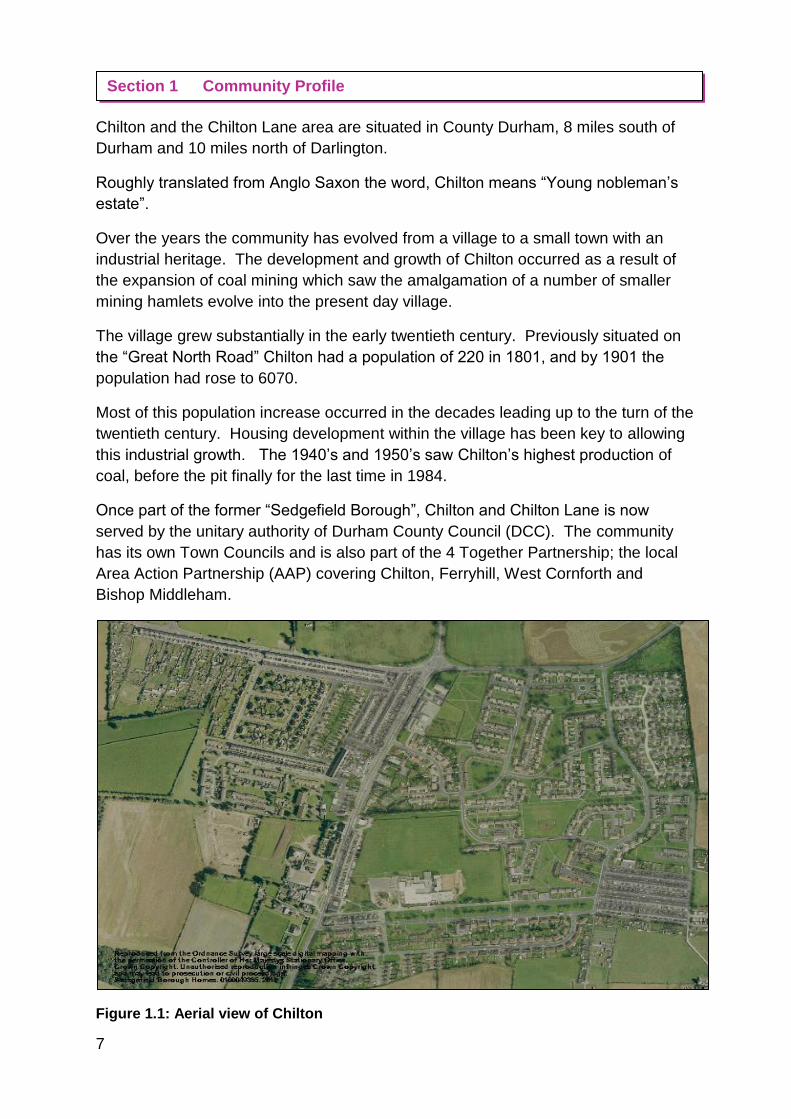
Chilton and the Chilton Lane area are situated in County Durham, 8 miles south of
Durham and 10 miles north of Darlington.
Roughly translated from Anglo Saxon the word, Chilton means “Young nobleman’s
estate”.
Over the years the community has evolved from a village to a small town with an
industrial heritage. The development and growth of Chilton occurred as a result of
the expansion of coal mining which saw the amalgamation of a number of smaller
mining hamlets evolve into the present day village.
The village grew substantially in the early twentieth century. Previously situated on
the “Great North Road” Chilton had a population of 220 in 1801, and by 1901 the
population had rose to 6070.
Most of this population increase occurred in the decades leading up to the turn of the
twentieth century. Housing development within the village has been key to allowing
this industrial growth. The 1940’s and 1950’s saw Chilton’s highest production of
coal, before the pit finally for the last time in 1984.
Once part of the former “Sedgefield Borough”, Chilton and Chilton Lane is now
served by the unitary authority of Durham County Council (DCC). The community
has its own Town Councils and is also part of the 4 Together Partnership; the local
Area Action Partnership (AAP) covering Chilton, Ferryhill, West Cornforth and
Bishop Middleham.
Figure 1.1: Aerial view of Chilton
Section 1 Community Profile
8
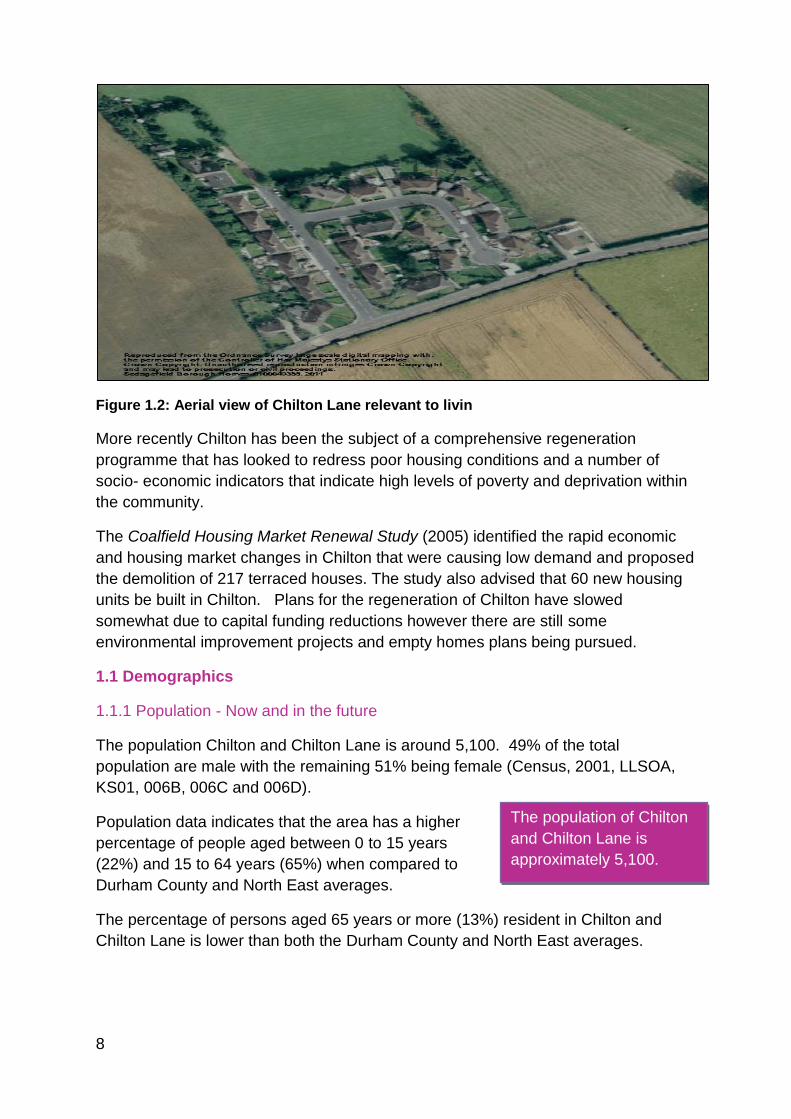
Figure 1.2: Aerial view of Chilton Lane relevant to livin
More recently Chilton has been the subject of a comprehensive regeneration
programme that has looked to redress poor housing conditions and a number of
socio- economic indicators that indicate high levels of poverty and deprivation within
the community.
The Coalfield Housing Market Renewal Study (2005) identified the rapid economic
and housing market changes in Chilton that were causing low demand and proposed
the demolition of 217 terraced houses. The study also advised that 60 new housing
units be built in Chilton. Plans for the regeneration of Chilton have slowed
somewhat due to capital funding reductions however there are still some
environmental improvement projects and empty homes plans being pursued.
1.1 Demographics
1.1.1 Population - Now and in the future
The population Chilton and Chilton Lane is around 5,100. 49% of the total
population are male with the remaining 51% being female (Census, 2001, LLSOA,
KS01, 006B, 006C and 006D).
Population data indicates that the area has a higher
percentage of people aged between 0 to 15 years
(22%) and 15 to 64 years (65%) when compared to
Durham County and North East averages.
The percentage of persons aged 65 years or more (13%) resident in Chilton and
Chilton Lane is lower than both the Durham County and North East averages.
The population of Chilton
and Chilton Lane is
approximately 5,100.
9
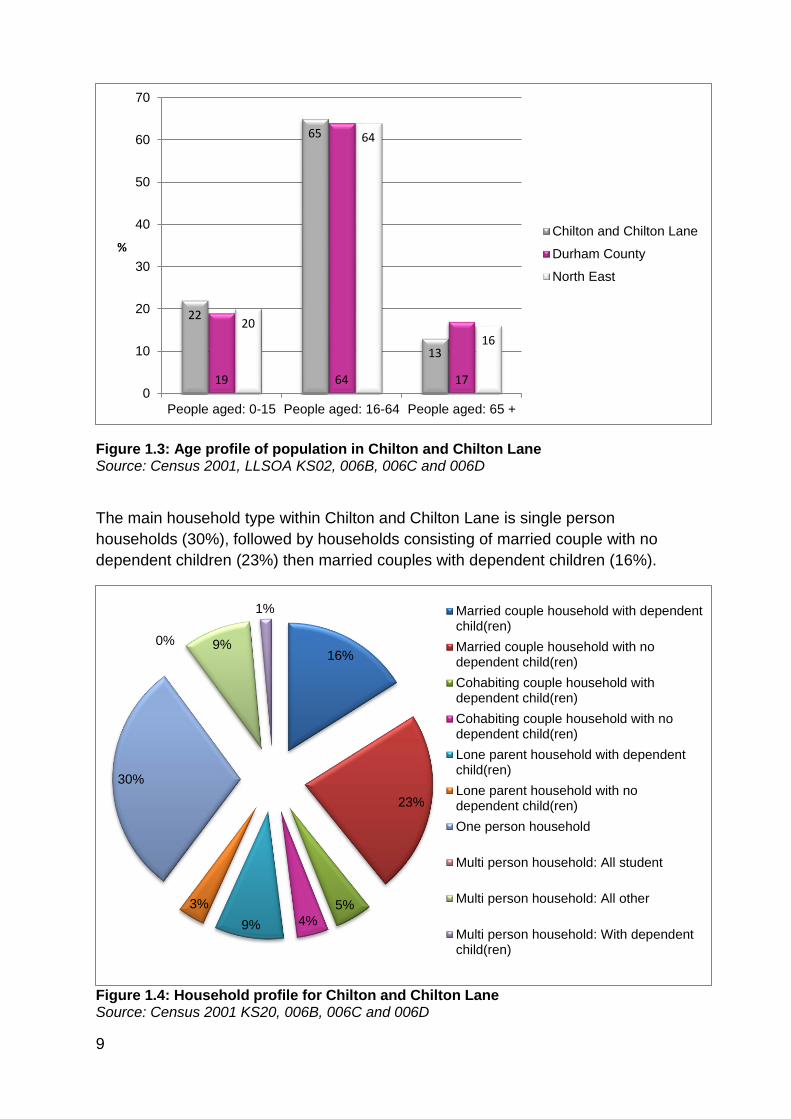
Figure 1.3: Age profile of population in Chilton and Chilton Lane Source: Census 2001, LLSOA KS02, 006B, 006C and 006D
The main household type within Chilton and Chilton Lane is single person
households (30%), followed by households consisting of married couple with no
dependent children (23%) then married couples with dependent children (16%).
Figure 1.4: Household profile for Chilton and Chilton Lane Source: Census 2001 KS20, 006B, 006C and 006D
22
65
13
19 64 17
20
64
16
0
10
20
30
40
50
60
70
People aged: 0-15 People aged: 16-64 People aged: 65 +
%
Chilton and Chilton Lane
Durham County
North East
16%
23%
5%
4% 9%
3%
30%
0% 9%
1% Married couple household with dependentchild(ren)
Married couple household with nodependent child(ren)
Cohabiting couple household withdependent child(ren)
Cohabiting couple household with nodependent child(ren)
Lone parent household with dependentchild(ren)
Lone parent household with nodependent child(ren)
One person household
Multi person household: All student
Multi person household: All other
Multi person household: With dependentchild(ren)
10
The number of lone parent family households in the community is higher than both
the Durham County (7%) and North East (7%) averages. This may have implications
upon their ability to return to work given the need to balance family life and the rising
costs of child care.
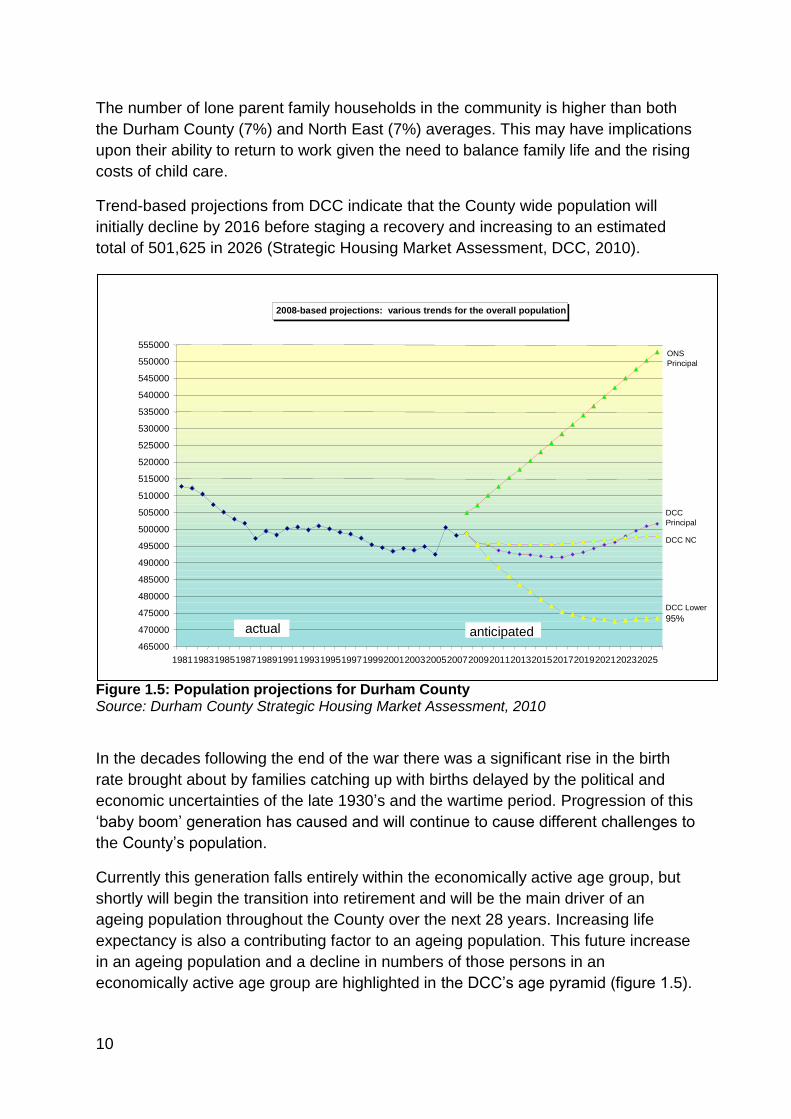
Trend-based projections from DCC indicate that the County wide population will
initially decline by 2016 before staging a recovery and increasing to an estimated
total of 501,625 in 2026 (Strategic Housing Market Assessment, DCC, 2010).
Figure 1.5: Population projections for Durham County Source: Durham County Strategic Housing Market Assessment, 2010
In the decades following the end of the war there was a significant rise in the birth
rate brought about by families catching up with births delayed by the political and
economic uncertainties of the late 1930’s and the wartime period. Progression of this
‘baby boom’ generation has caused and will continue to cause different challenges to
the County’s population.
Currently this generation falls entirely within the economically active age group, but
shortly will begin the transition into retirement and will be the main driver of an
ageing population throughout the County over the next 28 years. Increasing life
expectancy is also a contributing factor to an ageing population. This future increase
in an ageing population and a decline in numbers of those persons in an
economically active age group are highlighted in the DCC’s age pyramid (figure 1.5).
2008-based projections: various trends for the overall population
465000 470000 475000 480000 485000 490000 495000 500000 505000 510000 515000 520000 525000 530000 535000 540000 545000 550000 555000
1981 1983 1985 1987 1989 1991 1993 1995 1997 1999 2001 2003 2005 2007 2009 2011 2013 2015 2017 2019 2021 2023 2025
anticipated actual
DCC Principal
DCC Lower 95%
DCC NC
ONS Principal
11
To facilitate good levels of economic activity within an area it is essential that a high
percentage of the population is contributing to the local economy through
employment or by actively seeking work.
To encourage and attract an economically active population to reside in an area it is
imperative for there to be a good supply of local sustainable jobs and affordable
housing.
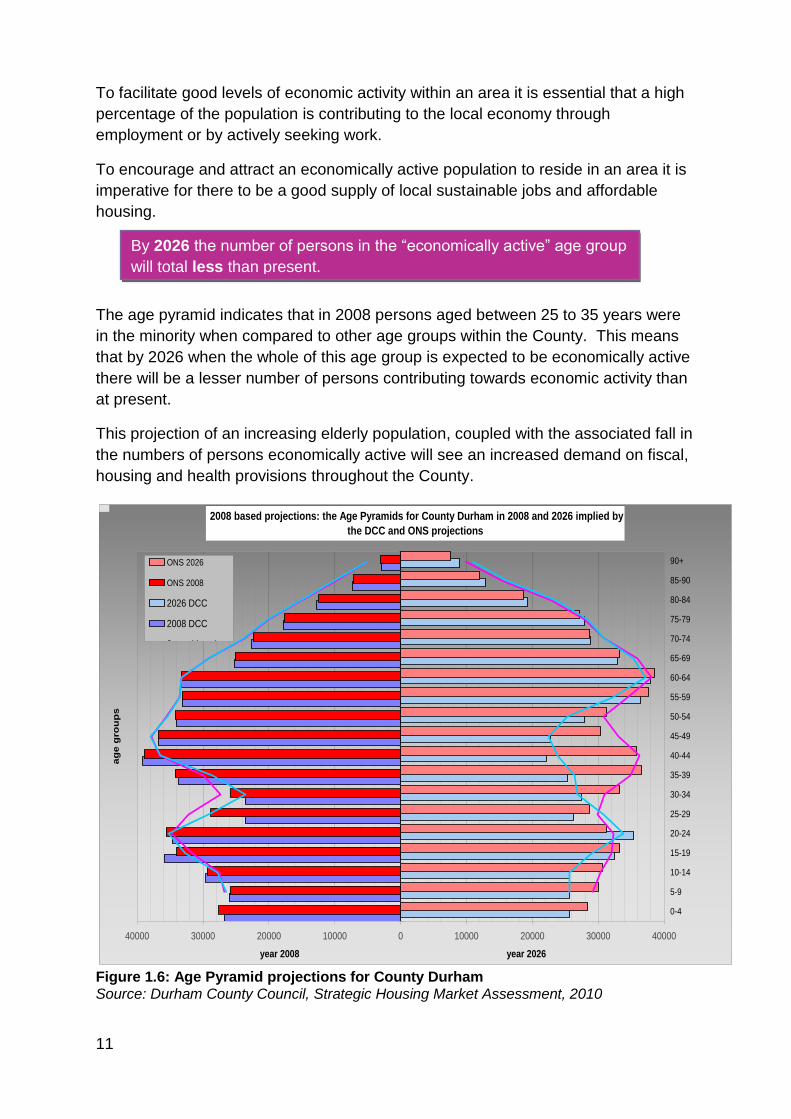
The age pyramid indicates that in 2008 persons aged between 25 to 35 years were
in the minority when compared to other age groups within the County. This means
that by 2026 when the whole of this age group is expected to be economically active
there will be a lesser number of persons contributing towards economic activity than
at present.
This projection of an increasing elderly population, coupled with the associated fall in
the numbers of persons economically active will see an increased demand on fiscal,
housing and health provisions throughout the County.
Figure 1.6: Age Pyramid projections for County Durham Source: Durham County Council, Strategic Housing Market Assessment, 2010
2008 based projections: the Age Pyramids for County Durham in 2008 and 2026 implied by
the DCC and ONS projections
40000 30000 20000 10000 0 10000 20000 30000 40000
0-4
5-9
10-14
15-19
20-24
25-29
30-34
35-39
40-44
45-49
50-54
55-59
60-64
65-69
70-74
75-79
80-84
85-90
90+
ag
e g
rou
ps
year 2008 year 2026
ONS 2026
ONS 2008
2026 DCC
2008 DCC
2 per. Mov. Avg.(2008 DCC)2 per. Mov. Avg.(ONS 2008)2 per. Mov. Avg.(2026 DCC)2 per. Mov. Avg.(ONS 2026)
By 2026 the number of persons in the “economically active” age group
will total less than present.
12
Evidence of livin’s ageing tenant population is evident within the Chilton and Chilton
Lane community with more than 59% of the tenant population already aged 60 years
or older. However this can be attributed to the stock type and number of bungalows
that livin owns within the community. The population of the community indicates that
there is only 13% that are 65 years or older. The increase in an ageing population
within an area will be exacerbated if younger generations are required to move out of
the area to obtain employment opportunities and access affordable housing.
DCC estimates indicate that in 2010 there were 206,281 households County wide.
This number is expected to increase by 24.9% to a total of 257,651 households by
2030 (Strategic Housing Market Assessment, DCC, 2010).
By 2030 single person households (including single pensioners) are expected to
increase by 100.3% to 56,564 whereas two person households are only expected to
increase by 18% to 14,087. Larger households of three persons or more, those with
a housing need of 2 bedroom properties or more, are expected to reduce by 19,281
(26.9%). This decrease in larger households, coupled with a significant increase in
single person households, will have a major impact on the supply and demand of
housing throughout the County.
1.1.2 Religion and Ethnicity
2001 Census data indicates that the main religion in Chilton and Chilton Lane is
Christianity (83%). 0.05% is Buddhist, 0.05% Muslim, 0.09% Sikh, and 0.11% of
other religions. The remaining population of 16% stated they had no religion or did
not provide details (Census, 2001, LLSOA KS07, 006B, 006C and 006D).
Ethnicity within the area predominantly consists of White British (99%). The
remaining 1% of the population is from other ethnic backgrounds including; Irish,
Caribbean, African and Chinese (Census, 2001, LLSOA KS06, 006B, 006C and
006D).
Recent research conducted by DCC and NHS Darlington has estimated that 0.43%
to 0.57% of Durham County’s population consists of people from Gypsy, Roma and
Traveller Households (Renaissance Research, 2010). Durham County Council’s
(DCC) Gypsy, Roma and Traveller site at East Howle is the only permanent
residential site within livin’s area of operation. Further analysis of these figures is
currently not possible due to a lack of further data and intelligence.
An understanding of the ethnic and religious structure of the local population enables
livin to ensure that services are equally accessible, responsive and tailored to the
needs and requirements of all residents living within local communities.
An ageing population, and fall in the number of persons economically
active by 2026 will place an increased demand on fiscal, housing and
health provisions.
13
It will also help livin to ensure that any minority groups are consulted during future
research and intelligence gathering, and allows for consideration of any specific
needs in relation to access for housing, health, and employability during the
development of each community’s key priorities and Local Offers.
What does this mean for livin?
Within the population of Chilton and Chilton Lane there is a higher than average
percentage of 16 to 64 year old. Although there are fewer residents aged 65 years
or more living Chilton and Chilton Lane when compared to the County average, 59%
of livin’s tenants in the community are over 60 years old.
To facilitate good levels of economic activity in a community it is essential that a high
percentage of the population is contributing to the local economy through
employment or actively seeking work. livin needs to support the current younger and
economically active population in the short term.
The long term challenge for livin is to meet the needs of families and younger
persons by delivering larger house types, whilst also ensuring the needs of the older
population are met in the future.
Key Community Characteristics:
65% of residents are aged between 16 to 64 years; this traditionally being the
most common age of persons who are economically active (in employment or
actively seeking employment)
13% of residents are aged 65 years or more. This is significantly lower than the
Durham County average.
30% of households are single person households. This is slightly higher than
the Durham County average.
Trend-based projections indicate that the Countywide population will increase
to an estimated total of 501,625 in 2026 (DCC, 2010).
By 2026 the number of persons in the “economically active” age group will total
less than present. As a high level of economic activity is a key component of
sustainable communities efforts should be made to attract more persons within
this age group into the community during the coming years.
An ageing population, and fall in the number of persons economically active by
2026 will place an increased demand on fiscal, housing and health provisions.
99% of residents are White British; with the remaining 1% being of other ethnic
backgrounds including Irish, African, Asian and Caribbean origin. The most
prominent religion is Christianity, followed by Buddhism, Muslim and Sikhism.
14
livin is well positioned to enable the younger population to remain in the village by
delivering affordable housing. It must also be recognised that, with an increase in
single households livin will need to consider the demand for larger sized properties
and the implications of Welfare Reform for those claiming benefits and under-
occupying their homes.
An understanding of the ethnic and religious structure of the local population will
enable livin to ensure that services are equally accessible, responsive and tailored to
the needs and requirements of all residents living within the local communities. It will
also help ensure a “joined” up approach to community cohesion between minority or
vulnerable groups and the general population.
It is important to livin consider the age profile and needs of the community as a
whole when considering demand and future services to minimise the risk of adapting
its services for particular age or needs groups only.
1.2 Housing
1.2.1 Housing Tenure
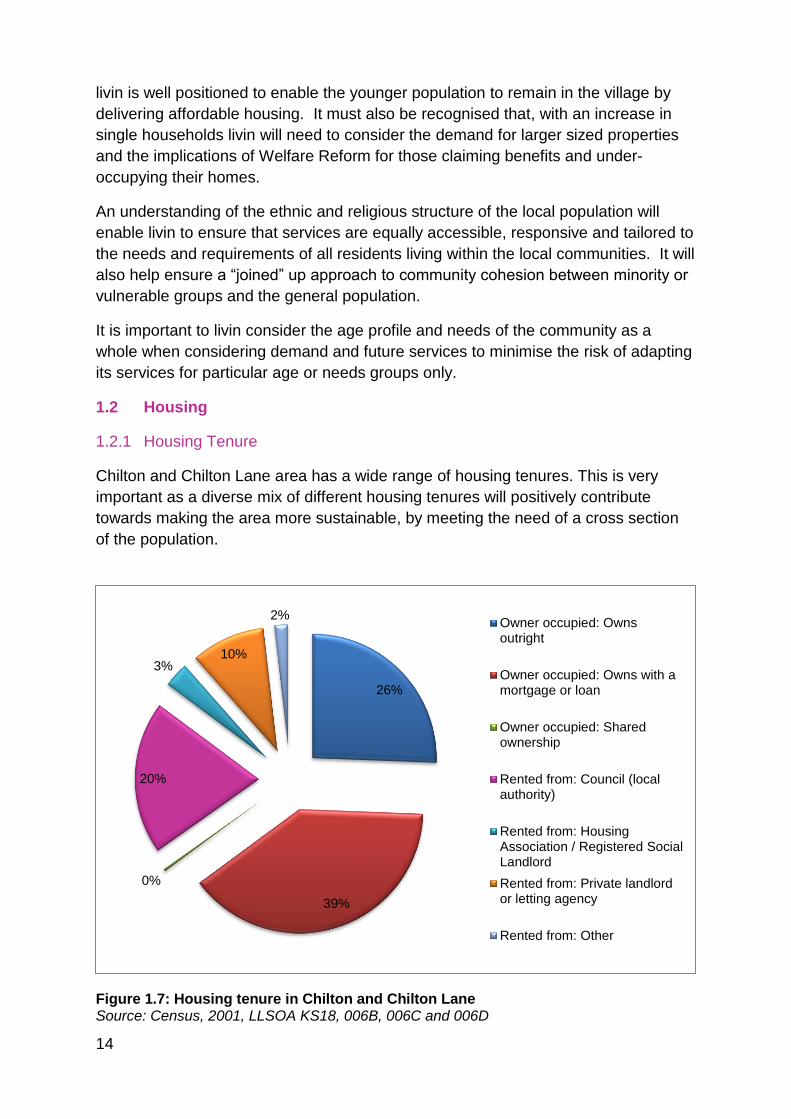
Chilton and Chilton Lane area has a wide range of housing tenures. This is very
important as a diverse mix of different housing tenures will positively contribute
towards making the area more sustainable, by meeting the need of a cross section
of the population.
Figure 1.7: Housing tenure in Chilton and Chilton Lane Source: Census, 2001, LLSOA KS18, 006B, 006C and 006D
26%
39%
0%
20%
3% 10%
2% Owner occupied: Ownsoutright
Owner occupied: Owns with amortgage or loan
Owner occupied: Sharedownership
Rented from: Council (localauthority)
Rented from: HousingAssociation / Registered SocialLandlord
Rented from: Private landlordor letting agency
Rented from: Other
15
The majority of residents living in Chilton and
Chilton Lane own their properties. 26% of the
residents own their own property outright and 39%
own their home through a mortgage or loan
scheme.
The percentage of social housing within Chilton and
Chilton Lane is 23% and is slightly lower when
compared to the County average of 25%. Social
housing consists of domestic properties which are owned by registered social
landlords (RSL’s), housing associations and the Local Authority. All social housing in
Chilton and Chilton Lane that was previously owned by Sedgefield Borough Council
is now owned and managed by livin.
There is a higher than average percentage (10%) of households in Chilton and
Chilton Lane living in privately rented properties when compared to the rest of the
County (5%). The private rented sector plays an important role in any housing
market as this offers accommodation for those unable to access owner-occupation
or socially rented housing.
In 2005 the Coalfield Housing Market Renewal Study highlighted the need to work
closely with private landlords in Chilton to improve tenancy management and reduce
the number of abandoned tenancies in the community.
Today, there is still a Project Officer Group led by DCC that is committed to ensuring
the Landlord Accreditation Scheme is implemented within the community. This
scheme works with responsible landlords and looks to intervene on tenancies where
cooperation cannot be secured. The targets set are for 12 new landlord signatures
to the Accreditation Scheme in 2011/ 2012 and a further 12 the following year. The
scheme recognises and encourages landlords who are prepared to provide good
quality accommodation at an appropriate rent; improve private sector housing
standards; promote good practices; and provide tenants with confidence in quality
and management. The Accreditation Scheme is imperative given the high
percentage of private rented properties within the community.
Tighter controls and restrictions on mortgages and financial lending are likely to
place an even higher future demand on the private rented housing market from low
income households or first time buyers. At 10%, the percentage of privately rented
properties within the community is high and with this brings the potential of a
transient population. This together with absent landlords could lead to poor tenancy
management thus allowing the condition of properties to go unchecked and
deteriorate. This deterioration was highlighted by the residents during consultation as
a concern within the community. It is hoped that the Accreditation Scheme will
continue reduce these problems.
A lower percentage
(23%) of social housing
is located in the
community when
compared to the County
average of only 25%.
16
Generally Chilton and Chilton Lane exhibits a slightly unbalanced housing market
with a lower than average social rented sector and a higher than average private
rented sector.
There is a local Gypsy and Traveller site located at East Howle near to Chilton and
Chilton Lane. The site is provided by Durham County Council and has 25 permanent
pitches.
1.2.2 Average House Prices
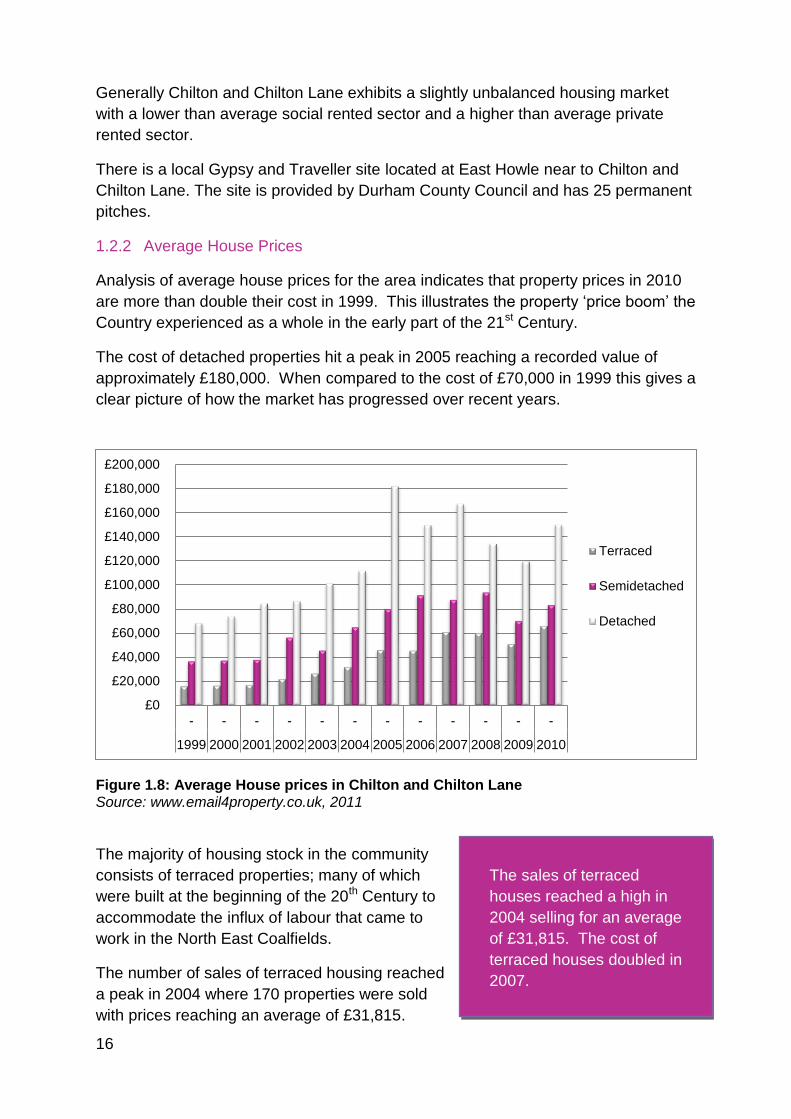
Analysis of average house prices for the area indicates that property prices in 2010
are more than double their cost in 1999. This illustrates the property ‘price boom’ the
Country experienced as a whole in the early part of the 21st Century.
The cost of detached properties hit a peak in 2005 reaching a recorded value of
approximately £180,000. When compared to the cost of £70,000 in 1999 this gives a
clear picture of how the market has progressed over recent years.
Figure 1.8: Average House prices in Chilton and Chilton Lane Source: www.email4property.co.uk, 2011
The majority of housing stock in the community
consists of terraced properties; many of which
were built at the beginning of the 20th Century to
accommodate the influx of labour that came to
work in the North East Coalfields.
The number of sales of terraced housing reached
a peak in 2004 where 170 properties were sold
with prices reaching an average of £31,815.
The sales of terraced
houses reached a high in
2004 selling for an average
of £31,815. The cost of
terraced houses doubled in
2007.
£0
£20,000
£40,000
£60,000
£80,000
£100,000
£120,000
£140,000
£160,000
£180,000
£200,000
- - - - - - - - - - - -
1999 2000 2001 2002 2003 2004 2005 2006 2007 2008 2009 2010
Terraced
Semidetached
Detached
17
During this year the sales of semidetached properties also reached a peak with 33
sales with an average price of £64,850. The sales of detached homes reached a
peak in 2003 with 52 sales averaging £101,281.
When these sales and prices are compared with 2010 it is evident that although the
cost of properties has continued to increase the number of sales has dramatically
slowed. In 2010 terraced houses reached an average price of £66,083 but sales
reduced to 12. Only nine semidetached properties were sold with an average price
of £83,509 and only four detached houses were sold at an average cost of £150,225.
During 2010 the cost of a terraced property in Chilton and West Chilton was higher
than the Durham County average. However the costs for semidetached and
detached properties were lower than the Durham County average. Within the
County a terraced property costs on average £59,976, a semidetached £93,213 and
detached properties £176,518 (Land Registry 2011).
The reduction in sales in the area could be attributed to the current restrictions on
money lending and the overall availability of mortgages.
Residents are concerned about the availability of affordable homes within Chilton
and Chilton Lane with specific reference to a need for more bungalows and three
bedroom homes. This seems to raise issues over redevelopment and land
availability to build upon within the community. However, there are opportunities and
housing sites within the community to develop and help towards sustaining the
community.
The County Durham Strategic Housing Market Assessment assesses affordability
between lower quartile house prices and lower quartile earnings. Buyers would need
to borrow 4.6 times the lower quartile earning to purchase a lower quartile house in
the former Sedgefield area (Durham Strategic Housing Market Assessment, 2008).
For Chilton and Chilton Lane the multiplier is 4.98 resulting in a community ranking
of SILVER. Full details of the methodology for this ranking can be found in Appendix
2.
Although there are a number of current Government incentives available nationwide
to help first time property buyers theses are only available on new build properties.
There are currently only two housing developments within the local area which are
eligible for buyers to obtain help from the HomeBuy Scheme. These can be found at
Ferryhill Station and Spennymoor; with the latter only being available until March
2012. It is currently unknown if the Home Buy scheme will be extended past March
2012.
A new scheme called First Buy will be introduced from September 2011. The
scheme will be jointly funded by the Government and house builders and will provide
a 20% loan top up with the first time buyers’ own deposit of 5%. This will allow them
to take out a mortgage for 75% of the property. Loans will be free of charge for the
first five years and repaid when the property is resold. The funds will then be
18
recycled to fund more homes for the scheme. It is not yet known if any of the First
Buy schemes will be made available within the local area.
Key Housing Market Characteristics:
The Community has a wide range of Housing Tenures; this is important as a
diverse mix of tenures will contribute towards making an area more sustainable by
meeting the need of a cross section of the population.
65% of households own their property outright, or through a mortgage or loan
scheme.
The Community has a fairly low percentage of Social Housing (22%) when
compared to Durham County.
There are a high percentage of privately rented properties (10%) in the
Community when compared to Durham County. The private rented sector plays
an important part in any local Housing Market as it is able to offer accommodation
for those unable to access owner occupation or social housing.
The number of sales of properties in the Community has decreased since the
property boom at the beginning of the 21st Century. During 2010 a terraced
property cost on average £66,083, a semidetached property £83,509 and a
detached property £150,225.
Residents raised a large number of comments regarding housing in their
community.
Housing market affordability within the community is better when compared to the
rest of Durham County. However many local residents are unable to access the
housing market and purchase their own homes as a result of restricted access to
mortgage products and financial lending.
INSERT INFO ON WHAT RESIDENTS FEEL and AFFORDABILITY RATIOS
19
What does this mean for livin?
There is potential for the delivery of more affordable housing in the community and to
provide houses to meet the need of smaller households. The private rented sector
has had a detrimental effect on some areas within the community, particularly within
the terraced housing stock in West Chilton.
livin is a key player within this community’s housing market and has a role in
balancing the local housing market. It must ensure a close working relationship with
DCC to support regeneration of West Chilton and to help meet the housing need
identified in DCC’s Housing Strategies.
livin needs to consider the health of the local housing market and the ability of
households to meet their own housing need. Lack of access to the owner
occupation and the private rented sector could increase pressure on livin’s housing
stock, particularly for single/couple households under 65 years, and families.
1.2.3 Current Supply and Demand for Housing
In 2005 the Coalfield Housing Market Renewal Study indicated the decision to
demolish 217 terraced houses in Chilton in order to regenerate the west of the town.
It was envisaged at this time that there would be the construction of 60 new family
homes. New homes in Chilton have been identified and there are two sites in
particular that could deliver a mixture of social and affordable housing suitable for
families and older persons.
livin Housing Stock
livin currently owns and manages a total of 450
properties in the area of Chilton and Chilton Lane
(livin, 2011). This includes: 27% of properties that
are two bedroom bungalows, 19% that are two
bedroom houses and 27% that are three bedroom
properties. There are only 16, four bedroom
houses in total in Chilton and Chilton Lane.
Ownership of these properties transferred to livin
in March 2009 as part of a stock transfer from the
now disbanded Sedgefield Borough Council.
These properties are located in three areas within the community, 266 in the
Windlestone area, 177 in Chilton, and 7 in Chilton Lane. Overall, these properties
include one, two and three bedroom bungalows and one, two, three and four
bedroom houses together with a number of bedsits, flats and maisonettes. A
breakdown of the property types in each area together with the age ranges of the
tenants who live in them can be seen in the following tables.
livin owns 450
properties in the
community; 49% of
these are
bungalows.
20
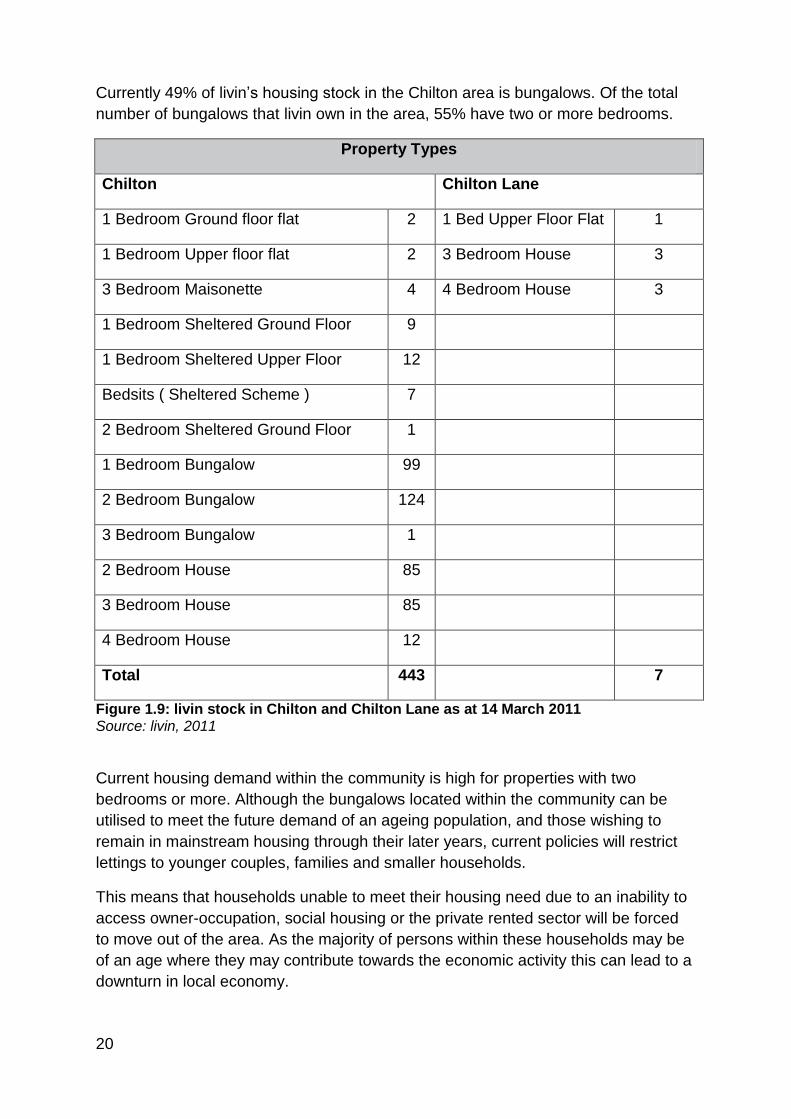
Currently 49% of livin’s housing stock in the Chilton area is bungalows. Of the total
number of bungalows that livin own in the area, 55% have two or more bedrooms.
Property Types
Chilton Chilton Lane
1 Bedroom Ground floor flat 2 1 Bed Upper Floor Flat 1
1 Bedroom Upper floor flat 2 3 Bedroom House 3
3 Bedroom Maisonette 4 4 Bedroom House 3
1 Bedroom Sheltered Ground Floor 9
1 Bedroom Sheltered Upper Floor 12
Bedsits ( Sheltered Scheme ) 7
2 Bedroom Sheltered Ground Floor 1
1 Bedroom Bungalow 99
2 Bedroom Bungalow 124
3 Bedroom Bungalow 1
2 Bedroom House 85
3 Bedroom House 85
4 Bedroom House 12
Total 443 7
Figure 1.9: livin stock in Chilton and Chilton Lane as at 14 March 2011 Source: livin, 2011
Current housing demand within the community is high for properties with two
bedrooms or more. Although the bungalows located within the community can be
utilised to meet the future demand of an ageing population, and those wishing to
remain in mainstream housing through their later years, current policies will restrict
lettings to younger couples, families and smaller households.
This means that households unable to meet their housing need due to an inability to
access owner-occupation, social housing or the private rented sector will be forced
to move out of the area. As the majority of persons within these households may be
of an age where they may contribute towards the economic activity this can lead to a
downturn in local economy.
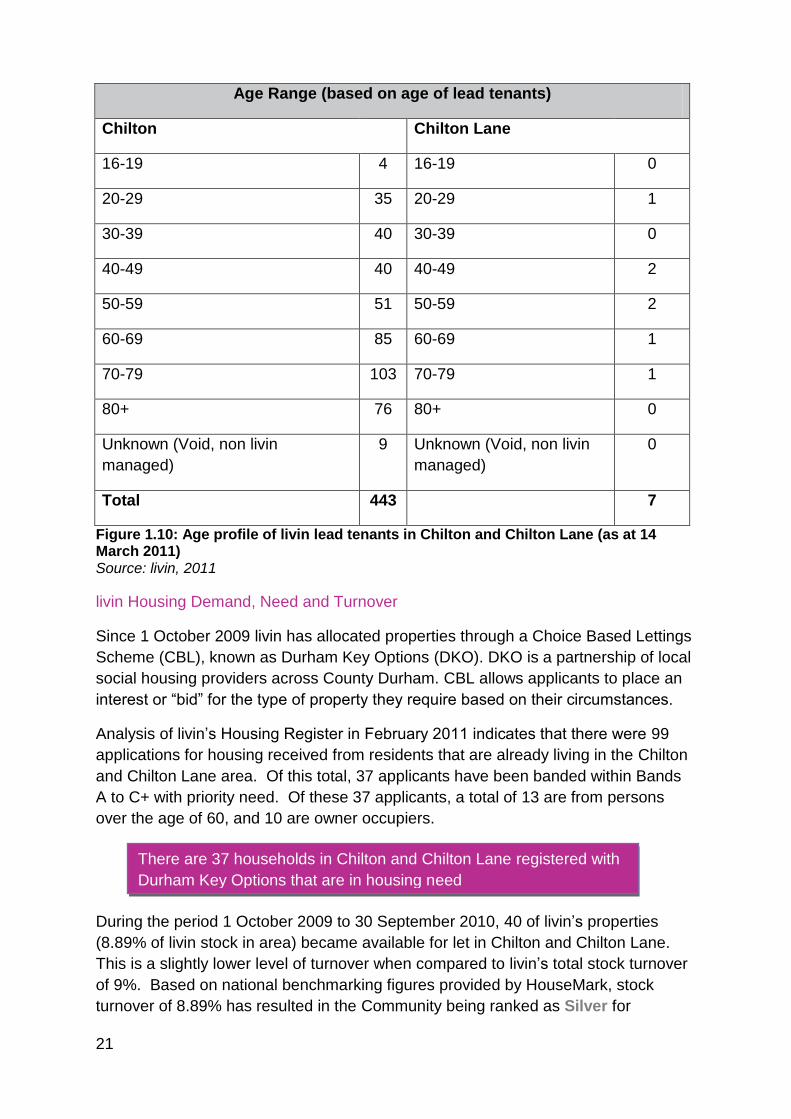
21
Age Range (based on age of lead tenants)
Chilton
Chilton Lane
16-19 4 16-19 0
20-29 35 20-29 1
30-39 40 30-39 0
40-49 40 40-49 2
50-59 51 50-59 2
60-69 85 60-69 1
70-79 103 70-79 1
80+ 76 80+ 0
Unknown (Void, non livin
managed)
9 Unknown (Void, non livin
managed)
0
Total 443 7
Figure 1.10: Age profile of livin lead tenants in Chilton and Chilton Lane (as at 14 March 2011) Source: livin, 2011
livin Housing Demand, Need and Turnover
Since 1 October 2009 livin has allocated properties through a Choice Based Lettings
Scheme (CBL), known as Durham Key Options (DKO). DKO is a partnership of local
social housing providers across County Durham. CBL allows applicants to place an
interest or “bid” for the type of property they require based on their circumstances.
Analysis of livin’s Housing Register in February 2011 indicates that there were 99
applications for housing received from residents that are already living in the Chilton
and Chilton Lane area. Of this total, 37 applicants have been banded within Bands
A to C+ with priority need. Of these 37 applicants, a total of 13 are from persons
over the age of 60, and 10 are owner occupiers.
During the period 1 October 2009 to 30 September 2010, 40 of livin’s properties
(8.89% of livin stock in area) became available for let in Chilton and Chilton Lane.
This is a slightly lower level of turnover when compared to livin’s total stock turnover
of 9%. Based on national benchmarking figures provided by HouseMark, stock
turnover of 8.89% has resulted in the Community being ranked as Silver for
There are 37 households in Chilton and Chilton Lane registered with
Durham Key Options that are in housing need
22
Demand for two bedroom
bungalows is high with a total of
268 bids being received for a total
of 11 properties.
Tenancy Turnover. Further details on the methodology used to achieve this ranking
can be found in Appendix 2.
To maintain sustainability within a community there will always be a need for some
level of tenancy turnover. However, it is important that turnover does not reach a
level where it becomes detrimental to housing demand, the reputation of the area or
the local economy. At this time livin is unable to provide further analysis on the
reasons for tenancy turnover within the
community.
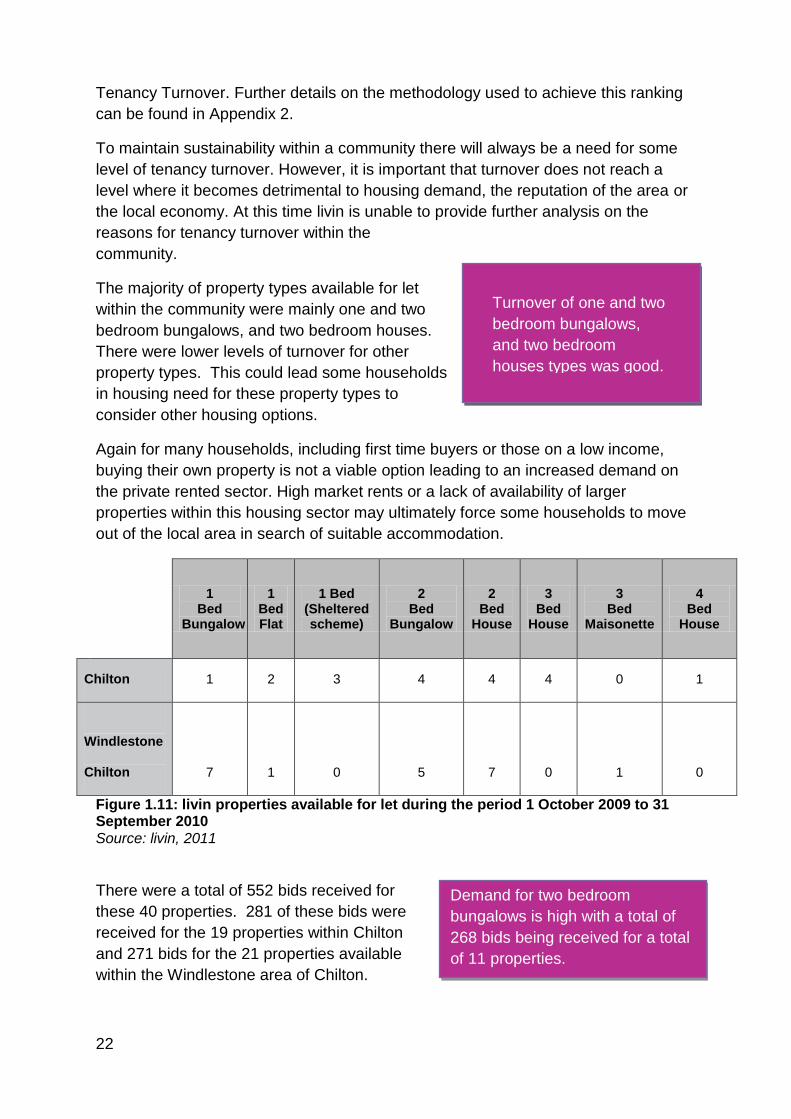
The majority of property types available for let
within the community were mainly one and two
bedroom bungalows, and two bedroom houses.
There were lower levels of turnover for other
property types. This could lead some households
in housing need for these property types to
consider other housing options.
Again for many households, including first time buyers or those on a low income,
buying their own property is not a viable option leading to an increased demand on
the private rented sector. High market rents or a lack of availability of larger
properties within this housing sector may ultimately force some households to move
out of the local area in search of suitable accommodation.
1 Bed
Bungalow
1 Bed Flat
1 Bed (Sheltered scheme)
2 Bed
Bungalow
2 Bed
House
3 Bed
House
3 Bed
Maisonette
4 Bed
House
Chilton 1 2 3 4 4 4 0 1
Windlestone
Chilton 7 1 0 5 7 0 1 0
Figure 1.11: livin properties available for let during the period 1 October 2009 to 31 September 2010 Source: livin, 2011
There were a total of 552 bids received for
these 40 properties. 281 of these bids were
received for the 19 properties within Chilton
and 271 bids for the 21 properties available
within the Windlestone area of Chilton.
Turnover of one and two
bedroom bungalows,
and two bedroom
houses types was good.
23
There is low demand for one
bedroom bungalows and no
demand for livin’s sheltered
scheme
Based on the total number of bids received the property type with the highest
demand is a two bedroom house which received on average 24 bids per property
available.
Policy decisions and legislation will affect the levels of demand for particular house
types. Increased demand for two bedroom houses could be due to need and
eligibility from several needs groups, including families, couples and single people,
whereas three and four bedroom properties will only be eligible for families to rent,
and bungalows for older persons or those with medical need. It is therefore important
that lettings policies are regularly reassessed to reflect the supply of housing and the
current levels of demand with the aim of promoting sustainability within an area.
Demand was low for three bed maisonettes with only one bid being made for the one
available property. There was also low demand for one bedroom bungalows with
only 48 bids being received for these eight
properties. Only six bids were received for the four
bedroom house and there was no demand for the
property located within livin’s sheltered scheme at
Rosewood Grange.
Throughout the County there is currently an increased demand for bungalows with
two bedrooms or more (County Durham Strategic Housing Market Assessment,
2010). Chilton and Chilton Lane have the fifth highest stock percentage (50%) of
bungalows when compared to all livin’s 19 communities. From livin’s total stock of
bungalows (224) in Chilton and Chilton Lane, only 124 are two bedrooms. There is
one, three bedroom and the remaining 99 bungalows are one bedroom.
Consideration of the area’s current population and the 2028 forecasted population
projection by DCC indicates that this demand for larger sized bungalows will
continue to increase over the next 10 years.
The presence of an ageing population within the community, in conjunction with high
levels of demand for two bedroom bungalows and very low demand for properties
within livin sheltered schemes highlights a clear need for livin to review its provision
of accommodation for older persons to meet the current and future housing need of
the local population.
Of the 40 properties available to let in the Chilton and Chilton Lane community
during the period 1 October 2009 to 30 September 2010, nine were required to be
advertised with CBL on three or more consecutive bidding cycles. These properties
were predominantly located in livin’s sheltered accommodation.
Although bids may have been received for a property within each individual bidding
cycle they were not allocated for let due to the applicants declining interest, the
property being unsuitable due to size or the bid being withdrawn before offer. Data
collection limitations do not currently allow further analysis of this data.
24
Housing is a topical issue in the town and the community wish to see further
development and the provision of affordable houses. The community identified an
issue with poorly managed private rented properties and the need for regeneration
plans to continue.
Data from DKO’s database indicates a good level of demand for livin housing. There
were high levels of bids received per property advertised however a small
percentage of the properties were hard to let thus the community has been ranked
as SILVER.
1.2.4 livin Tenancy Sustainment
There is a high percentage of long term tenancy sustainment within the 450
properties owned by livin in Chilton and Chilton Lane community. These high levels
of tenancy sustainment are reflected in the low level of turnover of some livin
property types in the community.
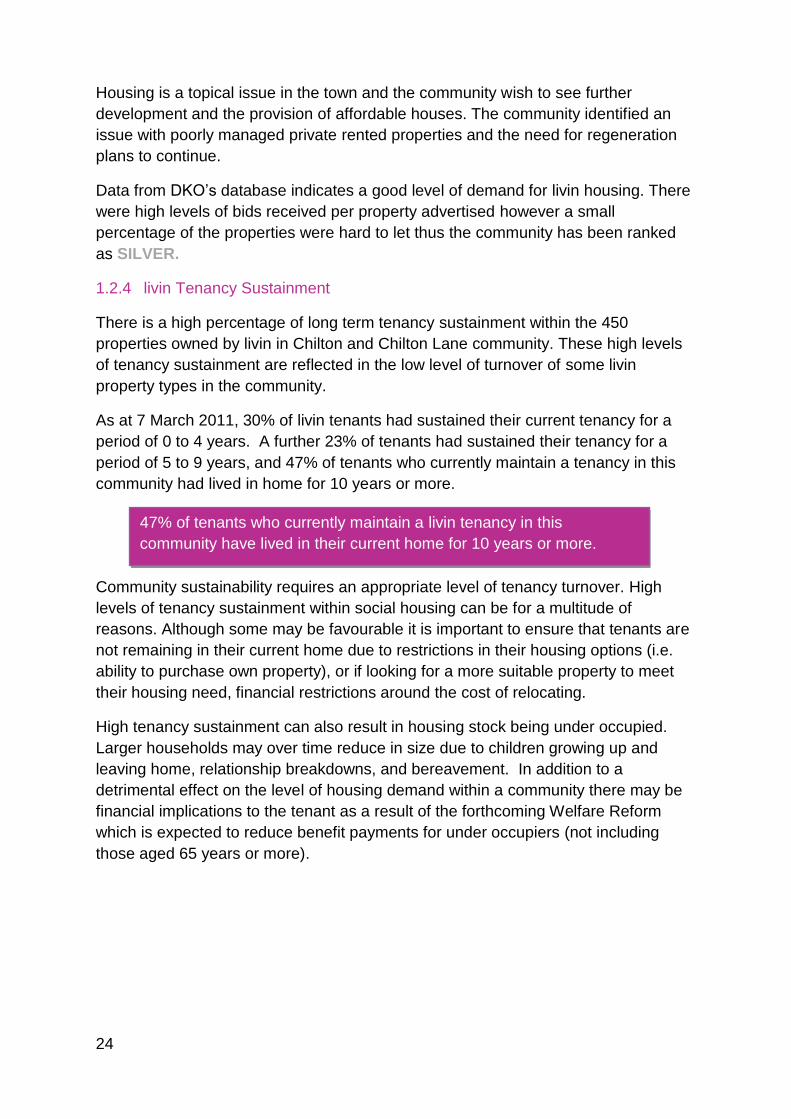
As at 7 March 2011, 30% of livin tenants had sustained their current tenancy for a
period of 0 to 4 years. A further 23% of tenants had sustained their tenancy for a
period of 5 to 9 years, and 47% of tenants who currently maintain a tenancy in this
community had lived in home for 10 years or more.
Community sustainability requires an appropriate level of tenancy turnover. High
levels of tenancy sustainment within social housing can be for a multitude of
reasons. Although some may be favourable it is important to ensure that tenants are
not remaining in their current home due to restrictions in their housing options (i.e.
ability to purchase own property), or if looking for a more suitable property to meet
their housing need, financial restrictions around the cost of relocating.
High tenancy sustainment can also result in housing stock being under occupied.
Larger households may over time reduce in size due to children growing up and
leaving home, relationship breakdowns, and bereavement. In addition to a
detrimental effect on the level of housing demand within a community there may be
financial implications to the tenant as a result of the forthcoming Welfare Reform
which is expected to reduce benefit payments for under occupiers (not including
those aged 65 years or more).
47% of tenants who currently maintain a livin tenancy in this
community have lived in their current home for 10 years or more.
25
Figure 1.12: livin tenancy sustainment in Chilton and Chilton Lane Source: livin, 2011 (not including void properties or non livin managed properties)
1.2.5. Vacant/Abandoned Properties
High levels of void or empty properties can be a strong indicator of low demand
housing within an area. Chilton and Chilton Lane have a low percentage of housing
stock consisting of empty and/or abandoned properties; indicating a good level of
demand for housing within this community.
Data obtained from DCC’s Council Tax database at the end of December 2010
indicates there are currently 59 possible empty and/or abandoned properties (this
figure may include properties that are currently for sale) in Chilton and a further 36 in
Chilton Lane therefore totalling 95 for this community. Based on a total of 2,588
domestic dwellings (Office for National Statistics, March 2009) in the community this
represents 3.7% of the total dwelling stock. Data collection limitations have restricted
further detailed analysis of this information.
134
102
207
0
50
100
150
200
250
0 - 4 years 5 - 9 years 10 years +
Nu
mb
er
of
Ten
an
cie
s
Length of Tenancy
26
What does this mean for livin?
Demand for livin housing in this community has been ranked as Silver. Consideration
must be made to improving aspects of the community to improve demand, such as
the local environment, reputation and regeneration. When these external issues are
addressed then the potential is for demand within the community to increase.
In the meantime it is important that current housing stock is able to meet the demand
for housing within an area. Nearly half of livin’s housing in Chilton and Chilton Lane
is for older people; however the general population is dominated by persons aged 16
to 64 years old.
Low demand for sheltered housing indicates that this property type is no longer
meeting housing demand in the area resulting in the need for a review of livin’s
housing provision for older persons.
Key Supply and Demand Characteristics:
livin currently owns 450 properties in the Community; 49% of these properties are
bungalows.
Over 55% of these bungalows have two bedrooms or more.
37% of applicants on the housing register that currently live in the community were
classed as having a Housing Need (Bands A to C+)
During 1 October 2009 to 30 September 2010, 40 properties became available for
let; making tenancy turnover within the community 8.89%.
Demand for properties with two bedrooms or more is high. There is a high
demand County wide for these property types. Demand is lower or one bedroom
bungalows and bedsits.
There were only 6 bids received for a four bedroom house.
There is very low demand for property within livin’s supported housing scheme.
livin’s lettings policy normally restricts the letting of bungalows to persons aged 60
years or less, unless there is a medical need. This restricts the availability of social
housing within the community for households that do not meet the eligibility
criteria for a bungalow.
46% of livin tenants living within the community have sustained their tenancy for a
period of 10 years or more.
Community sustainability requires an appropriate level of tenancy turnover. It is
important that consideration be given to the reasons behind high levels of
sustainment to ensure residents are not being forced to remain in their current home
due to restrictions in their housing options or financial circumstances.
27
livin must consider that local residents are concerned about the rising costs of
housing related repairs and how current mortgage and lending restrictions are
increasing the levels of demand for social housing within the community. There must
be consideration for affordable housing that will meet the need of the wider
community.
Community sustainability requires an appropriate level of tenancy turnover. It is
important that consideration be given to the reasons behind high levels of
sustainment to ensure residents are not being forced to remain in their current home
due to restrictions in their housing options or financial circumstances.
1.2.6 Future Demand for Housing
Population and household projections for an area can be used by local service
providers to predict the future levels of demand on their services. In conjunction with
other social, economic, and environmental indicators these projections can be used
to forecast the demand and need for housing in an area.
DCC has recently conducted a Strategic Housing Market Assessment (DCC, 2010)
which can be used by registered housing providers to help determine the expected
level of demand for housing through the coming years and develop future housing
strategies. The following population and household projections are based on this
assessment and on other intelligence gathered during the completion of this
Community Plan.
It is expected that the vast majority of older persons will decide to remain in their own
homes with mainstream housing providing the primary means of meeting this
demand. There will be action required by local housing providers to support this,
including extra support services and help for people to adapt their homes to meet
their changing needs. Some vulnerable groups will require support or bespoke
housing solutions and it is expected that there will be a sharp growth in demand for
specialist housing projects for persons aged 75 years or older during the coming
years. The supply of housing available for other household groups will be affected by
the number of older persons that remain in their homes. As a result it is important
that local housing providers recognise the potential opportunities for supporting older
households to downsize thus releasing the supply of larger family homes for other
household groups.
In recognition of this increased demand on mainstream housing the Northern
Housing Consortium (NHC) published a guide to Age Friendly Communities in the
North: People and Places 2020.
This publication is the result of a two year project surrounding consultation with local
communities and key Consortium members, and focuses on building an evidence
base to demonstrate the impact housing can have on the physical and mental health
and wellbeing of older people.
28
Any future reviews conducted by livin into the suitability of its housing stock, or
further development of asset management strategies will require careful
consideration of these population projections and NHC findings.
What does this mean for livin?
The appraisal of livin’s current housing stock or the delivery of any new properties
within the community must take into account future population projections. It is
important that the housing stock within a community is able to meet the predicted
needs of smaller households and will enable older persons to remain in their home
through their senior years.
Anticipation of an ageing population and poor demand for livin’s sheltered housing
scheme highlights the requirement for livin to review its current provision of housing
stock for older persons.
livin’s Development and Asset Management strategies must take into account future
population projections and consider the expected demand for social housing within
the community to ensure the housing stock meets the needs of local residents. This
will see livin be required to consider housing and meeting the need of an elderly
Key Future Demand Characteristics:
An ageing population, and fall in the number of persons economically active by
2026 will place an increased demand on fiscal, housing and health provisions.
By 2030 the County is expected to see:
Single person households increase by 100.3%.
Two person households increase by only 18%.
Households of 3 persons or more decrease by 26.9%.
The majority of older persons will want to remain in their own homes through
their senior years. This will place an increased demand on mainstream and
social housing.
Anticipation of an ageing population and poor demand for livin’s sheltered
housing scheme highlights the requirement for livin to review its current
provision of housing stock for older persons.
Increased future demand is expected for support services for vulnerable
groups, and a need for bespoke housing solutions or specialist housing
projects for persons aged 75 years or more.
There are potential opportunities for housing providers to support older
households to downsize thus releasing the supply of larger family homes for
other household groups.
29
population and finding bespoke solutions to meet the individual needs of vulnerable
groups.
There are potential opportunities for housing providers to support older households
to downsize thus releasing the supply of larger family homes for other household
groups.
1.2.7 Average cost of Repairs to livin properties
The repair and maintenance of livin’s properties is essential to ensure that they
remain in excellent condition and to the high standards expected by tenants.
During the period 1 April 2009 to 31 March 2010 livin, together with their repairs and
maintenance partner Mears, completed 1,756 repairs (including Gas Safety) to
properties in the Chilton and Chilton Lane community. 28% of these repairs were
emergency repairs which required immediate attention.
Chilton and Chilton Lane have been awarded a ranking of SILVER for average repair
costs per property. Full details of the methodology used for this ranking can be
found in Appendix 2.
1.2.8 Average cost of Improvement Programmes for livin properties
Over the next few years, and as part of the promises to tenants, livin is investing
over 100 million pounds on a rolling programme of modernisation and property
improvements. During 2009/10, 255 properties in Chilton and Chilton Lane were
modernised at an average cost of £3,319.88 per property.
The modernisation and improvement programme is to a much higher standard of
works than that of the Government's Decent Homes Standard and includes:
New Kitchens
New Bathrooms
Central Heating Replacement
Electrical Works
Internal and External Door Replacement
Roofing works
There are a number of factors that determine which improvement works are
undertaken at each property as part of the improvement programme in each
During 2009/10, livin spent an average repair cost of £642.74 per property in
Chilton and Chilton Lane
.
During 2009/10 average cost per property for the modernisation and
improvement of 255 properties in Chilton and Chilton Lane was £3,319.88.
30
community. For example some properties may only receive new internal and
external doors, whereas other may be due to new internal and external doors plus
the replacement of the kitchen and bathroom.
What does this mean for livin?
The community has a reasonable repair cost per property resulting in a ranking of
Silver. Over one quarter of the repairs required to livin’s properties in the community
during 2009/10 were emergencies. Investigation into the causes of these repairs
may be considered in an attempt to further minimise the amount of emergency
repairs required within livin’s properties.
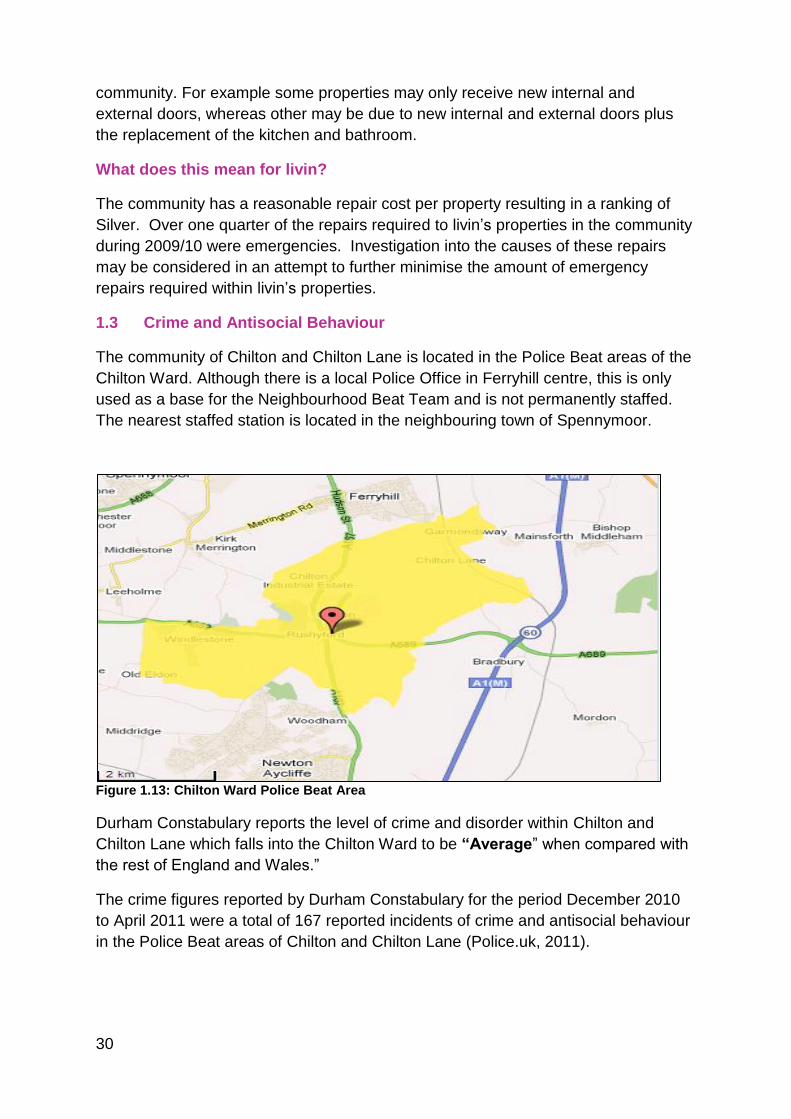
1.3 Crime and Antisocial Behaviour
The community of Chilton and Chilton Lane is located in the Police Beat areas of the
Chilton Ward. Although there is a local Police Office in Ferryhill centre, this is only
used as a base for the Neighbourhood Beat Team and is not permanently staffed.
The nearest staffed station is located in the neighbouring town of Spennymoor.
Figure 1.13: Chilton Ward Police Beat Area
Durham Constabulary reports the level of crime and disorder within Chilton and
Chilton Lane which falls into the Chilton Ward to be “Average” when compared with
the rest of England and Wales.”
The crime figures reported by Durham Constabulary for the period December 2010
to April 2011 were a total of 167 reported incidents of crime and antisocial behaviour
in the Police Beat areas of Chilton and Chilton Lane (Police.uk, 2011).
31
Of these total reported incidents, 50% related to antisocial behaviour and 30%
related to other crimes including criminal damage, shoplifting and drugs. A total of
20% of the reported incidents were in relation to robbery, burglary, vehicle crime and
violence.
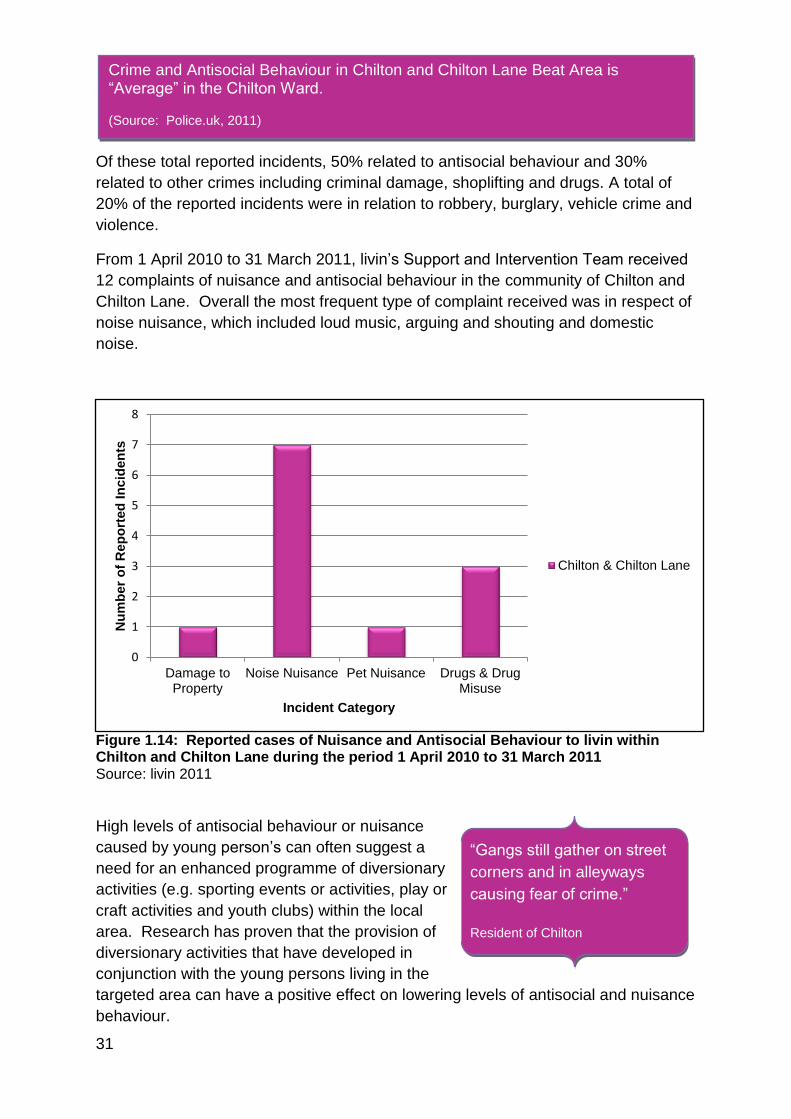
From 1 April 2010 to 31 March 2011, livin’s Support and Intervention Team received
12 complaints of nuisance and antisocial behaviour in the community of Chilton and
Chilton Lane. Overall the most frequent type of complaint received was in respect of
noise nuisance, which included loud music, arguing and shouting and domestic
noise.
Figure 1.14: Reported cases of Nuisance and Antisocial Behaviour to livin within Chilton and Chilton Lane during the period 1 April 2010 to 31 March 2011 Source: livin 2011
High levels of antisocial behaviour or nuisance
caused by young person’s can often suggest a
need for an enhanced programme of diversionary
activities (e.g. sporting events or activities, play or
craft activities and youth clubs) within the local
area. Research has proven that the provision of
diversionary activities that have developed in
conjunction with the young persons living in the
targeted area can have a positive effect on lowering levels of antisocial and nuisance
behaviour.
Crime and Antisocial Behaviour in Chilton and Chilton Lane Beat Area is “Average” in the Chilton Ward. (Source: Police.uk, 2011)
“Gangs still gather on street
corners and in alleyways
causing fear of crime.”
Resident of Chilton
0
1
2
3
4
5
6
7
8
Damage toProperty
Noise Nuisance Pet Nuisance Drugs & DrugMisuse
Nu
mb
er
of
Rep
ort
ed
In
cid
en
ts
Incident Category
Chilton & Chilton Lane
32
Durham Constabulary’s reported crime figures and the complaints received by the
Support and Intervention Team closely mirrors the issues raised by residents during
livin’s consultation events. Local residents highlighted issues relating to an
increased usage of illegal drugs in the community and problems surrounding young
people on the streets whose behaviour is generating a fear of crime. These views
are reflected in Durham Constabulary’s reported crime data which indicates that
antisocial behaviour and drug use equates to more than three quarters of all reported
incidents.
Consultation completed by DCC for the 4 Together AAP indicates that youths
congregating on local streets is a County wide issue and the main reason residents
feel unsafe living in their local area. 3% of residents living in the 4 Together area
(Ferryhill, Chilton, West Cornforth and Bishop Middleham) stated they felt unsafe in
their local communities during the day and 14% felt unsafe during the evening.
These findings were further confirmed during livin’s consultation events when it was
remarked that they did not feel safe in their local area due to a fear of burgulary,
drugs issues and the presence of youths congregating on the streets with a
preceived lack of respect. Residents also felt there was a need for improved street
lighting in specific areas, especially around local alleyways and footpaths.
There was also a fear that ongoing budgetary reductions being imposed by local
Police Authorities would see the removal of the local Police Beat Officers from the
community. Currently Durham Constabularly provide a dedicated Police Beat Team
that carry out high visability patrols throughout local communities with the aim of
detering crime and antisocial behaviour.
33
What does this mean for livin?
It is important that livin maintain its commitment to providing a robust and responsive
service for dealing with incidents of noise and antisocial behaviour within our local
communities.
Partnership working with the Police, DCC and other agencies is essential when
dealing with crime and antisocial behaviour. livin is already a contributing partner to
the Safer Durham Partnership and plays an important role in supporting the
partnership make people feel safer within their local communities.
1.4 Economy and Employment
1.4.1 Economic Activity
During 2001 economic activity within Chilton and Chilton Lane was 63.90%;
marginally higher than the County average of 60.17% (Census, 2001, LLSOA
KS09A, 006B, 006C and 006D).
Key Crime and Antisocial Behaviour Characteristics:
The level of crime and disorder within Chilton and Chilton Lane is considered by the
Police to be “Average” when compared to the rest of England and Wales.
From December 2010 to April 2011 there were 167 reported Police incidents in the
Beat areas of Chilton Ward:
50% of reported incidents were in respect of antisocial behaviour.
30% of incidents related to other crimes, such as criminal damage, shoplifting and
drugs.
20% of incidents related to robbery, burglary, vehicle crime and violence.
During 1 April 2010 and 31 March 2011, livin’s Support and Intervention Team
received 12 complaints of antisocial behaviour and nuisance. The majority of
complaints related to noise nuisance.
A recent AAP survey found that 14% of residents living in the areas of Bishop
Middleham, Ferryhill, Chilton and West Cornforth felt unsafe in their communities
during the evening.
Resident stated they felt fearful for their safety in the community as a result of
localised binge drinking, drug use and young people “hanging” about on the streets.
Increased reports of antisocial and nuisance behaviour caused by young people can
highlight a need for a robust programme of diversionary activities that local
youths want to engage with.

34
“Economic activity relates to persons aged 16 to 74 years who are in employment, or
actively seeking employment and are available to start work within 2 weeks.”
(Source: Census 2001)
Of this total economic activity 41.61% were in full time employment and 11.07% in
part time employment. Only 5.36% of persons were self-employed; this being
comparable to the Durham County average of 5.38%. The percentage of residents
that are unemployed (4.65%) is higher than the County average. It is acknowledged
that as a result of the current economic climate the level of economic activity within
the community may have changed since this data was collated in 2001.
Figure 1.15: Economic Activity in Chilton and Chilton Lane Source: Census, 2001, LLSOA KS09A, 006B, 006C and 006D
The consultation events held by livin led to residents highlighting the need for more
shops within the front street of Chilton as the perception is the bypass road has
taken away customers and reduced passing trade.
Residents remarked that the number of cuts to Public Sector jobs and the
contraction of the local economy were concerns to the overall sustainability of
Chilton’s economy and has the potential to force local residents to travel out of
Chilton in search of lower cost consumables and more variety of goods.
During 2001 economic activity within Chilton and Chilton Lane was 63.90%;
marginally higher than the County average of 60.17%.
(Census, 2001, LLSOA KS09A, 004B, 004C, 004D and 006A)
11.07
41.61
5.36 4.65
1.21
10.73
38.48
5.38 3.74 1.84
0
5
10
15
20
25
30
35
40
45
EmployeesPart-time
EmployeesFull-time
SelfEmployed
Unemployed Students
%
Chilton & ChiltonLane
Durham County
35
This necessity to travel is currently being hampered by rising fuel costs and the
affordability of car ownership; together with an increased reliance on what is seen by
residents to be an unreliable and irregular bus service to surrounding areas.
However, residents are hopeful that the development of the Dalkia project in Chilton
and the Durham Gate site at Spennymoor together with the future provision of a new
Hitachi factory in Newton Aycliffe will help to boost economic activity and help to
maintain and/or improve employment levels for local residents.
2001 Census data indicates that residents within Chilton and Chilton Lane are
employed in a wide range of different occupations (Census, 2001, LLSOA KS12A,
006B, 006C and 006D).
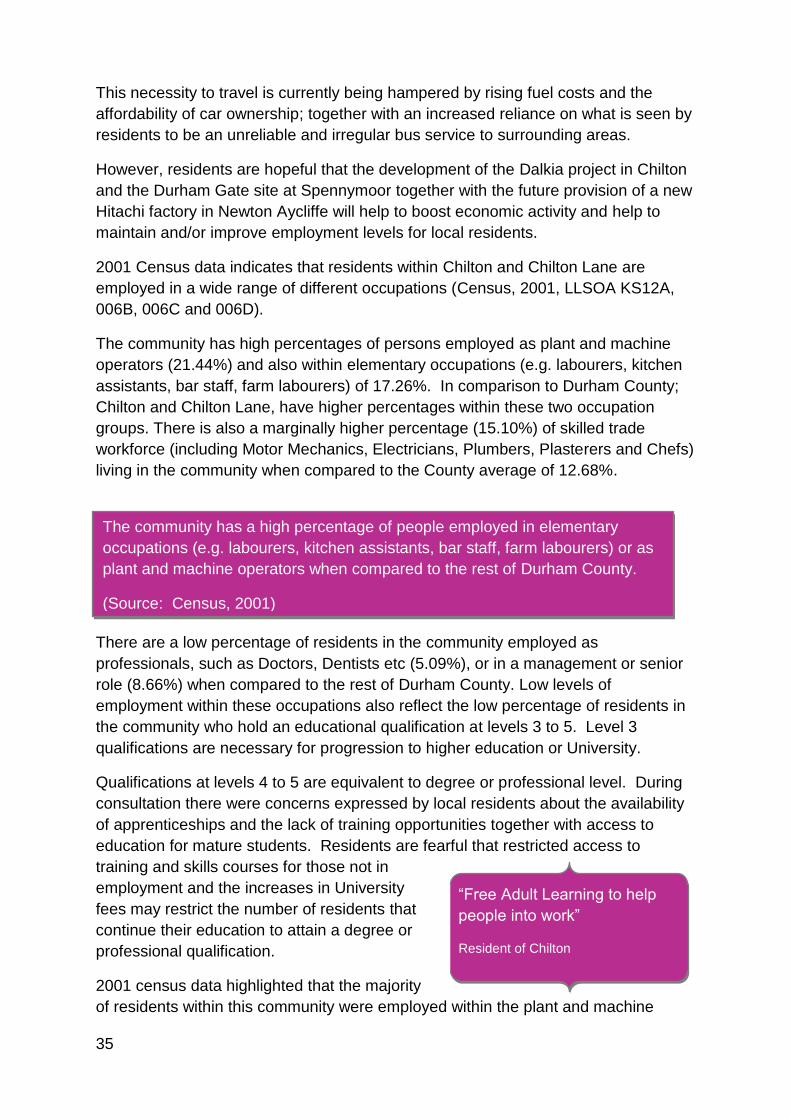
The community has high percentages of persons employed as plant and machine
operators (21.44%) and also within elementary occupations (e.g. labourers, kitchen
assistants, bar staff, farm labourers) of 17.26%. In comparison to Durham County;
Chilton and Chilton Lane, have higher percentages within these two occupation
groups. There is also a marginally higher percentage (15.10%) of skilled trade
workforce (including Motor Mechanics, Electricians, Plumbers, Plasterers and Chefs)
living in the community when compared to the County average of 12.68%.
There are a low percentage of residents in the community employed as
professionals, such as Doctors, Dentists etc (5.09%), or in a management or senior
role (8.66%) when compared to the rest of Durham County. Low levels of
employment within these occupations also reflect the low percentage of residents in
the community who hold an educational qualification at levels 3 to 5. Level 3
qualifications are necessary for progression to higher education or University.
Qualifications at levels 4 to 5 are equivalent to degree or professional level. During
consultation there were concerns expressed by local residents about the availability
of apprenticeships and the lack of training opportunities together with access to
education for mature students. Residents are fearful that restricted access to
training and skills courses for those not in
employment and the increases in University
fees may restrict the number of residents that
continue their education to attain a degree or
professional qualification.
2001 census data highlighted that the majority
of residents within this community were employed within the plant and machine
The community has a high percentage of people employed in elementary
occupations (e.g. labourers, kitchen assistants, bar staff, farm labourers) or as
plant and machine operators when compared to the rest of Durham County.
(Source: Census, 2001)
“Free Adult Learning to help
people into work”
Resident of Chilton
36
processing industry. Over the past ten years this type of industry has been one of the
hardest hit resulting in many large scale local employers, including Black and
Decker, Flymo, Thorn and Electrolux relocating, ceasing to trade or downscaling.
This reduction in local job opportunities within the industry, together with a high
percentage of residents that hold no educational qualifications indicates a need for
an increased provision of skills and training courses. This can help local residents to
retrain or gain new qualifications, skills and experience thus assisting them back into
long term employment.
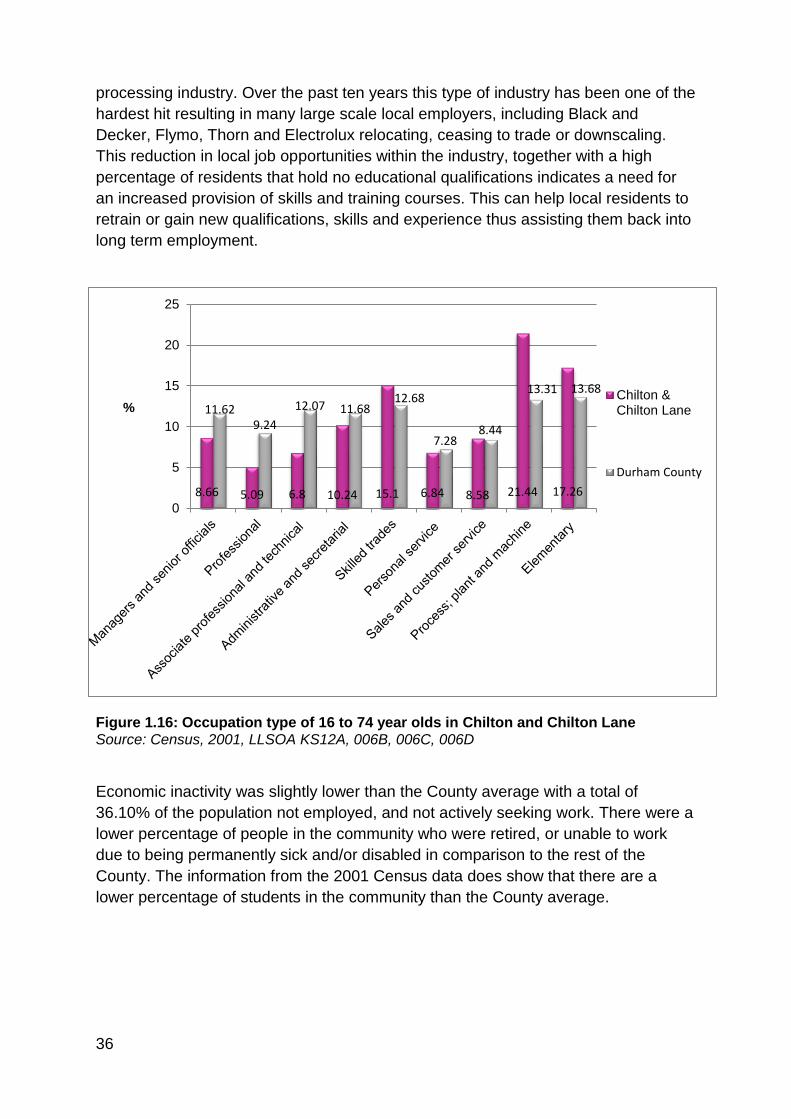
Figure 1.16: Occupation type of 16 to 74 year olds in Chilton and Chilton Lane Source: Census, 2001, LLSOA KS12A, 006B, 006C, 006D
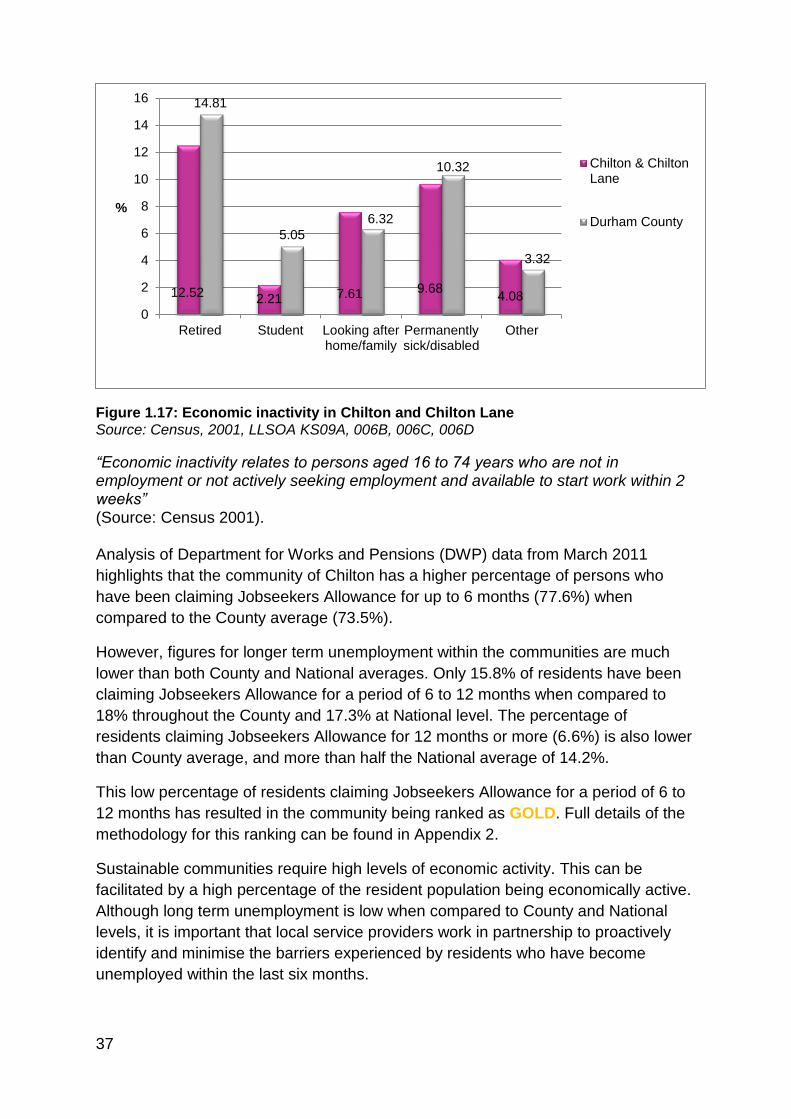
Economic inactivity was slightly lower than the County average with a total of
36.10% of the population not employed, and not actively seeking work. There were a
lower percentage of people in the community who were retired, or unable to work
due to being permanently sick and/or disabled in comparison to the rest of the
County. The information from the 2001 Census data does show that there are a
lower percentage of students in the community than the County average.
8.66 5.09 6.8 10.24 15.1 6.84 8.58 21.44 17.26
11.62 9.24
12.07 11.68 12.68
7.28 8.44
13.31 13.68
0
5
10
15
20
25
%
Chilton &Chilton Lane
Durham County
37
Figure 1.17: Economic inactivity in Chilton and Chilton Lane Source: Census, 2001, LLSOA KS09A, 006B, 006C, 006D
“Economic inactivity relates to persons aged 16 to 74 years who are not in employment or not actively seeking employment and available to start work within 2 weeks” (Source: Census 2001). Analysis of Department for Works and Pensions (DWP) data from March 2011
highlights that the community of Chilton has a higher percentage of persons who
have been claiming Jobseekers Allowance for up to 6 months (77.6%) when
compared to the County average (73.5%).
However, figures for longer term unemployment within the communities are much
lower than both County and National averages. Only 15.8% of residents have been
claiming Jobseekers Allowance for a period of 6 to 12 months when compared to
18% throughout the County and 17.3% at National level. The percentage of
residents claiming Jobseekers Allowance for 12 months or more (6.6%) is also lower
than County average, and more than half the National average of 14.2%.
This low percentage of residents claiming Jobseekers Allowance for a period of 6 to
12 months has resulted in the community being ranked as GOLD. Full details of the
methodology for this ranking can be found in Appendix 2.
Sustainable communities require high levels of economic activity. This can be
facilitated by a high percentage of the resident population being economically active.
Although long term unemployment is low when compared to County and National
levels, it is important that local service providers work in partnership to proactively
identify and minimise the barriers experienced by residents who have become
unemployed within the last six months.
12.52 2.21 7.61 9.68
4.08
14.81
5.05
6.32
10.32
3.32
0
2
4
6
8
10
12
14
16
Retired Student Looking afterhome/family
Permanentlysick/disabled
Other
%
Chilton & ChiltonLane
Durham County
38
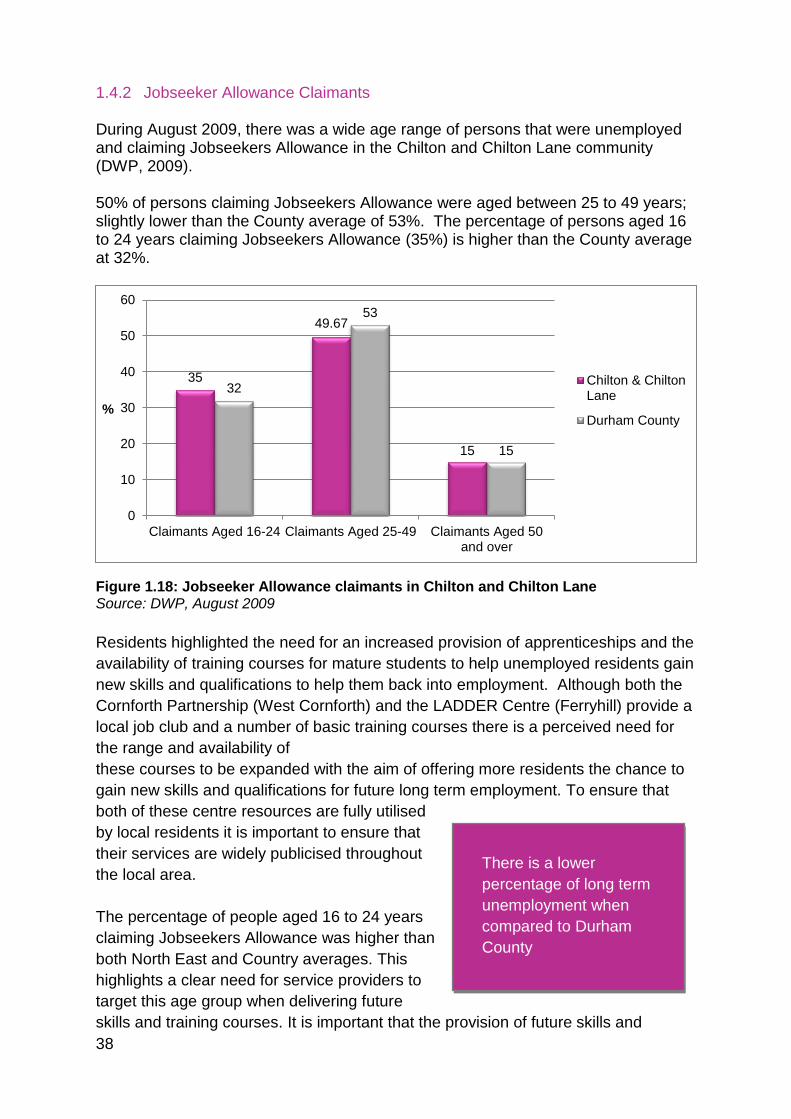
1.4.2 Jobseeker Allowance Claimants During August 2009, there was a wide age range of persons that were unemployed and claiming Jobseekers Allowance in the Chilton and Chilton Lane community (DWP, 2009). 50% of persons claiming Jobseekers Allowance were aged between 25 to 49 years; slightly lower than the County average of 53%. The percentage of persons aged 16 to 24 years claiming Jobseekers Allowance (35%) is higher than the County average at 32%.
Figure 1.18: Jobseeker Allowance claimants in Chilton and Chilton Lane Source: DWP, August 2009
Residents highlighted the need for an increased provision of apprenticeships and the
availability of training courses for mature students to help unemployed residents gain
new skills and qualifications to help them back into employment. Although both the
Cornforth Partnership (West Cornforth) and the LADDER Centre (Ferryhill) provide a
local job club and a number of basic training courses there is a perceived need for
the range and availability of
these courses to be expanded with the aim of offering more residents the chance to
gain new skills and qualifications for future long term employment. To ensure that
both of these centre resources are fully utilised
by local residents it is important to ensure that
their services are widely publicised throughout
the local area.
The percentage of people aged 16 to 24 years
claiming Jobseekers Allowance was higher than
both North East and Country averages. This
highlights a clear need for service providers to
target this age group when delivering future
skills and training courses. It is important that the provision of future skills and
There is a lower
percentage of long term
unemployment when
compared to Durham
County
35
49.67
15
32
53
15
0
10
20
30
40
50
60
Claimants Aged 16-24 Claimants Aged 25-49 Claimants Aged 50and over
%
Chilton & ChiltonLane
Durham County
39
training courses targeted at this age group will help individual’s meet their training
needs and future aspirations to help them gain long term employment.
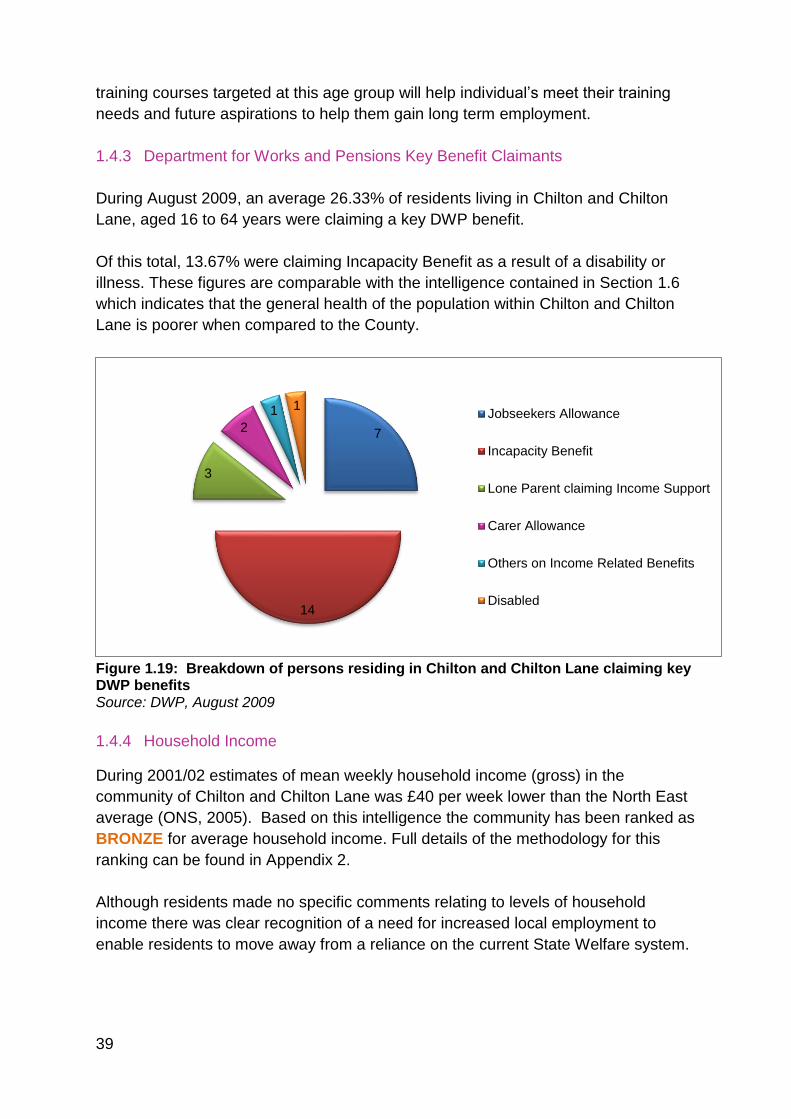
1.4.3 Department for Works and Pensions Key Benefit Claimants
During August 2009, an average 26.33% of residents living in Chilton and Chilton
Lane, aged 16 to 64 years were claiming a key DWP benefit.
Of this total, 13.67% were claiming Incapacity Benefit as a result of a disability or
illness. These figures are comparable with the intelligence contained in Section 1.6
which indicates that the general health of the population within Chilton and Chilton
Lane is poorer when compared to the County.
Figure 1.19: Breakdown of persons residing in Chilton and Chilton Lane claiming key DWP benefits Source: DWP, August 2009
1.4.4 Household Income
During 2001/02 estimates of mean weekly household income (gross) in the
community of Chilton and Chilton Lane was £40 per week lower than the North East
average (ONS, 2005). Based on this intelligence the community has been ranked as
BRONZE for average household income. Full details of the methodology for this
ranking can be found in Appendix 2.
Although residents made no specific comments relating to levels of household
income there was clear recognition of a need for increased local employment to
enable residents to move away from a reliance on the current State Welfare system.
7
14
3
2
1 1 Jobseekers Allowance
Incapacity Benefit
Lone Parent claiming Income Support
Carer Allowance
Others on Income Related Benefits
Disabled
40
livin must consider the rising cost of fuel charges and the impact of inflation upon the
cost of living and also how the affordability of these costs will begin to have a
detrimental impact on income and lifestyle.
1.4.5 Vehicle Ownership and cost of travel
In 2001, 34% of households in Chilton and Chilton Lane community did not own a
car or van; this being slightly higher than the County average of 31%. The remaining
66% of households owned one or more cars or vans (Census, 2001, LLSOA UV62,
006B, 006C, 006D).
Although levels of vehicle ownership may have altered since 2001, the rising cost of
fuel and other related costs will now have a significant impact on vehicle usage,
particularly amongst low income households. Low levels of vehicle ownership and
restricted use will affect residents’ lifestyles by restricting their access to services
and facilities outside of the local area.
Throughout the consultation process a number of residents expressed their concerns
about the increasing need for residents to travel outside of the local area for large
brand supermarkets, shopping and employment. This reliance on travel outside of
the local area, in conjunction with low levels of private vehicle ownership places an
increased need on a reliable public transport system. There are fears from residents
that ongoing budgetary reductions to rural transport services being imposed by DCC
will see many residents become more isolated and detached from obtaining
specialist services and restrict their ability to obtain sustainable employment.
41
1.4.6 Rental Debit in livin properties
To assess the rent payments made by tenants within livin properties in the
community of Chilton and Chilton Lane an analysis and comparison of the rental
debit figures for 2009/10 to 2010/11 has been undertaken.
For the financial year 2009/10, the total rental debit charge (rent charged for all of
livin’s properties in this community) was £1,475,610. At the end of this financial year
there was outstanding debit to pay (unpaid rent) of £17,113; making an unpaid rental
debit charge of 1.16%.
For the financial year 2010/11, the total rental debit charge was £1,488,438. At the
end of this financial year there was outstanding debit to pay of £12,762; making an
unpaid rental debit charge of 0.86%.
Based on the unpaid rental debit charge of 0.86% for 2010/11 the community of
Chilton and Chilton Lane has been ranked as Gold.
Key Economic characteristics:
During 2001/02 the weekly household income estimate was £40 less than the North
East average of £410.00.
During 2001, economic activity within Chilton and Chilton Lane community was
higher than the Durham County average.
36.10% of residents in 2001 were not in employment, and not actively seeking
work. 9.68% of residents were economically inactive due to being permanently sick
or disabled.
During 2001, 38.70% of residents were employed in low skilled job roles. Only
13.75% of residents are employed in professional or management roles.
During March 2011 the percentage of residents claiming jobseekers allowance as a
result of longer term unemployment (6 months or more) was low. However short
term unemployment (0 to 6 months) is higher than the County average.
The percentage of residents aged 16 to 24 years that are claiming jobseekers
allowance is higher when compared to the County average; highlighting a need for
local employability strategies and access into education and employment to be
targeted at this age range.
Health levels within the community are poor when compared to the county.
During August 2009, 26.33% of residents were claiming a key DWP Benefit.
13.67% of this total was claiming Incapacity Benefit.
By the end of the financial year 2010/11 livin reduced its outstanding rental debit
figure (unpaid rent) to 0.30%; a total of £4,351.
42
During livin’s consultation events a number of residents expressed concerns about
the amount of debt it is believed to exist in households in Chilton and Chilton Lane
which has increased the need for the provision of a local debt management service.
Residents state that this debt management service facilitated by the Citizens Advice
Bureau is under threat of being removed due to cuts in financial funding. This could
lead to increased problems for households experiencing debt and money worries.
What does this mean for livin?
Although livin will aim to reduce the outstanding rental debit year on year the current
economic climate and future reforms to the Welfare Benefits systems will provide for
challenging times.
These challenges will require livin to work proactively with tenants and other
household members by providing a dedicated Financial Inclusion Team to provide
advice, guidance or sign posting about money and debt management. With the
economic downturn this community could be vulnerable to job losses in
manufacturing or low skilled employment.
livin must consider the impact this may have and be aware of the contribution made
by partners in supporting resident and tenants to gain employment, skills, and
increase their economic well-being. We must support local community organisations
such as Chilton Partnership, Henderson Community House, Chilton Community
College and the LADDER Centre to ensure resources are fully utilised by local
residents and services are widely publicised throughout the local area. The LADDER
Centre currently provides skills based training courses but there is an identified need
for the range and availability of these courses to be expanded to help more local
residents, and specifically livin tenants, attain new skills and qualifications for
employment. Henderson Community House is looking to provide I.T courses in the
near future and currently provides a job club. Chilton Community College is looking
to provide ‘employability’ courses from September 2011.
It is evident from the analysis that any employability work undertaken by livin must
help reduce the amount of JSA claimants (as numbers are above average) and
specifically younger claimants aged 16 to 24 years.
Effects of the recession are felt in this community and livin must be mindful that
residents and tenants will need support through these financial difficulties. This could
mean signposting tenants and residents to debt and financial inclusion and support
agencies.
livin need to understand barriers to employment experienced by residents and
tenants and assess the level of support to be offered. During consultation residents
were apprehensive about a cut to bus services and this community has lower than
average car ownership; therefore travel to work has the potential to become a major
barrier to employment.
43
livin must be mindful that Chilton and Chilton Lane shows a low level of educational
attainment, and together with the loss of jobs within the plant and machine
processing industry highlights a need for increased provision of skills and training
courses to help local residents and tenants retrain or gain new qualifications. Without
some form of intervention many of livin’s tenants may be required to continue to rely
on the welfare benefit system
1.5 Access to Services and Facilities
Chilton is served by a small number of local shops, a health service and other public
amenities but residents have expressed a number of concerns regarding their
current suitability to the community they serve in respect of capacity and quantity.
Chilton Lane residents have stated they have few services.
There is a local GP surgery, Pharmacy and Dental surgery located within Chilton
which provides healthcare to local residents but the residents of Chilton Lane need
to travel to use these facilities. The recent regeneration in areas of Chilton has led to
the potential of a Health Centre incorporating the Pharmacy, Dentist and GP
Surgery, however this has yet to be confirmed or agreed but residents believe this
will be an asset to the community should the plans complete. The programme for this
was identified in the Coalfield Housing Renewal Study 2005 as an important aspect
of the regeneration of Chilton West.
During consultation some residents expressed concern that the population of Chilton
has increased but this is not reflected in the opening hours of the GP Surgery. They
hoped this could be explored together with the location of the Dentist service as this
is currently on the first floor of a building without disabled access thus restricting the
use by mobility restricted residents.
A local leisure centre, owned and managed by DCC, is located within Ferryhill
village. Recent public spending cuts has required the County Council to review their
current provision of local leisure facilities so the continuing future of the leisure
centre is uncertain at this time. The Leisure Centre also houses an indoor bowling
green and is home to Ferryhill Indoor Bowling Club which has over 150 members
from other local areas including the Trimdons, Fishburn, Sedgefield, and Newton
Aycliffe. Chilton has an outdoor bowling green which provides local accessibility but
the team has recently folded due to a drop in membership which may lead some
users to travel to this leisure centre.
Chilton is served by a number of local shops, health services and other public
amenities but the community does not believe the services meet the demand
or need of Chilton. The residents of Chilton Lane will need to travel to Chilton
to access these services.
44
There is a reliance on
public transport
Other leisure and outdoor activity facilities include; two football pitches, a double
floodlit tennis court, putting green, floodlit Multi-use games area, and an under-
construction ‘Skatepark’ with a potential completion date of June 2011.
There is a DCC ran library located within Chilton. There is free provision of internet
and email facilities and the library also contains a HealthZone information point.
HealthZone provides information and leaflets for local residents to help them adopt a
healthier lifestyle, learn more about an illness, or locate a local support group.
The HealthZone is located within a prominent place within the library, resulting in a
number of persons that visit the library taking interest in the books and leaflets it
contains. Publicity for HealthZone is conducted countywide by DCC.
livin currently owns four shop units in Chilton which are occupied by a food takeaway
in one outlet and the Co-operative foodstore that occupies three shop units; all in
Southdowns. livin also leases out an office in Rosewood Grange to Age Concern
Durham.
The main shopping area is located around the front street in Chilton and has
undergone environmental improvements in recent years. There are a number of local
shops including: local Post Office, two hairdressers, tropical fish store and two food
takeaways. There is also grocery shopping at the Sainsbury store. For the
requirement of more specialist goods and services residents are required to travel
out of the area to neighbouring Spennymoor, Bishop Auckland or Newton Aycliffe.
Larger supermarkets are also located in these
neighbouring towns. Many residents have highlighted
the need for travel out of the local area for access to
more varied or low cost grocery or specialist shopping.
This need to travel has been frequently highlighted by local residents throughout the
consultation process. As many households do not
own their own vehicle or have access to private
transport extra costs associated with travel can place
an increased strain on household income. Many local
households will already have low income levels due to
their reliance on welfare benefits.
livin own 20 garden sites within the Chilton and
Chilton Lane community which can be used to grow fresh vegetables, fruit and
flowers. Chilton Town Council manage a further 220 allotment sites and there are
currently waiting lists for each site.
The LADDER Centre is a local resource centre located within the nearby Ferryhill
Village and is accessible by local residents (transport costs aside). It provides a
Allotment and garden sites within the community are popular
“Bus services are
being cut”
Resident of Chilton
45
number of local services including access to learning, and hosts regular training and
employability courses and a local job club. The Centre also provides free access to
the internet and computers and is host to a weekly fruit and vegetable coop.
A number of organisations can be found within the LADDER Centre at Ferryhill,
including Durham County Credit Union, Sedgefield Employability Consortium Job
Club, NECA (North East Counselling on Addictions) and CAVOS (an organisation
dedicated to community and voluntary work within Sedgefield). The Centre provides
a number of activities for children and young people within the local area and
currently offers the services of two Employability Mentors and a Connexions Advisor
who can provide advice on education, training and employment opportunities.
Consultation found the LADDER Centre is viewed by a wide range of local residents,
including children and young persons, as a valuable service provider and resource.
Many residents are keen to see the facilities and courses provided by the Centre
expanded to Chilton.
Residents wished for an increased provision of activities for children and young
persons, and more courses and training relating to employment and education.
There is also a strong reliance by local residents on the use of computers and the
internet at the Centre, but this need is also serviced by the computers available free
of charge at the local library.
After school activities and those provided during the school holidays are well
attended by local families and young persons living in the community.
Henderson Community House offers residents a small shop for buying and selling
items of clothing and household sundries. It also has a job club on a Tuesday
afternoon and a food co-op. There is currently a cookery course provided from the
House and in the future, using the support of a Community Development Worker, I.T
courses for beginners are proposed.
Henderson House is not fully utilised by all residents of Chilton or Chilton Lane and
the perception of the community is that Henderson House only supports the ‘Poets’
side of Chilton and not the ‘Windlestone’ area.
Within the community is Chilton Community College, located on the site of Chilton
Primary School. The college currently runs courses through the DCC Adult
Education Service which include ICT, cake decoration and ‘Zumba’ exercise classes.
There is the opportunity to play badminton and squash within the facility. Some other
courses available on site include martial arts classes, slimmer world club and the
provision of a youth club for both 8 to 11 year olds and 13 to 18 year olds. A new
multi gym facility is available to all, 6 days a week. The college is looking to aid
Henderson House not fully utilised by the whole community
46
‘employability’ within the community by providing training courses starting September
2011.
There are also three areas of children’s play
equipment at West Chilton Terrace, Chilton
Junior School and the Surestart centre. During
consultation residents did not raise any concerns
regarding these facilities.
The feedback gained from young people at
Chilton Primary School and local community
groups highlighted the need for more activities
that older youths and teenagers wish to participate in. There was considerable
interest from young residents for the provision of a swimming pool, roller disco and
youth club.
There are concerns about the current and future accessibility of public transport in
and around the community. Many residents highlighted concerns about the reliability,
cost and restrictions of the current public transport service which have been echoed
by the Chilton Town Council, given public transports vital role in providing access to
employment, education and shopping. Residents of Chilton Lane feel isolated due to
restricted bus links and reduced services.
A recent survey of residents living within the 4 Together Area Partnership (DCC,
2010) indicated that only 56% were satisfied with public transport; this being the
lowest level of satisfaction throughout the County. As car ownership in the
community is relatively low; this coupled with rising fuel and maintenance costs
places an increased need on a reliable, wide reaching public transport system that
serves the needs of the community as a whole.
There is a fear from residents that public sector budget cuts will see the current level
of local services within the community decrease and the possibility of the public
transport service and its links to the surrounding area being reduced.
“Winter limits youth activities
so could do with a Youth Club
for dark nights”
Chilton Primary School Pupil
Chilton Primary School pupil.
47
What does this mean for livin?
livin is aware of the positive impact that local services and service providers have on
sustaining local communities. Closure of local facilities, such as leisure centres could
have an impact on diversionary activities for young people. A reduced bus services
may increase the barriers to employment experienced by livin tenants and local
residents.
livin is also aware of the pressures communities are under and needs to work in
partnership with organisations such as DCC to ensure the effects of service
withdrawals are minimised and that tenants are aware of the implications. livin must
support and promote local services available in the community that help improve the
quality of life for local residents (i.e. employability course providers and health
programmes etc.).
Key Services Characteristics:
Residents believe the community which is served by local shops, health services
and public amenities needs to be improved.
The local library and LADDER Centre provide internet access and email
facilities for local residents. The local library contains a HealthZone where
residents can obtain information on healthy eating and adopting a healthier
lifestyle.
The local leisure centre at Ferryhill provides health related activities for adults
and young people; although its future is currently uncertain due to public sector
funding reviews. Some households are unable to afford the fees for the use of
the leisure centre and its activities.
Residents have highlighted a need for travel out of the area for specialised
goods or services. Many households in the community do not own their own
vehicle or have access to private transport.
Satisfaction with the public transport service in the area is poor with many
residents feeling that the current provision is unreliable and restrictive for their
needs.
Residents are concerned that public sector spending cuts will further reduce the
transport links with surrounding villages and towns.
There are a number of play areas in the community.
Some activities provided for young persons are underutilised. Local youths
want to have a say in the activities that are provided for them.
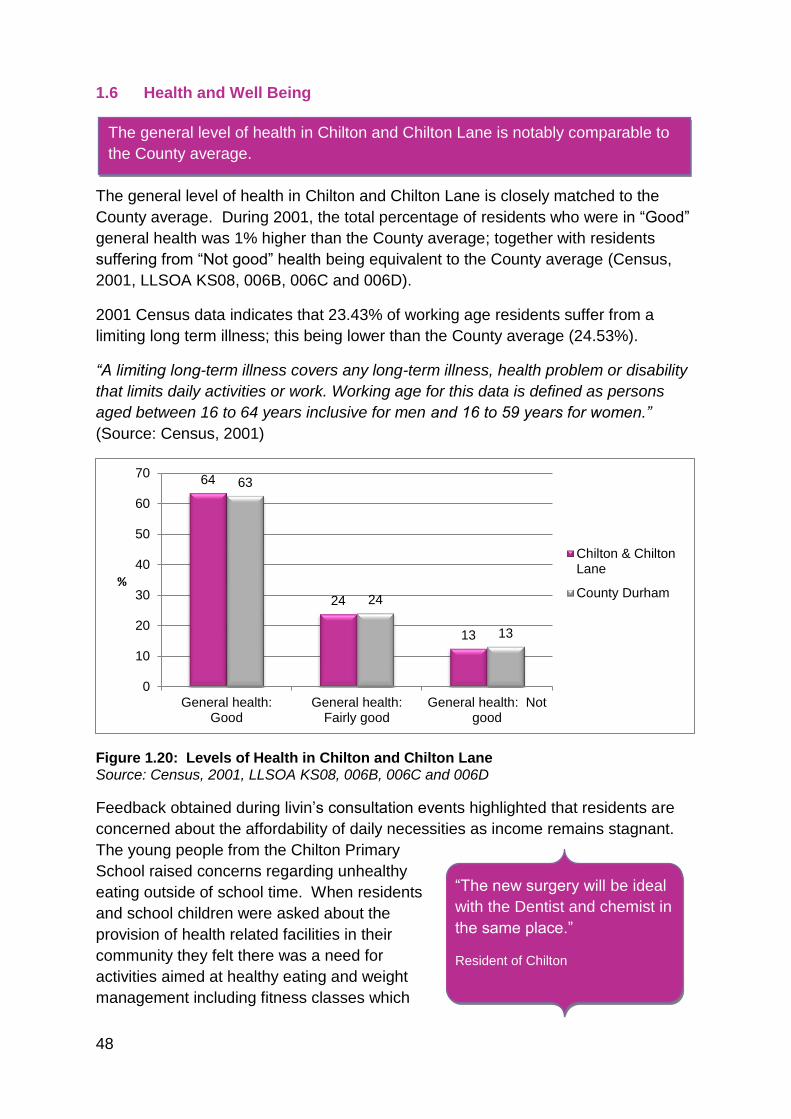
48
1.6 Health and Well Being
The general level of health in Chilton and Chilton Lane is closely matched to the
County average. During 2001, the total percentage of residents who were in “Good”
general health was 1% higher than the County average; together with residents
suffering from “Not good” health being equivalent to the County average (Census,
2001, LLSOA KS08, 006B, 006C and 006D).
2001 Census data indicates that 23.43% of working age residents suffer from a
limiting long term illness; this being lower than the County average (24.53%).
“A limiting long-term illness covers any long-term illness, health problem or disability
that limits daily activities or work. Working age for this data is defined as persons
aged between 16 to 64 years inclusive for men and 16 to 59 years for women.”
(Source: Census, 2001)
Figure 1.20: Levels of Health in Chilton and Chilton Lane Source: Census, 2001, LLSOA KS08, 006B, 006C and 006D
Feedback obtained during livin’s consultation events highlighted that residents are
concerned about the affordability of daily necessities as income remains stagnant.
The young people from the Chilton Primary
School raised concerns regarding unhealthy
eating outside of school time. When residents
and school children were asked about the
provision of health related facilities in their
community they felt there was a need for
activities aimed at healthy eating and weight
management including fitness classes which
The general level of health in Chilton and Chilton Lane is notably comparable to
the County average.
“The new surgery will be ideal
with the Dentist and chemist in
the same place.”
Resident of Chilton
64
24
13
63
24
13
0
10
20
30
40
50
60
70
General health:Good
General health:Fairly good
General health: Notgood
%
Chilton & ChiltonLane
County Durham
49
could be incorporated in a Health Surgery.
It was suggested that an increased and more
varied provision of supervised activities that local
children and young people would be willing to
participate in would help lower levels of
antisocial behaviour and alcohol related
incidents.
There are concerns about the future of the
Ferryhill leisure centre. DCC has recently detailed plans of a spending review in
respect of its countywide leisure facilities. Currently, the leisure centre provides a
number of exercise classes and activities for local residents and their families,
although there were concerns raised about current affordability of gym membership
and the exercise classes. The loss of this facility would require residents to travel to
other local leisure centres at Spennymoor, Newton Aycliffe or Bishop Auckland.
Many households are in receipt of a low income with many not having access to
private transport. Extra costs relating to travel and the use of other facilities may
result in access to leisure facilities becoming unaffordable for some members of the
community and their families.
Key Health Characteristics:
During 2001, general levels of health in the Community were comparable when
compared to the County average.
23.43% of “working age” residents are suffering from a limiting long term illness.
There is a need for fresh and healthy food that is easily accessible within the
community and affordable for those households in receipt of a low income.
Many residents feel that levels of health and antisocial behaviour are being
affected by an increase in drugs and alcohol use.
There is an increased need for more activities for young residents. Youth
activities need to be affordable and reflect the hobbies and interests that the
youths want to participate in.
Leisure centre activities and access to its facilities are unaffordable for some
households within the community.
There is a fear that public spending cuts will result in the loss of health based
facilities in the community. This will result in a need for travel to access leisure
facilities in other areas. Increased costs associated with travel may result in
access to leisure facilities becoming unaffordable for some local households.
“Need to introduce courses to
deal with healthy eating and
weight management”
Resident of Chilton
50
What does this mean for livin?
There has been a long established connection between health and housing. livin has
a stronger role emerging out of the Government’s Health Reform proposals to act in
partnership with health services to improve the health of tenants and their families.
As a “frontline” service provider livin has a privileged position to access tenants and
potentially signpost customers to health services and healthy lifestyles. Good levels
of health can have positive effects on educational achievement and promote
employment within a community.
1.7 Education and Training
Levels of educational attainment are lower within the Chilton and Chilton Lane
communities when compared to the Durham County average (Census, 2001, LLSOA
KS13, 006B, 006C and 006D).
Although a higher percentage of the population have attained a level 1 qualification
(18%) when compared to the County average
this is reflected in the lower percentage of
persons continuing their education to gain
qualifications at higher levels. Level 1
qualifications include 1+ 'O' level passes; 1+
CSE/GCSE any grades; NVQ level 1; or
Foundation level GNVQ.
The average percentage of the population
gaining a level 2 qualification is equivalent to the
County average of 18%. Level 2 qualifications include 5+GCSEs (grades A-C); 1+ 'A'
levels/'AS' levels; NVQ level 2; or Intermediate GNVQ.
Only 5% of the population hold qualifications at level 3 when compared to the County
average of 7%. Level 3 qualifications are necessary for advancement into University,
higher education or professional qualifications and include 2+ 'A' levels; 4+ 'AS'
levels; NVQ level 3; or an Advanced GNVQ.
This lower level of attainment at level 3 reflects on the percentage of the population
that have gained a level 4/5 qualification (8%) through higher education when
compared to the County average of 14%. A level 4/5 qualification is equivalent to
First Degree, Higher Degree, NVQ levels 4 and 5; HNC; HND; or professional
qualifications including qualified teacher; medical doctor; dentist; nurse; midwife; or
health visitor.
There is a difference of 6% between the County average and Chilton and Chilton
Lane community for those who continue their education to gain qualifications in
Higher Education.
2001 Census data
indicates that 42% of the
population in the
community have no
formal qualifications
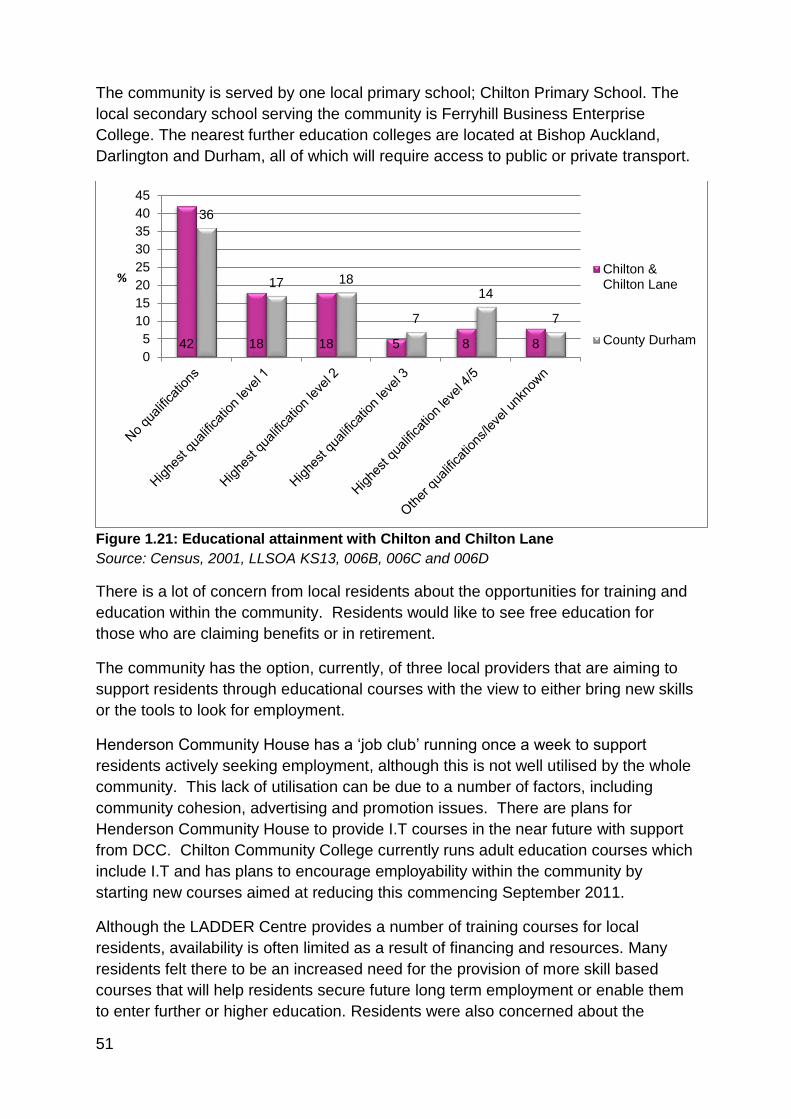
51
The community is served by one local primary school; Chilton Primary School. The
local secondary school serving the community is Ferryhill Business Enterprise
College. The nearest further education colleges are located at Bishop Auckland,
Darlington and Durham, all of which will require access to public or private transport.
Figure 1.21: Educational attainment with Chilton and Chilton Lane
Source: Census, 2001, LLSOA KS13, 006B, 006C and 006D
There is a lot of concern from local residents about the opportunities for training and
education within the community. Residents would like to see free education for
those who are claiming benefits or in retirement.
The community has the option, currently, of three local providers that are aiming to
support residents through educational courses with the view to either bring new skills
or the tools to look for employment.
Henderson Community House has a ‘job club’ running once a week to support
residents actively seeking employment, although this is not well utilised by the whole
community. This lack of utilisation can be due to a number of factors, including
community cohesion, advertising and promotion issues. There are plans for
Henderson Community House to provide I.T courses in the near future with support
from DCC. Chilton Community College currently runs adult education courses which
include I.T and has plans to encourage employability within the community by
starting new courses aimed at reducing this commencing September 2011.
Although the LADDER Centre provides a number of training courses for local
residents, availability is often limited as a result of financing and resources. Many
residents felt there to be an increased need for the provision of more skill based
courses that will help residents secure future long term employment or enable them
to enter further or higher education. Residents were also concerned about the
42 18 18 5 8 8
36
17 18
7
14
7
0
5
10
15
20
25
30
35
40
45
%
Chilton &Chilton Lane
County Durham
52
current cost of university tuition fees and feel this may deter or restrict many young
people and adults from obtaining higher level qualifications thus restricting future
career prospects and job opportunities.
The above concerns, together with the levels of educational attainment for the
community, highlights a clear need for an increased provision of training courses
within the local community to help many residents gain new skills and qualifications
to help them into employment or enhance future job prospects.
What does this mean for livin?
Education is a cornerstone of a sustainable community as it promotes financial
inclusion and economic activity in the population. At least 42% of livin tenants in this
community have no formal educational which is a low percentage and although livin
can play no direct role in education there are opportunities to link with and support
efforts to increase educational attainment raise this through Surestart, local schools,
colleges and community based action groups.
Lower levels of educational attainment in the community highlight the need for an
increased provision of training and skills courses that will allow local residents to
access further education or gain long term employment.
Key Education Characteristics:
In 2001, 42% of residents had no formal educational qualifications.
Although the percentage of residents that gain qualifications at level 2 (equivalent to
5+ GCSEs A-C) is equivalent to the County average a lower percentage continue
their education.
Only 5% of residents hold qualifications at level 3. Educational attainment at level 3
is necessary for advancement into higher education or university.
There are a low percentage of residents that hold qualifications at levels 4 to 5
(equivalent to Degree level) when compared to the County average.
Attendance at further education colleges at Durham, Darlington and Bishop
Auckland requires access to public or private transport.
Lower levels of educational attainment in the community highlight the need for an
increased provision of training and skills courses that will allow local residents
to access further education or gain long term employment.
53
1.8 Reputation of the local area and community cohesion
Some residents felt there to be a poor perception of specific areas located within
Chilton due to the appearance of poorly maintained properties and gardens,
unfinished regeneration work and the local environment. Residents from the Chilton
Lane area did not raise any concerns on this issue.
Although the community as a whole is deemed to be a pleasant and quiet place to
live there was acknowledgement that a small minority of residents responsible for
causing low level antisocial behaviour and nuisance around their homes diminish the
reputation.
Locally there is a perception that the village of Chilton is divided into two areas. This
has been referred to locally as “The Dark Side” (West Chilton, Poets) and “The
lighter side” (Windlestone). This may explain why some services provided on both
sides of the village are not fully utilised by the Community as a whole. There is
anecdotal evidence that the community has some radical elements which will have
an impact upon the perception and reputation of an area.
A poor reputation for a community can last for many years and remain regardless of
significant changes and improvements to social, economic or environmental factors.
A reputation, even if it is a perception, can have a detrimental effect on housing
demand within the community. It can also tarnish the reputation of the local
community and that of the registered providers providing housing within the
community.
What this means for livin?
As the largest Registered Provider in the community livin has a role to play as a
‘place maker’ is also a major stakeholder in sustaining local communities.
livin should work with DCC and other community partners to improve the reputation,
of the community and try to involve the whole community in accessing services
irrespective of their location within Chilton and Chilton Lane. This may be improved
by good PR and increasing public awareness.
54
1.9 Local Environment
The majority of environmental feedback received from residents during the
consultation events centred on dog fouling within the community together with the
residents’ view that the poor condition of privately rented properties has a negative
impact on the environment and reputation of the
community.
Further causes for concern were the poor car
parking facilities at the Sainsbury food store on the
front street which has caused pedestrian and
public problems. This issue has also been raised
with the Town Council. Many residents felt there to
be a need for more dedicated ‘off street’ parking to
help ease parking issues. Other concerns raised
by residents was the cost of removing bulky items of rubbish, imposed by DCC,
which they feel has led to increased fly tipping and the need for the recycle box to be
larger for households.
On 13 April 2011, an Environmental Assessment of the community was conducted
by members of livin’s Communities Team. The Assessment was completed by
assessing a number of environmental indicators. In Chilton there was four
designated “stopping” points on a pre-determined route through the community and
in Chilton Lane there was only one stopping point, again on a pre-determined route.
At each stopping point a number of environmental indicators were assessed and a
number of points awarded. Based on the average points awarded at each stopping
point, the community of Chilton and Chilton Lane averaged a total value of 18.2.
As a result the overall condition of Chilton and Chilton Lane community, as
determined by this assessment, has been ranked as Bronze. The full methodology
to this Environmental Assessment is detailed in Appendix 2.
In West Chilton it is important to consider that environmental improvements are well
planned by way of improving natural surveillance and to reduce the opportunity for
crime (Coalfield Housing Marker Renewal Study 2005).
“Clean Up the Streets – too
Much Dog Fouling”
Resident of Chilton and Chilton
Lane
Many residents feel there is a need for private Landlords to improve the
appearance and condition of their properties.
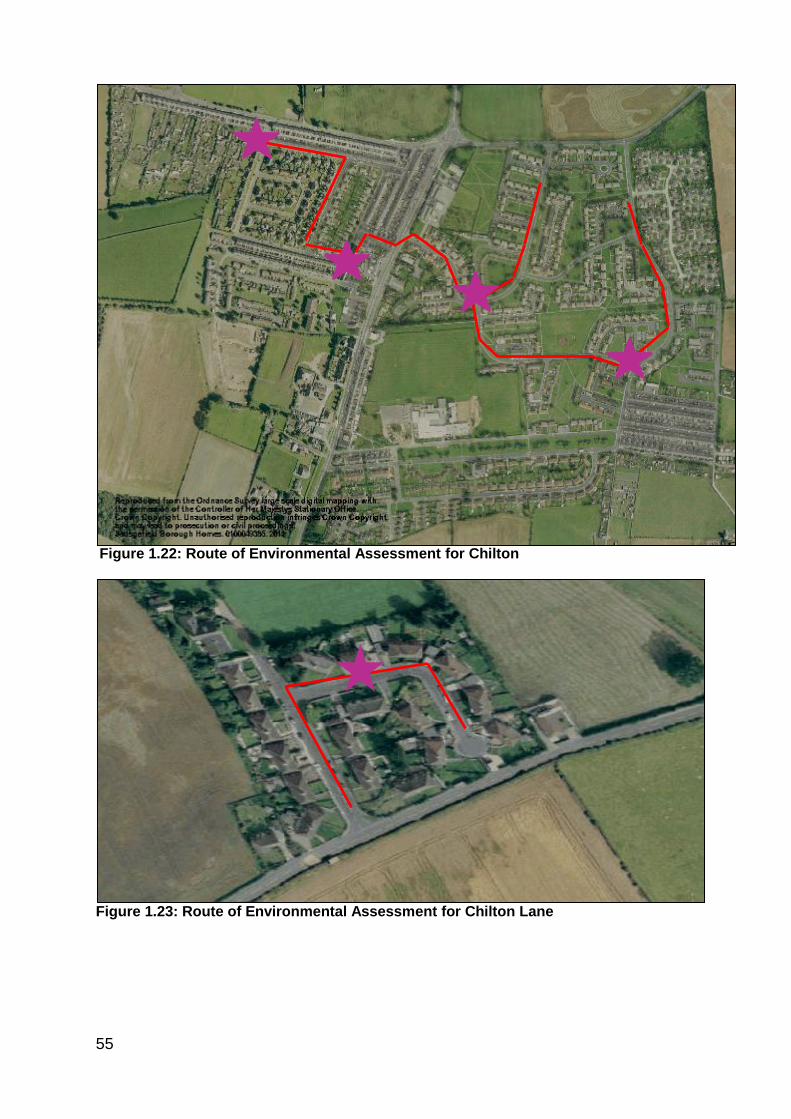
55
Figure 1.22: Route of Environmental Assessment for Chilton
Figure 1.23: Route of Environmental Assessment for Chilton Lane
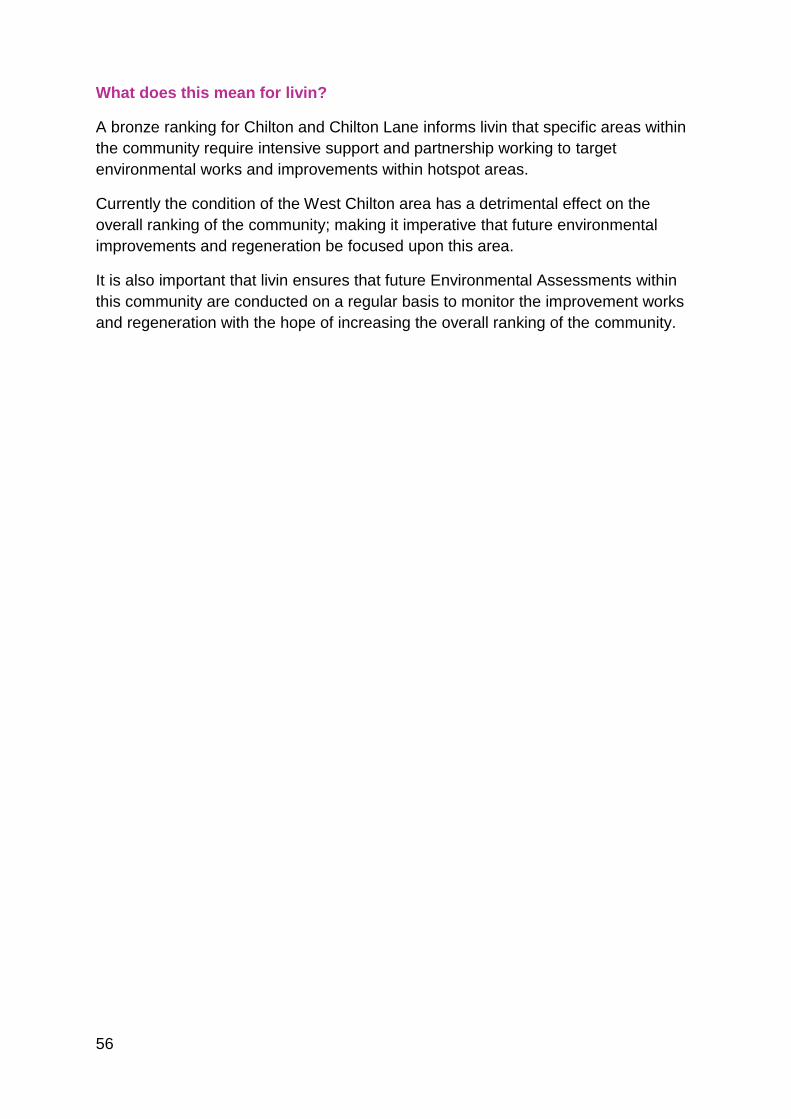
56
What does this mean for livin?
A bronze ranking for Chilton and Chilton Lane informs livin that specific areas within
the community require intensive support and partnership working to target
environmental works and improvements within hotspot areas.
Currently the condition of the West Chilton area has a detrimental effect on the
overall ranking of the community; making it imperative that future environmental
improvements and regeneration be focused upon this area.
It is also important that livin ensures that future Environmental Assessments within
this community are conducted on a regular basis to monitor the improvement works
and regeneration with the hope of increasing the overall ranking of the community.
57
Based on the intelligence contained within this community plan livin has been able to
identify and assess a number of key strengths and challenges being faced by
residents living in the community of Chilton and Chilton Lane.
To improve the levels of sustainability within this community it is important that key
strengths are maintained; together with conscientious efforts being made by livin,
other community stakeholders and local residents to address and reduce the
identified challenges.
Taking into account these challenges livin has developed six key priorities for the
Chilton and Chilton Lane community:
The development of these key priorities and the creation of the Local Offers that can
be used by livin, community stakeholders and local residents to address and achieve
them; will enable the maximisation of internal and external resources available
throughout the community.
Section 2 Community Priorities
Targeted environmental improvements and housing renewal in West Chilton
Maintain and enhance levels of engagement and the provision of activities for
children and young people
Help to influence and maintain services that benefit the needs of local
residents and the community as a whole
Develop a partnership approach to reducing barriers to work and increasing
employment opportunities for residents, particularly for younger people and
short term unemployed households.
Develop a partnership approach to further develop local health based
initiatives to help residents adopt healthier lifestyles and improve health levels
Maintain a partnership approach to manage and reduce incidents of low level
crime, antisocial behaviour and nuisance
58
The original actions contained within this Community Plan were revised in March
2013.
Based on what livin has learnt from your community, and our work with local partners
we have now developed a set of Local Offers for Chilton & Chilton Lane. The Local
Offers have taken into account the original actions from the community plan and the
views of the community obtained through consultation, leading to a new set of
standards and actions aimed at supporting and benefiting your area. Delivery of the
local offers will be monitored by livin tenants.
A copy of livin’s local offers for Chilton & Chilton Lane can be found on our website
at www.livin.co.uk.
This main Community Plan will be revised in 2014.
Section 3 Review of the Community Plan
59
APPENDIX 1
livin STRATEGIC FRAMEWORK
&
REGULATORY REQUIREMENTS
60
livin Strategic Framework
livin’s role as a Registered Provider of social housing extends beyond managing
houses. This has been identified within livin’s Corporate Plan for 2011 – 2014 which
highlights the importance of improving the economic viability of local communities,
followed by social factors such as health and education, and enhancing the local
environment.
As such livin is focused on supporting the development of sustainable communities
for the current and future generation of residents. This is articulated through the
Company’s vision, mission and personality which are;
Mission “working with the community at heart”
Vision “sustaining and growing safe, cohesive and vibrant communities through
excellent customer services”
Personality “Caring, supportive, helpful and community orientated”
It is acknowledged that livin can play a key role in contributing to the delivery of
sustainable communities. By developing strong and coordinated partnership working
with residents and key stakeholders livin will develop:
Prosperous Communities - addressing economic viability of communities by
helping people to improve their financial circumstances, become less dependent
on benefits, positively address employability and increase financial confidence.
Healthy Communities – addressing social wellbeing, community cohesion and
health inequalities by improving health and wellbeing, secure access to further
opportunities and develop their aspirations.
Green Communities – addressing environmental quality and sustainability by
enhancing the setting of homes and promoting and supporting green initiatives in
communities.
During April 2011, livin introduced the “Your Voice, Local Choice”, Local Offer
document to ensure that “the right services are delivered in the right place for the
right people”. The Local Offer is a list of ten pledges that livin has made to tenants in
order to deliver key priorities. Full details of the pledges contained in livin’s Local
Offer can be found on the website at livin.co.uk or alternatively a copy can be
requested by contacting livin on 0845 505 5500 or 0300 111 2234 (low rate from a
mobile depending on network).
In addition to helping livin work towards sustaining and growing safe, cohesive, and
vibrant communities the Community Plans will play an important role in shaping and
articulating the Local Offer to tenants. They are the delivery mechanism for the
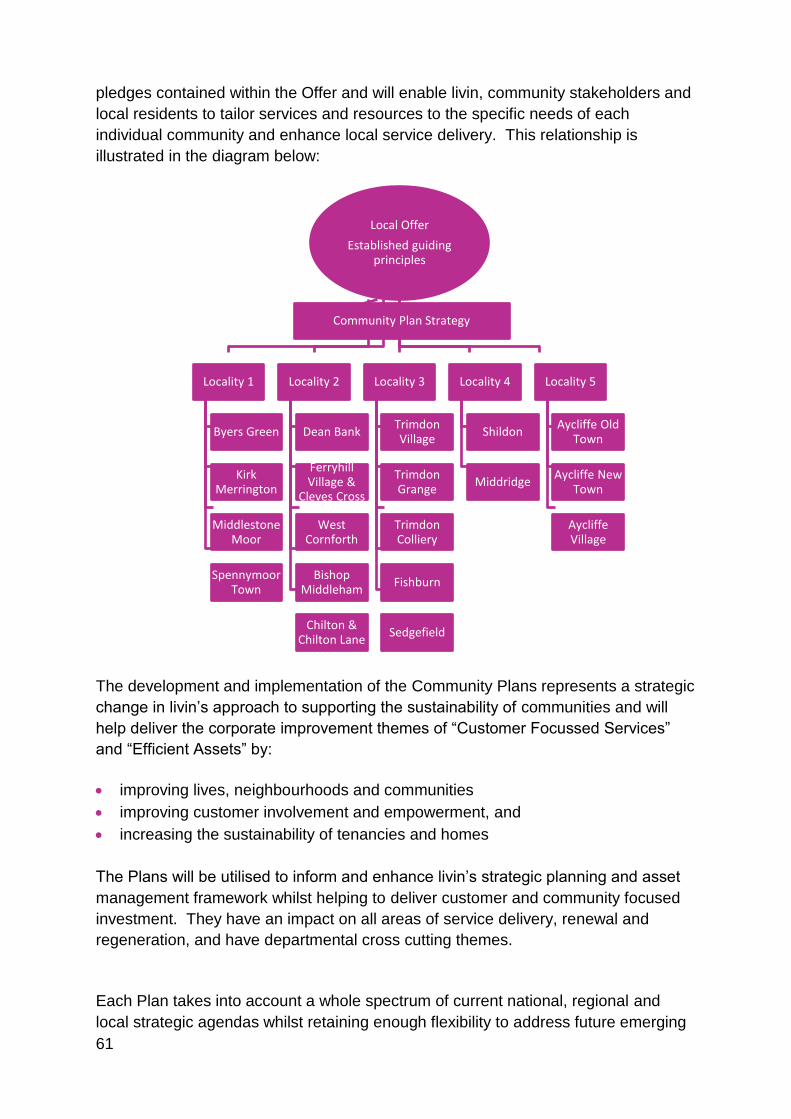
61
pledges contained within the Offer and will enable livin, community stakeholders and
local residents to tailor services and resources to the specific needs of each
individual community and enhance local service delivery. This relationship is
illustrated in the diagram below:
The development and implementation of the Community Plans represents a strategic
change in livin’s approach to supporting the sustainability of communities and will
help deliver the corporate improvement themes of “Customer Focussed Services”
and “Efficient Assets” by:
improving lives, neighbourhoods and communities
improving customer involvement and empowerment, and
increasing the sustainability of tenancies and homes
The Plans will be utilised to inform and enhance livin’s strategic planning and asset
management framework whilst helping to deliver customer and community focused
investment. They have an impact on all areas of service delivery, renewal and
regeneration, and have departmental cross cutting themes.
Each Plan takes into account a whole spectrum of current national, regional and
local strategic agendas whilst retaining enough flexibility to address future emerging
Local Offer
Established guiding principles
Locality 1
Byers Green
Kirk Merrington
Middlestone Moor
Spennymoor Town
Locality 2
Dean Bank
Ferryhill Village &
Cleves Cross
West Cornforth
Bishop Middleham
Chilton & Chilton Lane
Locality 3
Trimdon Village
Trimdon Grange
Trimdon Colliery
Fishburn
Sedgefield
Locality 4
Shildon
Middridge
Locality 5
Aycliffe Old Town
Aycliffe New Town
Aycliffe Village
Community Plan Strategy
62
policy and structural changes at all levels. They complement the Government’s
Localism Bill by facilitating and empowering local communities to improve local
services in their local area and careful consideration has also been given to relevant
housing strategies adopted by Durham County Council and the implications of the
Housing and Communities Agency (HCA) new role in regulating social landlords.
Tenant Services Authority Regulatory Requirements
The development and implementation of Community Plans also reflects livin’s
commitment to adhering to the Tenant Services Authority’s (TSA) current regulatory
regime. This regime requires livin to meet six separate service standards:
Tenant Involvement and Empowerment
Home
Tenancy
Neighbourhood and Community
Value for Money
Governance and Financial Viability
Comprehensive consultation to support each Plan will help livin to enhance customer
services and encourage local residents to become more responsible for local
services and the improvement of their communities thus addressing the Tenant
Involvement and Empowerment standard.
The Home standard will be addressed by assessing the current condition of the
current housing stock in each community to ensure that it is of high quality, well
maintained and suitable for demand.
It is crucial that the Tenancy standard be incorporated into the outcomes of the
Community Plan through the consideration and effective use of lettings policies, rent
management policies and the enhancement of tenancy sustainment.
As part of the Neighbourhood and Community standard livin is required to deliver on
three separate outcomes; local cooperation, antisocial behaviour and community
management. All of these will outcomes will be considered and addressed within the
outcomes of each Plan.
The Plans will also address the Value for Money standard by ensuring that livin
prioritise resources based on the actual needs and requirements of local residents
whilst enabling confidence for external stakeholders and businesses to invest in the
communities.
63
Durham County Council Strategic Framework
Durham County Council’s “Sustainable Communities” Strategy 2010-2030 is the
overarching plan for delivering long lasting improvements throughout the County. It
sets out five key strategic priority themes that will be focused on during the next 20
years:
Altogether Wealthier
Altogether Better for Children and Young People
Altogether Healthier
Altogether Safer
Altogether Greener
Whilst, Registered Providers are essential partners in delivering sustainable
communities, local authorities have the key strategic responsibility in this area. This
is particularly important for livin given its current geographical boundary within
County Durham and its relatively high levels of deprivation. Therefore the
Company’s approach of aligning key elements of its Corporate Plan 2011 – 2014 to
the priorities set out in Durham County Council’s Sustainable Communities Strategy
is vital in allowing the Company to play its role as a key partner in delivering
sustainable communities.
The provision of sustainable communities and vibrant and successful towns sits
within the key strategic theme of “Altogether Wealthier” and places a significant
emphasis on local housing markets and improvements in employability and skills as
key drivers in this achievement. Although the provision of a successful housing
market is predominantly featured in the theme of “Altogether Wealthier” there can be
cross cutting themes across the other four priority themes as demonstrated in the
community plans.
This theme of housing being a key driver in creating sustainable communities is
further detailed in “Building Altogether Better Lives: A Housing Strategy for County
Durham 2010-2015” (DCC, 2010). This strategy focuses on the ability for housing
and other related services to create better life chances for persons living in County
Durham by delivering better housing markets and high quality housing stock through
enhanced partnership working.
National Housing Federation
Research conducted by the National Housing Federation (NHF) found that numerous
RP’s are now using their presence and impact within their local communities to
provide services outside of their core housing management activities.
These activities are centred on employment and enterprise services, education and
skills services, wellbeing services, poverty and social inclusion, safety and
community cohesion.
64
During 2006/07 the NHF found that RP’s nationally delivered 6,800 community
services (including facilities) and invested £435 million (£272 million internal and
£163 external) into resources outside of their core areas of activity. This study
highlighted the prominence that RP’s have within their local communities and their
perfect position to act as place makers in their communities.
Further information and details relating to this research is contained within the full
NHF report, “The scale and scope of housing associations activity beyond housing”.
65
APPENDIX 2
METHODOLOGY
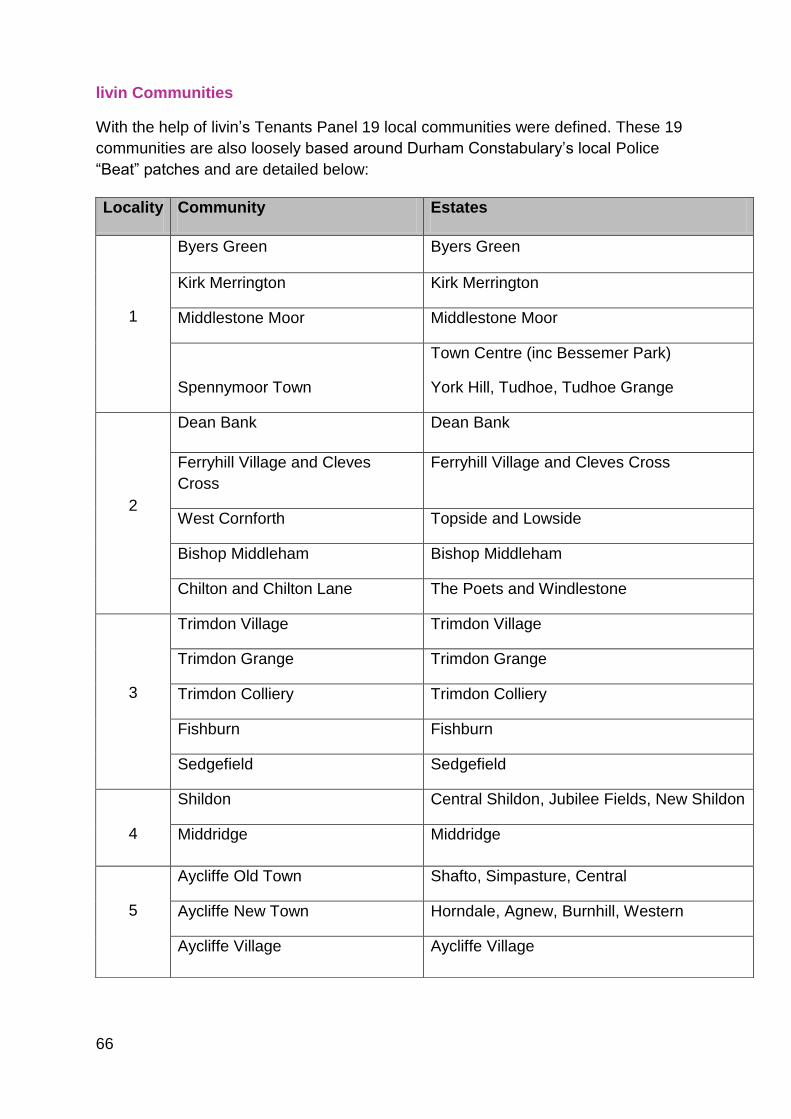
66
livin Communities
With the help of livin’s Tenants Panel 19 local communities were defined. These 19
communities are also loosely based around Durham Constabulary’s local Police
“Beat” patches and are detailed below:
Locality Community Estates
1
Byers Green Byers Green
Kirk Merrington Kirk Merrington
Middlestone Moor Middlestone Moor
Spennymoor Town
Town Centre (inc Bessemer Park)
York Hill, Tudhoe, Tudhoe Grange
2
Dean Bank Dean Bank
Ferryhill Village and Cleves
Cross
Ferryhill Village and Cleves Cross
West Cornforth Topside and Lowside
Bishop Middleham Bishop Middleham
Chilton and Chilton Lane The Poets and Windlestone
3
Trimdon Village Trimdon Village
Trimdon Grange Trimdon Grange
Trimdon Colliery Trimdon Colliery
Fishburn Fishburn
Sedgefield Sedgefield
4
Shildon Central Shildon, Jubilee Fields, New Shildon
Middridge Middridge
5
Aycliffe Old Town Shafto, Simpasture, Central
Aycliffe New Town Horndale, Agnew, Burnhill, Western
Aycliffe Village Aycliffe Village
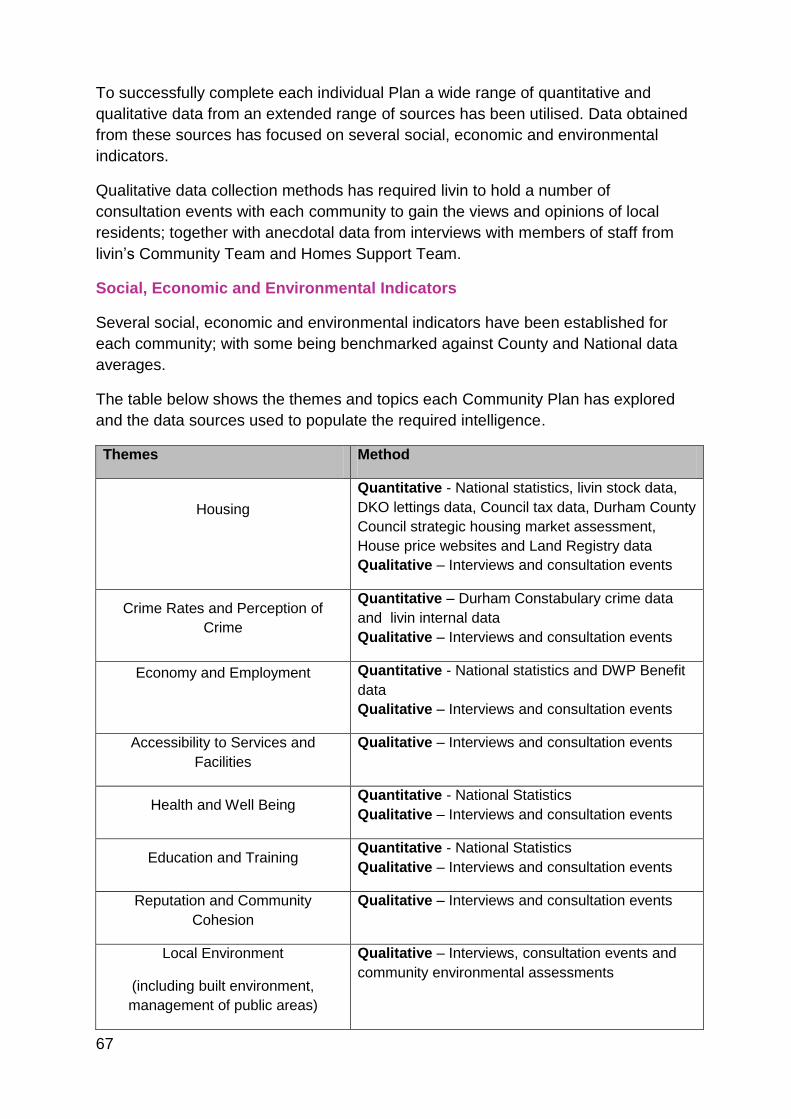
67
To successfully complete each individual Plan a wide range of quantitative and
qualitative data from an extended range of sources has been utilised. Data obtained
from these sources has focused on several social, economic and environmental
indicators.
Qualitative data collection methods has required livin to hold a number of
consultation events with each community to gain the views and opinions of local
residents; together with anecdotal data from interviews with members of staff from
livin’s Community Team and Homes Support Team.
Social, Economic and Environmental Indicators
Several social, economic and environmental indicators have been established for
each community; with some being benchmarked against County and National data
averages.
The table below shows the themes and topics each Community Plan has explored
and the data sources used to populate the required intelligence.
Themes Method
Housing
Quantitative - National statistics, livin stock data,
DKO lettings data, Council tax data, Durham County
Council strategic housing market assessment,
House price websites and Land Registry data
Qualitative – Interviews and consultation events
Crime Rates and Perception of
Crime
Quantitative – Durham Constabulary crime data
and livin internal data
Qualitative – Interviews and consultation events
Economy and Employment
Quantitative - National statistics and DWP Benefit
data
Qualitative – Interviews and consultation events
Accessibility to Services and
Facilities
Qualitative – Interviews and consultation events
Health and Well Being Quantitative - National Statistics
Qualitative – Interviews and consultation events
Education and Training Quantitative - National Statistics
Qualitative – Interviews and consultation events
Reputation and Community
Cohesion
Qualitative – Interviews and consultation events
Local Environment
(including built environment,
management of public areas)
Qualitative – Interviews, consultation events and
community environmental assessments
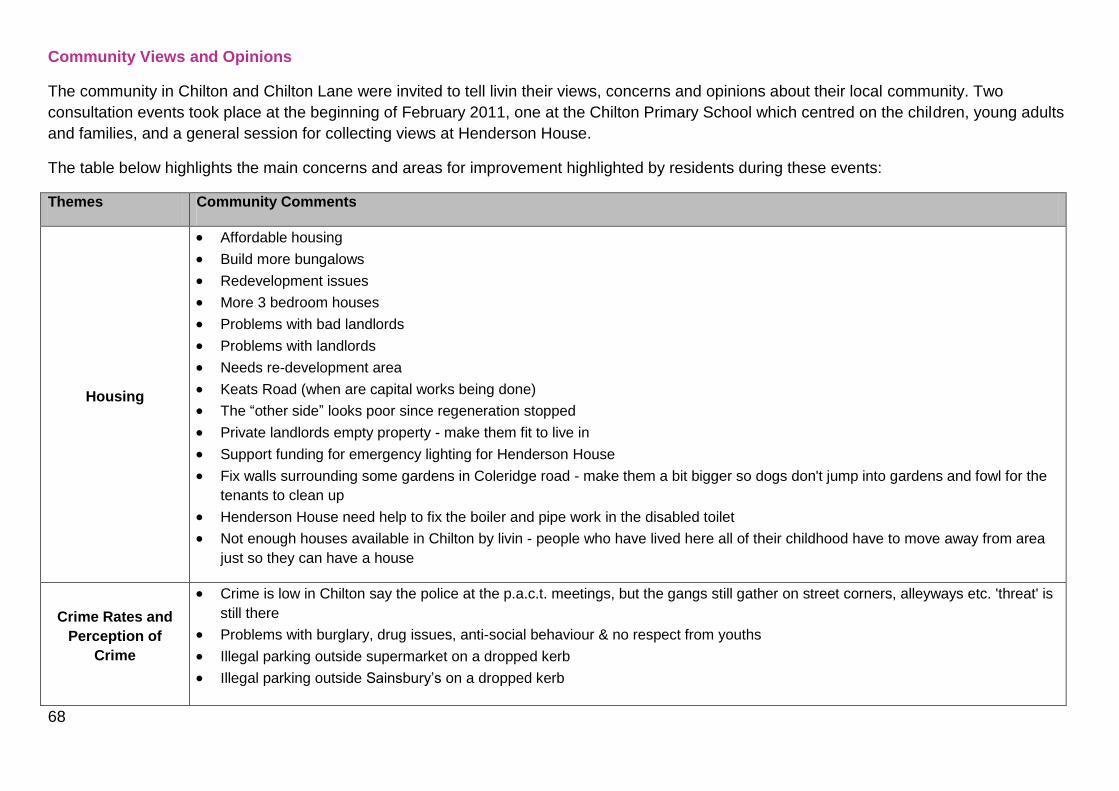
68
Community Views and Opinions
The community in Chilton and Chilton Lane were invited to tell livin their views, concerns and opinions about their local community. Two
consultation events took place at the beginning of February 2011, one at the Chilton Primary School which centred on the children, young adults
and families, and a general session for collecting views at Henderson House.
The table below highlights the main concerns and areas for improvement highlighted by residents during these events:
Themes Community Comments
Housing
Affordable housing
Build more bungalows
Redevelopment issues
More 3 bedroom houses
Problems with bad landlords
Problems with landlords
Needs re-development area
Keats Road (when are capital works being done)
The “other side” looks poor since regeneration stopped
Private landlords empty property - make them fit to live in
Support funding for emergency lighting for Henderson House
Fix walls surrounding some gardens in Coleridge road - make them a bit bigger so dogs don't jump into gardens and fowl for the
tenants to clean up
Henderson House need help to fix the boiler and pipe work in the disabled toilet
Not enough houses available in Chilton by livin - people who have lived here all of their childhood have to move away from area
just so they can have a house
Crime Rates and
Perception of
Crime
Crime is low in Chilton say the police at the p.a.c.t. meetings, but the gangs still gather on street corners, alleyways etc. 'threat' is
still there
Problems with burglary, drug issues, anti-social behaviour & no respect from youths
Illegal parking outside supermarket on a dropped kerb
Illegal parking outside Sainsbury’s on a dropped kerb
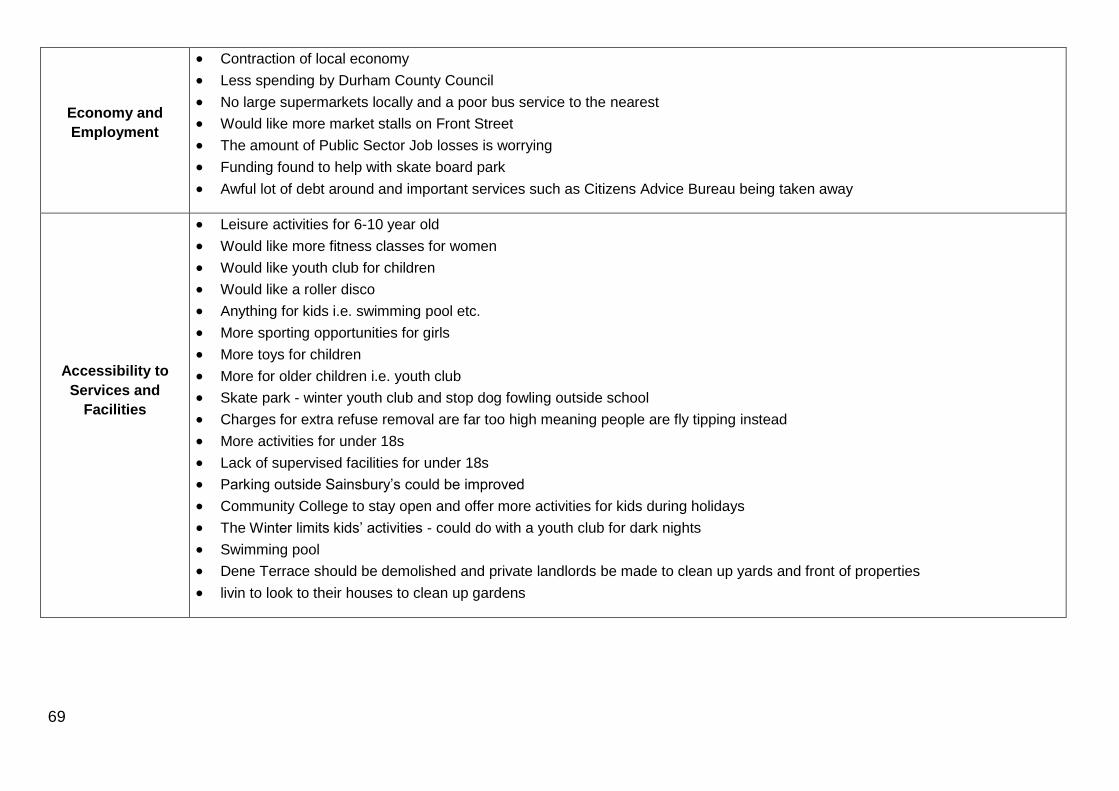
69
Economy and
Employment
Contraction of local economy
Less spending by Durham County Council
No large supermarkets locally and a poor bus service to the nearest
Would like more market stalls on Front Street
The amount of Public Sector Job losses is worrying
Funding found to help with skate board park
Awful lot of debt around and important services such as Citizens Advice Bureau being taken away
Accessibility to
Services and
Facilities
Leisure activities for 6-10 year old
Would like more fitness classes for women
Would like youth club for children
Would like a roller disco
Anything for kids i.e. swimming pool etc.
More sporting opportunities for girls
More toys for children
More for older children i.e. youth club
Skate park - winter youth club and stop dog fowling outside school
Charges for extra refuse removal are far too high meaning people are fly tipping instead
More activities for under 18s
Lack of supervised facilities for under 18s
Parking outside Sainsbury’s could be improved
Community College to stay open and offer more activities for kids during holidays
The Winter limits kids’ activities - could do with a youth club for dark nights
Swimming pool
Dene Terrace should be demolished and private landlords be made to clean up yards and front of properties
livin to look to their houses to clean up gardens
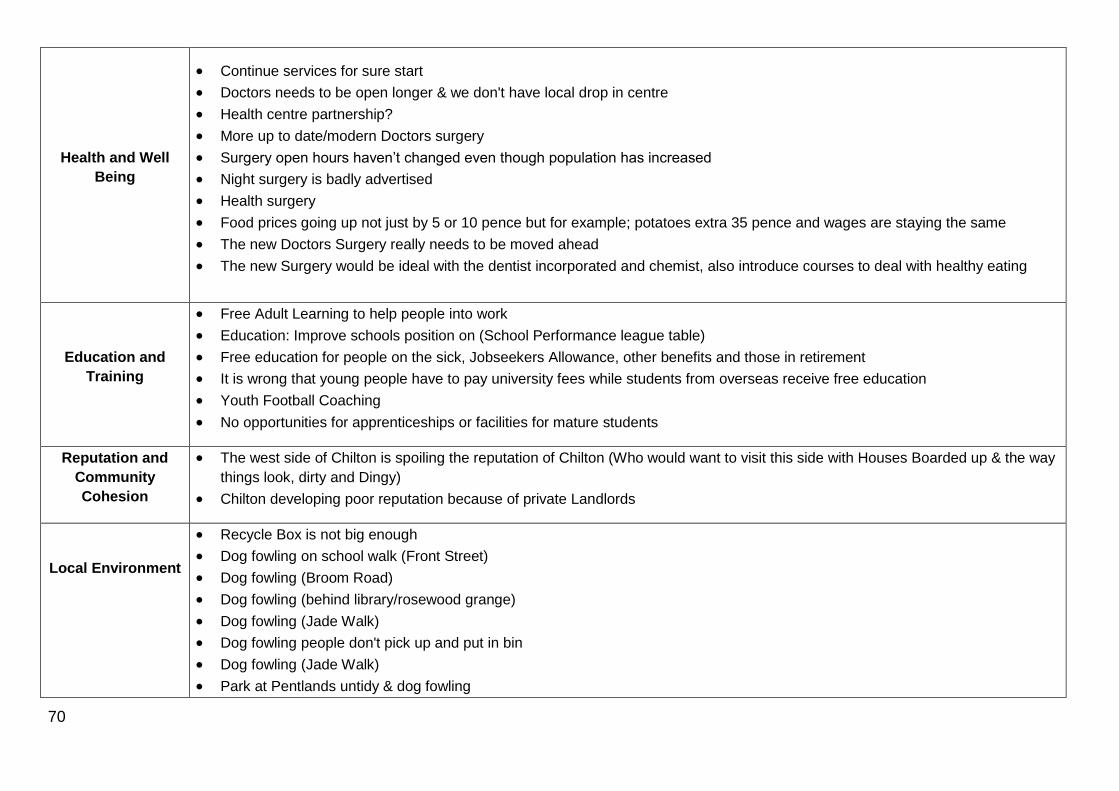
70
Health and Well
Being
Continue services for sure start
Doctors needs to be open longer & we don't have local drop in centre
Health centre partnership?
More up to date/modern Doctors surgery
Surgery open hours haven’t changed even though population has increased
Night surgery is badly advertised
Health surgery
Food prices going up not just by 5 or 10 pence but for example; potatoes extra 35 pence and wages are staying the same
The new Doctors Surgery really needs to be moved ahead
The new Surgery would be ideal with the dentist incorporated and chemist, also introduce courses to deal with healthy eating
Education and
Training
Free Adult Learning to help people into work
Education: Improve schools position on (School Performance league table)
Free education for people on the sick, Jobseekers Allowance, other benefits and those in retirement
It is wrong that young people have to pay university fees while students from overseas receive free education
Youth Football Coaching
No opportunities for apprenticeships or facilities for mature students
Reputation and
Community
Cohesion
The west side of Chilton is spoiling the reputation of Chilton (Who would want to visit this side with Houses Boarded up & the way
things look, dirty and Dingy)
Chilton developing poor reputation because of private Landlords
Local Environment
Recycle Box is not big enough
Dog fowling on school walk (Front Street)
Dog fowling (Broom Road)
Dog fowling (behind library/rosewood grange)
Dog fowling (Jade Walk)
Dog fowling people don't pick up and put in bin
Dog fowling (Jade Walk)
Park at Pentlands untidy & dog fowling
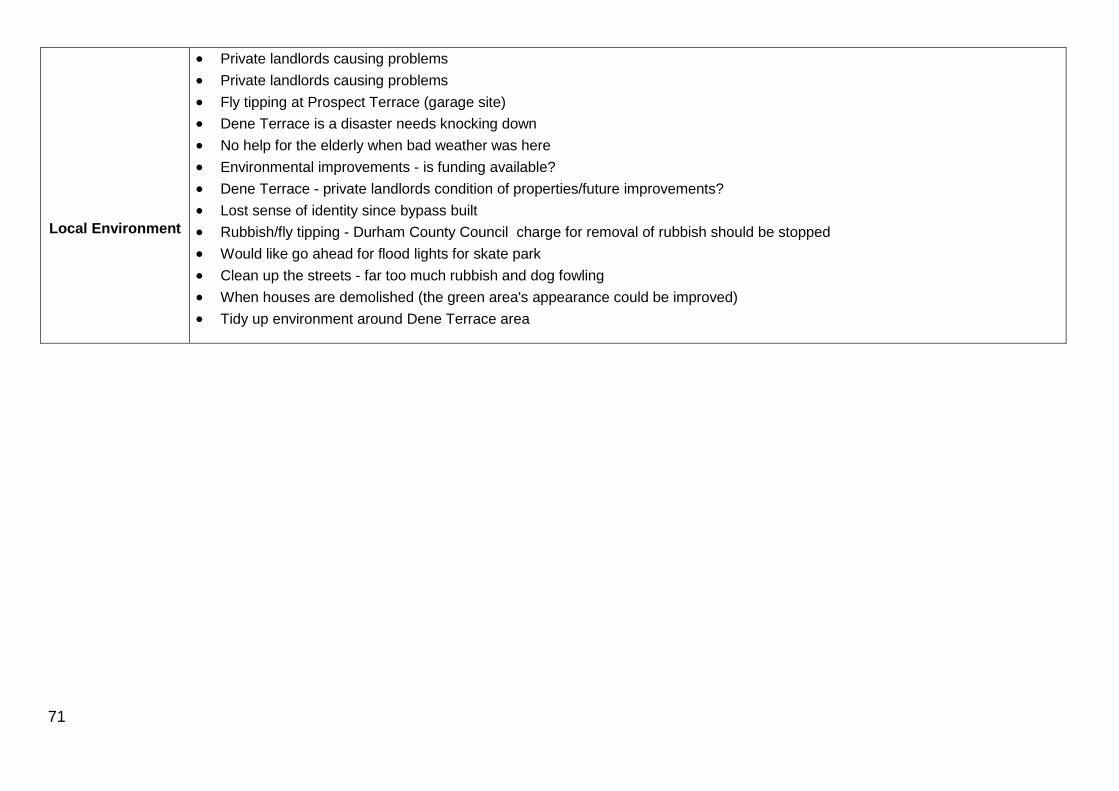
71
Local Environment
Private landlords causing problems
Private landlords causing problems
Fly tipping at Prospect Terrace (garage site)
Dene Terrace is a disaster needs knocking down
No help for the elderly when bad weather was here
Environmental improvements - is funding available?
Dene Terrace - private landlords condition of properties/future improvements?
Lost sense of identity since bypass built
Rubbish/fly tipping - Durham County Council charge for removal of rubbish should be stopped
Would like go ahead for flood lights for skate park
Clean up the streets - far too much rubbish and dog fowling
When houses are demolished (the green area's appearance could be improved)
Tidy up environment around Dene Terrace area
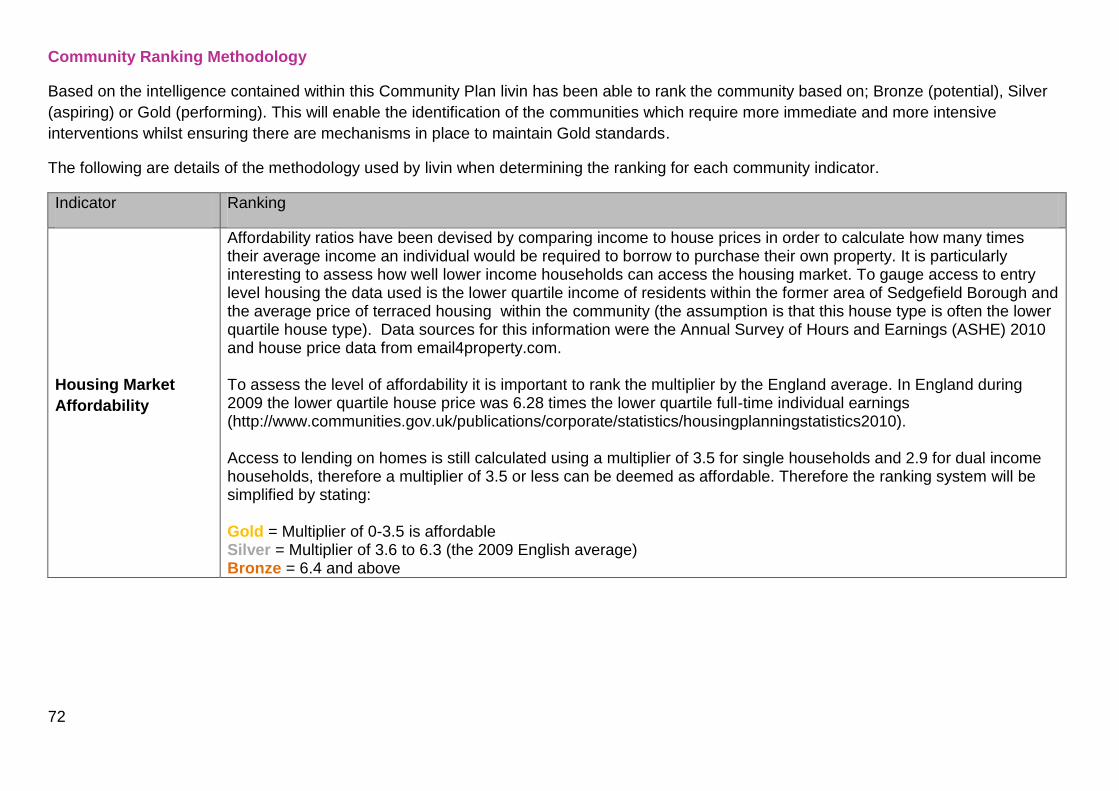
72
Community Ranking Methodology
Based on the intelligence contained within this Community Plan livin has been able to rank the community based on; Bronze (potential), Silver
(aspiring) or Gold (performing). This will enable the identification of the communities which require more immediate and more intensive
interventions whilst ensuring there are mechanisms in place to maintain Gold standards.
The following are details of the methodology used by livin when determining the ranking for each community indicator.
Indicator Ranking
Housing Market
Affordability
Affordability ratios have been devised by comparing income to house prices in order to calculate how many times their average income an individual would be required to borrow to purchase their own property. It is particularly interesting to assess how well lower income households can access the housing market. To gauge access to entry level housing the data used is the lower quartile income of residents within the former area of Sedgefield Borough and the average price of terraced housing within the community (the assumption is that this house type is often the lower quartile house type). Data sources for this information were the Annual Survey of Hours and Earnings (ASHE) 2010 and house price data from email4property.com. To assess the level of affordability it is important to rank the multiplier by the England average. In England during 2009 the lower quartile house price was 6.28 times the lower quartile full-time individual earnings (http://www.communities.gov.uk/publications/corporate/statistics/housingplanningstatistics2010). Access to lending on homes is still calculated using a multiplier of 3.5 for single households and 2.9 for dual income households, therefore a multiplier of 3.5 or less can be deemed as affordable. Therefore the ranking system will be simplified by stating: Gold = Multiplier of 0-3.5 is affordable Silver = Multiplier of 3.6 to 6.3 (the 2009 English average) Bronze = 6.4 and above
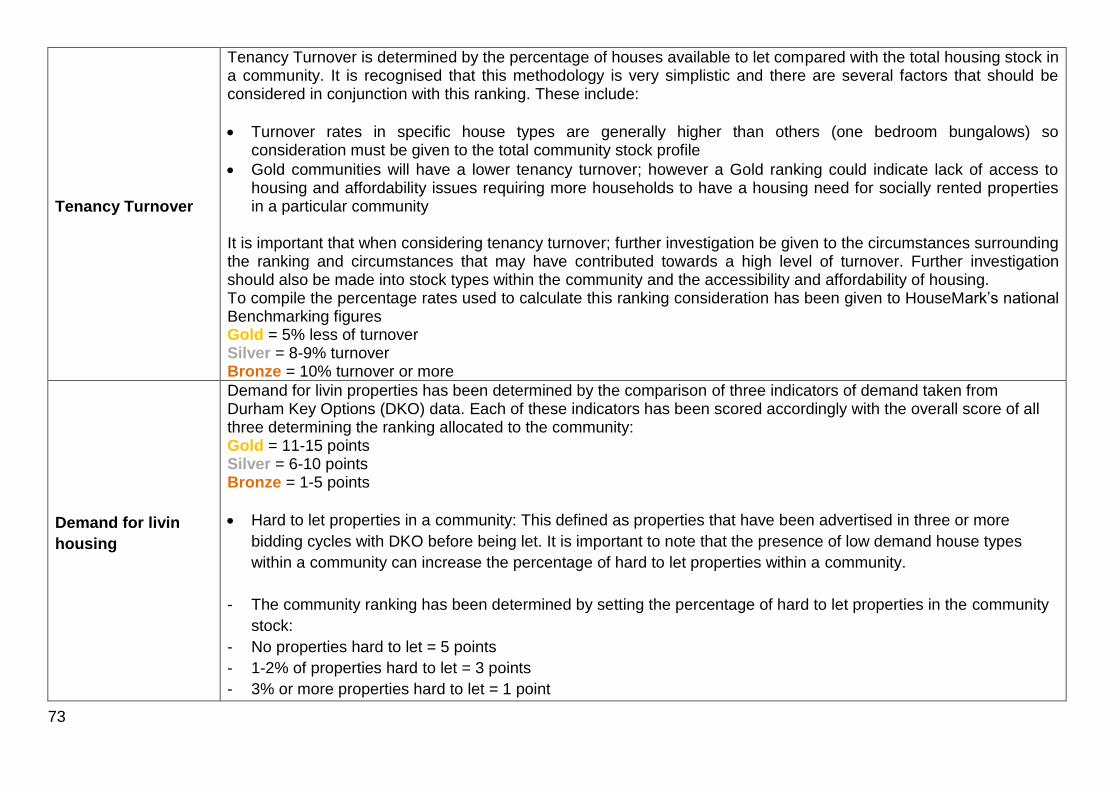
73
Tenancy Turnover
Tenancy Turnover is determined by the percentage of houses available to let compared with the total housing stock in a community. It is recognised that this methodology is very simplistic and there are several factors that should be considered in conjunction with this ranking. These include:
Turnover rates in specific house types are generally higher than others (one bedroom bungalows) so consideration must be given to the total community stock profile
Gold communities will have a lower tenancy turnover; however a Gold ranking could indicate lack of access to housing and affordability issues requiring more households to have a housing need for socially rented properties in a particular community
It is important that when considering tenancy turnover; further investigation be given to the circumstances surrounding the ranking and circumstances that may have contributed towards a high level of turnover. Further investigation should also be made into stock types within the community and the accessibility and affordability of housing. To compile the percentage rates used to calculate this ranking consideration has been given to HouseMark’s national Benchmarking figures Gold = 5% less of turnover Silver = 8-9% turnover Bronze = 10% turnover or more
Demand for livin
housing
Demand for livin properties has been determined by the comparison of three indicators of demand taken from Durham Key Options (DKO) data. Each of these indicators has been scored accordingly with the overall score of all three determining the ranking allocated to the community: Gold = 11-15 points Silver = 6-10 points Bronze = 1-5 points
Hard to let properties in a community: This defined as properties that have been advertised in three or more
bidding cycles with DKO before being let. It is important to note that the presence of low demand house types
within a community can increase the percentage of hard to let properties within a community.
- The community ranking has been determined by setting the percentage of hard to let properties in the community
stock:
- No properties hard to let = 5 points
- 1-2% of properties hard to let = 3 points
- 3% or more properties hard to let = 1 point
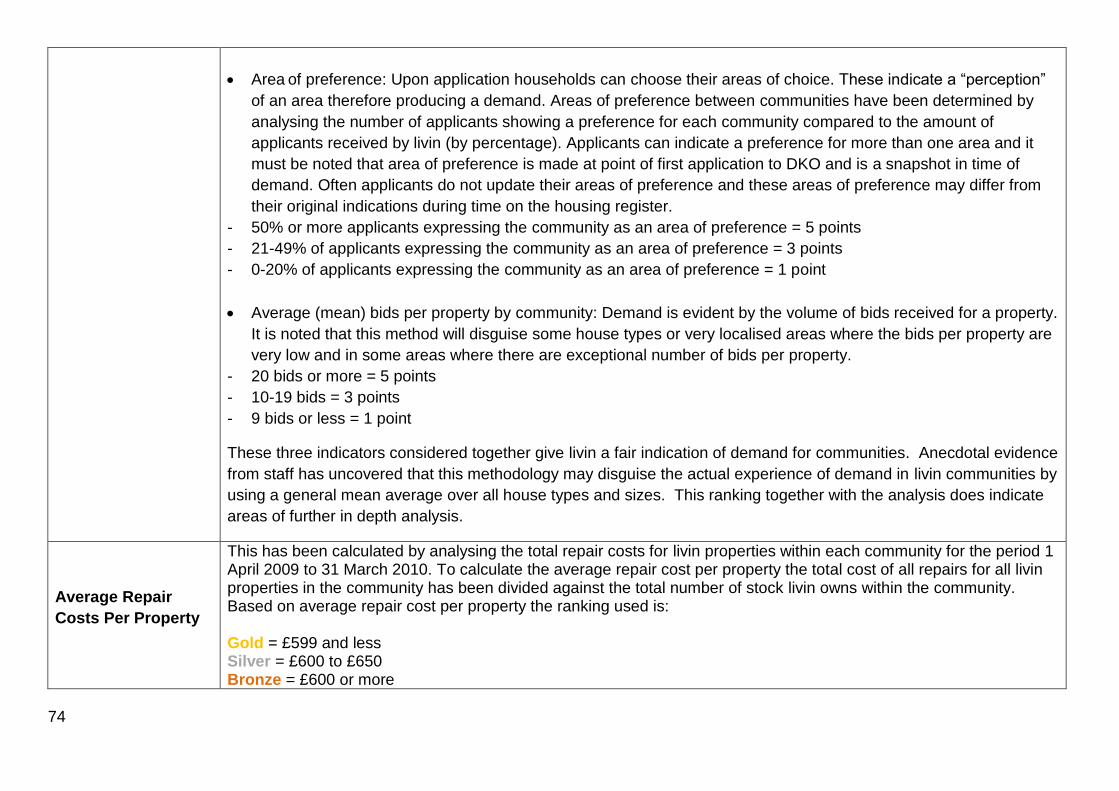
74
Area of preference: Upon application households can choose their areas of choice. These indicate a “perception”
of an area therefore producing a demand. Areas of preference between communities have been determined by
analysing the number of applicants showing a preference for each community compared to the amount of
applicants received by livin (by percentage). Applicants can indicate a preference for more than one area and it
must be noted that area of preference is made at point of first application to DKO and is a snapshot in time of
demand. Often applicants do not update their areas of preference and these areas of preference may differ from
their original indications during time on the housing register.
- 50% or more applicants expressing the community as an area of preference = 5 points
- 21-49% of applicants expressing the community as an area of preference = 3 points
- 0-20% of applicants expressing the community as an area of preference = 1 point
Average (mean) bids per property by community: Demand is evident by the volume of bids received for a property.
It is noted that this method will disguise some house types or very localised areas where the bids per property are
very low and in some areas where there are exceptional number of bids per property.
- 20 bids or more = 5 points
- 10-19 bids = 3 points
- 9 bids or less = 1 point
These three indicators considered together give livin a fair indication of demand for communities. Anecdotal evidence
from staff has uncovered that this methodology may disguise the actual experience of demand in livin communities by
using a general mean average over all house types and sizes. This ranking together with the analysis does indicate
areas of further in depth analysis.
Average Repair
Costs Per Property
This has been calculated by analysing the total repair costs for livin properties within each community for the period 1 April 2009 to 31 March 2010. To calculate the average repair cost per property the total cost of all repairs for all livin properties in the community has been divided against the total number of stock livin owns within the community. Based on average repair cost per property the ranking used is: Gold = £599 and less Silver = £600 to £650 Bronze = £600 or more
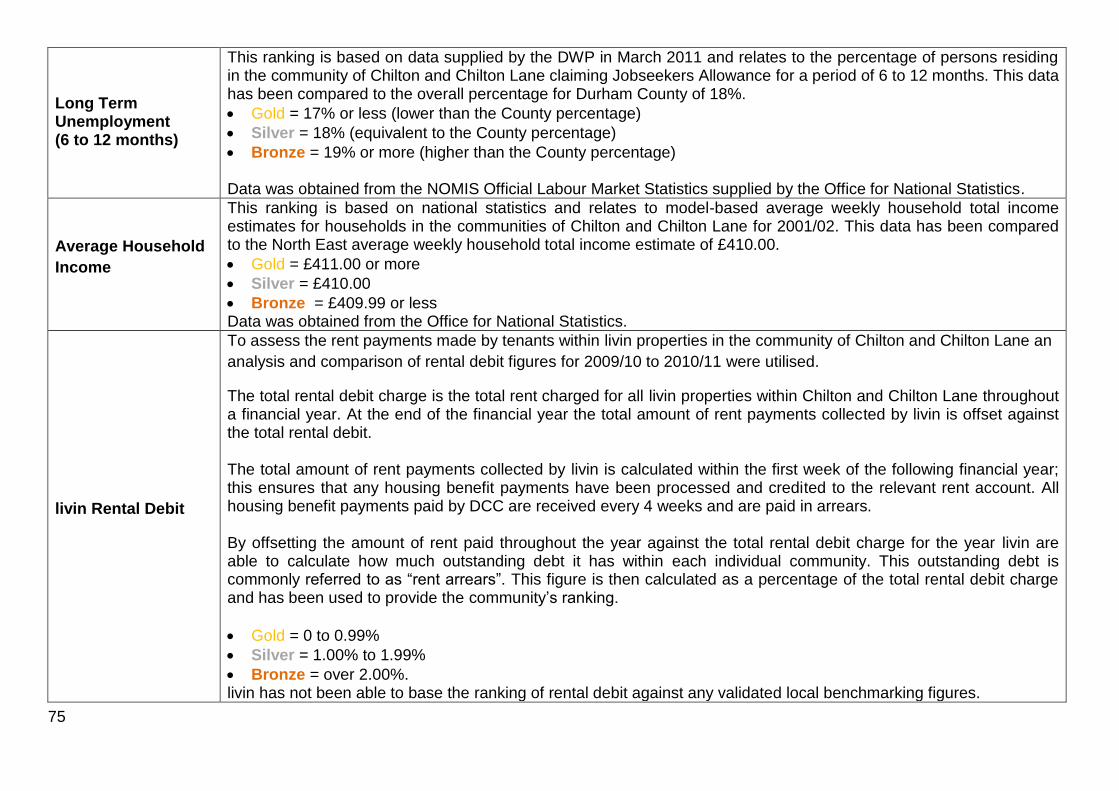
75
Long Term Unemployment (6 to 12 months)
This ranking is based on data supplied by the DWP in March 2011 and relates to the percentage of persons residing in the community of Chilton and Chilton Lane claiming Jobseekers Allowance for a period of 6 to 12 months. This data has been compared to the overall percentage for Durham County of 18%.
Gold = 17% or less (lower than the County percentage)
Silver = 18% (equivalent to the County percentage)
Bronze = 19% or more (higher than the County percentage) Data was obtained from the NOMIS Official Labour Market Statistics supplied by the Office for National Statistics.
Average Household
Income
This ranking is based on national statistics and relates to model-based average weekly household total income estimates for households in the communities of Chilton and Chilton Lane for 2001/02. This data has been compared to the North East average weekly household total income estimate of £410.00.
Gold = £411.00 or more
Silver = £410.00
Bronze = £409.99 or less Data was obtained from the Office for National Statistics.
livin Rental Debit
To assess the rent payments made by tenants within livin properties in the community of Chilton and Chilton Lane an
analysis and comparison of rental debit figures for 2009/10 to 2010/11 were utilised.
The total rental debit charge is the total rent charged for all livin properties within Chilton and Chilton Lane throughout a financial year. At the end of the financial year the total amount of rent payments collected by livin is offset against the total rental debit. The total amount of rent payments collected by livin is calculated within the first week of the following financial year; this ensures that any housing benefit payments have been processed and credited to the relevant rent account. All housing benefit payments paid by DCC are received every 4 weeks and are paid in arrears. By offsetting the amount of rent paid throughout the year against the total rental debit charge for the year livin are able to calculate how much outstanding debt it has within each individual community. This outstanding debt is commonly referred to as “rent arrears”. This figure is then calculated as a percentage of the total rental debit charge and has been used to provide the community’s ranking.
Gold = 0 to 0.99%
Silver = 1.00% to 1.99%
Bronze = over 2.00%. livin has not been able to base the ranking of rental debit against any validated local benchmarking figures.
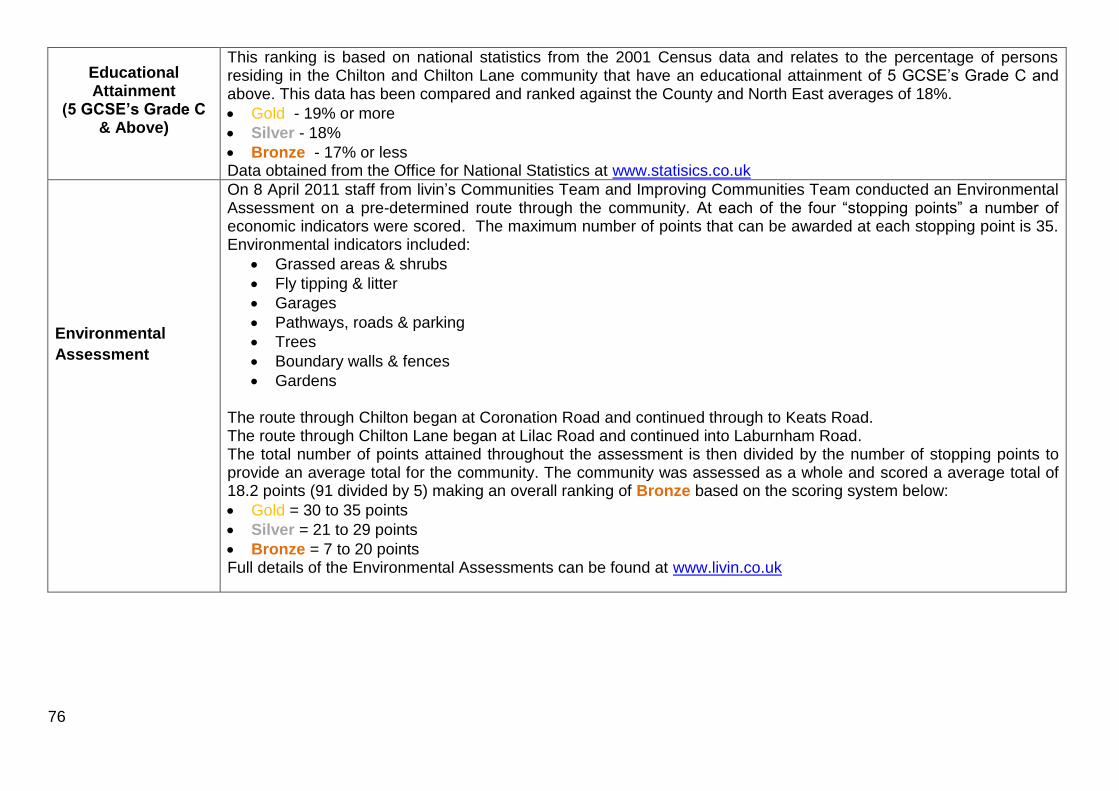
76
Educational Attainment
(5 GCSE’s Grade C & Above)
This ranking is based on national statistics from the 2001 Census data and relates to the percentage of persons residing in the Chilton and Chilton Lane community that have an educational attainment of 5 GCSE’s Grade C and above. This data has been compared and ranked against the County and North East averages of 18%.
Gold - 19% or more
Silver - 18%
Bronze - 17% or less Data obtained from the Office for National Statistics at www.statisics.co.uk
Environmental
Assessment
On 8 April 2011 staff from livin’s Communities Team and Improving Communities Team conducted an Environmental Assessment on a pre-determined route through the community. At each of the four “stopping points” a number of economic indicators were scored. The maximum number of points that can be awarded at each stopping point is 35. Environmental indicators included:
Grassed areas & shrubs
Fly tipping & litter
Garages
Pathways, roads & parking
Trees
Boundary walls & fences
Gardens The route through Chilton began at Coronation Road and continued through to Keats Road. The route through Chilton Lane began at Lilac Road and continued into Laburnham Road. The total number of points attained throughout the assessment is then divided by the number of stopping points to provide an average total for the community. The community was assessed as a whole and scored a average total of 18.2 points (91 divided by 5) making an overall ranking of Bronze based on the scoring system below:
Gold = 30 to 35 points
Silver = 21 to 29 points
Bronze = 7 to 20 points Full details of the Environmental Assessments can be found at www.livin.co.uk
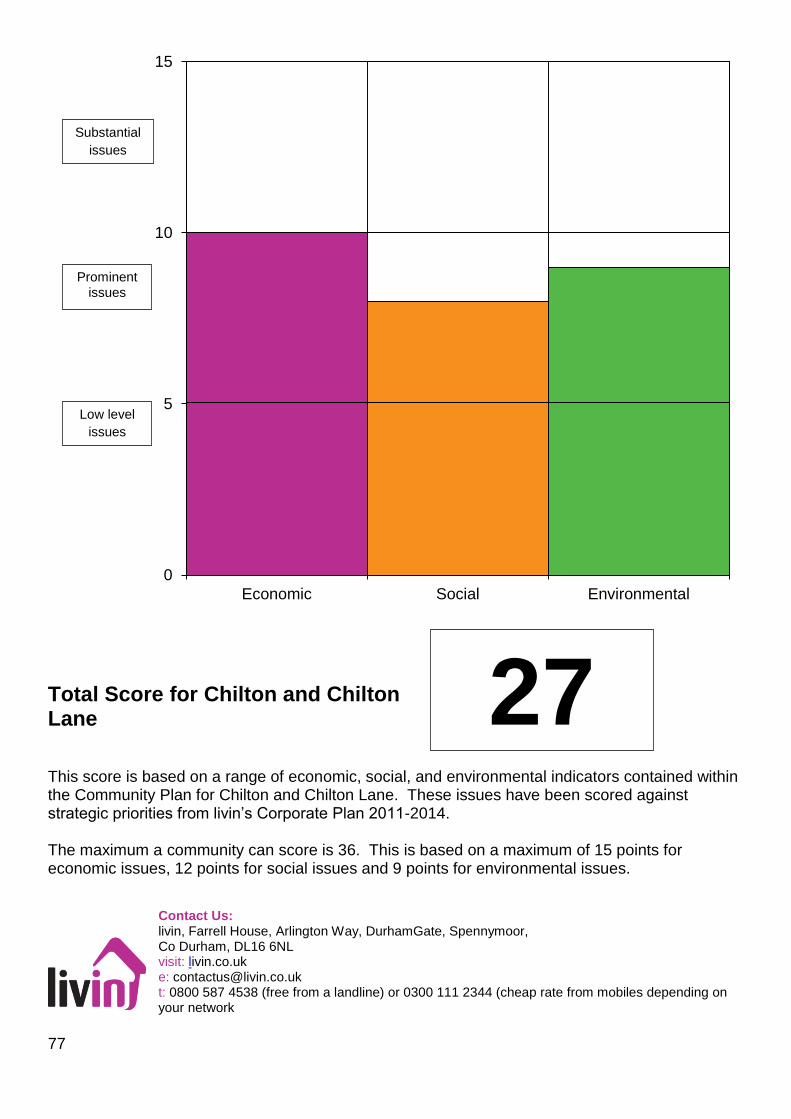
77
Total Score for Chilton and Chilton Lane This score is based on a range of economic, social, and environmental indicators contained within the Community Plan for Chilton and Chilton Lane. These issues have been scored against strategic priorities from livin’s Corporate Plan 2011-2014. The maximum a community can score is 36. This is based on a maximum of 15 points for economic issues, 12 points for social issues and 9 points for environmental issues.
Contact Us:
livin, Farrell House, Arlington Way, DurhamGate, Spennymoor, Co Durham, DL16 6NL visit: livin.co.uk e: [email protected] t: 0800 587 4538 (free from a landline) or 0300 111 2344 (cheap rate from mobiles depending on your network
0
5
10
15
Economic Social Environmental
Low level
issues
Prominent issues
Substantial
issues
27