china airlines, ltd. and subsidiaries · 2020-06-18 · - 7 - china airlines, ltd. and subsidiaries...
TRANSCRIPT

China Airlines, Ltd. and Subsidiaries Consolidated Financial Statements for the Years Ended December 31, 2019 and 2018 and Independent Auditors’ Report
- 1 -
DECLARATION OF CONSOLIDATION OF FINANCIAL STATEMENTS OF AFFILIATES
The companies required to be included in the consolidated financial statements of affiliates in accordance
with the “Criteria Governing Preparation of Affiliation Reports, Consolidated Business Reports and
Consolidated Financial Statements of Affiliated Enterprises” for the year ended December 31, 2019 are
all the same as the companies required to be included in the consolidated financial statements of parent
and subsidiary companies as provided in International Financial Reporting Standard 10 “Consolidated
Financial Statements.” Relevant information that should be disclosed in the consolidated financial
statements of affiliates has all been disclosed in the consolidated financial statements of parent and
subsidiary companies. Hence, we have not prepared a separate set of consolidated financial statements of
affiliates.
Very truly yours,
CHINA AIRLINES, LTD.
By
Hsieh, Su-Chien
March 18, 2020

- 2 -
INDEPENDENT AUDITORS’ REPORT
The Board of Directors and Shareholders
China Airlines, Ltd.
Opinion
We have audited the accompanying consolidated financial statements of China Airlines, Ltd. and
its subsidiaries (collectively referred to as the “Group”), which comprise the consolidated balance
sheets as of December 31, 2019 and 2018, and the consolidated statements of comprehensive
income, changes in equity and cash flows for the years then ended, and the notes to the
consolidated financial statements, including a summary of significant accounting policies.
(collectively referred to as the “consolidated financial statements”)
In our opinion, the accompanying consolidated financial statements present fairly, in all material
respects, the consolidated financial position of the Group as of December 31, 2019 and 2018, and
its consolidated financial performance and its consolidated cash flows for the years then ended in
accordance with the Regulations Governing the Preparation of Financial Reports by Securities
Issuers, and International Financial Reporting Standards (IFRS), International Accounting
Standards (IAS), IFRIC Interpretations (IFRIC), and SIC Interpretations (SIC) endorsed and issued
into effect by the Financial Supervisory Commission of the Republic of China.
Basis for Opinion
We conducted our audits in accordance with the Regulations Governing Auditing and Attestation
of Financial Statements by Certified Public Accountants and auditing standards generally accepted
in the Republic of China. Our responsibilities under those standards are further described in the
Auditors’ Responsibilities for the Audit of the Consolidated Financial Statements section of our
report. We are independent of the Group in accordance with The Norm of Professional Ethics for
Certified Public Accountant of the Republic of China, and we have fulfilled our other ethical
responsibilities in accordance with these requirements. We believe that the audit evidence we have
obtained is sufficient and appropriate to provide a basis for our opinion.
Key Audit Matters
Key audit matters are those matters that, in our professional judgment, were of most significance in
our audit of the consolidated financial statements for the year ended December 31, 2019. These
matters were addressed in the context of our audit of the consolidated financial statements as a
whole, and in forming our opinion thereon, and we do not provide a separate opinion on these
matters.
- 3 -
The key audit matters in the audit of the consolidated financial statements of the Group are stated
below:
Passenger Revenue Recognition
In accordance with IFRS 15 “Revenue from Contracts with Customers”, passenger sales are
accounted for as contract liabilities before relevant transportation services are provided. After
providing the related services, contract liabilities are reclassified to passenger revenue. For the year
ended December 31, 2019, passenger revenue was NT$111,413,435 thousand. Refer to Notes 4 and
27 to the accompanying consolidated financial statements for related detailed information.
Since relevant sales can only be recognized as passenger revenue when passengers actually
boarded, confirmation from each passenger holding the ticket who actually boarded involves a
complicated process; therefore, we identified passenger revenue recognition as a key audit matter.
The main audit procedures that we performed included the following:
1. We understood and tested the internal control related to the process of revenue from passenger,
including manual and automatic control.
2. We understood and tested the effectiveness of the information system related to the process of
passenger revenue.
3. We sampled several flight tickets, which were flown and recognized as revenue, to verify
whether the boarding date matched the date recorded on the tickets, from advanced sales
tickets.
Initial Application of IFRS 16 (Leases) - Aircraft
In accordance with IFRS 16 “Leases”, aircraft leases initially classified as finance leases under IAS
17 should be recognized as Right-of-use assets and lease liabilities in the consolidated balances
sheet. As of December 31, 2019, the carrying amount of Right-of-use assets and lease liabilities
(including financial liabilities for hedging) relating to aircraft leases are NT$62,052,701 thousand
and NT$60,114,778 thousand, respectively. Refer to Notes 4 and 21 to the accompanying
consolidated financial statements for related detailed information.
China Airlines, Mandarin Airlines and Tigerair Taiwan leased ten 777-300ER planes, fifteen
A330-300 planes, fifteen 737-800 planes, ten A320-200 planes, six ERJ190 planes and three
ART72-600 planes for operation. Because the lease term of aircraft is higher and the amount of
rental is higher, the percentage of right-of-use assets and lease liabilities of the aircraft in the
consolidated balance sheets is high. The parameters and lease terms are determined by the
management, and the calculation of the lease liabilities will affect the carrying amount and
depreciation expense of the right-of-use assets and lease liabilities (including financial liabilities for
hedging) relating to aircrafts. Therefore, we identified initial application of IFRS 16 - Aircrafts as a
key audit matter.
The main audit procedures that we performed included the following:
1. We understood and tested the effectiveness of the information system related to the calculation
of lease liabilities.
- 4 -
2. We selected one of the rental payments schedule of the aircraft from the lease calculation
system, to recalculate amount of the lease liabilities balance and financial cost and
amortization of right-of-use, and related carrying amount. Also, we selected several aircraft
lease contracts from the carrying amounts of aircraft lease liability, and checked if there was
any difference between rental in the aircraft rental payment schedule and lease term in the
contracted rentals. And we checked if the lease term used the rental payment schedule was
consistent with the contract.
Other Matter Audit by Other Independent Auditors
We did not audit some subsidiaries which were included in the consolidated financial statements.
The financial statements and disclosed information were audited by other independent auditors, and
our audit opinion is based solely on the audit report of other independent auditors.
As of December 31, 2019, total assets of these subsidiaries amounted to NT$13,337,093 thousand
dollars, representing 4.55% of the total assets. For the year ended December 31, 2019, revenue
from these subsidiaries amounted to NT$9,513,321thousand dollars, representing 5.65% of the
total revenue.
Other Matter Parent Company Only Financial Statements
We have also audited the parent company only financial statements of China Airlines, Ltd. as of
and for the years ended December 31, 2019 and 2018 on which we have issued an unmodified
opinion.
Responsibilities of Management and Those Charged with Governance for the Consolidated
Financial Statements
Management is responsible for the preparation and fair presentation of the consolidated financial
statements in accordance with the Regulations Governing the Preparation of Financial Reports by
Securities Issuers, and International Financial Reporting Standards (IFRS), International
Accounting Standards (IAS), IFRIC Interpretations (IFRIC), and SIC Interpretations (SIC)
endorsed and issued into effect by the Financial Supervisory Commission of the Republic of China,
and for such internal control as management determines is necessary to enable the preparation of
consolidated financial statements that are free from material misstatement, whether due to fraud or
error.
In preparing the consolidated financial statements, management is responsible for assessing the
Group’s ability to continue as a going concern, disclosing, as applicable, matters related to going
concern and using the going concern basis of accounting unless management either intends to
liquidate the Group or to cease operations, or has no realistic alternative but to do so.
Those charged with governance, including the audit committee and supervisors, are responsible for
overseeing the Group’s financial reporting process.
Auditors’ Responsibilities for the Audit of the Consolidated Financial Statements
Our objectives are to obtain reasonable assurance about whether the consolidated financial
statements as a whole are free from material misstatement, whether due to fraud or error, and to
issue an auditors’ report that includes our opinion. Reasonable assurance is a high level of
assurance, but is not a guarantee that an audit conducted in accordance with the auditing standards
generally accepted in the Republic of China will always detect a material misstatement when it
exists. Misstatements can arise from fraud or error and are considered material if, individually or in
the aggregate, they could reasonably be expected to influence the economic decisions of users
taken on the basis of these consolidated financial statements.
- 5 -
As part of an audit in accordance with the auditing standards generally accepted in the Republic of
China, we exercise professional judgment and maintain professional skepticism throughout the
audit. We also:
1. Identify and assess the risks of material misstatement of the consolidated financial statements,
whether due to fraud or error, design and perform audit procedures responsive to those risks,
and obtain audit evidence that is sufficient and appropriate to provide a basis for our opinion.
The risk of not detecting a material misstatement resulting from fraud is higher than for one
resulting from error, as fraud may involve collusion, forgery, intentional omissions,
misrepresentations, or the override of internal control.
2. Obtain an understanding of internal control relevant to the audit in order to design audit
procedures that are appropriate in the circumstances, but not for the purpose of expressing an
opinion on the effectiveness of the Group’s internal control.
3. Evaluate the appropriateness of accounting policies used and the reasonableness of accounting
estimates and related disclosures made by management.
4. Conclude on the appropriateness of management’s use of the going concern basis of
accounting and, based on the audit evidence obtained, whether a material uncertainty exists
related to events or conditions that may cast significant doubt on the Group’s ability to
continue as a going concern. If we conclude that a material uncertainty exists, we are required
to draw attention in our auditors’ report to the related disclosures in the consolidated financial
statements or, if such disclosures are inadequate, to modify our opinion. Our conclusions are
based on the audit evidence obtained up to the date of our auditors’ report. However, future
events or conditions may cause the Group to cease to continue as a going concern.
5. Evaluate the overall presentation, structure and content of the consolidated financial statements,
including the disclosures, and whether the consolidated financial statements represent the
underlying transactions and events in a manner that achieves fair presentation.
6. Obtain sufficient and appropriate audit evidence regarding the financial information of entities
or business activities within the Group to express an opinion on the consolidated financial
statements. We are responsible for the direction, supervision, and performance of the group
audit. We remain solely responsible for our audit opinion.
We communicate with those charged with governance regarding, among other matters, the planned
scope and timing of the audit and significant audit findings, including any significant deficiencies
in internal control that we identify during our audit.
We also provide those charged with governance with a statement that we have complied with
relevant ethical requirements regarding independence, and to communicate with them all
relationships and other matters that may reasonably be thought to bear on our independence, and
where applicable, related safeguards.
From the matters communicated with those charged with governance, we determine those matters
that were of most significance in the audit of the consolidated financial statements for the year
ended December 31, 2019 and are therefore the key audit matters. We describe these matters in our
auditors’ report unless law or regulation precludes public disclosure about the matter or when, in
extremely rare circumstances, we determine that a matter should not be communicated in our report
because the adverse consequences of doing so would reasonably be expected to outweigh the
public interest benefits of such communication.
- 6 -
The engagement partners on the audit resulting in this independent auditors’ report are Jui-Chan
Huang and Shiuh-Ran, Cheng.
Deloitte & Touche
Taipei, Taiwan
Republic of China
March 18, 2020
Notice to Readers
The accompanying consolidated financial statements are intended only to present the consolidated
financial position, financial performance and cash flows in accordance with accounting principles
and practices generally accepted in the Republic of China and not those of any other jurisdictions.
The standards, procedures and practices to audit such consolidated financial statements are those
generally applied in the Republic of China.
For the convenience of readers, the independent auditors’ report and the accompanying
consolidated financial statements have been translated into English from the original Chinese
version prepared and used in the Republic of China. If there is any conflict between the English
version and the original Chinese version or any difference in the interpretation of the two versions,
the Chinese-language independent auditors’ report and consolidated financial statements shall
prevail.

- 7 -
CHINA AIRLINES, LTD. AND SUBSIDIARIES
CONSOLIDATED BALANCE SHEETS
DECEMBER 31, 2019 AND 2018
(In Thousands of New Taiwan Dollars)
2019 2018
ASSETS Amount % Amount %
CURRENT ASSETS
Cash and cash equivalents (Notes 4, 6, 19 and 33) $ 28,459,528 10 $ 24,937,537 11
Financial assets at fair value through profit or loss - current (Notes 4, 7 and 32) 512,192 - 206,001 -
Financial assets at amortized cost (Notes 9 and 32) 2,355,095 1 3,856,660 2
Financial assets for hedging - current (Notes 4 and 32) 9,626 - 32,906 -
Notes and accounts receivable, net (Notes 4, 10 and 32) 8,520,834 3 10,038,528 4
Notes and accounts receivable - related parties (Notes 32 and 33) 10,348 - 9,043 -
Other receivables (Notes 4 and 32) 774,206 - 879,191 -
Current tax assets (Notes 4 and 29) 54,689 - 18,948 -
Inventories, net (Notes 4 and 11) 8,470,113 3 8,654,710 4
Non-current assets held for sale (Notes 4, 5 and 12) - - 46,154 -
Other assets - current (Notes 6 and 18) 2,655,711 1 4,147,882 2
Total current assets 51,822,342 18 52,827,560 23
NON-CURRENT ASSETS
Financial assets at fair value through other comprehensive income - non-current (Notes 8 and 32) 209,221 - 132,191 -
Financial assets at amortized cost (Notes 4 and 9) 105,586 - - -
Investments accounted for using the equity method (Notes 4 and 14) 2,223,793 1 2,200,149 1
Property, plant and equipment (Notes 4, 5, 15 and 35) 145,886,971 50 163,107,718 71
Right-of-use assets (Notes 4, 21 and 35) 71,033,617 24 - -
Investment properties (Notes 4 and 16) 2,075,068 1 2,075,345 1
Other intangible assets (Notes 4 and 17) 1,182,692 - 1,210,796 1
Deferred income tax asset (Notes 4, 5 and 29) 5,337,626 2 5,152,070 2
Other assets - non-current (Notes 18, 21, 32 and 34) 13,171,063 4 3,430,753 1
Total non-current assets 241,225,637 82 177,309,022 77
TOTAL $ 293,047,979 100 $ 230,136,582 100
LIABILITIES AND EQUITY
CURRENT LIABILITIES
Short-term debts (Note 19) $ 380,000 - $ - -
Financial liabilities at fair value through profit or loss - current (Notes 4, 5, 7 and 32) 11,749 - 221 -
Financial liabilities for hedging - current (Notes 4, 21 and 32) 8,618,506 3 560 -
Notes and accounts payable (Note 32) 1,495,606 1 1,594,487 1
Accounts payable - related parties (Notes 32 and 33) 542,015 - 532,815 -
Other payables (Notes 22 and 32) 13,187,972 5 14,146,198 6
Current tax liabilities (Notes 4 and 29) 374,178 - 164,181 -
Lease liabilities - current (Notes 3, 4 and 21) 2,340,873 1 - -
Provisions - current (Notes 4 and 24) 360,393 - 321,075 -
Contract liabilities - current (Note 23) 21,060,773 7 19,546,455 9
Bonds payable and put option of convertible bonds - current portion (Notes 4, 20, 27 and 32) 10,000,000 3 4,445,900 2
Loans and debts - current portion (Notes 19, 32 and 35) 14,148,892 5 15,709,487 7
Capital lease obligations - current portion (Notes 4, 21, 32 and 35) - - 633,398 -
Other current liabilities (Note 33) 3,830,570 1 3,855,115 2
Total current liabilities 76,351,527 26 60,949,892 27
NON-CURRENT LIABILITIES
Derivative financial liabilities for hedging - non-current (Notes 3, 4, 21 and 33) 42,420,205 15 - -
Bonds payable - non-current (Notes 4, 20, 27 and 32) 22,052,625 8 28,473,710 12
Loans and debts - non-current (Notes 19, 32 and 35) 53,514,891 18 60,686,148 26
Contract liabilities - non-current (Notes 4 and 23) 2,236,311 1 1,903,665 1
Provisions - non-current (Notes 4 and 24) 10,011,464 3 8,473,464 4
Deferred tax liabilities (Notes 4 and 29) 557,142 - 188,447 -
Lease liabilities - non-current (Notes 3, 4, 21 and 25) 15,801,724 5 - -
Capital lease obligations - non-current (Notes 4, 21, 32 and 35) - - 2,945 -
Accrued pension costs (Notes 4, 5 and 25) 9,435,035 3 8,803,382 4
Other non-current liabilities (Note 32) 534,938 - 607,845 -
Total non-current liabilities 156,564,335 53 109,139,606 47
Total liabilities 232,915,862 79 170,089,498 74
EQUITY ATTRIBUTABLE TO OWNERS OF THE COMPANY (Notes 20 and 26)
Share capital 54,209,846 19 54,209,846 24
Capital surplus 2,488,907 1 1,241,214 -
Retained earnings
Legal reserve 466,416 - 351,923 -
Special reserve 12,967 - 118,810 -
Unappropriated retained earnings (accumulated deficits) (1,777,225) - 1,144,928 1
Total retained earnings (1,297,842) - 1,615,661 1
Other equity 1,196,233 - 58,223 -
Treasury shares (43,372) - (43,372) -
Total equity attributable to owners of the Company 56,553,772 20 57,081,572 25
NON-CONTROLLING INTERESTS (Note 26) 3,578,345 1 2,965,512 1
Total equity 60,132,117 21 60,047,084 26
TOTAL $ 293,047,979 100 $ 230,136,582 100
The accompanying notes are an integral part of the consolidated financial statements.
- 8 -
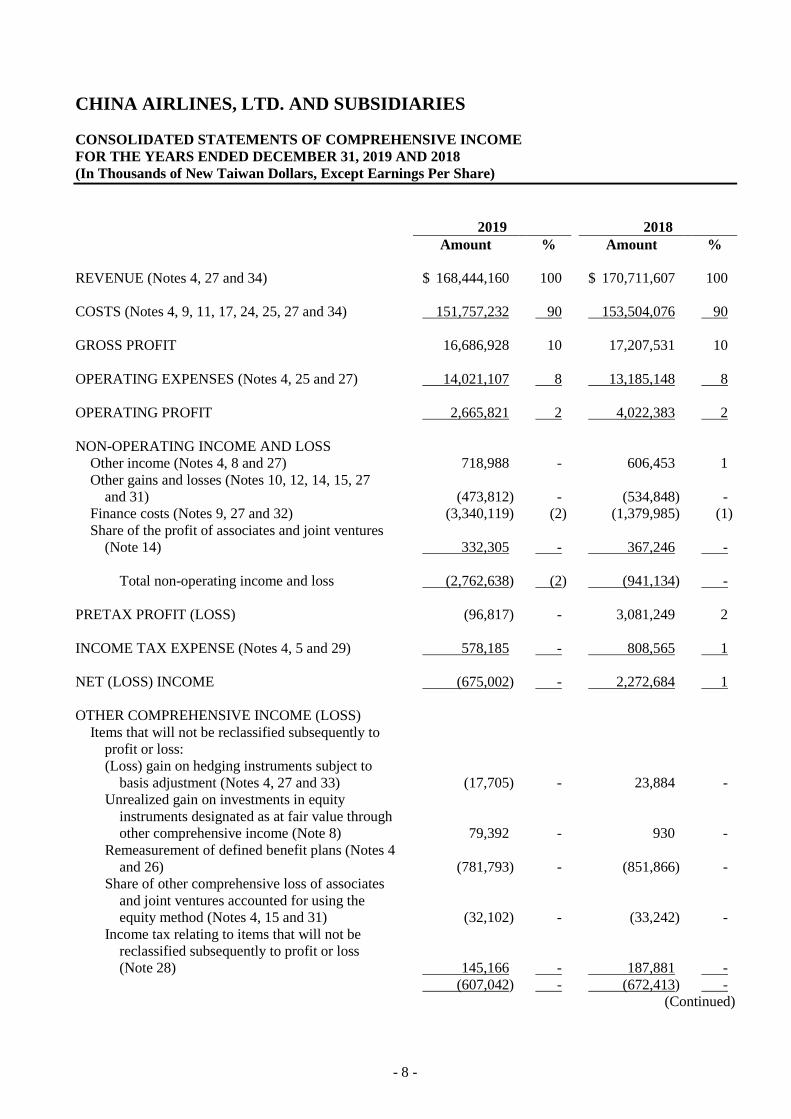
CHINA AIRLINES, LTD. AND SUBSIDIARIES
CONSOLIDATED STATEMENTS OF COMPREHENSIVE INCOME
FOR THE YEARS ENDED DECEMBER 31, 2019 AND 2018
(In Thousands of New Taiwan Dollars, Except Earnings Per Share)
2019 2018
Amount % Amount %
REVENUE (Notes 4, 27 and 34) $ 168,444,160 100 $ 170,711,607 100
COSTS (Notes 4, 9, 11, 17, 24, 25, 27 and 34) 151,757,232 90 153,504,076 90
GROSS PROFIT 16,686,928 10 17,207,531 10
OPERATING EXPENSES (Notes 4, 25 and 27) 14,021,107 8 13,185,148 8
OPERATING PROFIT 2,665,821 2 4,022,383 2
NON-OPERATING INCOME AND LOSS
Other income (Notes 4, 8 and 27) 718,988 - 606,453 1
Other gains and losses (Notes 10, 12, 14, 15, 27
and 31) (473,812) - (534,848) -
Finance costs (Notes 9, 27 and 32) (3,340,119) (2) (1,379,985) (1)
Share of the profit of associates and joint ventures
(Note 14) 332,305 - 367,246 -
Total non-operating income and loss (2,762,638) (2) (941,134) -
PRETAX PROFIT (LOSS) (96,817) - 3,081,249 2
INCOME TAX EXPENSE (Notes 4, 5 and 29) 578,185 - 808,565 1
NET (LOSS) INCOME (675,002) - 2,272,684 1
OTHER COMPREHENSIVE INCOME (LOSS)
Items that will not be reclassified subsequently to
profit or loss:
(Loss) gain on hedging instruments subject to
basis adjustment (Notes 4, 27 and 33) (17,705) - 23,884 -
Unrealized gain on investments in equity
instruments designated as at fair value through
other comprehensive income (Note 8) 79,392 - 930 -
Remeasurement of defined benefit plans (Notes 4
and 26) (781,793) - (851,866) -
Share of other comprehensive loss of associates
and joint ventures accounted for using the
equity method (Notes 4, 15 and 31) (32,102) - (33,242) -
Income tax relating to items that will not be
reclassified subsequently to profit or loss
(Note 28) 145,166 - 187,881 -
(607,042) - (672,413) -
(Continued)

- 9 -
CHINA AIRLINES, LTD. AND SUBSIDIARIES
CONSOLIDATED STATEMENTS OF COMPREHENSIVE INCOME
FOR THE YEARS ENDED DECEMBER 31, 2019 AND 2018
(In Thousands of New Taiwan Dollars, Except Earnings Per Share)
2019 2018
Amount % Amount %
Items that may be reclassified subsequently to profit
or loss:
Exchange differences on translating foreign
operations (Notes 4 and 27) $ (72,952) - $ 26,567 -
Gain on hedging instruments not subject to basis
adjustment (Notes 4, 27 and 33) 1,411,623 - 85,341 -
Income tax relating to items that may be
reclassified subsequently to profit or loss
(Note 28) (268,871) - (17,858) -
1,069,800 - 94,050 -
Other comprehensive gain (loss) for the year,
net of income tax 462,758 - (578,363) -
TOTAL COMPREHENSIVE (LOSS) INCOME FOR
THE YEAR $ (212,244) - $ 1,694,321 1
NET INCOME ATTRIBUTABLE TO:
Owners of the Company $ (1,199,798) (1) $ 1,790,361 1
Non-controlling interests 524,796 1 482,323 -
$ (675,002) - $ 2,272,684 1
TOTAL COMPREHENSIVE INCOME
ATTRIBUTABLE TO:
Owners of the Company $ (647,085) - $ 1,258,035 1
Non-controlling interests 434,841 - 436,286 -
$ (212,244) - $ 1,694,321 1
EARNINGS PER SHARE (NEW TAIWAN
DOLLARS; Note 30)
Basic $ (0.22) $ 0.33
Diluted $ (0.22) $ 0.32
The accompanying notes are an integral part of the consolidated financial statements. (Concluded)
- 10 -
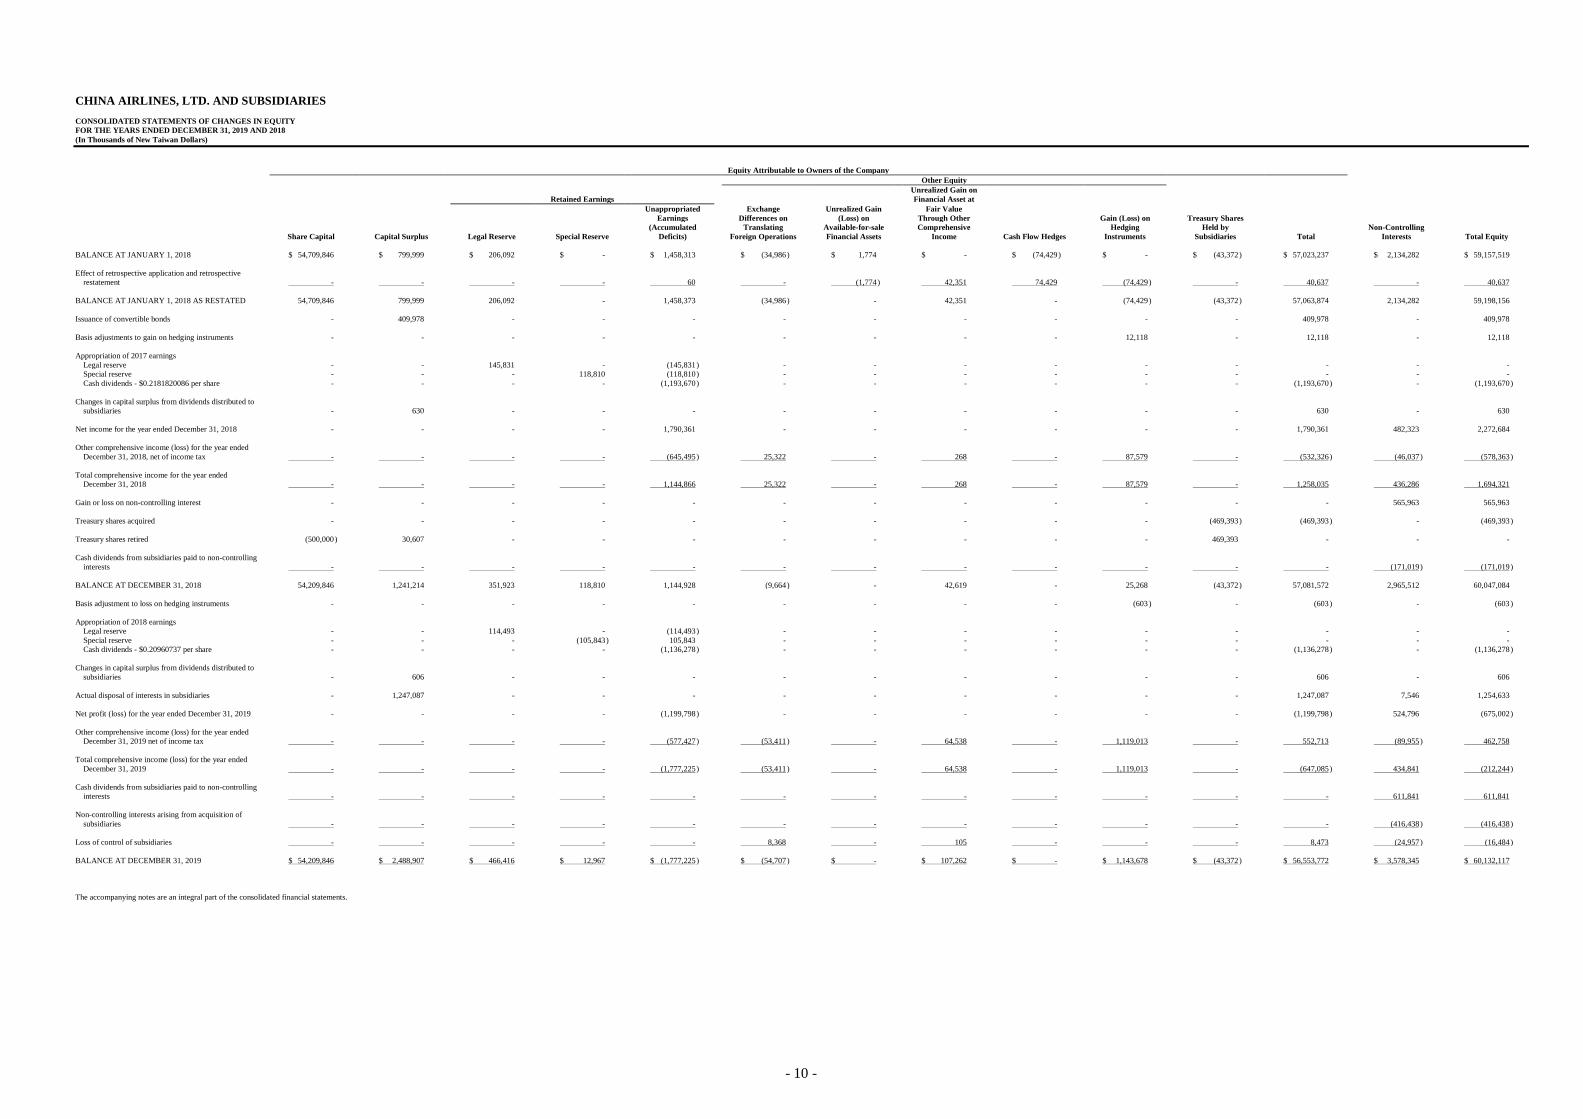
CHINA AIRLINES, LTD. AND SUBSIDIARIES
CONSOLIDATED STATEMENTS OF CHANGES IN EQUITY
FOR THE YEARS ENDED DECEMBER 31, 2019 AND 2018
(In Thousands of New Taiwan Dollars)
Equity Attributable to Owners of the Company
Other Equity
Unrealized Gain on
Retained Earnings Financial Asset at
Unappropriated Exchange Unrealized Gain Fair Value
Earnings Differences on (Loss) on Through Other Gain (Loss) on Treasury Shares
(Accumulated Translating Available-for-sale Comprehensive Hedging Held by Non-Controlling
Share Capital Capital Surplus Legal Reserve Special Reserve Deficits) Foreign Operations Financial Assets Income Cash Flow Hedges Instruments Subsidiaries Total Interests Total Equity
BALANCE AT JANUARY 1, 2018 $ 54,709,846 $ 799,999 $ 206,092 $ - $ 1,458,313 $ (34,986 ) $ 1,774 $ - $ (74,429 ) $ - $ (43,372 ) $ 57,023,237 $ 2,134,282 $ 59,157,519
Effect of retrospective application and retrospective
restatement - - - - 60 - (1,774 ) 42,351 74,429 (74,429 ) - 40,637 - 40,637
BALANCE AT JANUARY 1, 2018 AS RESTATED 54,709,846 799,999 206,092 - 1,458,373 (34,986 ) - 42,351 - (74,429 ) (43,372 ) 57,063,874 2,134,282 59,198,156
Issuance of convertible bonds - 409,978 - - - - - - - - - 409,978 - 409,978
Basis adjustments to gain on hedging instruments - - - - - - - - - 12,118 - 12,118 - 12,118
Appropriation of 2017 earnings
Legal reserve - - 145,831 - (145,831 ) - - - - - - - - -
Special reserve - - - 118,810 (118,810 ) - - - - - - - - -
Cash dividends - $0.2181820086 per share - - - - (1,193,670 ) - - - - - - (1,193,670 ) - (1,193,670 )
Changes in capital surplus from dividends distributed to
subsidiaries - 630 - - - - - - - - - 630 - 630
Net income for the year ended December 31, 2018 - - - - 1,790,361 - - - - - - 1,790,361 482,323 2,272,684
Other comprehensive income (loss) for the year ended
December 31, 2018, net of income tax - - - - (645,495 ) 25,322 - 268 - 87,579 - (532,326 ) (46,037 ) (578,363 )
Total comprehensive income for the year ended
December 31, 2018 - - - - 1,144,866 25,322 - 268 - 87,579 - 1,258,035 436,286 1,694,321
Gain or loss on non-controlling interest - - - - - - - - - - - - 565,963 565,963
Treasury shares acquired - - - - - - - - - - (469,393 ) (469,393 ) - (469,393 )
Treasury shares retired (500,000 ) 30,607 - - - - - - - - 469,393 - - -
Cash dividends from subsidiaries paid to non-controlling
interests - - - - - - - - - - - - (171,019 ) (171,019 )
BALANCE AT DECEMBER 31, 2018 54,209,846 1,241,214 351,923 118,810 1,144,928 (9,664 ) - 42,619 - 25,268 (43,372 ) 57,081,572 2,965,512 60,047,084
Basis adjustment to loss on hedging instruments - - - - - - - - - (603 ) - (603 ) - (603 )
Appropriation of 2018 earnings
Legal reserve - - 114,493 - (114,493 ) - - - - - - - - -
Special reserve - - - (105,843 ) 105,843 - - - - - - - - -
Cash dividends - $0.20960737 per share - - - - (1,136,278 ) - - - - - - (1,136,278 ) - (1,136,278 )
Changes in capital surplus from dividends distributed to
subsidiaries - 606 - - - - - - - - - 606 - 606
Actual disposal of interests in subsidiaries - 1,247,087 - - - - - - - - - 1,247,087 7,546 1,254,633
Net profit (loss) for the year ended December 31, 2019 - - - - (1,199,798 ) - - - - - - (1,199,798 ) 524,796 (675,002 )
Other comprehensive income (loss) for the year ended
December 31, 2019 net of income tax - - - - (577,427 ) (53,411 ) - 64,538 - 1,119,013 - 552,713 (89,955 ) 462,758
Total comprehensive income (loss) for the year ended
December 31, 2019 - - - - (1,777,225 ) (53,411 ) - 64,538 - 1,119,013 - (647,085 ) 434,841 (212,244 )
Cash dividends from subsidiaries paid to non-controlling
interests - - - - - - - - - - - - 611,841 611,841
Non-controlling interests arising from acquisition of
subsidiaries - - - - - - - - - - - - (416,438 ) (416,438 )
Loss of control of subsidiaries - - - - - 8,368 - 105 - - - 8,473 (24,957 ) (16,484 )
BALANCE AT DECEMBER 31, 2019 $ 54,209,846 $ 2,488,907 $ 466,416 $ 12,967 $ (1,777,225 ) $ (54,707 ) $ - $ 107,262 $ - $ 1,143,678 $ (43,372 ) $ 56,553,772 $ 3,578,345 $ 60,132,117
The accompanying notes are an integral part of the consolidated financial statements.
- 11 -
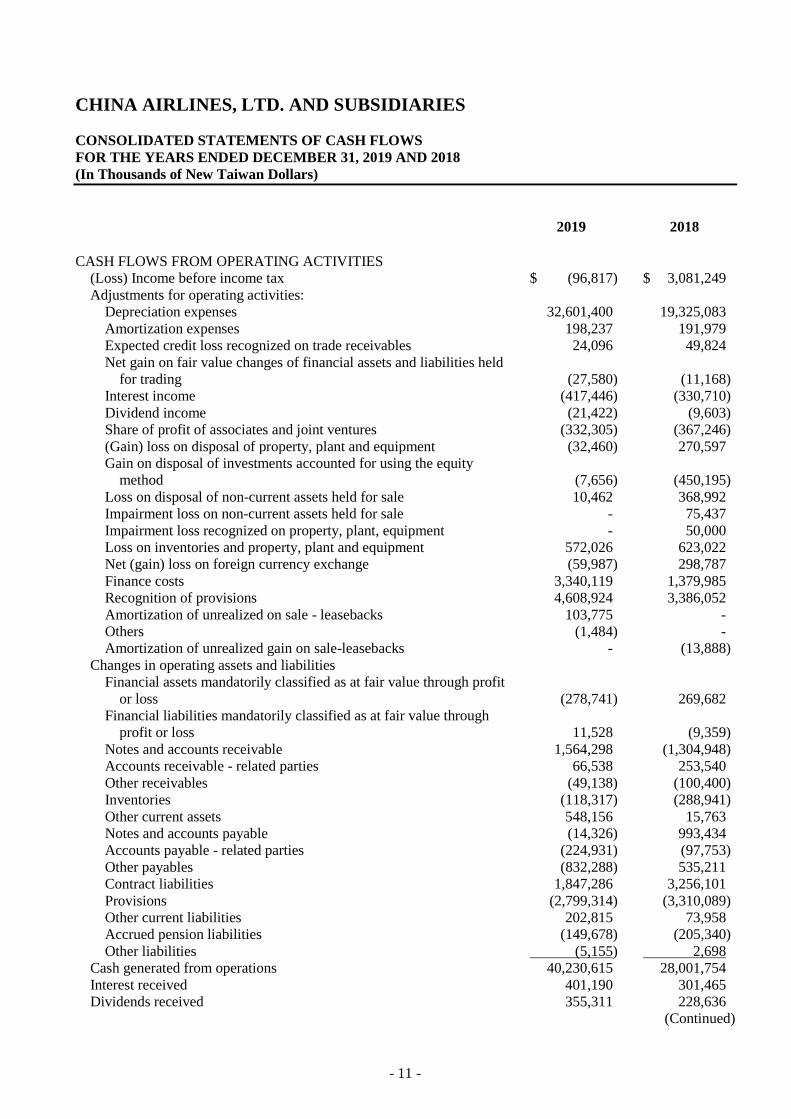
CHINA AIRLINES, LTD. AND SUBSIDIARIES
CONSOLIDATED STATEMENTS OF CASH FLOWS
FOR THE YEARS ENDED DECEMBER 31, 2019 AND 2018
(In Thousands of New Taiwan Dollars)
2019 2018
CASH FLOWS FROM OPERATING ACTIVITIES
(Loss) Income before income tax $ (96,817) $ 3,081,249
Adjustments for operating activities:
Depreciation expenses 32,601,400 19,325,083
Amortization expenses 198,237 191,979
Expected credit loss recognized on trade receivables 24,096 49,824
Net gain on fair value changes of financial assets and liabilities held
for trading (27,580) (11,168)
Interest income (417,446) (330,710)
Dividend income (21,422) (9,603)
Share of profit of associates and joint ventures (332,305) (367,246)
(Gain) loss on disposal of property, plant and equipment (32,460) 270,597
Gain on disposal of investments accounted for using the equity
method (7,656) (450,195)
Loss on disposal of non-current assets held for sale 10,462 368,992
Impairment loss on non-current assets held for sale - 75,437
Impairment loss recognized on property, plant, equipment - 50,000
Loss on inventories and property, plant and equipment 572,026 623,022
Net (gain) loss on foreign currency exchange (59,987) 298,787
Finance costs 3,340,119 1,379,985
Recognition of provisions 4,608,924 3,386,052
Amortization of unrealized on sale - leasebacks 103,775 -
Others (1,484) -
Amortization of unrealized gain on sale-leasebacks - (13,888)
Changes in operating assets and liabilities
Financial assets mandatorily classified as at fair value through profit
or loss (278,741) 269,682
Financial liabilities mandatorily classified as at fair value through
profit or loss 11,528 (9,359)
Notes and accounts receivable 1,564,298 (1,304,948)
Accounts receivable - related parties 66,538 253,540
Other receivables (49,138) (100,400)
Inventories (118,317) (288,941)
Other current assets 548,156 15,763
Notes and accounts payable (14,326) 993,434
Accounts payable - related parties (224,931) (97,753)
Other payables (832,288) 535,211
Contract liabilities 1,847,286 3,256,101
Provisions (2,799,314) (3,310,089)
Other current liabilities 202,815 73,958
Accrued pension liabilities (149,678) (205,340)
Other liabilities (5,155) 2,698
Cash generated from operations 40,230,615 28,001,754
Interest received 401,190 301,465
Dividends received 355,311 228,636
(Continued)

- 12 -
CHINA AIRLINES, LTD. AND SUBSIDIARIES
CONSOLIDATED STATEMENTS OF CASH FLOWS
FOR THE YEARS ENDED DECEMBER 31, 2019 AND 2018
(In Thousands of New Taiwan Dollars)
2019 2018
Interest paid $ (3,124,960) $ (1,319,690)
Income tax paid (335,544) (185,208)
Net cash generated from operating activities 37,526,612 27,026,957
CASH FLOWS FROM INVESTING ACTIVITIES
Acquisition of amortized cost financial assets (2,089,871) (3,460,496)
Disposal of amortized cost financial assets 3,447,202 1,621,546
Proceeds from disposal of non-current assets held for sale 35,692 688,427
Payments for property, plant and equipment (3,316,078) (4,608,600)
Proceeds from disposal of property, plant and equipment 71,194 333,284
Increase in refundable deposits (440,443) (265,335)
Decrease in refundable deposits 218,547 391,487
Increase in prepayments for equipment (15,658,898) (14,991,412)
Increase in long-term lease receivable - (785)
Increase in computer software costs (172,639) (184,223)
Decrease in restricted assets 38,636 59,726
Proceeds from disposal of associates accounted for using the equity
method 1,866,474 -
Proceeds from acquisition of joint ventures accounted for using the
equity method (35,525) -
Net cash outflow on disposal of subsidiaries (Note 31) (17,413) -
Acquisition of subsidiaries (Note 30) - 136,769
Net cash used in investing activities (16,053,122) (20,279,612)
CASH FLOWS FROM FINANCING ACTIVITIES
Payments for buy-back of ordinary shares - (469,393)
Decrease in short-term debts 380,000 (120,000)
Proceeds from issuance of bonds payable 3,500,000 10,512,000
Repayments of bonds payable (4,445,900) (2,700,000)
Proceeds from long-term borrowings 9,078,690 18,285,457
Repayments of long-term borrowings and capital lease obligations (17,819,750) (28,587,288)
Repayments of the principal portion of lease liabilities (11,692,310) -
Proceeds from guarantee deposits received 180,360 126,578
Refunds of guarantee deposits received (149,198) (70,204)
Proceeds from sale - leasebacks 4,905,660 -
Dividends paid to owners of the Company (1,135,672) (1,193,040)
Cash dividends paid to non-controlling interests (416,438) (171,019)
Net cash used in financing activities (17,614,558) (4,386,909)
EFFECTS OF EXCHANGE RATE CHANGES ON THE BALANCE
OF CASH HELD IN FOREIGN CURRENCIES (336,941) (8,231)
(Continued)

- 13 -
CHINA AIRLINES, LTD. AND SUBSIDIARIES
CONSOLIDATED STATEMENTS OF CASH FLOWS
FOR THE YEARS ENDED DECEMBER 31, 2019 AND 2018
(In Thousands of New Taiwan Dollars)
2019 2018
NET INCREASE IN CASH AND CASH EQUIVALENTS $ 3,521,991 $ 2,352,205
CASH AND CASH EQUIVALENTS AT THE BEGINNING OF THE
YEAR 24,937,537 22,585,332
CASH AND CASH EQUIVALENTS AT THE END OF THE YEAR $ 28,459,528 $ 24,937,537
The accompanying notes are an integral part of the consolidated financial statements. (Concluded)
- 14 -
CHINA AIRLINES, LTD. AND SUBSIDIARIES
NOTES TO CONSOLIDATED FINANCIAL STATEMENTS
FOR THE YEARS ENDED DECEMBER 31, 2019 AND 2018
(In Thousands of New Taiwan Dollars, Unless Stated Otherwise)
1. GENERAL INFORMATION
China Airlines, Ltd. (the “Company”) was founded in 1959 and its shares have been listed on the Taiwan
Stock Exchange since February 26, 1993. The Company primarily provides air transport services for
passengers and cargo. Its other operations include (a) mail services; (b) ground services and routine aircraft
maintenance; (c) major maintenance of flight equipment; (d) communications and data processing services
to other airlines; (e) the sale of aircraft parts, equipment and the entire aircraft; and (f) leasing of aircraft.
The major shareholders of the Company are the China Aviation Development Foundation (CADF) and the
National Development Fund (NDF), Executive Yuan. As of December 31, 2019 and 2018, CADF and NDF
both held 44.03% of the Company’s shares.
2. APPROVAL OF FINANCIAL STATEMENTS
The consolidated financial statements of the Company and its subsidiaries (collectively referred to as the
“Group”) were approved by the Company’s board of directors on March 18, 2020.
3. APPLICATION OF NEW, AMENDED AND REVISED STANDARDS AND INTERPRETATIONS
a. Initial application of the amendments to the Regulations Governing the Preparation of Financial Reports
by Securities Issuers (FSC) and the International Financial Reporting Standards (IFRS), International
Accounting Standards (IAS), Interpretations of IFRS (IFRIC), and Interpretations of IAS (SIC)
endorsed and issued into effect by the FSC
Except for the following, the initial application of the amendments to the Regulations Governing the
Preparation of Financial Reports by Securities Issuers and the IFRSs endorsed and issued into effect by
the FSC did not have material impact on the Group’s accounting policies:
IFRS 16 “Leases”
IFRS 16 provides a comprehensive model for the identification of lease arrangements and their
treatment in the financial statements of both lessee and lessor. It supersedes IAS 17 “Leases”, IFRIC 4
“Determining whether an Arrangement contains a Lease”, and a number of related interpretations. Refer
to Note 4 for information relating to the relevant accounting policies.
Definition of a lease
The Group elected to apply the guidance of IFRS 16 in determining whether contracts are, or contain, a
lease only to contracts entered into (or changed) on or after January 1, 2019. Contracts identified as
containing a lease under IAS 17 and IFRIC 4 are not be reassessed and accounted for in accordance
with the transitional provisions under IFRS 16.

- 15 -
The Group as lessee
The Group recognizes right-of-use assets, or investment properties if the right-of-use assets meet the
definition of investment properties, and lease liabilities for all leases on the consolidated balance sheets
except for those whose payments under low-value and short-term leases are recognized as expenses on
a straight-line basis. On the consolidated statements of comprehensive income, the Group presents the
depreciation expense charged on right-of-use assets separately from the interest expense accrued on
lease liabilities; interest is computed using the effective interest method. On the consolidated statements
of cash flows, cash payments for the principal portion of lease liabilities are classified within financing
activities; cash payments for the interest portion are classified within operating activities. Prior to the
application of IFRS 16, payments under operating lease contracts, including property interest qualified
as investment properties, were recognized as expenses on a straight-line basis. Cash flows for operating
leases were classified within operating activities on the consolidated statements of cash flows. Leased
assets and finance lease payables were recognized on the consolidated balance sheets for contracts
classified as finance leases.
Lease liabilities were recognized on January 1, 2019 for leases classified as operating leases under IAS
17. Lease liabilities are measured at the present value of the remaining lease payments, discounted
using the lessee’s incremental borrowing rate on January 1, 2019. Right-of-use assets are measured at
an amount equal to the lease liabilities, adjusted by the amount of any prepaid or accrued lease
payments. The Group applies IAS 36 to all right-of-use assets.
For leases classified as finance leases under IAS 17, the carrying amount of right-of-use assets and lease
liabilities on January 1, 2019 was determined as the carrying amount of the leased assets and finance
lease payables as of December 31, 2018.
If the Group determines that a sale and leaseback transaction does not satisfy the requirements of IFRS
15 to be accounted for as a sale of an asset, it is accounted for as a financing transaction. If it satisfies
the requirements to be accounted for as a sale of an asset, the Group recognizes only the amount of any
gain or loss which relates to the rights transferred to the buyer-lessor. Prior to the application of IFRS
16, the leaseback portion is classified as either a finance lease or an operating lease and accounted for
differently.
The Group does not reassess sale and leaseback transactions entered into before January 1, 2019 to
determine whether the transfer of an underlying asset satisfies the requirements in IFRS 15 to be
accounted for as a sale. Upon initial application of IFRS 16, the aforementioned transitional provision
for a lessee is applied to the leaseback portion. In addition, for asset accounted for as a sale and a
finance lease under IAS 17, the Group continues to amortize any gains on sales over the lease term.
- 16 -
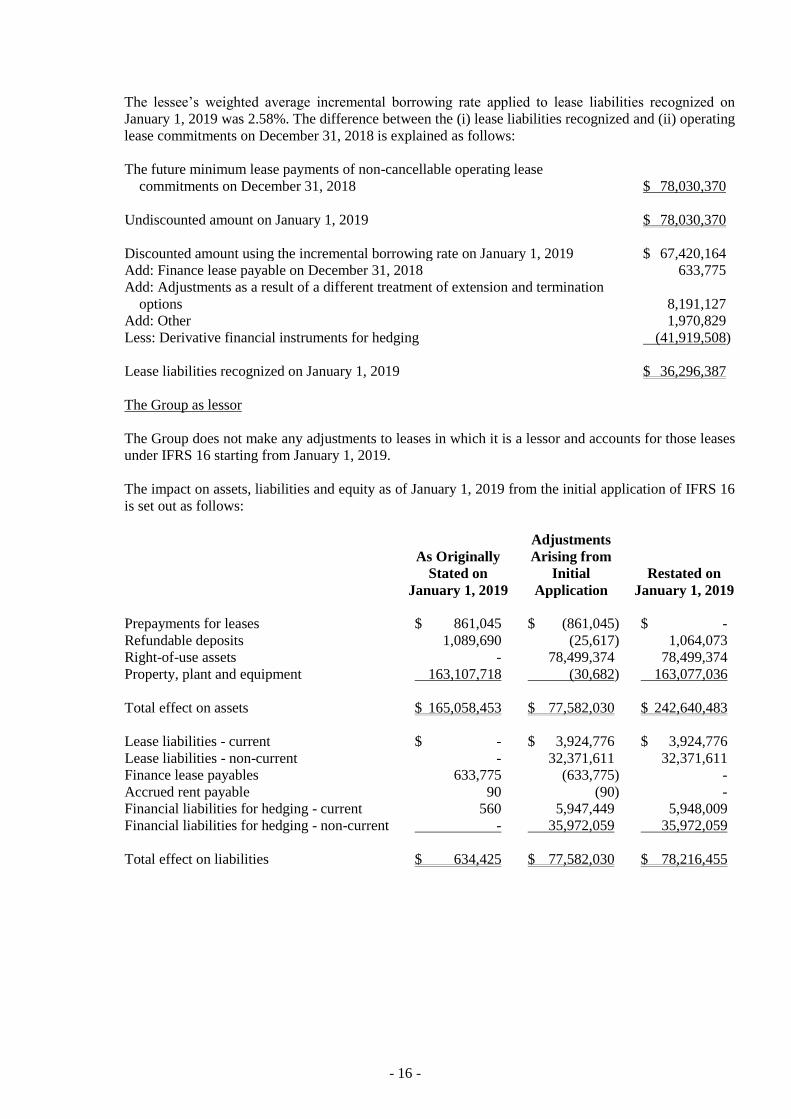
The lessee’s weighted average incremental borrowing rate applied to lease liabilities recognized on
January 1, 2019 was 2.58%. The difference between the (i) lease liabilities recognized and (ii) operating
lease commitments on December 31, 2018 is explained as follows:
The future minimum lease payments of non-cancellable operating lease
commitments on December 31, 2018 $ 78,030,370
Undiscounted amount on January 1, 2019 $ 78,030,370
Discounted amount using the incremental borrowing rate on January 1, 2019 $ 67,420,164
Add: Finance lease payable on December 31, 2018 633,775
Add: Adjustments as a result of a different treatment of extension and termination
options 8,191,127
Add: Other 1,970,829
Less: Derivative financial instruments for hedging (41,919,508)
Lease liabilities recognized on January 1, 2019 $ 36,296,387
The Group as lessor
The Group does not make any adjustments to leases in which it is a lessor and accounts for those leases
under IFRS 16 starting from January 1, 2019.
The impact on assets, liabilities and equity as of January 1, 2019 from the initial application of IFRS 16
is set out as follows:
As Originally
Stated on
January 1, 2019
Adjustments
Arising from
Initial
Application
Restated on
January 1, 2019
Prepayments for leases $ 861,045 $ (861,045) $ -
Refundable deposits 1,089,690 (25,617) 1,064,073
Right-of-use assets - 78,499,374 78,499,374
Property, plant and equipment 163,107,718 (30,682) 163,077,036
Total effect on assets $ 165,058,453 $ 77,582,030 $ 242,640,483
Lease liabilities - current $ - $ 3,924,776 $ 3,924,776
Lease liabilities - non-current - 32,371,611 32,371,611
Finance lease payables 633,775 (633,775) -
Accrued rent payable 90 (90) -
Financial liabilities for hedging - current 560 5,947,449 5,948,009
Financial liabilities for hedging - non-current - 35,972,059 35,972,059
Total effect on liabilities $ 634,425 $ 77,582,030 $ 78,216,455

- 17 -
b. New IFRSs in issue but not yet endorsed and issued into effect by the FSC
New IFRSs
Effective Date
Announced by IASB
Amendments to IFRS 3 “Definition of Business” January 1, 2020 (Note 1)
Amendments to IFRS 9, IAS 39 and IFRS 7 “Interest Rate Benchmark
Reform”
January 1, 2020 (Note 2)
Amendments to IAS 1 and IAS 8 “Definition of Materiality” January 1, 2020 (Note 3)
Note 1: Unless stated otherwise, the above New IFRSs are effective for annual periods beginning on
or after their respective effective dates.
Note 2: Business combinations that began after January 1, 2020 and acquisition of assets after the
aforesaid date are subjected to the amendment.
Note 3: The amendment is applied for the annual period beginning after January 1, 2020.
As of the date the consolidated financial statements were authorized for issue, the Group is
continuously assessing the possible impact that the application of other standards and interpretations
will have on the Group’s financial position and financial performance and will disclose the relevant
impact when the assessment is completed.
c. New IFRSs in issue but not yet endorsed and issued into effect by the FSC
New IFRSs
Effective Date
Announced by IASB (Note)
Amendments to IFRS 10 and IAS 28 “Sale or Contribution of Assets
between an Investor and its Associate or Joint Venture”
To be determined by IASB
IFRS 17 “Insurance Contracts” January 1, 2021
Amendments to IAS 1 “Clarify the Classification of Liabilities as
Current or Non-current”
January 1, 2022
Note: Unless stated otherwise, the above New IFRSs are effective for annual reporting periods
beginning on or after their respective effective dates.
The application of new IFRSs in issue but not yet endorsed and issued into effect by the FSC would not
have any material impact on the Group’s accounting policies. As of the date the consolidated financial
statements were authorized for issue, the Group is continuously assessing the possible impact that the
application of other standards and interpretations will have on the Group’s financial position and
financial performance and will disclose the relevant impact when the assessment is completed.
4. SIGNIFICANT ACCOUNTING POLICIES
Statement of Compliance
The consolidated financial statements have been prepared in accordance with the Regulations Governing
the Preparation of Financial Reports by Securities Issuers and IFRSs as endorsed and issued into effect by
the FSC.

- 18 -
Basis of Preparation
The consolidated financial statements have been prepared on the historical cost basis except for financial
instruments which are measured at fair value.
The fair value measurements, which are grouped into Levels 1 to 3 based on the degree to which the fair
value measurement inputs are observable and based on the significance of the inputs to the fair value
measurement in its entirety, are described as follows:
1) Level 1 inputs are quoted prices (unadjusted) in active markets for identical assets or liabilities;
2) Level 2 inputs are inputs other than quoted prices included within Level 1 that are observable for an
asset or liability, either directly (i.e. as prices) or indirectly (i.e. derived from prices); and
3) Level 3 inputs are unobservable inputs for an asset or liability.
Current and Non-current Assets and Liabilities
Current assets include:
1) Assets held primarily for the purpose of trading;
2) Assets expected to be realized within 12 months after the reporting period; and
3) Cash and cash equivalents unless the asset is restricted from being exchanged or used to settle a liability
for at least 12 months after the reporting period.
Current liabilities include:
1) Liabilities held primarily for the purpose of trading;
2) Liabilities due to be settled within 12 months after the reporting period, even if an agreement to
refinance, or to reschedule payments, on a long-term basis is completed after the reporting period and
before the consolidated financial statements are authorized for issue; and
3) Liabilities for which the Group does not have an unconditional right to defer settlement for at least 12
months after the reporting period. Terms of a liability that could, at the option of the counterparty, result
in its settlement by the issue of equity instruments do not affect its classification.
Assets and liabilities that are not classified as current are classified as non-current.
Basis of Consolidation
The consolidated financial statements incorporate the financial statements of the Company and the entities
controlled by the Company. Income and expenses of subsidiaries acquired or disposed of during the period
are included in the consolidated statements of profit or loss and other comprehensive income from the
effective dates of acquisitions up to the effective dates of disposals, as appropriate. When necessary,
adjustments are made to the financial statements of subsidiaries to bring their accounting policies into line
with those used by the Company. All intra-group transactions, balances, income and expenses are
eliminated in full upon consolidation. Total comprehensive income of subsidiaries is attributed to the
owners of the Company and to the non-controlling interests even if this results in the non-controlling
interests having a deficit balance.
- 19 -
Changes in the Group’s ownership interests in subsidiaries that do not result in the Group losing control
over the subsidiaries are accounted for as equity transactions. The carrying amounts of the interests of the
Group and the non-controlling interests are adjusted to reflect the changes in their relative interests in the
subsidiaries. Any difference between the amount by which the non-controlling interests are adjusted and the
fair value of the consideration paid or received is recognized directly in equity and attributed to the owners
of the Company.
When the Group loses control of a subsidiary, a gain or loss is recognized in profit or loss and is calculated
as the difference between (i) the aggregate of the fair value of the consideration received and any
investment retained in the former subsidiary at its fair value at the date when control is lost and (ii) the
assets (including any goodwill) and liabilities and any non-controlling interests of the former subsidiary at
their carrying amounts at the date when control is lost. The Group accounts for all amounts recognized in
other comprehensive income in relation to that subsidiary on the same basis as would be required had the
Group directly disposed of the related assets or liabilities.
Foreign Currencies
In preparing the consolidated financial statements of the Group, transactions in currencies other than the
Company’s functional currency (i.e. foreign currencies) are recognized at the rates of exchange prevailing
at the dates of the transactions. At the end of each reporting period, monetary items denominated in foreign
currencies are retranslated at the rates prevailing at that date. Non-monetary items that are measured at
historical cost in a foreign currency are not retranslated. Non-monetary items measured at fair value that are
denominated in foreign currencies are retranslated at the rates prevailing at the date when the fair value was
determined.
Exchange differences on monetary items arising from settlement or translation are recognized in profit or
loss in the period in which they arise except for:
a. Exchange differences on foreign currency borrowings relating to assets under construction for future
productive use, which are included in the cost of those assets when they are regarded as an adjustment
to interest costs on those foreign currency borrowings;
b. Exchange differences on transactions entered into in order to hedge certain foreign currency risks.
Exchange differences arising on the retranslation of non-monetary items are included in profit or loss for
the period except for exchange differences arising from the retranslation of non-monetary items in respect
of which gains and losses are recognized directly in other comprehensive income, in which case, the
exchange differences are also recognized directly in other comprehensive income.
For the purpose of presenting consolidated financial statements, the assets and liabilities of the Group’s
foreign operations are translated into New Taiwan dollars using exchange rates prevailing at the end of each
reporting period. Income and expense items are translated at the average exchange rates for the period.
Exchange differences are recognized in other comprehensive income (attributed to the owners of the
Company and non-controlling interests as appropriate).
On the disposal of a foreign operation, all of the exchange differences accumulated in equity in respect of
that operation attributable to the owners of the Company are reclassified to profit or loss.

- 20 -
Business Combinations
Where the consideration the Group transfers in a business combination includes assets or liabilities
resulting from a contingent consideration arrangement, the contingent consideration is measured at its
acquisition-date fair value and considered as part of the consideration transferred in a business combination.
Changes in the fair value of the contingent consideration that qualify as measurement period adjustments
are adjusted retrospectively, with the corresponding adjustments being made against goodwill or gains on
bargain purchases. Measurement period adjustments are adjustments that arise from additional information
obtained during the measurement period about facts and circumstances that existed as of the acquisition
date.
When a business combination is achieved in stages, the Group’s previously held equity interest in an
acquiree is remeasured to fair value at the acquisition date, and the resulting is recognized in profit or loss
or other comprehensive income. Amounts arising from interests in the acquiree prior to the acquisition date
that have previously been recognized in other comprehensive income are recognized on the same basis as
would be required if those interests were directly disposed of by the Group
If the initial accounting for a business combination is incomplete by the end of the reporting period in
which the combination occurs, the Group reports provisional amounts for the items for which the
accounting is incomplete. Those provisional amounts are adjusted retrospectively during the measurement
period, or additional assets or liabilities are recognized, to reflect new information obtained about facts and
circumstances that existed as of the acquisition date that, if known, would have affected the amounts
recognized as of that date.
Inventories
Inventories are primarily expendable and nonexpendable parts and materials, supplies used in operations
and items for in-flight sales and are stated at the lower of cost or net realizable value. The costs of
inventories sold or consumed are determined using the weighted-average method.
Non-current Assets Held for Sale
Non-current assets are classified as held-for-sale if their carrying amount will be recovered principally
through a sale transaction rather than through continuing use. This condition is regarded as met only when
the sale is highly probable and the non-current asset is available for immediate sale in its present condition.
To meet the criteria for the sale being highly probable, the appropriate level of management must be
committed to the sale, which should be expected to qualify for recognition as a completed sale within one
year from the date of classification.
Non-current assets classified as held-for-sale are measured at the lower of their previous carrying amount
and fair value less costs to sell. Recognition of depreciation of those assets would cease.
Investments in Associates and Joint Ventures
An associate is an entity over which the Group has significant influence and that is neither a subsidiary nor
an interest in a joint venture. A joint venture is a joint arrangement whereby the Group and other parties
that have joint control of the arrangement and the rights to the net assets of the arrangement.
The Group uses the equity method to account for its investments in associates and joint ventures.
Under the equity method, investments in an associate and a joint venture are initially recognized at cost and
adjusted thereafter to recognize the Group’s share of profit or loss and other comprehensive income of the
associate and joint venture. The Group also recognizes the changes in the Group’s share of equity of
associates and joint venture attributable to the Group.

- 21 -
Any excess of the cost of acquisition over the Group’s share of net fair value of the identifiable assets and
liabilities of an associate recognized at the date of acquisition is recognized as goodwill, which is included
within the carrying amount of the investment and is not amortized. Any excess of the Group’s share of net
fair value of the identifiable assets and liabilities over the cost of acquisition, after reassessment, is
recognized immediately in profit or loss.
When the Group subscribes for additional new shares of an associate and joint venture at a percentage
different from its existing ownership percentage, the resulting carrying amount of the investment differs
from the amount of the Group’s proportionate interest in the associate and joint venture. The Group records
such a difference as an adjustment to investments with the corresponding amount charged or credited to
capital surplus - changes in the Group’s share of equity of associates and joint ventures. If the Group’s
ownership interest is reduced due to the subscription of additional new shares of the associate and joint
venture, the proportionate amount of the gains or losses previously recognized in other comprehensive
income in relation to that associate and joint venture is reclassified to profit or loss on the same basis as
would be required had the investee directly disposed of the related assets or liabilities. When the adjustment
should be debited to capital surplus, but the capital surplus recognized from investments accounted for
using the equity method is insufficient, the shortage is debited to retained earnings.
When the Group’s share of losses of an associate and a joint venture equals or exceeds its interest in that
associate and joint venture (which includes any carrying amount of the investment accounted for using the
equity method and long-term interests that, in substance, form part of the Group’s net investment in the
associate and joint venture), the Group discontinues recognizing its share of further losses. Additional
losses and liabilities are recognized only to the extent that the Group has incurred legal obligations, or
constructive obligations, or made payments on behalf of that associate and joint venture.
The entire carrying amount of the investment (including goodwill) is tested for impairment as a single asset
by comparing its recoverable amount with its carrying amount. Any impairment loss recognized is deducted
from the carrying amount of the investment. Any reversal of that impairment loss is recognized to the
extent that the recoverable amount of the investment subsequently increases.
The Group discontinues the use of the equity method from the date on which its investment ceases to be an
associate and a joint venture. Any retained investment is measured at fair value at that date and the fair
value is regarded as its fair value on initial recognition as a financial asset. The difference between the
previous carrying amount of the associate and the joint venture attributable to the retained interest and its
fair value is included in the determination of the gain or loss on disposal of the associate and the joint
venture. The Group accounts for all amounts previously recognized in other comprehensive income in
relation to that associate and the joint venture on the same basis as would be required had that associate
directly disposed of the related assets or liabilities. If an investment in an associate becomes an investment
in a joint venture or an investment in a joint venture becomes an investment in an associate, the Group
continues to apply the equity method and does not remeasure the retained interest.
Property, Plant and Equipment
Property, plant and equipment are tangible items that are held for use in the production or supply of goods
or services, for rental to others, or for administrative purposes and are expected to be used for more than
one period. The cost of an item of property, plant and equipment shall be recognized as an asset if, and only
if, it is probable that future economic benefits associated with the item will flow to the Group and the cost
of the item can be measured reliably. Property, plant and equipment are stated at cost less recognized
accumulated depreciation and recognized accumulated impairment loss.
Freehold land is not depreciated.
Depreciation is recognized using the straight-line method. Each significant part is depreciated separately.
The estimated useful lives, residual values and depreciation methods are reviewed at the end of each
reporting period, with the effects of any changes in the estimates accounted for on a prospective basis.

- 22 -
Assets held under finance leases are depreciated over their expected useful lives on the same basis as owned
assets. Assets are depreciated over the shorter of the lease term and their useful lives using the straight-line
method.
Any gain or loss arising on the disposal or retirement of an item of property, plant and equipment is
determined as the difference between the sales proceeds and the carrying amount of the asset and is
recognized in profit or loss.
Investment Properties
Investment properties are properties held to earn rentals or for capital appreciation. Investment properties
also include land held for a currently undetermined future use.
Investment properties are measured initially at cost, including transaction costs. Subsequent to initial
recognition, investment properties are measured at cost less accumulated depreciation and accumulated
impairment loss.
Depreciation is recognized using the straight-line method. The estimated useful lives and residual values are
reviewed at the end of each reporting period.
Any gain or loss arising on the derecognition of investment properties is calculated as the difference
between the net disposal proceeds and the carrying amount of the asset and is included in profit or loss in
the period in which the property is derecognized.
Intangible Assets
Intangible assets with finite useful lives that are acquired separately are initially measured at cost and
subsequently measured at cost less accumulated amortization and accumulated impairment loss.
Amortization is recognized on a straight-line basis. The estimated useful lives, residual values, and
amortization methods are reviewed at the end of each reporting period, with the effects of any changes in
the estimates being accounted for on a prospective basis. The residual value of an intangible asset with a
finite useful life shall be assumed zero unless the Group expects to dispose of the intangible asset before the
end of its economic life.
Impairment of Tangible and Intangible Assets Other Than Goodwill
At the end of each reporting period, the Group reviews the carrying amounts of its tangible and intangible
assets, excluding goodwill, to determine whether there is any indication that those assets have suffered an
impairment loss. If any such indication exists, the recoverable amount of the asset is estimated in order to
determine the extent of the impairment loss. When it is not possible to estimate the recoverable amount of
an individual asset, the Group estimates the recoverable amount of the cash-generating unit to which the
asset belongs. Corporate assets are allocated to the individual cash-generating units on a reasonable and
consistent basis; otherwise, corporate assets are allocated to the smallest group of cash-generating units on a
reasonable and consistent allocation basis.
Intangible assets with indefinite useful lives and intangible assets not yet available for use are tested for
impairment at least annually, and whenever there is an indication that the asset may be impaired.
The recoverable amount is the higher of fair value less costs to sell and value in use. In assessing value in
use, the Group uses the estimated cash flows discounted by the future pre-tax discount rate, and the
discount rate reflects the current market time value of money and the specific risks to the asset for estimated
future cash flows not yet adjusting to the market.
If the recoverable amount of an asset or cash-generating unit is estimated to be less than its carrying
amount, the carrying amount of the asset or cash-generating unit is reduced to its recoverable amount.

- 23 -
When an impairment loss is subsequently reversed, the carrying amount of the asset or cash-generating unit
is increased to the revised estimate of its recoverable amount, but only to the extent of the carrying amount
that would have been determined had no impairment loss been recognized for the asset or cash-generating
unit in prior years. A reversal of an impairment loss is recognized in profit or loss.
Financial Instruments
Financial assets and financial liabilities are recognized when the Group becomes a party to the contractual
provisions of the instruments.
Financial assets and financial liabilities are initially measured at fair value. Transaction costs that are
directly attributable to the acquisition or issuance of financial assets and financial liabilities (other than
financial assets and financial liabilities at FVTPL) are added to or deducted from the fair value of the
financial assets or financial liabilities, as appropriate, on initial recognition. Transaction costs directly
attributable to the acquisition of financial assets or financial liabilities at FVTPL are recognized
immediately in profit or loss.
a. Financial assets
All regular purchases or sales of financial assets are recognized and derecognized on a trade date basis.
All regular purchases or sales of financial assets are buy or sell of financial assets in the period set by
regulation or market convention.
1) Measurement category
Financial assets are classified into the following categories: Financial assets at FVTPL, financial
assets at amortized cost, and investments in equity instruments at FVTOCI.
a) Financial assets at FVTPL
Financial assets are classified as at FVTPL when such a financial asset is mandatorily classified
or designated as at FVTPL. Financial assets mandatorily classified as at FVTPL include
investments in equity instruments which are not designated as at FVTOCI and debt instruments
that do not meet the amortized cost criteria or the FVTOCI criteria.
Financial assets at FVTPL are subsequently measured at fair value, with any gains or losses
arising on remeasurement recognized in profit or loss. Fair value is determined in the manner
described in Note 33.
b) Financial assets at amortized cost
Financial assets that meet the following conditions are subsequently measured at amortized
cost:
i. The financial asset is held within a business model whose objective is to hold financial
assets in order to collect contractual cash flows; and
ii. The contractual terms of the financial asset give rise on specified dates to cash flows that are
solely payments of principal and interest on the principal amount outstanding.
Subsequent to initial recognition, financial assets at amortized cost, including cash and cash
equivalents, trade receivables, other receivables and other financial assets, are measured at
amortized cost, which equals the gross carrying amount determined using the effective interest
method less any impairment loss. Exchange differences are recognized in profit or loss.
- 24 -
Interest income is calculated by applying the effective interest rate to the gross carrying amount
of a financial asset.
Cash equivalents include time deposits with original maturities within 3 months from the date of
acquisition, which are highly liquid, readily convertible to a known amount of cash and are
subject to an insignificant risk of changes in value. These cash equivalents are held for the
purpose of meeting short-term cash commitments.
c) Investments in equity instruments at FVTOCI
On initial recognition, the Group may make an irrevocable election to designate investments in
equity instruments as at FVTOCI. Designation as at FVTOCI is not permitted if an equity
investment is held for trading or if it is contingent consideration recognized by an acquirer in a
business combination.
Investments in equity instruments at FVTOCI are subsequently measured at fair value with
gains and losses arising from changes in fair value recognized in other comprehensive income
and accumulated in other equity. The cumulative gain or loss will not be reclassified to profit or
loss on disposal of the equity investments; instead, they will be transferred to retained earnings.
Dividends on these investments in equity instruments are recognized in profit or loss when the
Group’s right to receive the dividends is established, unless the dividends clearly represent a
recovery of part of the cost of an investment.
2) Impairment of financial assets
The Group recognizes a loss allowance for expected credit losses on financial assets at amortized
cost (including trade receivables), as well as contract assets.
The Group always recognizes lifetime expected credit losses (ECLs) for trade receivables and other
receivables. For all other financial instruments, the Group recognizes lifetime ECLs when there has
been a significant increase in credit risk since initial recognition. If, on the other hand, the credit
risk on a financial instrument has not increased significantly since initial recognition, the Group
measures the loss allowance for that financial instrument at an amount equal to 12-month ECLs.
Expected credit losses reflect the weighted average of credit losses with the respective risks of a
default occurring as the weights. Lifetime ECL represents the expected credit losses that will result
from all possible default events over the expected life of a financial instrument. In contrast,
12-month ECL represents the portion of lifetime ECL that is expected to result from default events
on a financial instrument that are possible within 12 months after the reporting date.
The impairment loss of all financial assets is recognized in profit or loss by a reduction in their
carrying amounts through a loss allowance account, except for investments in debt instruments that
are measured at FVTOCI, for which the loss allowance is recognized in other comprehensive
income and the carrying amounts of such financial assets are not reduced.
3) Derecognition of financial assets
The Group derecognizes a financial asset only when the contractual rights to the cash flows from
the asset expire or when it transfers the financial asset and substantially all the risks and rewards of
ownership of the asset to another party.
- 25 -
On derecognition of a financial asset in its entirety, the difference between the asset’s carrying
amount and the sum of the consideration received and receivable and the cumulative gain or loss
that had been recognized in other comprehensive income is recognized in profit or loss.
b. Equity instruments
Debt and equity instruments issued by the Group entity are classified as either financial liabilities or as
equity in accordance with the substance of the contractual arrangements and the definitions of a
financial liability and an equity instrument.
Equity instruments issued by the Group entity are recognized at the proceeds received, net of direct
issue costs.
Repurchase of the Group’s own equity instruments is recognized in and deducted directly from equity.
No gain or loss is recognized in profit or loss on the purchase, sale, issue or cancellation of the
Company’s own equity instruments.
c. Financial liabilities
1) Subsequent measurement
Except for financial liabilities at FVTPL, all financial liabilities are measured at amortized cost
using the effective interest method.
2) Derecognition of financial liabilities
The difference between the carrying amount of a financial liability derecognized and the
consideration paid, including any non-cash assets transferred or liabilities assumed, is recognized in
profit or loss.
d. Convertible bonds
The component parts of compound instruments (i.e. convertible bonds) issued by the Company are
classified separately as financial liabilities and equity in accordance with the substance of the
contractual arrangements and the definitions of a financial liability and an equity instrument.
On initial recognition, the fair value of the liability component is estimated using the prevailing market
interest rate for similar non-convertible instruments. This amount is recorded as a liability on an
amortized cost basis using the effective interest method until extinguished upon conversion or the
instrument’s maturity date. Any embedded derivative liability is measured at fair value.
The conversion option classified as equity is determined by deducting the amount of the liability
component from the fair value of the compound instrument as a whole. This is recognized and included
in equity, net of income tax effects, and is not subsequently remeasured. In addition, the conversion
option classified as equity will remain in equity until the conversion option is exercised, in which case,
the balance recognized in equity will be transferred to capital surplus - share premiums. When the
conversion option remains unexercised at maturity, the balance recognized in equity will be transferred
to capital surplus - share premiums.
Transaction costs that relate to the issue of the convertible notes are allocated to the liability and equity
components in proportion to the allocation of the gross proceeds. Transaction costs relating to the
equity component are recognized directly in equity. Transaction costs relating to the liability component
are included in the carrying amount of the liability component.
- 26 -
e. Derivative financial instruments
The Group enters into a variety of derivative financial instruments to manage its exposure to interest
rate, foreign exchange rate and fuel price risks, including foreign exchange forward contracts, interest
rate swaps, currency options swaps and fuel swaps.
Derivatives are initially recognized at fair value at the date the derivative contracts are entered into and
are subsequently remeasured to their fair value at the end of each reporting period. The resulting gain or
loss is recognized in profit or loss immediately unless the derivative is designated and effective as a
hedging instrument, in which event, the timing of the recognition in profit or loss depends on the nature
of the hedging relationship. When the fair value of a derivative financial instrument is positive, the
derivative is recognized as a financial asset; when the fair value of a derivative financial instrument is
negative, the derivative is recognized as a financial liability.
Hedge Accounting
The Company enters into some derivative transactions that aim to manage interest rates, foreign exchange
rates, fuel prices, and other factors affecting gains or losses on assets and liabilities. The hedging
transactions are defined as cash flow hedges. When entering into hedging transactions, the Company has
prepared official documents that describe the hedging relationship between hedging instruments and items
which have been hedged, the objective of risk management, the hedging strategy, and the way to evaluate
the effectiveness of the hedging instrument.
The effective portion of changes in the fair value of derivatives that are designated and qualify as cash flow
hedges is recognized in other comprehensive income. The gain or loss relating to the ineffective portion is
recognized immediately in profit or loss.
The associated gains or losses that were recognized in other comprehensive income are reclassified from
equity to profit or loss as a reclassification adjustment in the line item relating to the hedged item in the
same period as when the hedged item affects profit or loss. If a hedge of a forecasted transaction
subsequently results in the recognition of a non-financial asset or a non-financial liability, the associated
gains and losses that were recognized in other comprehensive income are removed from equity and are
included in the initial cost of the non-financial asset or non-financial liability.
Starting from 2018, the Group discontinues hedge accounting only when the hedging relationship ceases to
meet the qualifying criteria; for instance, when the hedging instrument expires or is sold, terminated or
exercised. The cumulative gain or loss on the hedging instrument that has been previously recognized in
other comprehensive income from the period in which the hedge was effective remains separately in equity
until the forecasted transaction occurs. When a forecasted transaction is no longer expected to occur, the
gain or loss accumulated in equity is recognized immediately in profit or loss.
Provisions
The Group recognizes provisions when the Group has a present obligation (legal or constructive) arising
from past events (legal or constructive obligation), payment for the obligation is probable, and the
expenditure for settling the obligation can be estimated reliably.
The amount recognized as a provision is the best estimate of the expenditure required to settle the present
obligation, taking into account the risks and uncertainties surrounding the obligation as of the balance sheet
date. When a provision is measured using the cash flows estimated to settle the present obligation, its
carrying amount is the present value of those cash flows.

- 27 -
Aircraft lease contracts
When an aircraft lease contracts expires and the leased item will be returned to the lessor, the Group will
assess if there are existing obligations exist and if it is required to recognize a provision when signing the
lease contract.
Revenue Recognition
When applying IFRS 15 during 2018, the Group recognizes revenue by applying the following steps:
Identifying the contract with the customer;
Identifying the performance obligations in the contract;
Determine the transaction price;
Allocate the transaction price to the performance obligations in the contract; and
Recognize revenue when the Group satisfies a performance obligation.
Shipping service revenue
Passenger and cargo revenue are recognized as revenue when the passengers and goods are actually carried.
When the tickets are sold, due to the fact that the fulfillment obligations of the shipment have not been met,
the relevant amount of revenue is first recorded as contract liabilities until passengers actually board.
Leasing
2019
At the inception of a contract, the Group assesses whether the contract is, or contains, a lease.
The Group as lessee
The Group recognizes right-of-use assets and lease liabilities for all leases at the commencement date of a
lease, except for short-term leases and low-value asset leases accounted for applying a recognition
exemption where lease payments are recognized as expenses on a straight-line basis over the lease terms.
Right-of-use assets are initially measured at cost, which comprises the initial measurement of lease
liabilities adjusted for lease payments made at or before the commencement date, plus any initial direct
costs incurred and an estimate of costs needed to restore the underlying assets, and less any lease incentives
received. Right-of-use assets are subsequently measured at cost less accumulated depreciation and
impairment losses and adjusted for any remeasurement of the lease liabilities. Right-of-use assets are
presented on a separate line in the consolidated balance sheets.
Right-of-use assets are depreciated using the straight-line method from the commencement dates to the
earlier of the end of the useful lives of the right-of-use assets or the end of the lease terms. However, if
leases transfer ownership of the underlying assets to the Group by the end of the lease terms or if the costs
of right-of-use assets reflect that the Group will exercise a purchase option, the Group depreciates the
right-of-use assets from the commencement dates to the end of the useful lives of the underlying assets.
Lease liabilities are initially measured at the present value of the lease payments, which comprise fixed
payments, in-substance fixed payments, variable lease payments which depend on an index or a rate,
residual value guarantees, the exercise price of a purchase option if the lessee is reasonably certain to
exercise that option, and payments of penalties for terminating a lease if the lease term reflects such
termination, less any lease incentives payable. The lease payments are discounted using the interest rate
implicit in a lease, if that rate can be readily determined. If that rate cannot be readily determined, the
Group uses the lessee’s incremental borrowing rate.

- 28 -
Subsequently, lease liabilities are measured at amortized cost using the effective interest method, with
interest expense recognized over the lease terms. When there is a change in a lease term, a change in the
amounts expected to be payable under a residual value guarantee, a change in the assessment of an option to
purchase an underlying asset, or a change in future lease payments resulting from a change in an index or a
rate used to determine those payments, the Group remeasures the lease liabilities with a corresponding
adjustment to the right-of-use-assets. Lease liabilities are presented on a separate line in the consolidated
balance sheets.
Variable lease payments that do not depend on an index or a rate are recognized as expenses in the periods
in which they are incurred.
For sale and leaseback transactions, if the transfer of an asset satisfies the requirements of IFRS 15 to be
accounted for as a sale, the Group recognizes only the amount of any gain or loss which relates to the rights
transferred to the buyer-lessor, and adjusts the off-market terms to measure the sale proceeds at fair value.
If the transfer does not satisfy the requirements of IFRS 15 to be accounted for as a sale, it is accounted for
as a financing transaction.
2018
Leases are classified as finance leases whenever the terms of the lease transfer substantially all the risks and
rewards of ownership to the lessee. All other leases are classified as operating leases.
a. Financial leases
The Group as lessee
Assets held under finance leases are initially recognized as assets of the Company at the lower of their
fair value at the inception of the lease or the present value of the minimum lease payments. The
corresponding liability to the lessee is included in the balance sheets as a finance lease obligation.
Minimum lease payments are apportioned between finance expenses and reductions of the lease
obligation so as to achieve a constant rate of interest on the remaining balance of the liability. Finance
expenses are recognized immediately in profit or loss, unless they are directly attributable to qualifying
assets, in which case, they are capitalized in accordance with the Company’s general policy on
borrowing costs. Contingent rentals are recognized as expenses in the periods in which they are
incurred.
b. Sales and leasebacks
For a sale and leaseback transaction, if it meets the condition whereby all the risks and rewards of
ownership of the leased asset are essentially transferred to the lessee, the sale and leaseback transaction
is classified as a finance lease. If part of the significant risks and rewards of ownership of the leased
asset remain with the lessor (i.e. the buyer), the sale and leaseback transaction is classified as an
operating lease.
1) Financial leases
This transaction does not actually dispose of the assets. The accounting treatment used is to treat the
transaction as if it did not occur, and the assets are continuously recognized at the book value of the
asset before sale.

- 29 -
2) Operating leases
If the selling price is equal to the fair value, the transaction gain or loss should be recognized
immediately. If the selling price is above fair value, the difference between the fair value and the
book value of the gain or loss should be recognized immediately; only the part of the selling price
which is above fair value shall be deferred and amortized over the period of the lease.
c. Operating leases
1) The Group as lessor
Rental income from operating leases is recognized on a straight-line basis over the term of the
relevant lease unless another systematic basis is representative of the time pattern of the lessee’s
benefit from the use of the leased asset.
2) The Group as lessee
Operating lease payments are recognized as expenses on a straight-line basis over the lease term,
except where another systematic basis is more representative of the time pattern in which economic
benefits from the leased asset are consumed. Contingent rentals arising under operating leases are
recognized as expenses in the period in which they are incurred.
In the event that lease incentives are received when entering into operating leases, such incentives
are recognized as a liability. The aggregate benefit of incentives is recognized as a reduction of
rental expense on a straight-line basis, except where another systematic basis is more representative
of the time pattern in which economic benefits from the leased asset are consumed.
Employee Benefits
a. Short-term employee benefits
Liabilities recognized in respect of short-term employee benefits are measured at the undiscounted
amount of the benefits expected to be paid in exchange for the related services.
b. Retirement benefits
Payments to the defined contribution retirement benefit plan are recognized as expenses when
employees have rendered services entitling them to the contributions.
Defined benefit costs (including service cost, net interest and remeasurement) under the defined
contribution retirement benefit plan are determined using the projected unit credit method. Service cost
(including current service cost and past service cost) and net interest on the net defined benefit
liabilities (assets) are recognized as employee benefits expense in the period in which they occur.
Remeasurement, comprising actuarial gains and losses and the return on plan assets (excluding interest),
is recognized in other comprehensive income in the period in which it occurs. Remeasurement
recognized in other comprehensive income is reflected immediately in retained earnings and will not be
reclassified to profit or loss.
Net defined benefit liabilities (assets) represent the actual deficit in the Group’s defined benefit plans.

- 30 -
Borrowing Costs
Borrowing costs directly attributable to the acquisition, construction or production of qualifying assets
(assets which are substantially ready for their intended use or sale through a fairly long period) are added to
the cost of those assets, until such time as the assets are substantially ready for their intended use or sale.
Investment income earned on the temporary investment of specific borrowings pending their expenditure on
qualifying assets is deducted from the borrowing costs eligible for capitalization.
Other than that which is stated above, all other borrowing costs are recognized in profit or loss in the period
in which they are incurred.
Frequent Flyer Programs
The Company has a “Dynasty Flyer Program” through which program members can convert accumulated
mileage to a cabin upgrade, free tickets and other member rewards and operates a “Tigerclub Member
Privilege Program” to provide members with accumulated ticket reward bonuses, which can be used to
offset the payments for airfare, luggage fees, priority check-ins, and ordering of meals in flight cabins. A
portion of passenger revenue attributable to the rewards for the frequent flyer program is deferred. The
Company should recognizes this deferred revenue as revenue only when the Company has fulfilled its
obligations on the granting of rewards or when the period for converting the mileage to rewards has
expired.
Share-based Payment Arrangements
Equity-settled share-based payments to employees are measured at the fair value of the equity instruments
at the grant date.
The fair value determined at the grant date of the equity-settled share-based payments is expensed on a
straight-line basis over the vesting period, based on the Group’s estimate of equity instrument that will
eventually vest, with a corresponding increase in capital surplus - employee share options. The fair value
determined at the grant date of the equity-settled share-based payments is recognized as an expense in full
at the grant date when the granted share options are vested immediately.
Taxation
Income tax expense represents the sum of the current tax and deferred tax.
a. Current tax
The current tax liabilities are based on current taxable profit. Since part of the income and expenses are
taxable or deductible in other periods, or in accordance with the relevant tax laws are taxable or
deductible, current taxable profit differs from net profit reported in the consolidated statements of
comprehensive income.
The Group’s current tax liabilities are calculated by the tax rate was legislated or substantially legislated
at the balance sheet date.
According to the Income Tax Law, an additional tax at 10% of unappropriated earnings is provided for
as income tax in the year the shareholders approve the retention of these earnings.
Adjustments of prior years’ tax liabilities are added to or deducted from the current year’s tax provision.

- 31 -
b. Deferred tax
Deferred tax is recognized on temporary differences between the carrying amounts of assets and
liabilities in the consolidated financial statements and the corresponding tax bases used in the
computation of taxable profit. Deferred tax liabilities are generally recognized for all taxable temporary
differences. Deferred tax assets are generally recognized for all deductible temporary differences,
unused loss carryforwards and unused tax credits for purchases of machinery, equipment and
technology, research and development expenditures, and personnel training expenditures to the extent
that it is probable that taxable profit will be available against which those deductible temporary
differences can be utilized.
Deferred tax liabilities are recognized for taxable temporary differences associated with investments in
subsidiaries and associates and interests in joint ventures, except where the Group is able to control the
reversal of the temporary difference and it is probable that the temporary difference will not reverse in
the foreseeable future. Deferred tax assets arising from deductible temporary differences associated
with such investments and interests are only recognized to the extent that it is probable that there will be
sufficient taxable profit against which to utilize the benefits of the temporary differences and they are
expected to reverse in the foreseeable future.
The carrying amount of deferred tax assets is reviewed at the end of each reporting period and reduced
to the extent that it is no longer probable that sufficient taxable profit will be available to allow all or
part of the assets to be recovered. A previously unrecognized deferred tax asset is also reviewed at the
end of each reporting period and recognized to the extent that it has become probable that future taxable
profit will allow the deferred tax asset to be recovered.
Deferred tax liabilities and assets are measured at the tax rates that are expected to apply in the period in
which the liabilities are settled or the assets are realized, based on tax rates (and tax laws) that have
been enacted or substantively enacted by the end of the reporting period. The measurement of deferred
tax liabilities and assets reflects the tax consequences that would follow from the manner in which the
Group expects, at the end of the reporting period, to recover or settle the carrying amount of its assets
and liabilities.
c. Current and deferred taxes for the year
Current and deferred taxes are recognized in profit or loss, except when they relate to items that are
recognized in other comprehensive income or directly in equity, in which case, the current and deferred
taxes are also recognized in other comprehensive income or directly in equity, respectively.
Maintenance and Overhaul Costs
Routine maintenance costs are recognized in profit or loss in the period in which they are incurred.
The overhaul costs of an owned or leased aircraft that meet the criteria for fixed asset capitalization are
capitalized as replacements for aircraft and engines and are depreciated on a straight-line basis over the
expected annual overhaul cycle.
5. CRITICAL ACCOUNTING JUDGEMENTS AND KEY SOURCES OF ESTIMATION
UNCERTAINTY
In the application of the Group’s accounting policies as disclosed in Note 4, management is required to
make judgments, estimations and assumptions about the carrying amounts of assets and liabilities that are
not readily apparent from other sources. The estimates and associated assumptions are based on historical
experience and other factors that are considered relevant. Actual results may differ from these estimates.

- 32 -
The estimates and underlying assumptions are reviewed on an ongoing basis. Revisions to accounting
estimates are recognized in the period in which the estimates are revised if the revisions affect only that
period or in the period of the revisions and future periods if the revisions affect both current and future
periods.
Key Sources of Estimation Uncertainty
The key assumptions concerning the future and other key sources of estimation uncertainty at the end of the
reporting period that have a significant risk causing a material adjustment to the carrying amounts of assets
and liabilities within the next financial year are discussed below.
Depreciation of Property, Plant and Equipment - Flight Equipment
Flight equipment is depreciated on a straight-line basis at rates that can be used to write down their cost to
their estimated residual values at the end of their useful lives. The estimates of the useful lives and residual
values of the flight equipment are made by the Group on the basis of past experience and fleet operation
performance in the industry. Due to changes in the fleet plan, the board of directors of the Company has
decided to change the expected useful lives of four 747-400 (GE) from 20 to 16-17 years since January 1,
2018 in order to meet the economic benefits and number of years of consumption. It is estimated that the
depreciation expense will increase by approximately NT$770 million annually.
Defined Benefit Obligations
The present value of defined benefit obligations at the end of the reporting period are calculated using
actuarial assumptions. Those assumptions, which are based on management’s judgment and estimates,
comprise the discount rate and expected return on plan assets. Changes in actuarial assumptions may have a
material impact on the amount of defined benefit obligations.
6. CASH AND CASH EQUIVALENTS
December 31
2019 2018
Cash on hand and revolving funds $ 483,951 $ 413,139
Checking accounts and demand deposits 7,206,938 7,770,200
Cash equivalents
Time deposits with original maturities of less than three months 16,565,821 15,784,323
Repurchase agreements collateralized by bonds 4,202,818 969,875
$ 28,459,528 $ 24,937,537
The market rate intervals of cash in banks and cash equivalents at the end of the reporting period were as
follows:
December 31
2019 2018
Bank balance 0%-1.9% 0%-1.9%
Time deposits with original maturities of less than three months 0.59%-3.55% 0.59%-3.55%
Repurchase agreements collateralized by bonds 0.47%-0.7% 0.63%-3.30%
- 33 -
7. FINANCIAL INSTRUMENTS AT FAIR VALUE THROUGH PROFIT OR LOSS (FVTPL)
December 31
2019 2018
Financial assets - current
Financial assets mandatorily classified at FVTPL
Derivative financial instruments (not under hedge accounting)
Foreign exchange forward contracts $ 434 $ -
Non-derivative financial assets
Beneficial certificates 511,758 206,001
$ 512,192 $ 206,001
Financial liabilities held for trading
Derivative financial instruments (not under hedge accounting) -
foreign exchange forward contracts $ 11,749 $ 221
At the end of the reporting period, outstanding foreign exchange forward contracts not under hedge
accounting were as follows:
Currency Maturity Date
Notional Amount
(In Thousands)
December 31, 2019
Buy forward contracts NTD/USD 2020.01.15-2020.07.31 NTD570,571/USD19,000
December 31, 2018
Buy forward contracts NTD/USD 2019.01.02-2019.01.31 NTD30,923/USD1,000
8. FINANCIAL ASSETS AT FVTOCI
Investments in Equity Instruments
December 31
2019 2018
Non-current
Foreign investments
Unlisted shares $ 182,356 $ 110,445
Domestic investments
Unlisted shares 26,865 21,746
$ 209,221 $ 132,191
These investments in equity instruments are not held for trading. Instead, they are held for medium- to
long-term strategic purposes. Accordingly, the management elected to designate these investments in equity
instruments as at FVTOCI as it believes that recognizing short-term fluctuations in these investments’ fair
values in profit or loss would not be consistent with the Group’s strategy of holding these investments for
long-term purposes.

- 34 -
9. FINANCIAL ASSETS AT AMORTIZED COST
December 31
2019 2018
Current
Time deposits with original maturities of more than 3 months $ 2,355,095 $ 3,856,660
Non-current
Time deposits with original maturities of more than 1 year $ 105,586 $ -
The interest rates for time deposits with original maturities of more than 3 months ranged from 0.60% to
1.30% and 0.40% to 1.36% as of 2019 and 2018.
10. NOTES RECEIVABLE AND ACCOUNTS RECEIVABLE
December 31
2019 2018
Notes receivable $ 299,245 $ 598,824
Accounts receivable
Accounts receivable 8,440,254 9,667,010
Less: Allowance for impairment loss (218,665) (227,306)
8,221,589 9,439,704
$ 8,520,834 $ 10,038,528
The average credit period was 7 to 55 days. In determining the recoverability of a trade receivable, the
Group considered any change in the credit quality of the receivable since the date credit was initially
granted to the end of the reporting period, and any allowance for impairment loss was based on the
estimated irrecoverable amounts determined by reference to the Group’s past default experience with the
counterparty and an analysis of the counterparty’s current financial position. The Group adopted a policy of
only dealing with entities that are rated the equivalent of investment grade or higher and obtaining
sufficient collateral, where appropriate, as a means of mitigating the risk of financial loss from defaults.
Credit rating information is obtained from independent rating agencies where available or, if not available,
the Group uses other publicly available financial information or its own trading records to rate its major
customers. The Group’s exposure and the credit ratings of its counterparties are continuously monitored and
the aggregate value of transactions concluded is spread amongst approved counterparties. Credit exposure
is controlled by counterparty limits that are reviewed and approved by the risk management committee
annually.
The Group applies the simplified approach to allowing for expected credit losses prescribed by IFRS 9,
which permits the use of lifetime expected loss allowance for all trade receivables. The expected credit
losses on trade receivables are estimated using a provision matrix by reference to past default experience
with the debtors and an analysis of the debtors’ current financial position, adjusted for general economic
conditions of the industry in which the debtors operate and an assessment of both the current as well as the
forecasted direction of economic conditions at the reporting date. As the Group’s historical credit loss
experience does not show significantly different loss patterns for different customer segments, the loss
allowance based on the past due status is not further distinguished according to the different segments of the
Group’s customer base.

- 35 -
The Group writes off a trade receivable when there is information indicating that the debtor is experiencing
severe financial difficulty and there is no realistic prospect of recovery. For accounts receivable that have
been written off, the Group continues to engage in enforcement activity to attempt to recover the
receivables which are due. Where recoveries are made, these are recognized in profit or loss.
The following table details the loss allowance of trade receivables based on the Group’s provision matrix.
December 31, 2019
Not Past Due Up to 30 Days 31 to 60 Days 61 to 90 Days Over 90 Days Total
Expected credit loss rate 0.12% 0.15% 6.16% 15.25% 97.18%
Gross carrying amount $ 6,705,662 $ 1,332,640 $ 97,700 $ 113,716 $ 190,536 $ 8,440,254
Loss allowance (lifetime
ECLs) (8,123) (2,019) (6,021) (17,340) (185,162) (218,665)
Amortized cost $ 6,697,539 $ 1,330,621 $ 91,679 $ 96,376 $ 5,374 $ 8,221,589
December 31, 2018
Not Past Due Up to 30 Days 31 to 60 Days 61 to 90 Days Over 90 Days Total
Expected credit loss rate 0.06% 0.06% 3.67% 21.78% 97.5%
Gross carrying amount $ 7,856,048 $ 1,424,421 $ 103,498 $ 76,415 $ 206,628 $ 9,667,010
Loss allowance (lifetime
ECLs) (4,546) (856) (3,796) (16,642) (201,466) (227,306)
Amortized cost $ 7,851,502 $ 1,423,565 $ 99,702 $ 59,773 $ 5,162 $ 9,439,704
The movements of the loss allowance of trade receivables were as follows:
For the Year Ended December 31
2019 2018
Balance at January 1 $ 227,306 $ 181,868
Add: Net remeasurement of loss allowance 24,096 49,824
Less: Amounts written off (32,717) (2,975)
Foreign exchange gains and losses (3) (1,411)
Loss of control of subsidiaries (17) -
Balance at December 31, 2018 $ 218,665 $ 227,306
11. INVENTORIES
December 31
2019 2018
Aircraft spare parts $ 7,578,125 $ 7,847,082
Items for in-flight sale 571,601 556,365
Work in process - maintenance services 283,933 227,975
Others 36,454 23,288
$ 8,470,113 $ 8,654,710
The operating costs recognized for the years ended December 31, 2019 and 2018 included losses from
- 36 -
inventory write-downs of $327,919 thousand and $371,275 thousand, respectively.
12. NON-CURRENT ASSETS HELD FOR SALE
December 31
2019 2018
Long-term equity investments held for sale - Asian Compressor
Technology Services $ -
$ 46,154
To enhance its competitiveness, the Company plans to introduce new aircraft and retire old aircraft
according to a planned schedule. Such aircraft, classified as non-current assets held for sale, had an original
book value which was higher than the expected sale price and which was recognized as an impairment loss.
However, the actual loss shall be identified by the actual sale price.
In 2019 and 2018, the Company recognized impairment losses of $0 thousand and $75,436 thousand,
respectively. In 2019 and 2018, the Company recognized disposal losses of $10,462 thousand and $368,992
thousand, respectively. The fair value was determined by transactions of the related market, and the
proposed sale price was based on the current status of the aircraft. The fair value is classified as level 3.
13. SUBSIDIARIES
Subsidiary included in the consolidated financial statements:
Proportion of
Ownership (%)
December 31
Investor Company Investee Company Main Businesses and Products 2019 2018
China Airlines, Ltd. Tigerair Taiwan Co., Ltd. (Note) Air transportation 77 100
Taiwan Aircraft Maintenance
And Engineering Co., Ltd.
Aircraft maintenance 100 100
CAL-Dynasty International A holding company, real estate and hotel
services
100 100
CAL-Asia Investment General investment 100 100
Dynasty Aerotech International
Corp.
Cleaning of aircraft and maintenance of
machine and equipment
100 100
Yestrip Travel business 100 100
Cal Park Real estate lease and international trade 100 100
Cal Hotel Co., Ltd. Hotel business 100 100
Sabre Travel Network (Taiwan) Sale and maintenance of hardware and
software
94 94
Mandarin Airlines Air transportation and maintenance of
aircraft
94 94
Taiwan Air Cargo Terminal
(Note)
Air cargo and storage 59 59
Kaohsiung Catering Services,
Ltd.
In-flight catering 54 54
Dynasty Holidays Travel business 20 51
Taoyuan International Airport
Services
Airport services 49 49
Taiwan Airport Services (Note) Airport services 48 48
Global Sky Express Forwarding and storage of air cargo 25 25
Cal-Dynasty Dynasty Properties Co., Ltd. Real estate management 100 100
International Dynasty Hotel of Hawaii, Inc. Hotel business 100 100
Taiwan Airport Services Taiwan Airport Service (Samoa) Airport supporting service and investment 100 100
Note: Proportion of ownership is considered from the perspective of the Group.
Except that the Company has control over Taoyuan International Airport Service, Taiwan Airport Service
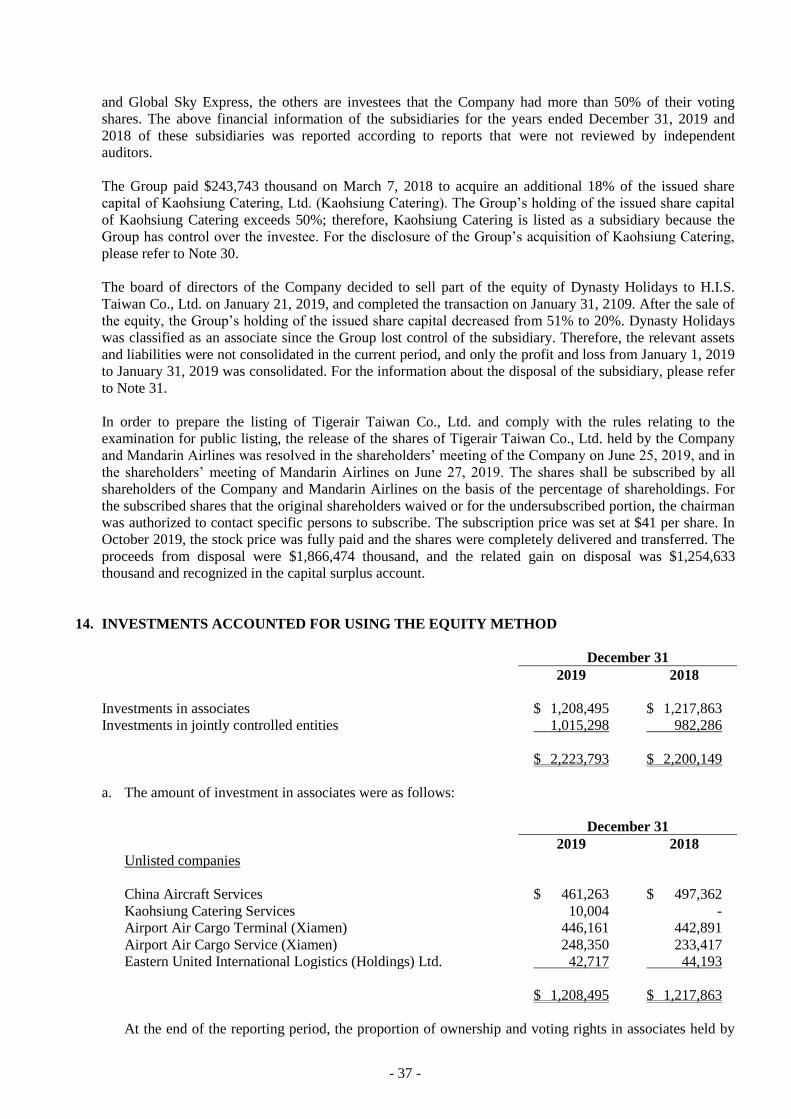
- 37 -
and Global Sky Express, the others are investees that the Company had more than 50% of their voting
shares. The above financial information of the subsidiaries for the years ended December 31, 2019 and
2018 of these subsidiaries was reported according to reports that were not reviewed by independent
auditors.
The Group paid $243,743 thousand on March 7, 2018 to acquire an additional 18% of the issued share
capital of Kaohsiung Catering, Ltd. (Kaohsiung Catering). The Group’s holding of the issued share capital
of Kaohsiung Catering exceeds 50%; therefore, Kaohsiung Catering is listed as a subsidiary because the
Group has control over the investee. For the disclosure of the Group’s acquisition of Kaohsiung Catering,
please refer to Note 30.
The board of directors of the Company decided to sell part of the equity of Dynasty Holidays to H.I.S.
Taiwan Co., Ltd. on January 21, 2019, and completed the transaction on January 31, 2109. After the sale of
the equity, the Group’s holding of the issued share capital decreased from 51% to 20%. Dynasty Holidays
was classified as an associate since the Group lost control of the subsidiary. Therefore, the relevant assets
and liabilities were not consolidated in the current period, and only the profit and loss from January 1, 2019
to January 31, 2019 was consolidated. For the information about the disposal of the subsidiary, please refer
to Note 31.
In order to prepare the listing of Tigerair Taiwan Co., Ltd. and comply with the rules relating to the
examination for public listing, the release of the shares of Tigerair Taiwan Co., Ltd. held by the Company
and Mandarin Airlines was resolved in the shareholders’ meeting of the Company on June 25, 2019, and in
the shareholders’ meeting of Mandarin Airlines on June 27, 2019. The shares shall be subscribed by all
shareholders of the Company and Mandarin Airlines on the basis of the percentage of shareholdings. For
the subscribed shares that the original shareholders waived or for the undersubscribed portion, the chairman
was authorized to contact specific persons to subscribe. The subscription price was set at $41 per share. In
October 2019, the stock price was fully paid and the shares were completely delivered and transferred. The
proceeds from disposal were $1,866,474 thousand, and the related gain on disposal was $1,254,633
thousand and recognized in the capital surplus account.
14. INVESTMENTS ACCOUNTED FOR USING THE EQUITY METHOD
December 31
2019 2018
Investments in associates $ 1,208,495 $ 1,217,863
Investments in jointly controlled entities 1,015,298 982,286
$ 2,223,793 $ 2,200,149
a. The amount of investment in associates were as follows:
December 31
2019 2018
Unlisted companies
China Aircraft Services $ 461,263 $ 497,362
Kaohsiung Catering Services 10,004 -
Airport Air Cargo Terminal (Xiamen) 446,161 442,891
Airport Air Cargo Service (Xiamen) 248,350 233,417
Eastern United International Logistics (Holdings) Ltd. 42,717 44,193
$ 1,208,495 $ 1,217,863
At the end of the reporting period, the proportion of ownership and voting rights in associates held by
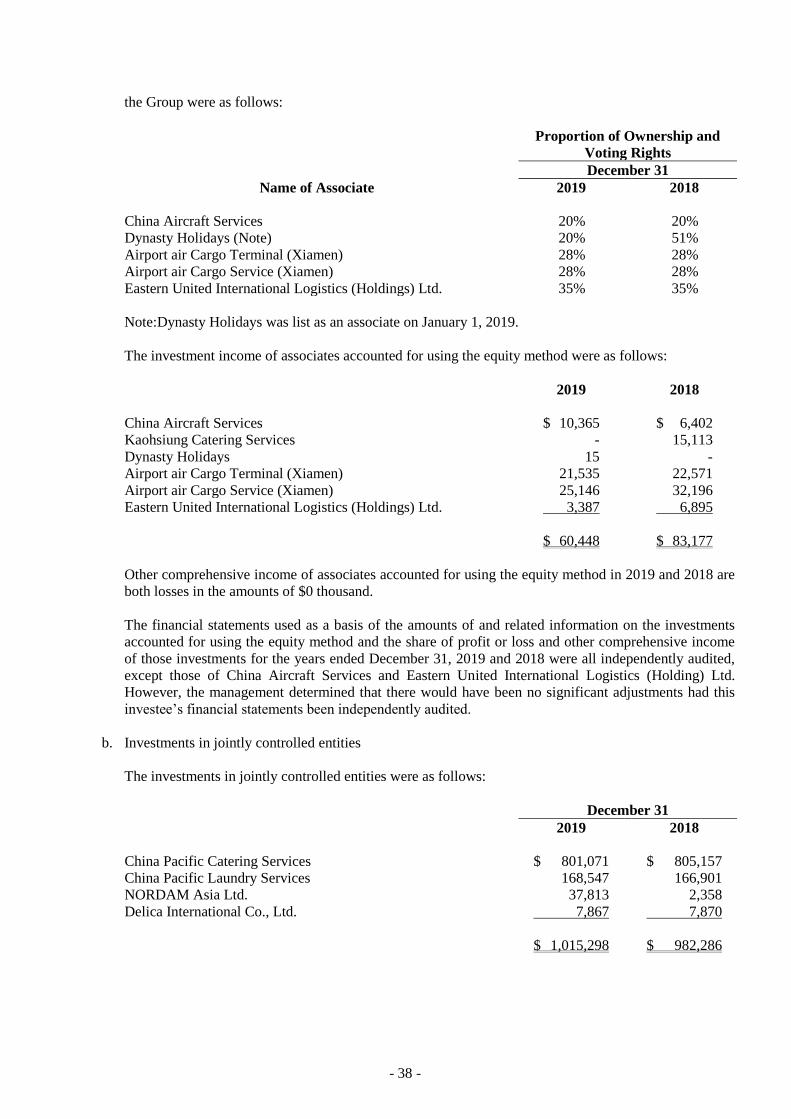
- 38 -
the Group were as follows:
Proportion of Ownership and
Voting Rights
December 31
Name of Associate 2019 2018
China Aircraft Services 20% 20%
Dynasty Holidays (Note) 20% 51%
Airport air Cargo Terminal (Xiamen) 28% 28%
Airport air Cargo Service (Xiamen) 28% 28%
Eastern United International Logistics (Holdings) Ltd. 35% 35%
Note:Dynasty Holidays was list as an associate on January 1, 2019.
The investment income of associates accounted for using the equity method were as follows:
2019 2018
China Aircraft Services $ 10,365 $ 6,402
Kaohsiung Catering Services - 15,113
Dynasty Holidays 15 -
Airport air Cargo Terminal (Xiamen) 21,535 22,571
Airport air Cargo Service (Xiamen) 25,146 32,196
Eastern United International Logistics (Holdings) Ltd. 3,387 6,895
93,375
$ 60,448 $ 83,177
Other comprehensive income of associates accounted for using the equity method in 2019 and 2018 are
both losses in the amounts of $0 thousand.
The financial statements used as a basis of the amounts of and related information on the investments
accounted for using the equity method and the share of profit or loss and other comprehensive income
of those investments for the years ended December 31, 2019 and 2018 were all independently audited,
except those of China Aircraft Services and Eastern United International Logistics (Holding) Ltd.
However, the management determined that there would have been no significant adjustments had this
investee’s financial statements been independently audited.
b. Investments in jointly controlled entities
The investments in jointly controlled entities were as follows:
December 31
2019 2018
China Pacific Catering Services $ 801,071 $ 805,157
China Pacific Laundry Services 168,547 166,901
NORDAM Asia Ltd. 37,813 2,358
Delica International Co., Ltd. 7,867 7,870
$ 1,015,298 $ 982,286

- 39 -
At the end of the reporting period, the proportion of ownership and voting rights in jointly controlled
entities held by the Group were as follows:
Proportion of Ownership and
Voting Rights
December 31
2019 2018
China Pacific Catering Services 51% 51%
China Pacific Laundry Services 55% 55%
NORDAM Asia Ltd. 49% 49%
Delica International Co., Ltd. 51% 51%
The Group entered into a joint venture agreement with the Taikoo Group to invest in China Pacific
Catering Services and China Pacific Laundry Services. According to the agreement, both parties have
the majority power in the board of directors to pose a motion for veto, and therefore the Group does not
have control.
To enhance the Group’s maintenance capabilities, the Company established a joint venture with the US
NORDAM Aerospace Group in December 2017, planning to provide thrust reversers and composite
repair services in Asia under the NORDAM brand. NORDAM has filed for Chapter 11 bankruptcy
reorganization in the USA on July 22, 2018 to solve the business disputation with their cooperative
partner, so their company operation was not impacted. As a result, NORDAM Asia suspended its
operation from October 5, 2018 to October 4, 2019 and resumed business on October 4, 2019. The
Company increased the capital of NORDAM Asia by $35,525 thousand in November 2019.
To expand the Group’s catering business, Kaohsiung Catering entered into a joint venture agreement
with a Japanese brand company to invest in Delica International Co, Ltd., with the Japanese brand
company having the right to make decisions on operations, and therefore, the Group does not have
control.
Details of investment income attributable to investment in jointly controlled entities were as follows:
For the Year Ended December 31
2019 2018
China Pacific Catering Services $ 256,899 $ 267,413
China Pacific Laundry Services 15,030 16,695
NORDAM Asia Ltd. (70) (41)
Delica International Co., Ltd. (2) 2
$ 271,857 $ 284,069
Other comprehensive income of associates accounted for using the equity method in 2019 and 2018 are
losses in the amounts of $(32,101) thousand and $(33,242) thousand, respectively.
The financial statements used as a basis of the amounts of and related information on the investments
accounted for using the equity method and the share of profit or loss and other comprehensive income
of those investments for the years ended December 31, 2019 and 2018 were all independently audited,
except of NORDAM Asia Limited. However, the management determined that there would have been
no significant adjustments had this investee’s financial statements been independently audited.
For details on services, major business offices and the country where the above associates and jointly
controlled entities are registered, refer to Table 6, “Names, Locations, And Other Information of
Investees Over Which the Company Exercises Significant Influence”, and Table 7, “Investments In
Mainland China”, following these notes to consolidated financial statements.
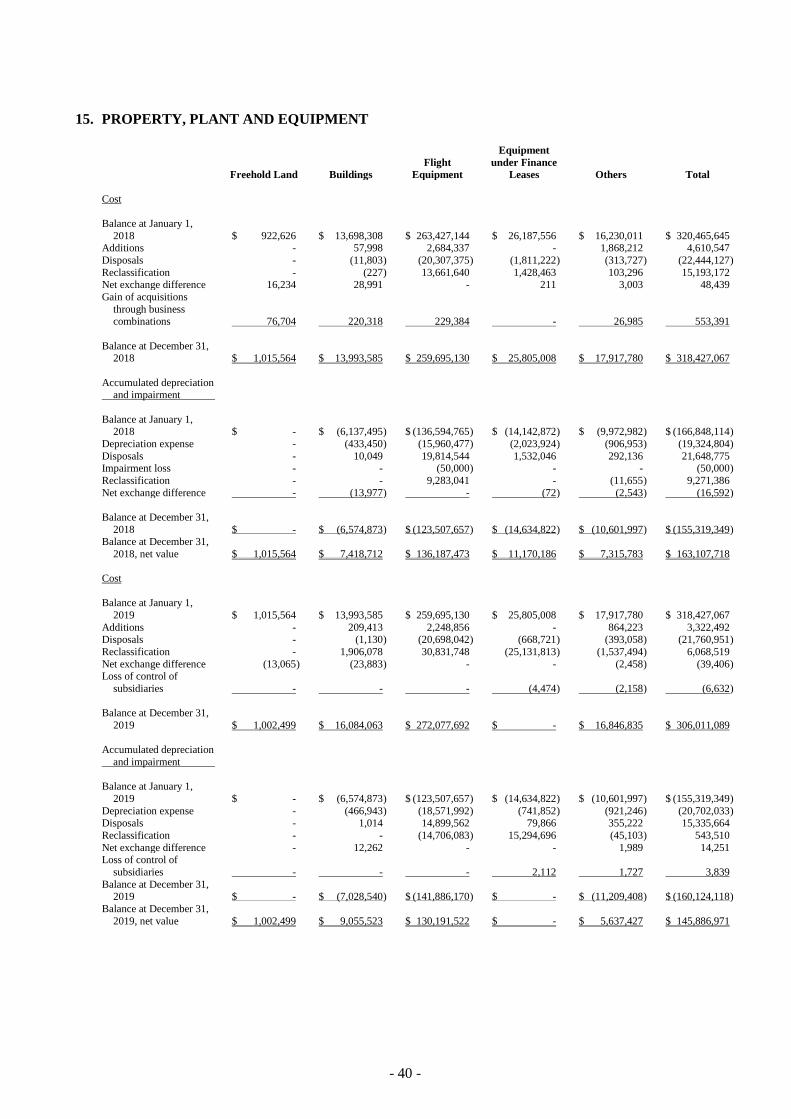
- 40 -
15. PROPERTY, PLANT AND EQUIPMENT
Freehold Land Buildings
Flight
Equipment
Equipment
under Finance
Leases Others Total
Cost
Balance at January 1,
2018 $ 922,626 $ 13,698,308 $ 263,427,144 $ 26,187,556 $ 16,230,011 $ 320,465,645 Additions - 57,998 2,684,337 - 1,868,212 4,610,547
Disposals - (11,803 ) (20,307,375 ) (1,811,222 ) (313,727 ) (22,444,127 )
Reclassification - (227 ) 13,661,640 1,428,463 103,296 15,193,172 Net exchange difference 16,234 28,991 - 211 3,003 48,439
Gain of acquisitions
through business combinations 76,704 220,318 229,384 - 26,985 553,391
Balance at December 31, 2018 $ 1,015,564 $ 13,993,585 $ 259,695,130 $ 25,805,008 $ 17,917,780 $ 318,427,067
Accumulated depreciation and impairment
Balance at January 1, 2018 $ - $ (6,137,495 ) $ (136,594,765 ) $ (14,142,872 ) $ (9,972,982 ) $ (166,848,114 )
Depreciation expense - (433,450 ) (15,960,477 ) (2,023,924 ) (906,953 ) (19,324,804 )
Disposals - 10,049 19,814,544 1,532,046 292,136 21,648,775 Impairment loss - - (50,000 ) - - (50,000 )
Reclassification - - 9,283,041 - (11,655 ) 9,271,386
Net exchange difference - (13,977 ) - (72 ) (2,543 ) (16,592 )
Balance at December 31,
2018 $ - $ (6,574,873 ) $ (123,507,657 ) $ (14,634,822 ) $ (10,601,997 ) $ (155,319,349 ) Balance at December 31,
2018, net value $ 1,015,564 $ 7,418,712 $ 136,187,473 $ 11,170,186 $ 7,315,783 $ 163,107,718
Cost
Balance at January 1,
2019 $ 1,015,564 $ 13,993,585 $ 259,695,130 $ 25,805,008 $ 17,917,780 $ 318,427,067
Additions - 209,413 2,248,856 - 864,223 3,322,492 Disposals - (1,130 ) (20,698,042 ) (668,721 ) (393,058 ) (21,760,951 )
Reclassification - 1,906,078 30,831,748 (25,131,813 ) (1,537,494 ) 6,068,519
Net exchange difference (13,065 ) (23,883 ) - - (2,458 ) (39,406 ) Loss of control of
subsidiaries - - - (4,474 ) (2,158 ) (6,632 )
Balance at December 31,
2019 $ 1,002,499 $ 16,084,063 $ 272,077,692 $ - $ 16,846,835 $ 306,011,089
Accumulated depreciation
and impairment
Balance at January 1,
2019 $ - $ (6,574,873 ) $ (123,507,657 ) $ (14,634,822 ) $ (10,601,997 ) $ (155,319,349 )
Depreciation expense - (466,943 ) (18,571,992 ) (741,852 ) (921,246 ) (20,702,033 )
Disposals - 1,014 14,899,562 79,866 355,222 15,335,664
Reclassification - - (14,706,083 ) 15,294,696 (45,103 ) 543,510
Net exchange difference - 12,262 - - 1,989 14,251 Loss of control of
subsidiaries - - - 2,112 1,727 3,839
Balance at December 31, 2019 $ - $ (7,028,540 ) $ (141,886,170 ) $ - $ (11,209,408 ) $ (160,124,118 )
Balance at December 31,
2019, net value $ 1,002,499 $ 9,055,523 $ 130,191,522 $ - $ 5,637,427 $ 145,886,971

- 41 -
Property, plant and equipment are depreciated on a straight-line basis over the estimated useful life of the
asset:
Building
Main buildings 45-55 years
Others 10-25 years
Machinery and equipment
Electro-mechanical equipment 25 years
Others 3-13 years
Office equipment 3-15 years
Leasehold improvements
Building improvements 5 years
Others 3-5 years
Assets leased to others 3-5 years
Flight equipment and equipment under finance leases
Airframes 15-25 years
Aircraft cabins 7-20 years
Engines 10-20 years
Heavy maintenance on aircraft 6-8 years
Engine overhauls 3-10 years
Landing gear overhauls 7-12 years
Repairable spare parts 3-15 years
Leased aircraft improvements 5-12 years
Regarding changes in fleet composition, current and forecasted market value, and other technical factors,
the Group recognized impairment losses on aircraft equipment in 2018 of $50,000 thousand. The fair value
was determined based on aircraft conditions and market estimates.
Refer to Note 35 for the carrying amounts of property, plant and equipment pledged by the Group.
Based on the particularity of risk in the aviation industry, all of the Group’s assets such as aircraft, real
estate, and movable property are adequately insured to diversify the potential risk related to operations.
The Group generated the following non-cash investment activities related to the purchase of property, plant
and equipment in 2019 and 2018:
December 31
2019 2018
Increase in property, plant and equipment $ 3,322,492 $ 4,610,547
Capitalized interest paid (6,414) (1,947)
Purchase of property, plant and equipment paid $ 3,316,078 $ 4,608,600
16. INVESTMENT PROPERTIES
December 31
2019 2018
Carrying amount
Investment properties $ 2,075,068 $ 2,075,345
The investment properties held by the Group were land located in Nankan and buildings in Taipei, which
were all leased to others. The buildings are depreciated on a straight-line basis over 55 years.
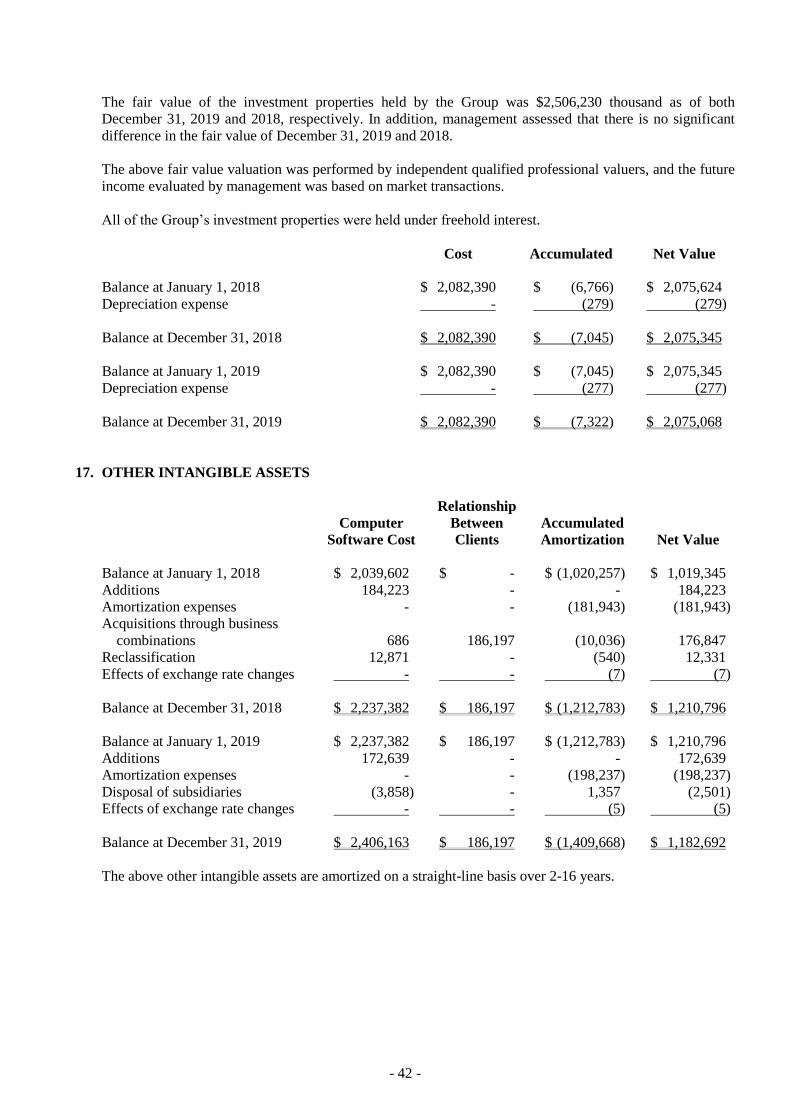
- 42 -
The fair value of the investment properties held by the Group was $2,506,230 thousand as of both
December 31, 2019 and 2018, respectively. In addition, management assessed that there is no significant
difference in the fair value of December 31, 2019 and 2018.
The above fair value valuation was performed by independent qualified professional valuers, and the future
income evaluated by management was based on market transactions.
All of the Group’s investment properties were held under freehold interest.
Cost Accumulated Net Value
Balance at January 1, 2018 $ 2,082,390 $ (6,766) $ 2,075,624
Depreciation expense - (279) (279)
Balance at December 31, 2018 $ 2,082,390 $ (7,045) $ 2,075,345
Balance at January 1, 2019 $ 2,082,390 $ (7,045) $ 2,075,345
Depreciation expense - (277) (277)
Balance at December 31, 2019 $ 2,082,390 $ (7,322) $ 2,075,068
17. OTHER INTANGIBLE ASSETS
Computer
Software Cost
Relationship
Between
Clients
Accumulated
Amortization Net Value
Balance at January 1, 2018 $ 2,039,602 $ - $ (1,020,257) $ 1,019,345
Additions 184,223 - - 184,223
Amortization expenses - - (181,943) (181,943)
Acquisitions through business
combinations 686 186,197 (10,036) 176,847
Reclassification 12,871 - (540) 12,331
Effects of exchange rate changes - - (7) (7)
Balance at December 31, 2018 $ 2,237,382 $ 186,197 $ (1,212,783) $ 1,210,796
Balance at January 1, 2019 $ 2,237,382 $ 186,197 $ (1,212,783) $ 1,210,796
Additions 172,639 - - 172,639
Amortization expenses - - (198,237) (198,237)
Disposal of subsidiaries (3,858) - 1,357 (2,501)
Effects of exchange rate changes - - (5) (5)
Balance at December 31, 2019 $ 2,406,163 $ 186,197 $ (1,409,668) $ 1,182,692
The above other intangible assets are amortized on a straight-line basis over 2-16 years.

- 43 -
18. OTHER ASSETS
December 31
2019 2018
Current
Temporary payments $ 296,759 $ 556,860
Prepayments 1,690,368 3,028,808
Restricted assets 14,618 18,623
Others 653,966 543,591
$ 2,655,711 $ 4,147,882
Non-current
Prepayments for aircraft $ 8,863,861 $ 529,963
Prepayments - long-term 2,819,575 1,603,400
Refundable deposits 1,261,611 1,089,690
Restricted assets 64,213 100,141
Other financial assets 19,103 19,335
Others 142,700 88,224
$ 13,171,063 $ 3,430,753
The prepayments for aircraft comprised the prepaid deposits and capitalized interest from the purchase of
A350-900, ATR72-600, A321neo, A320neo and B777F aircrafts. For details on the aircraft purchase
contracts, refer to Note 36.
19. BORROWINGS
a. Short-term debts
December 31
2019 2018
Bank loans - unsecured $ 380,000 $ -
Interest rates 0.95%-1.07% -
b. Long-term borrowings
December 31
2019 2018
Unsecured bank loans $ 1,929,827 $ 9,354,457
Secured bank loans 34,064,099 36,330,211
Commercial paper
Proceeds from issue 31,730,000 30,770,000
Less: Unamortized discount 60,143 59,033
67,663,783 76,395,635
Less: Current portion 14,148,892 15,709,487
$ 53,514,891 $ 60,686,148
Interest rates 0.55%-1.73% 0.92%-1.46%
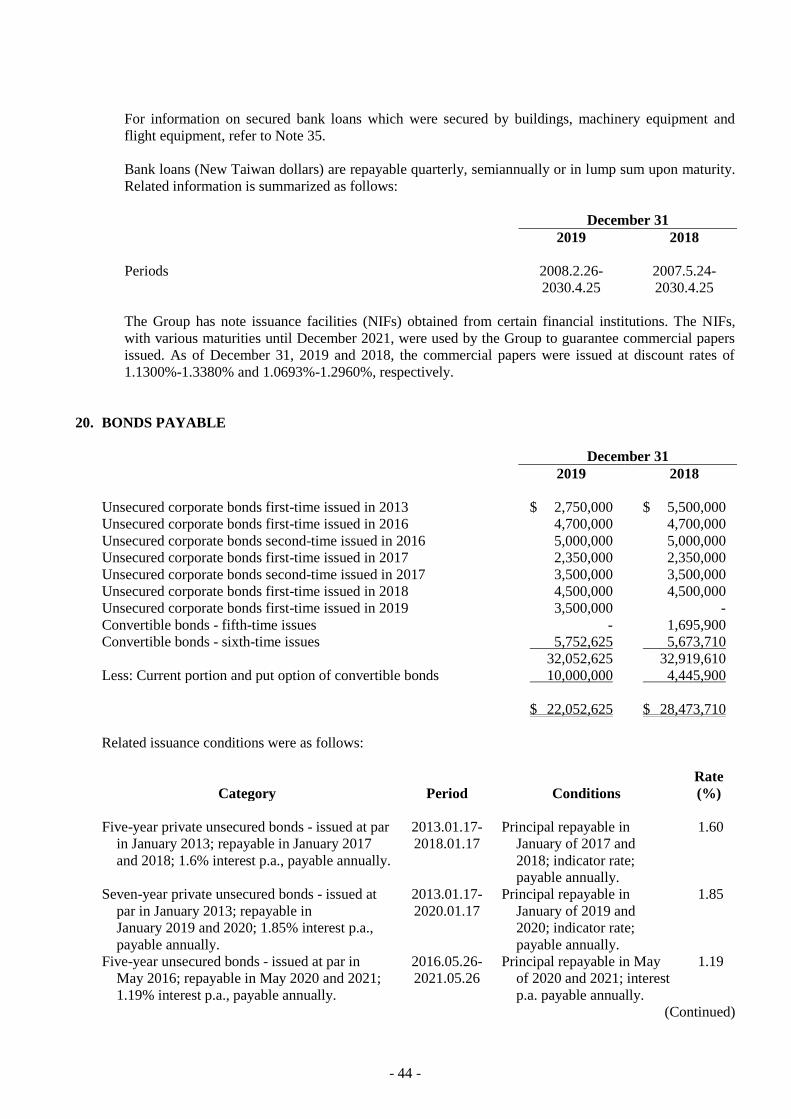
- 44 -
For information on secured bank loans which were secured by buildings, machinery equipment and
flight equipment, refer to Note 35.
Bank loans (New Taiwan dollars) are repayable quarterly, semiannually or in lump sum upon maturity.
Related information is summarized as follows:
December 31
2019 2018
Periods 2008.2.26-
2030.4.25
2007.5.24-
2030.4.25
The Group has note issuance facilities (NIFs) obtained from certain financial institutions. The NIFs,
with various maturities until December 2021, were used by the Group to guarantee commercial papers
issued. As of December 31, 2019 and 2018, the commercial papers were issued at discount rates of
1.1300%-1.3380% and 1.0693%-1.2960%, respectively.
20. BONDS PAYABLE
December 31
2019 2018
Unsecured corporate bonds first-time issued in 2013 $ 2,750,000 $ 5,500,000
Unsecured corporate bonds first-time issued in 2016 4,700,000 4,700,000
Unsecured corporate bonds second-time issued in 2016 5,000,000 5,000,000
Unsecured corporate bonds first-time issued in 2017 2,350,000 2,350,000
Unsecured corporate bonds second-time issued in 2017 3,500,000 3,500,000
Unsecured corporate bonds first-time issued in 2018 4,500,000 4,500,000
Unsecured corporate bonds first-time issued in 2019 3,500,000 -
Convertible bonds - fifth-time issues - 1,695,900
Convertible bonds - sixth-time issues 5,752,625 5,673,710
32,052,625 32,919,610
Less: Current portion and put option of convertible bonds 10,000,000 4,445,900
$ 22,052,625 $ 28,473,710
Related issuance conditions were as follows:
Category Period Conditions
Rate
(%)
Five-year private unsecured bonds - issued at par
in January 2013; repayable in January 2017
and 2018; 1.6% interest p.a., payable annually.
2013.01.17-
2018.01.17
Principal repayable in
January of 2017 and
2018; indicator rate;
payable annually.
1.60
Seven-year private unsecured bonds - issued at
par in January 2013; repayable in
January 2019 and 2020; 1.85% interest p.a.,
payable annually.
2013.01.17-
2020.01.17
Principal repayable in
January of 2019 and
2020; indicator rate;
payable annually.
1.85
Five-year unsecured bonds - issued at par in
May 2016; repayable in May 2020 and 2021;
1.19% interest p.a., payable annually.
2016.05.26-
2021.05.26
Principal repayable in May
of 2020 and 2021; interest
p.a. payable annually.
1.19
(Continued)

- 45 -
Category Period Conditions
Rate
(%)
Five-year unsecured bonds - issued at par in
September 2016; repayable in September 2020
and 2021; 1.08% interest p.a., payable
annually.
2016.09.27-
2021.09.27
Principal repayable in
September of 2020 and
2021; interest p.a. payable
annually.
1.08
Three-year private unsecured bonds - issued at
par in May 2017; repayable on due date;
interest of 1.2% p.a., payable annually.
2017.05.19-
2020.05.19
Principal repayable on due
date; indicator rate;
payable annually.
1.20
Seven-year private unsecured bonds - issued at
par in May 2017; repayable on due date;
interest of 1.75% p.a., payable annually.
2017.05.19-
2024.05.19
Principal repayable on due
date; indicator rate;
payable annually.
1.75
Three-year private unsecured bonds - issued at
par in October 2017; repayable on due date;
interest of 1.14% p.a., payable annually.
2017.10.12-
2020.10.12
Principal repayable on due
date; indicator rate;
payable annually.
1.14
Five-year private unsecured bonds - issued at par
in October 2017; repayable in October 2021
and 2022; 1.45% interest p.a., payable
annually.
2017.10.12-
2022.10.12
Principal repayable in
October of 2021 and
2022; indicator rate;
payable annually.
1.45
Five-year private unsecured bonds - issued at par
in November 2018; repayable in
November 2022 and 2023; 1.32% interest p.a.,
payable annually
2018.11.30-
2023.11.30
Principal repayable in
November of 2022 and
2023; indicator rate;
payable annually
1.32
Five-year private unsecured bonds - issued at par
in November 2018; repayable in
November 2022 and 2023; 1.45% interest p.a.,
payable annually
2018.11.30-
2025.11.30
Principal repayable in
November of 2022 and
2023; indicator rate;
payable annually
1.45
Five-year private unsecured bonds - issued at par
in June 2019; repayable in June 2023 and
2024; 1.10% interest p.a., payable annually
2019.06.21-
2024.06.21
Principal repayable in June
of 2023 and 2024;
indicator rate; payable
annually
1.10
Seven-year private unsecured bonds - issued at
par in June 2019; repayable in June 2025 and
2026; 1.32% interest p.a., payable annually
2019.06.21-
2026.06.21
Principal repayable in June
of 2025 and 2026;
indicator rate; payable
annually
1.32
Five-year convertible bonds - issued at discount
in December 2013; repayable in lump sum
upon maturity; 1.8245% discount rate p.a.
2013.12.26-
2018.12.26
Except for converting to
share capital or buying
back, principal repayable
in December of 2018
-
Five-year convertible bonds - issued at discount
in December 2013; repayable in lump sum
upon maturity; 1.3821% discount rate p.a.
2018.01.30-
2023.01.30
Except for converting to
share capital or buying
back, principal repayable
in December of 2023
-
(Concluded)
The Company issued its 2016 first unsecured corporate bonds with a face value of $5,000,000 thousand,
and the purchasers of the bonds included Mandarin Airlines Co., Ltd. and Sabre Travel Network (Taiwan)
Co., Ltd., which held a face value of $300,000 thousand, and the amount was eliminated in the consolidated
financial statements.
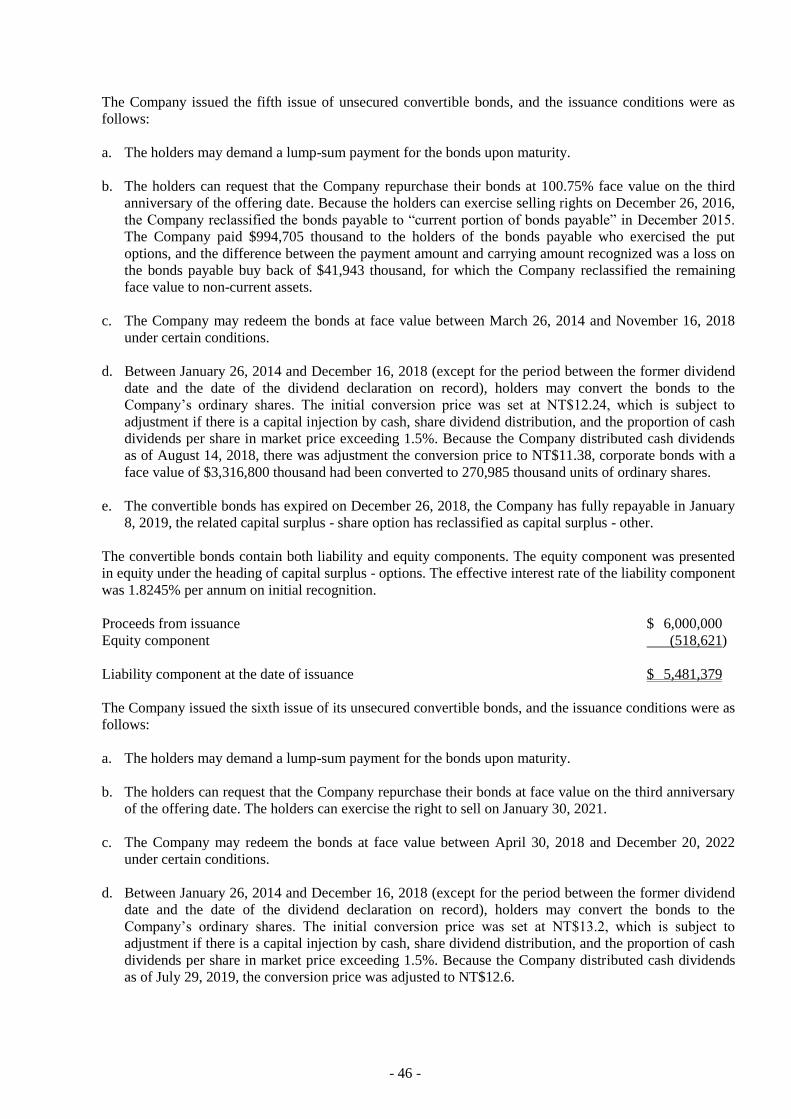
- 46 -
The Company issued the fifth issue of unsecured convertible bonds, and the issuance conditions were as
follows:
a. The holders may demand a lump-sum payment for the bonds upon maturity.
b. The holders can request that the Company repurchase their bonds at 100.75% face value on the third
anniversary of the offering date. Because the holders can exercise selling rights on December 26, 2016,
the Company reclassified the bonds payable to “current portion of bonds payable” in December 2015.
The Company paid $994,705 thousand to the holders of the bonds payable who exercised the put
options, and the difference between the payment amount and carrying amount recognized was a loss on
the bonds payable buy back of $41,943 thousand, for which the Company reclassified the remaining
face value to non-current assets.
c. The Company may redeem the bonds at face value between March 26, 2014 and November 16, 2018
under certain conditions.
d. Between January 26, 2014 and December 16, 2018 (except for the period between the former dividend
date and the date of the dividend declaration on record), holders may convert the bonds to the
Company’s ordinary shares. The initial conversion price was set at NT$12.24, which is subject to
adjustment if there is a capital injection by cash, share dividend distribution, and the proportion of cash
dividends per share in market price exceeding 1.5%. Because the Company distributed cash dividends
as of August 14, 2018, there was adjustment the conversion price to NT$11.38, corporate bonds with a
face value of $3,316,800 thousand had been converted to 270,985 thousand units of ordinary shares.
e. The convertible bonds has expired on December 26, 2018, the Company has fully repayable in January
8, 2019, the related capital surplus - share option has reclassified as capital surplus - other.
The convertible bonds contain both liability and equity components. The equity component was presented
in equity under the heading of capital surplus - options. The effective interest rate of the liability component
was 1.8245% per annum on initial recognition.
Proceeds from issuance $ 6,000,000
Equity component (518,621)
Liability component at the date of issuance $ 5,481,379
The Company issued the sixth issue of its unsecured convertible bonds, and the issuance conditions were as
follows:
a. The holders may demand a lump-sum payment for the bonds upon maturity.
b. The holders can request that the Company repurchase their bonds at face value on the third anniversary
of the offering date. The holders can exercise the right to sell on January 30, 2021.
c. The Company may redeem the bonds at face value between April 30, 2018 and December 20, 2022
under certain conditions.
d. Between January 26, 2014 and December 16, 2018 (except for the period between the former dividend
date and the date of the dividend declaration on record), holders may convert the bonds to the
Company’s ordinary shares. The initial conversion price was set at NT$13.2, which is subject to
adjustment if there is a capital injection by cash, share dividend distribution, and the proportion of cash
dividends per share in market price exceeding 1.5%. Because the Company distributed cash dividends
as of July 29, 2019, the conversion price was adjusted to NT$12.6.

- 47 -
The convertible bonds contain both liability and equity components. The equity component was presented
in equity under the heading of capital surplus - options. The effective interest rate of the liability component
was 1.3821% per annum on initial recognition.
Proceeds from issuance $ 6,012,000
Equity component (409,978)
Liability component at the date of issuance $ 5,602,022
The seventh issue of the Company’s unsecured convertible bonds was resolved by the board of directors of
the Company on August 7, 2019. The cumulative face value of the bonds shall not exceed $3,000,000
thousand. The bonds are issued at 100%-100.5% of the face value, and the issuance period is 5 years.
21. LEASING
2019
a. Right-of-use assets - 2019
December 31,
2019
Carrying amounts
Land $ 8,153,382
Buildings 824,955
Flight equipment 62,052,701
Other equipment 2,579
$ 71,033,617
For Year Ended
December 31,
2019
Additions to right-of-use assets $ 5,863,625
Depreciation for right-of-use assets
Land $ 376,425
Buildings 798,933
Flight equipment 10,721,575
Other equipment 2,157
$ 11,899,090
b. Lease liabilities - 2019
December 31,
2019
Carrying amounts
Current $ 2,340,873
Non-current $ 15,801,724

- 48 -
Range of discount rate for lease liabilities (include US lease hedging instruments):
December 31,
2019
Land 1.09%-1.65%
Buildings 0%-3.56%
Flight equipment 2.49%-3.34%
Other equipment 1.06%-1.50%
c. Financial liabilities under hedge accounting
The Group specifics a part of US lease contract as a hedging instruments to avoid exchange fluctuations
is US dollar passenger revenue, and applies the accounting treatment of cash flow hedging. The lease
information is as follows:
Maturity Date Subject Carrying Value
December 31, 2019 2021.4.15-2028.5.15 Financial liabilities for hedging -
current
$ 8,577,482
Financial liabilities for hedging -
non-current
42,420,205
Influence of comprehensive income
Recognized in
Other
Comprehensive
Income
Reclassified to
Income
For the year ended December 31, 2019 $1,457,058 $ (24,029)
d. As lessees, China Airlines, Mandarin Airlines and Tigerair Taiwan leased ten 777-300ER planes,
fifteen A330-300 planes, fifteen 737-800 planes, ten A320-200 planes, six ERJ190 planes and three
ART72-600 planes for operation, lease period are 6 to 12 years from February 2006 to May 2028. The
rental pricing method is partly a fixed amount of funds, and some of them are floating rents, floating
rents are according to benchmark ratio, the rent is revised every half year. When the lease expires, the
lease agreements have no purchase rights.
The information of refundable deposits and opening of credit letter due to rental of planes:
December 31,
2019
Refundable deposits $ 737,895
Credit guarantees 1,717,953
CAL Park, and Taoyuan International Airport Service signed a BOT contract with a land lease
agreement, for the details for the lease agreement, please refer to Note 35. The lease includes an option
to extend the lease, as it is not possible to extend the lease, the amount of the lease related to the period
covered by the option is not included in the lease liability. If the amount of the extended lease period is
included in the lease liability, the lease liability will increase by $873,293 thousand on December 31,
2019.
Taiwan Air Cargo Terminal Co. and CAA signed a BOT contract with a land lease agreement. For
details, please refer to Note 36.

- 49 -
e. The Company signed a rental contract for six A321neo with Air Lease Corporation, which is expected
to be introduced between 2021 and 2022.
The Company signed a rental letter of intent for eight A321neo with CALC Lease Corporation, which is
expected to be introduced in 2022.
Tigerair Taiwan Co., Ltd. signed a rental letter of intent for eight A321neo with ICBC Lease
Corporation, which is expected to be introduced in 2021.
f. In order to revitalize assets and strengthen the financial structure, the Company sold five of its own
A330-300 aircraft to Altavair L.P. in September 2019 by sale-and-leaseback for $4,905,660 thousand.
The lease term was 5 to 6 years and a loss of $103,775 thousand was incurred. The lease agreement had
no terms for lease renewal or offtake rights. The annual lease payments for each aircraft are US$5,389
thousand to US$5,437 thousand.
g. Other lease information
The Group uses operating lease agreement for investment properties, refer to Note 16.
For the Year
Ended
December 31,
2019
Short-term and low price lease payment $ 52,675
Total of lease cash outflow $ (13,884,367)
The Group chooses to waive the recognition of the contract provisions for the short-term leases and low
price lease, and does not recognize the related right-of-use assets and lease liabilities for such lease.
2018
1) Sale-leaseback finance leases
December 31,
2018
Minimum lease payments - flight equipment
Within one year $ 596,000
Beyond one year and within five years -
Present value of minimum lease payments $ 596,000
Interest rates 1.0680%
The Group had leased one A330-300 aircraft under sale-leaseback finance leases as of December
31, 2018. The lease terms started from June 2006 to April 2019. During the lease terms, the Group
retained all risks and rewards attached to the aircraft and engines and enjoyed the same substantive
rights as those prior to the transactions. The interest rates underlying all obligations under these
finance leases were floating. Therefore, the minimum lease payments under the sale-leaseback
aircraft contracts do not include interest expenses.

- 50 -
2) Finance leases
Taiwan Air Cargo Terminal Co. (“TACT”) entered into a terminal construction contract. Refer to
Note 36 for the terms of the contract. Dynasty Holiday Co., Ltd. signed a long-term equipment lease
contract, and the lease contract is a finance lease contract.
December 31,
2018
Minimum lease payments - cargo terminal and other
Within one year $ 37,998
Beyond one year and within five years 2,974
40,972
Less: Finance costs (629)
Present value of minimum lease payments $ 40,343
Present value of minimum lease payments -
cargo terminal and other
Within one year $ 37,398
Beyond one year and within five years 2,945
$ 40,343
Discount rate 4.756%
Total amount of present value of minimum lease payments
Current $ 633,398
Noncurrent 2,945
$ 636,343
3) Operating lease arrangements (include sale-leaseback operating leases)
For the operating lease arrangements, please refer to the consolidated financial statements for the
year ended December 31, 2018.
As of December 31, 2018, the refundable deposits paid by the Group under operating lease
contracts were $693,466 thousand. Some of the guarantees were secured by credit guarantees, and
outstanding credit guarantees as of December 31, 2018 were $1,682,774 thousand.
The future minimum lease payments for the non-cancelable operating lease commitments were as
follows:
December 31,
2018
Up to 1 year $ 11,785,442
Over 1 year to 5 years 44,559,429
Over 5 years 21,685,499
$ 78,030,370
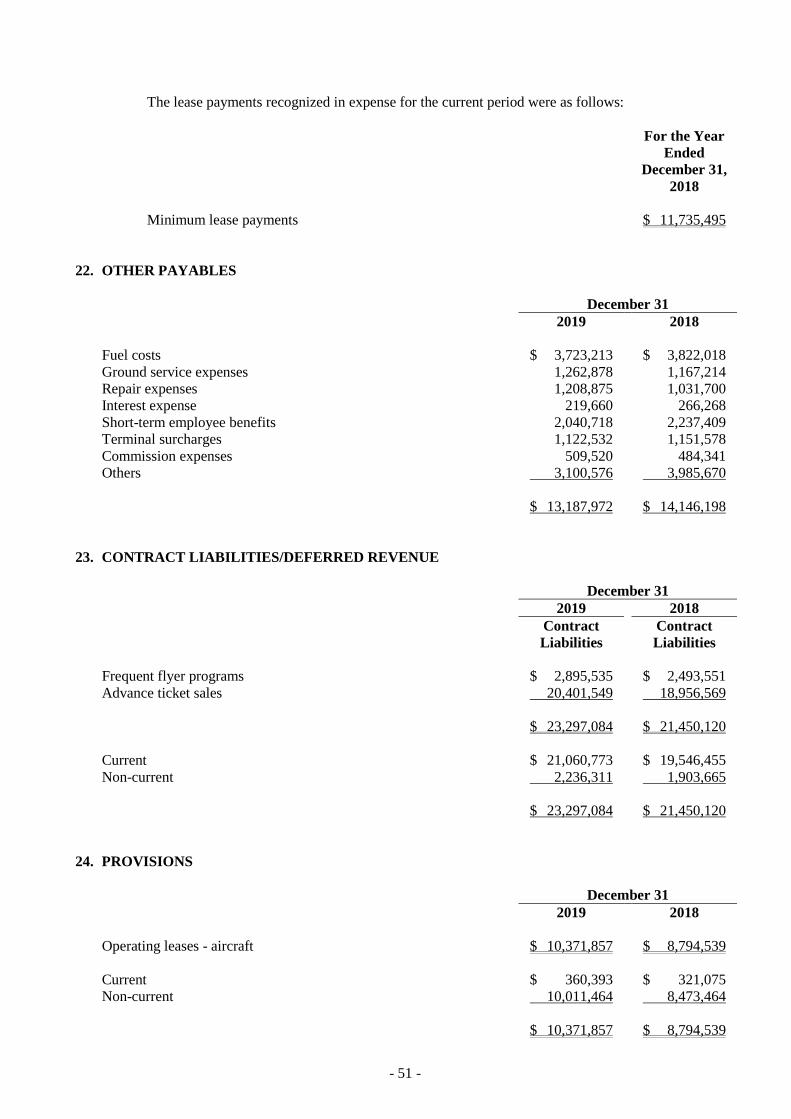
- 51 -
The lease payments recognized in expense for the current period were as follows:
For the Year
Ended
December 31,
2018
Minimum lease payments $ 11,735,495
22. OTHER PAYABLES
December 31
2019 2018
Fuel costs $ 3,723,213 $ 3,822,018
Ground service expenses 1,262,878 1,167,214
Repair expenses 1,208,875 1,031,700
Interest expense 219,660 266,268
Short-term employee benefits 2,040,718 2,237,409
Terminal surcharges 1,122,532 1,151,578
Commission expenses 509,520 484,341
Others 3,100,576 3,985,670
$ 13,187,972 $ 14,146,198
23. CONTRACT LIABILITIES/DEFERRED REVENUE
December 31
2019 2018
Contract
Liabilities
Contract
Liabilities
Frequent flyer programs $ 2,895,535 $ 2,493,551
Advance ticket sales 20,401,549 18,956,569
$ 23,297,084 $ 21,450,120
Current $ 21,060,773 $ 19,546,455
Non-current 2,236,311 1,903,665
$ 23,297,084 $ 21,450,120
24. PROVISIONS
December 31
2019 2018
Operating leases - aircraft $ 10,371,857 $ 8,794,539
Current $ 360,393 $ 321,075
Non-current 10,011,464 8,473,464
$ 10,371,857 $ 8,794,539

- 52 -
Aircraft Lease
Contract
Balance at January 1, 2018 $ 8,489,308
Additional provisions recognized 3,386,052
Usage (3,310,089)
Effect of exchange rate changes 229,268
Balance at December 31, 2018 $ 8,794,539
Balance at January 1, 2019 $ 8,794,539
Additional provisions recognized 4,608,924
Usage (2,799,314)
Effect of exchange rate changes (232,292)
Balance at December 31, 2019 $ 10,371,857
The Group leased flight equipment under operating lease agreements. Under the contracts, when the leases
expire and the equipment is returned to the lessor, the flight equipment has to be repaired according to the
expected years of use, number of flight hours, flight cycles and the number of engine revolutions. The
Group had existing obligations to recognize provisions when signing a lease or during the lease term.
Tigerair Taiwan Co., Ltd. also leased flight equipment under operating lease agreements. In accordance to
the contract, Tigerair must pay maintenance reserves monthly according to the actual number of flight
hours.
25. RETIREMENT BENEFIT PLANS
a. Defined contribution plans
The Group adopted a pension plan under the Labor Pension Act (the “LPA”), which is a state-managed
defined contribution plan. Under the LPA, an entity makes monthly contributions to employees’
individual pension accounts at 6% of monthly salaries and wages.
Employees based in the United states and Japan of China Airlines Co., Ltd. and subsidiaries are
members of the United states and Japan government retirement benefit plans. Subsidiaries should
appropriate a specific portion to retirement benefit plans. The obligation to the government retirement
benefit plans of China Airlines Co., Ltd. and subsidiaries is to appropriate a specific portion amount.
b. Defined benefit plans
The defined benefit plan adopted by the Company and in accordance with the Labor Standards Law is
operated by the government. Pension benefits are calculated on the basis of the length of service and
average monthly salaries of the six months before retirement. The Company and subsidiary contribute
amounts equal to 2%-15% of total monthly salaries and wages to a pension fund administered by the
pension fund monitoring committee. Pension contributions are deposited in the Bank of Taiwan in the
committee’s name. Before the end of each year, the Group assesses the balance in the pension fund. If
the amount of the balance in the pension fund is inadequate to pay retirement benefits for employees
who conform to retirement requirements in the next year, the Group is required to fund the difference in
one appropriation that should be made before the end of March of the next year. The pension fund is
managed by the Bureau of Labor Funds, Ministry of Labor (the “Bureau”); the Group has no right to
influence the investment policy and strategy.

- 53 -
The amounts included in the consolidated balance sheets in respect of the Group’s defined benefit plans
were as follows:
December 31
2019 2018
Present value of funded defined benefit obligation $ 18,457,304 $ 17,464,856
Fair value of plan assets (9,022,269) (8,661,474)
Deficit (net defined benefit liabilities) $ 9,435,035 $ 8,803,382
Movements in net defined benefit liabilities (assets) were as follows:
Present Value
of the Defined
Benefit
Obligation
Fair Value of
the Plan Assets
Net Defined
Benefit
Liabilities
(Assets)
Balance at January 1, 2018 $ 16,149,382 $ (8,047,817) $ 8,101,565
Service cost
Current service cost 1,384,213 - 1,384,213
Net interest expense (income) 163,283 (82,595) 80,688
Recognized in profit or loss 1,547,496 (82,595) 1,464,901
Remeasurement
Return on plan assets (excluding amounts
included in net interest) - (236,287) (236,287)
Actuarial (gain) loss - changes in
demographic assumptions 15,538 - 15,538
Actuarial (gain) loss - changes in financial
assumptions 344, 716 - 344, 716
Actuarial (gain) loss - experience
adjustments 727,899 - 727,899
Recognized in other comprehensive income 1,088,153 (236,287) 851,866
Contributions from the employer - (1,486,550) (1,486,550)
Benefits paid (1,210,839) 1,210,839 -
Others (109,336) (19,064) (128,400)
Balance at December 31, 2018 17,464,856 (8,661,474) 8,803,382
Current service cost 1,321,600 - 1,321,600
Net interest expense (income) 161,808 (86,234) 75,574
Recognized in profit or loss 1,483,408 (86,234) 1,397,174
Remeasurement
Return on plan assets (excluding amounts
included in net interest) - (308,223) (308,223)
Actuarial (gain) loss - changes in
demographic assumptions 15,959 - 15,959
Actuarial (gain) loss - changes in financial
assumptions 440,374 - 440,374
Actuarial (gain) loss - experience
adjustments 633,683 - 633,683
Recognized in other comprehensive income 1,090,016 (308,223) 781,793
Contributions from the employer - (1,418,970) (1,418,970)
Benefits paid (1,452,632) 1,452,632 -
Others (128,344) - (128,344)
Balance at December 31, 2019 $ 18,457,304 $ (9,022,269) $ 9,435,035
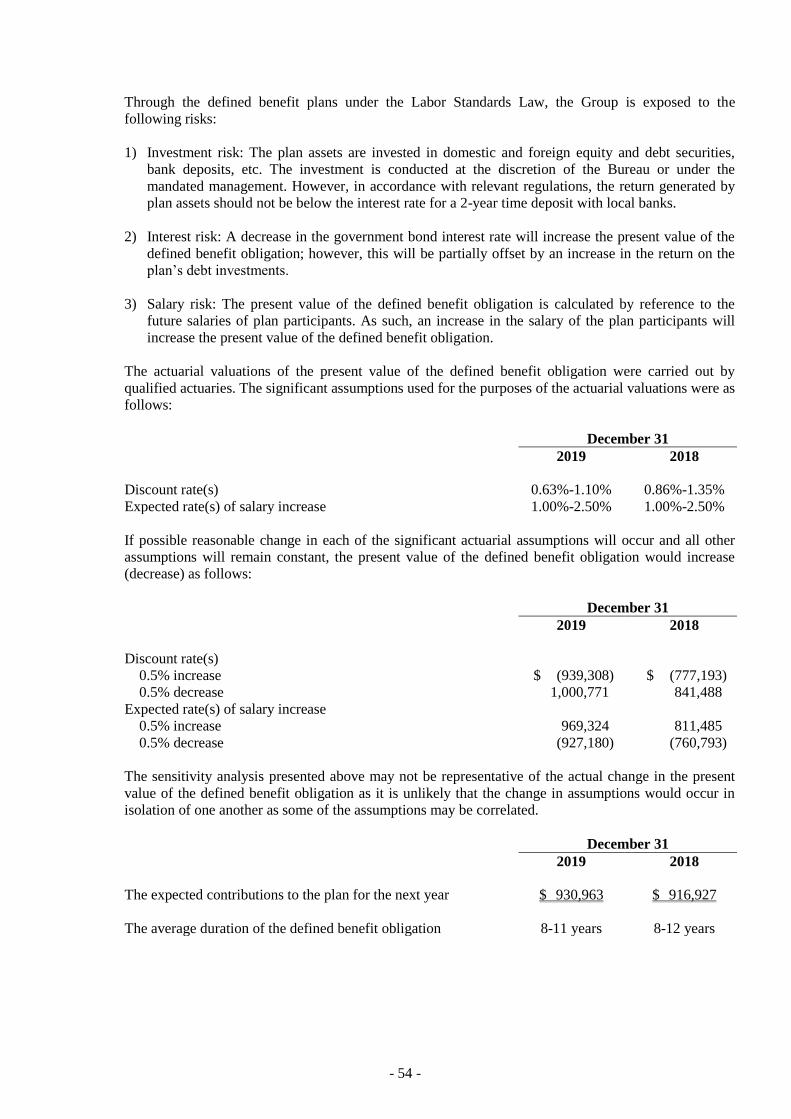
- 54 -
Through the defined benefit plans under the Labor Standards Law, the Group is exposed to the
following risks:
1) Investment risk: The plan assets are invested in domestic and foreign equity and debt securities,
bank deposits, etc. The investment is conducted at the discretion of the Bureau or under the
mandated management. However, in accordance with relevant regulations, the return generated by
plan assets should not be below the interest rate for a 2-year time deposit with local banks.
2) Interest risk: A decrease in the government bond interest rate will increase the present value of the
defined benefit obligation; however, this will be partially offset by an increase in the return on the
plan’s debt investments.
3) Salary risk: The present value of the defined benefit obligation is calculated by reference to the
future salaries of plan participants. As such, an increase in the salary of the plan participants will
increase the present value of the defined benefit obligation.
The actuarial valuations of the present value of the defined benefit obligation were carried out by
qualified actuaries. The significant assumptions used for the purposes of the actuarial valuations were as
follows:
December 31
2019 2018
Discount rate(s) 0.63%-1.10% 0.86%-1.35%
Expected rate(s) of salary increase 1.00%-2.50% 1.00%-2.50%
If possible reasonable change in each of the significant actuarial assumptions will occur and all other
assumptions will remain constant, the present value of the defined benefit obligation would increase
(decrease) as follows:
December 31
2019 2018
Discount rate(s)
0.5% increase $ (939,308) $ (777,193)
0.5% decrease 1,000,771 841,488
Expected rate(s) of salary increase
0.5% increase 969,324 811,485
0.5% decrease (927,180) (760,793)
The sensitivity analysis presented above may not be representative of the actual change in the present
value of the defined benefit obligation as it is unlikely that the change in assumptions would occur in
isolation of one another as some of the assumptions may be correlated.
December 31
2019 2018
The expected contributions to the plan for the next year $ 930,963 $ 916,927
The average duration of the defined benefit obligation 8-11 years 8-12 years
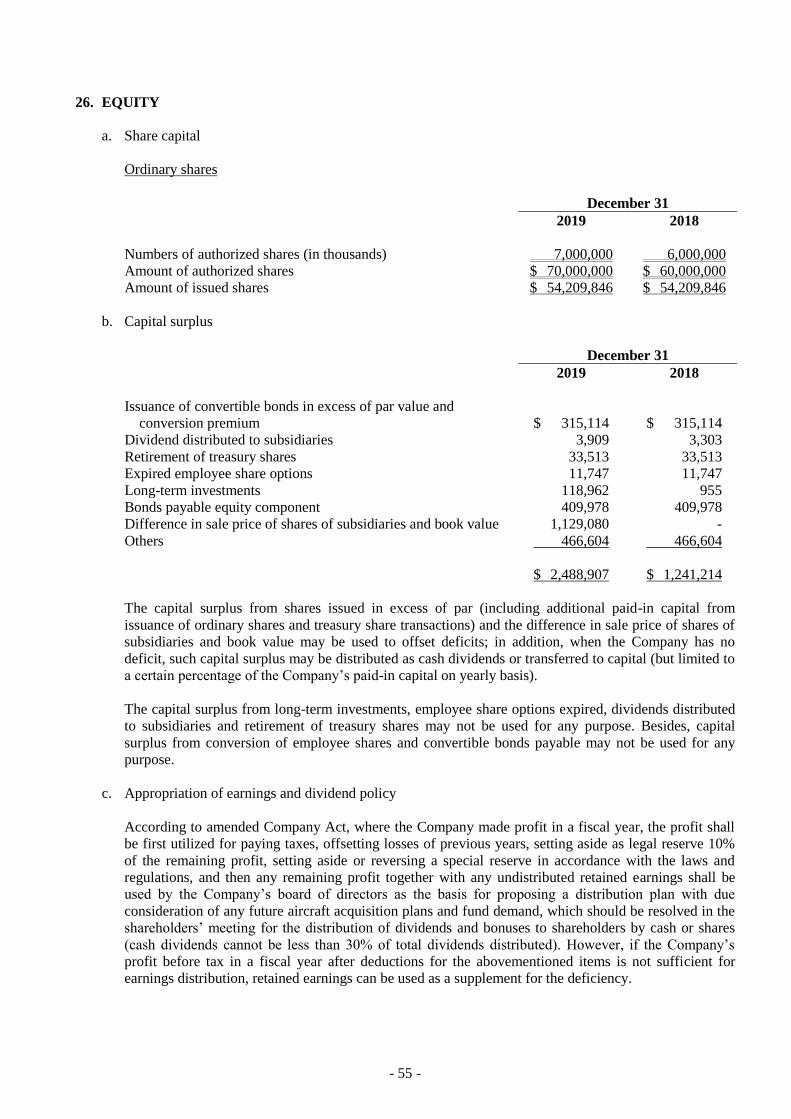
- 55 -
26. EQUITY
a. Share capital
Ordinary shares
December 31
2019 2018
Numbers of authorized shares (in thousands) 7,000,000 6,000,000
Amount of authorized shares $ 70,000,000 $ 60,000,000
Amount of issued shares $ 54,209,846 $ 54,209,846
b. Capital surplus
December 31
2019 2018
Issuance of convertible bonds in excess of par value and
conversion premium $ 315,114 $ 315,114
Dividend distributed to subsidiaries 3,909 3,303
Retirement of treasury shares 33,513 33,513
Expired employee share options 11,747 11,747
Long-term investments 118,962 955
Bonds payable equity component 409,978 409,978
Difference in sale price of shares of subsidiaries and book value 1,129,080 -
Others 466,604 466,604
$ 2,488,907 $ 1,241,214
The capital surplus from shares issued in excess of par (including additional paid-in capital from
issuance of ordinary shares and treasury share transactions) and the difference in sale price of shares of
subsidiaries and book value may be used to offset deficits; in addition, when the Company has no
deficit, such capital surplus may be distributed as cash dividends or transferred to capital (but limited to
a certain percentage of the Company’s paid-in capital on yearly basis).
The capital surplus from long-term investments, employee share options expired, dividends distributed
to subsidiaries and retirement of treasury shares may not be used for any purpose. Besides, capital
surplus from conversion of employee shares and convertible bonds payable may not be used for any
purpose.
c. Appropriation of earnings and dividend policy
According to amended Company Act, where the Company made profit in a fiscal year, the profit shall
be first utilized for paying taxes, offsetting losses of previous years, setting aside as legal reserve 10%
of the remaining profit, setting aside or reversing a special reserve in accordance with the laws and
regulations, and then any remaining profit together with any undistributed retained earnings shall be
used by the Company’s board of directors as the basis for proposing a distribution plan with due
consideration of any future aircraft acquisition plans and fund demand, which should be resolved in the
shareholders’ meeting for the distribution of dividends and bonuses to shareholders by cash or shares
(cash dividends cannot be less than 30% of total dividends distributed). However, if the Company’s
profit before tax in a fiscal year after deductions for the abovementioned items is not sufficient for
earnings distribution, retained earnings can be used as a supplement for the deficiency.

- 56 -
The Company shall set aside profits as a legal reserve untill the legal reserve amounts to the authorized
capital. The legal reserve could be used for making good the deficit of the Company. If the Company
has no deficit in a fiscal year, the Company can distribute all or part of the capital surplus by cash or
shares with due consideration of finance, marketing and management requirements in accordance with
the laws and regulations.
The distribution of dividends should be resolved and recognized in the shareholders’ meeting in the
following year.
1) Appropriation of earnings in 2017
The appropriation of earnings for 2017 was resolved in the shareholders’ meeting on June 27, 2018.
The appropriations and dividends per share were as follows:
Appropriation
of Earnings
Dividends Per
Share (NT$)
Legal reserve $ 145,831
Special reserve 118,810
Cash dividends 1,193,670 $0.2181820086
2) Appropriation of earnings in 2018
The appropriation of earnings for 2018 was resolved in the shareholders’ meeting on June 25, 2019.
The appropriation and dividends per share were as follows:
Appropriation
of Earnings
Dividends Per
Share (NT$)
Legal reserve $ 114,493
Cash dividends 1,136,278 $0.20960737
Company reversed special reserve of $105,843 thousand.
3) Offsetting deficits in 2019
On March 18, 2020, the board proposed to offset the accumulated deficit in 2019. The deficit
included a net loss of $1,199,798 thousand, negative adjustment of other retained earnings of
$577,427 thousand, the remaining amount of accumulated deficit was $1,777,225 thousand.
The offsetting of deficits for 2019 is subject to the resolution of the shareholders in the
shareholder’s meeting to be held on June 23, 2020.

- 57 -
d. Other equity items
The movement of other equity items is as follows:
Exchange
Differences on
Translating
Foreign
Operations
Unrealized
Gain (Loss) on
Available-for-
sale Financial
Assets
Unrealized
Gain (Loss) on
Financial
Assets at
FVTOCI
Cash Flow
Hedges
Gain (Loss) on
Hedging
Instruments Total
Balance at January 1,
2018 $ (34,986 ) $ 1,774 $ - $ (74,429 ) $ - $ (107,641 )
Adjustments on initial application of IFRS 9 - (1,774 ) 42,351 74,429 (74,429 ) 40,577
Balance at January 1,
2018 after IFRS 9 adjustments (34,986 ) - 42,351 - (74,429 ) (67,064 )
Exchange differences on
translating foreign
operations 29,897 - - - - 29,897
Cumulative loss on
changes in fair value of hedging instruments - - - - 77,435 77,435
Cumulative gain on
changes in fair value of hedging instruments
reclassified to profit or
loss - - - - 31,731 31,731 Unrealized gain on
financial assets at
FVTOCI - - 930 - - 930 Effect of change in tax
rate 1,198 - (1,209 ) - 2,530 2,519
Effects of income tax (5,773 ) - 547 - (24,117 ) (29,343 ) Other comprehensive
income (loss)
recognized in the period 25,322 - 268 - 87,579 113,169
Transfers of initial
carrying amount of hedged items - - - - 12,118 12,118
Balance at December 31, 2018 $ (9,664 ) $ - $ 42,619 $ - $ 25,268 $ 58,223
Balance at January 1, 2019 $ (9,664 ) $ - $ 42,619 $ - $ 25,268 $ 58,223
Exchange differences on
translating foreign operations (65,246 ) - - - - (65,246 )
Cumulative loss on changes in fair value of
hedging instruments - - - - 1,378,603 1,378,603
Cumulative gain on changes in fair value of
hedging instruments
reclassified to profit or loss - - - - 20,014 20,014
Unrealized gain on
financial assets at FVTOCI - - 79,392 - - 79,392
Effects of income tax 11,835 - (14,854 ) - (279,604 ) (282,623 )
Other comprehensive income (loss)
recognized in the
period (53,411 ) - 64,538 - 1,119,013 1,130,140 Disposal of subsidiaries 8,368 105 - 8,473
Transfers of initial
carrying amount of hedged items - - - - (603 ) (603 )
Balance at December 31, 2019 $ (54,707 ) $ - $ 107,262 $ - $ 1,143,678 $ 1,196,233

- 58 -
e. Non-controlling interests
For the Year Ended December 31
2019 2018
Beginning balance $ 2,965,512 $ 2,134,282
Net income attributable to non-controlling interests 524,796 482,323
Foreign exchange differences (7,706) (3,330)
Actuarial gains and losses on defined benefit plans (100,136) (69,654)
Cash flow hedge on changes in fair value of hedging instruments (13,227) (46)
Cumulative gain (loss) arising on changes in fair value of
hedging instruments reclassified to profit or loss 8,528 105
Effect on income tax 22,586 26,888
(89,955) (72,925)
Disposal of subsidiaries (24,957) -
Disposal of part equity of subsidiaries 619,387 -
Acquisition of non-controlling interests in subsidiaries - 565,963
Dividends paid by subsidiaries (416,438) (171,019)
Ending balance $ 3,578,345 $ 2,965,512
f. Treasury shares
Treasury shares are the Company’s shares held by its subsidiaries as of December 31, 2019 and 2018
were as follows:
(Shares in Thousands)
Purpose of Treasury Shares
Buy Back to
Write off
Company’s
Shares Held by
Its Subsidiaries Total
Number of shares, January 1, 2018 - 2,889 2,889
Addition during the year 50,000 - 50,000
Reduction during the year (50,000) - (50,000)
Number of shares, December 31, 2018 - 2,889 2,889
Number of shares, January 1, 2019 - 2,889 2,889
Addition during the year - - -
Reduction during the year - - -
Number of shares, December 31, 2019 - 2,889 2,889
Subsidiary
Shares
(In Thousands)
Carrying
Amount Market Value
December 31, 2019
Mandarin Airlines 2,075 $ 18,796 $ 18,796
Dynasty Aerotech International Corp. 814 7,376 7,376
$ 26,172 $ 26,172
(Continued)
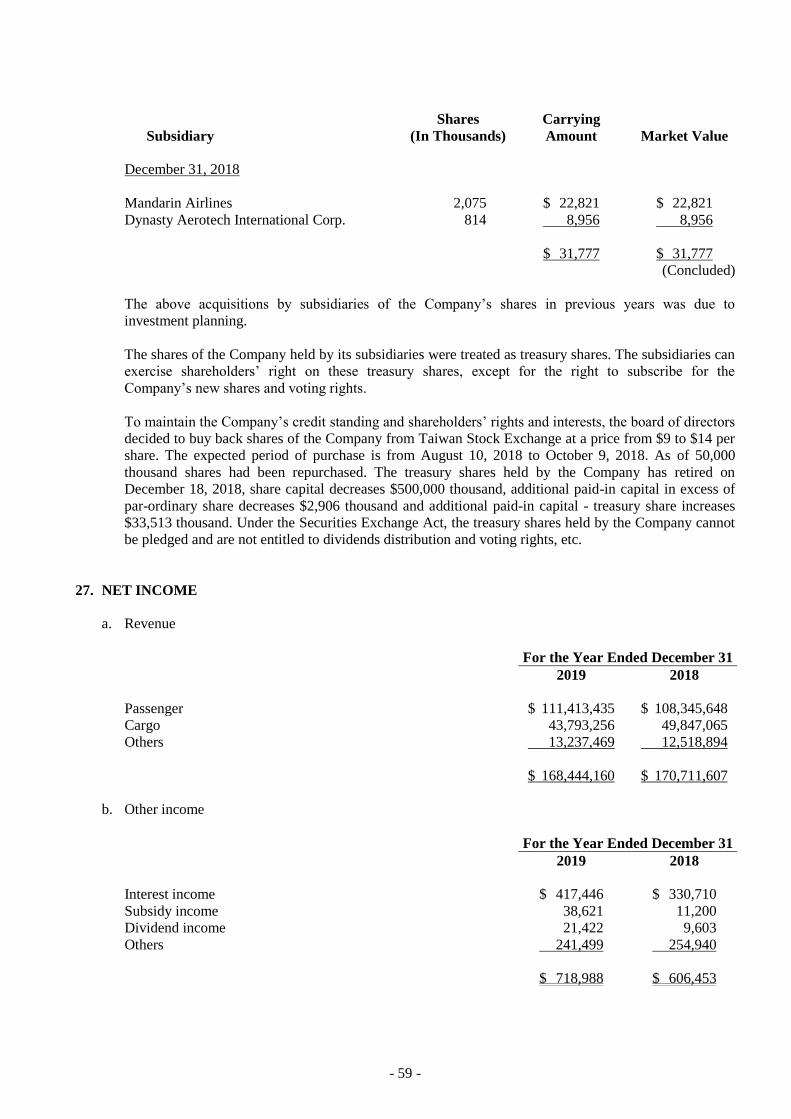
- 59 -
Subsidiary
Shares
(In Thousands)
Carrying
Amount Market Value
December 31, 2018
Mandarin Airlines 2,075 $ 22,821 $ 22,821
Dynasty Aerotech International Corp. 814 8,956 8,956
$ 31,777 $ 31,777
(Concluded)
The above acquisitions by subsidiaries of the Company’s shares in previous years was due to
investment planning.
The shares of the Company held by its subsidiaries were treated as treasury shares. The subsidiaries can
exercise shareholders’ right on these treasury shares, except for the right to subscribe for the
Company’s new shares and voting rights.
To maintain the Company’s credit standing and shareholders’ rights and interests, the board of directors
decided to buy back shares of the Company from Taiwan Stock Exchange at a price from $9 to $14 per
share. The expected period of purchase is from August 10, 2018 to October 9, 2018. As of 50,000
thousand shares had been repurchased. The treasury shares held by the Company has retired on
December 18, 2018, share capital decreases $500,000 thousand, additional paid-in capital in excess of
par-ordinary share decreases $2,906 thousand and additional paid-in capital - treasury share increases
$33,513 thousand. Under the Securities Exchange Act, the treasury shares held by the Company cannot
be pledged and are not entitled to dividends distribution and voting rights, etc.
27. NET INCOME
a. Revenue
For the Year Ended December 31
2019 2018
Passenger $ 111,413,435 $ 108,345,648
Cargo 43,793,256 49,847,065
Others 13,237,469 12,518,894
$ 168,444,160 $ 170,711,607
b. Other income
For the Year Ended December 31
2019 2018
Interest income $ 417,446 $ 330,710
Subsidy income 38,621 11,200
Dividend income 21,422 9,603
Others 241,499 254,940
$ 718,988 $ 606,453
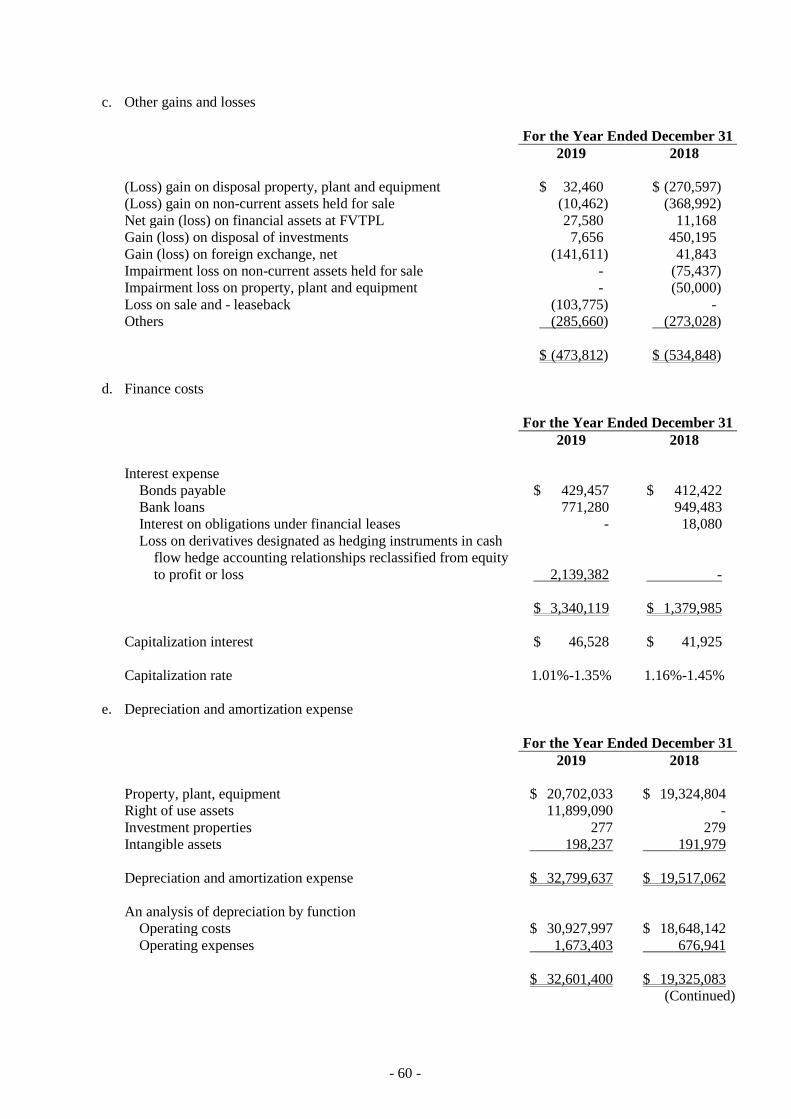
- 60 -
c. Other gains and losses
For the Year Ended December 31
2019 2018
(Loss) gain on disposal property, plant and equipment $ 32,460 $ (270,597)
(Loss) gain on non-current assets held for sale (10,462) (368,992)
Net gain (loss) on financial assets at FVTPL 27,580 11,168
Gain (loss) on disposal of investments 7,656 450,195
Gain (loss) on foreign exchange, net (141,611) 41,843
Impairment loss on non-current assets held for sale - (75,437)
Impairment loss on property, plant and equipment - (50,000)
Loss on sale and - leaseback (103,775) -
Others (285,660) (273,028)
$ (473,812) $ (534,848)
d. Finance costs
For the Year Ended December 31
2019 2018
Interest expense
Bonds payable $ 429,457 $ 412,422
Bank loans 771,280 949,483
Interest on obligations under financial leases - 18,080
Loss on derivatives designated as hedging instruments in cash
flow hedge accounting relationships reclassified from equity
to profit or loss 2,139,382 -
$ 3,340,119 $ 1,379,985
Capitalization interest $ 46,528 $ 41,925
Capitalization rate 1.01%-1.35% 1.16%-1.45%
e. Depreciation and amortization expense
For the Year Ended December 31
2019 2018
Property, plant, equipment $ 20,702,033 $ 19,324,804
Right of use assets 11,899,090 -
Investment properties 277 279
Intangible assets 198,237 191,979
Depreciation and amortization expense $ 32,799,637 $ 19,517,062
An analysis of depreciation by function
Operating costs $ 30,927,997 $ 18,648,142
Operating expenses 1,673,403 676,941
$ 32,601,400 $ 19,325,083
(Continued)

- 61 -
For the Year Ended December 31
2019 2018
An analysis of amortization by function
Operating costs $ 12,380 $ 10,597
Operating expenses 185,857 181,382
$ 198,237 $ 191,979
(Concluded)
f. Employee benefits expense
For the Year Ended December 31
2019 2018
Post-employment benefits
Defined contribution plan $ 574,809 $ 538,915
Defined benefit plan 1,397,174 1,464,901
$ 1,971,983 $ 2,003,816
Other employee benefits
Salary expenses $ 20,813,757 $ 20,910,604
Personnel service expenses 5,506,867 5,791,627
$ 26,320,624 $ 26,702,231
An analysis of employee benefits expense by function
Operating costs $ 23,699,685 $ 23,857,265
Operating expenses 4,592,922 4,848,782
$ 28,292,607 $ 28,706,047
According to the Company’s articles, the Company accrued employees’ compensation at rates of no
less than 3% of the net profit before income tax and employees’ compensation, and accrued profit
bonus at a certain rate of profit before tax on the basis of the collective agreement signed with the China
Airlines Employees Union. The employees’ compensation and profit bonus for the year ended
December 31, 2018 was $51,656 thousand and $594,810 thousand. For the year ended December 31,
2019, the Company has experienced a deficit, and therefore, no employee’s compensation is estimated.
Material differences between such estimated amounts and the amounts proposed by the board of
directors on or before the date that the annual consolidated financial statements are authorized for issue
are adjusted in the year that the bonuses and remuneration were recognized. If there is a change in the
proposed amounts after the annual consolidated financial statements were authorized for issue, the
differences are recorded as a change in the accounting estimate.
Information on the employees’ compensation and remuneration of directors and supervisors resolved by
the Company’s board of directors in 2019 and 2018 is available on the Market Observation Post System
website of the Taiwan Stock Exchange.

- 62 -
28. INCOME TAX
a. Income tax expense recognized in profit or loss
The major components of tax expense were as follows:
For the Year Ended December 31
2019 2018
Current tax
Current year $ 523,670 $ 264,527
Prior year adjustment (5,546) 10,592
Income tax on unappropriated earnings 378 35
Deferred tax
Current year 35,149 1,465,482
Adjustments to deferred tax attributable to changes in tax rates
and laws 24,534 1,861
Effect of income tax - (933,932)
Income tax expense recognized in profit or loss
$ 578,185 $ 808,565
A reconciliation of accounting profit and income tax expense is as follows:
For the Year Ended December 31
2019 2018
Profit before tax $ (96,817) $ 3,081,249
Income tax expense calculated at the statutory rate (% for 2019,
20% for 2018) $ (19,362) $ 616,250
Effect on different tax of subsidiaries govern by other region 1,680 7,391
Effect on adjustment to income tax
Non-deductible expenses in determining taxable income 16,936 20,662
Tax-exempt income (45,861) (25,730)
Income tax on unappropriated earnings (5%) 378 35
Income basic tax 8,468 -
Oversea income tax expense 11,157 22,786
Unrecognized loss carryforwards, investment tax credits and
temporary difference 586,135 1,088,650
Adjustments for prior years’ tax (5,546) 10,592
Adjustments to deferred tax attributable to changes in tax rates
and laws 24,534 1,861
Adjustments to changes in tax rates and laws - (933,932)
Other (334) -
Income tax expense recognized in profit or loss $ 578,185 $ 808,565
The Income Tax Law of the ROC was amended and, starting from 2018, the corporate income tax rate
was adjusted from 17% to 20%. In addition, the rate of the corporate surtax applicable to
unappropriated earnings was reduced from 10% to 5%.

- 63 -
b. Income tax recognized in other comprehensive income
2019 2018
Deferred tax
Recognized in other comprehensive income
Translation of foreign operations $ 13,454 $ (4,657)
Fair value changes of financial assets at FVTOCI (14,854) 547
Hedging instruments fair value revaluation for cash flow
hedging (278,664) (24,128)
Actuarial gain or loss on defined benefit plan 156,359 187,368
Effect of income tax - 10,893
Total income tax recognized in other comprehensive income $ (123,705) $ 170,023
c. Deferred tax assets and liabilities
For the year ended December 31, 2019
Beginning
Balance
Recognized in
Profit or Loss
Recognized in
Other
Comprehensive
Income
Exchange
Difference
Ending
Balance
Deferred tax assets
Temporary differences Defined benefit plans $ 1,765,052 $ (29,560 ) $ 156,359 $ - $ 1,891,851
Frequent flyer programs 510,060 82,917 - - 592,977
Maintenance reserves 1,811,848 428,155 - - 2,240,003 Allowance for reduction of inventory 335,711 (38,854 ) - - 296,857
Others 729,399 (429,580 ) 15,113 1,006 315,938
$ 5,152,070 $ 13,078 $ 171,472 $ 1,006 $ 5,337,626
Deferred tax liabilities
Temporary differences
Unrealized foreign exchange gains $ 17 $ 81,760 $ - $ - $ 81,777 Others (Note) 188,430 (8,999 ) 295,177 757 475,365
$ 188,447 $ 72,761 $ 295,177 $ 757 $ 557,142

- 64 -
For the year ended December 31, 2018
Beginning
Balance
Recognized in
Profit or Loss
Recognized in
Other
Comprehensive
Income
Exchange
Difference
Acquisition
Consolidated
Ending
Balance
Deferred tax assets
Temporary differences
Defined benefit plans $ 1,381,538 $ 180,560 $ 195,742 $ - $ 7,212 $ 1,765,052
Frequent flyer programs 426,106 83,954 - - - 510,060
Maintenance reserves 1,507,285 304,563 - - - 1,811,848
Allowance for reduction of
inventory 239,115 96,596 - - 335,711
Others 1,143,871 (397,832 ) (18,546 ) 479 1,427 729,399 Loss carryforwards 821,417 (821,417 ) - - - -
$ 5,519,332 $ (553,576 ) $ 177,196 $ 479 $ 8,639 $ 5,152,070
Deferred tax liabilities
Temporary differences
Unrealized foreign exchange gains $ 915 $ (898 ) $ - $ - $ - $ 17
Depreciation difference
from fixed assets 31,010 (31,010 ) - - - - Others (Note) 165,630 11,743 7,173 3,884 - 188,430
$ 197,555 $ (20,165 ) $ 7,173 $ 3,884 $ - $ 188,447
Note: Included adjustments on initial application due to tax rate changes $6,873 thousand from
IFRS 9.
Deductible temporary differences, and unused loss carryforwards for which no deferred tax assets have
been recognized in the consolidated balance sheets.
December 31
2019 2018
Loss carryforwards
2019 $ - $ 11,790,770
2021 2,899,496 2,899,496
2022 619,799 620,769
2025 18,124 18,124
2026 546,899 818,198
2027 68,415 68,415
2028 1,706,913 1,513,001
2029 955,250 -
$ 6,814,896 $ 17,728,773
Difference in depreciation $ 1,348,096 $ 90,350

- 65 -
d. Unused tax loss carryforwards as of December 31, 2019 were as follows:
Expiry Year
Unused
Amount
China Airlines, Ltd.
2021 $ 2,899,496
2022 619,799
2026 202,699
2028 1,519,941
2029 760,157
$ 6,002,092
Mandarin Airline Co., Ltd.
2026 $ 312,724
2028 83,821
$ 396,545
Taiwan Aircraft Maintenance And Engineering Co., Ltd.
2025 $ 18,124
2026 31,476
2027 68,415
2028 103,151
2029 195,093
$ 416,259
e. Income tax assessment
The income tax returns for 2017 of the Company and its subsidiaries have been examined by the tax
authorities.
29. EARNING PER SHARE
The numerators and denominators used in calculating earnings per share were as follows:
For the Year Ended December 31
2019 2018
Basic earnings per share $ (0.22) $ 0.33
Diluted earnings per share $ (0.22) $ 0.32
Earnings used in the computation of basic earnings per share $ (1,199,798) $ 1,790,361
Effect of potentially dilutive ordinary shares:
Interest on convertible bonds (after tax) - 81,463
Earnings used in the computation of diluted earnings per share $ (1,199,798) $ 1,871,824
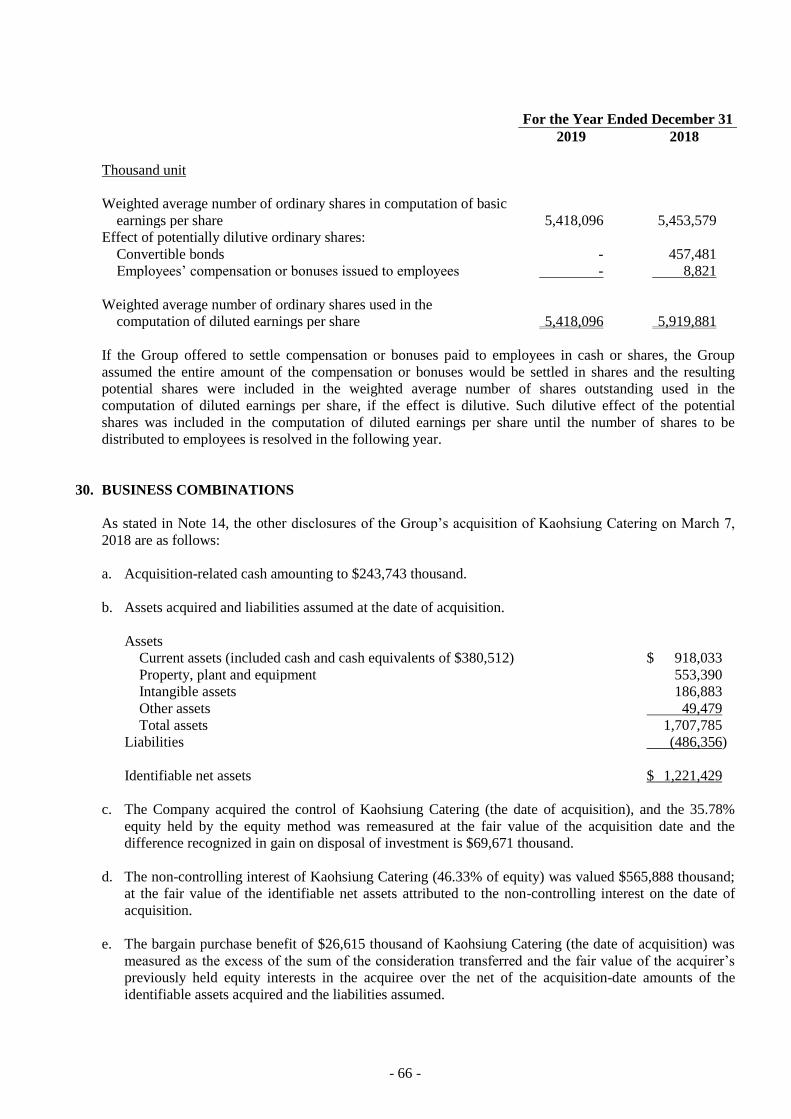
- 66 -
For the Year Ended December 31
2019 2018
Thousand unit
Weighted average number of ordinary shares in computation of basic
earnings per share 5,418,096 5,453,579
Effect of potentially dilutive ordinary shares:
Convertible bonds - 457,481
Employees’ compensation or bonuses issued to employees - 8,821
Weighted average number of ordinary shares used in the
computation of diluted earnings per share 5,418,096 5,919,881
If the Group offered to settle compensation or bonuses paid to employees in cash or shares, the Group
assumed the entire amount of the compensation or bonuses would be settled in shares and the resulting
potential shares were included in the weighted average number of shares outstanding used in the
computation of diluted earnings per share, if the effect is dilutive. Such dilutive effect of the potential
shares was included in the computation of diluted earnings per share until the number of shares to be
distributed to employees is resolved in the following year.
30. BUSINESS COMBINATIONS
As stated in Note 14, the other disclosures of the Group’s acquisition of Kaohsiung Catering on March 7,
2018 are as follows:
a. Acquisition-related cash amounting to $243,743 thousand.
b. Assets acquired and liabilities assumed at the date of acquisition.
Assets
Current assets (included cash and cash equivalents of $380,512) $ 918,033
Property, plant and equipment 553,390
Intangible assets 186,883
Other assets 49,479
Total assets 1,707,785
Liabilities (486,356)
Identifiable net assets $ 1,221,429
c. The Company acquired the control of Kaohsiung Catering (the date of acquisition), and the 35.78%
equity held by the equity method was remeasured at the fair value of the acquisition date and the
difference recognized in gain on disposal of investment is $69,671 thousand.
d. The non-controlling interest of Kaohsiung Catering (46.33% of equity) was valued $565,888 thousand;
at the fair value of the identifiable net assets attributed to the non-controlling interest on the date of
acquisition.
e. The bargain purchase benefit of $26,615 thousand of Kaohsiung Catering (the date of acquisition) was
measured as the excess of the sum of the consideration transferred and the fair value of the acquirer’s
previously held equity interests in the acquiree over the net of the acquisition-date amounts of the
identifiable assets acquired and the liabilities assumed.

- 67 -
f. Impact of acquisitions of the Group
From the acquisition date, the operating results from the acquired Company, which are included in the
consolidated statements of comprehensive income, are as follows:
Kaohsiung
Catering
Revenue $ 1,823,950
Profit $ 229,665
Had these business combinations been in effect at the beginning of the annual reporting period, the
Group’s revenue from continuing operations would have been $171,039,102 thousand and the profit
from continuing operations would have been $2,310,159 thousand. This pro-forma information is for
illustrative purposes only and is not necessarily an indication of the revenue and results of operations of
the Group that actually would have been achieved had the acquisition been completed on January 1,
2018, nor is it intended to be a projection of future results.
31. DISPOSAL OF SUBSIDIARIES
On January 21, 2019, the board of directors of the Company decided to sell part of Dynasty Holidays to
H.I.S. Taiwan Co., Ltd. for disposal price of $34,036 thousand and a disposition of $7,656 thousand. After
the disposal, the proportion of ownership decrease from 51% to 20%, loss control to the subsidiary.
a. Consideration received from disposals
Consideration received in cash and cash equivalents $ 34,036
b. Analysis of assets and liabilities on the date control was lost
Current assets
Cash and cash equivalents $ 51,449
Other current assets 47,510
Non-current assets 17,035
Current liabilities (49,742)
Non-current liabilities (15,318)
Net assets disposed of $ 50,934
c. Gain on disposals of subsidiaries
Consideration received $ 34,036
Net assets disposed of (50,934)
Fair value of equity 10,187
Non-controlling interests 24,957
Reclassification of other comprehensive income in respect of subsidiaries (10,590)
Gain on disposal $ 7,656
d. Net cash inflow on disposal of subsidiaries
Consideration received in cash and cash equivalents $ 34,036
Less: Cash and cash equivalent balances disposed of (51,449)
$ (17,413)
- 68 -
32. CAPITAL MANAGEMENT
The Group manages its capital to ensure that entities in the Group will be able to continue as going
concerns while maximizing the return to stakeholders through the optimization of the debt and equity
balance. The capital structure of the Group consists of net debt (borrowings offset by cash and cash
equivalents) and equity of the Group comprising issued capital, reserves, retained earnings, other equity and
non-controlling interests.
To support its operating activities and purchase of aircraft, the Group needs to maintain sufficient capital.
Therefore, the goal of capital management is to ensure financial resources and operating plan is able to
support the future working capital, capital expenditures, debt repayment and dividend expenses and other
needs.
33. FINANCIAL INSTRUMENTS
a. Fair values of financial instruments
1) Financial instruments not evaluated at fair value
Except as detailed in the following table, the management considers the carrying amounts of
financial assets and financial liabilities recognized in the financial statements as approximating their
fair values.
December 31
2019 2018
Carrying
Amount Fair Value
Carrying
Amount Fair Value
Financial liabilities
Bonds payable $ 32,052,625 $ 32,062,874 $ 33,919,610 $ 31,651,865
Loans and debt 67,663,783 67,663,783 76,395,635 74,404,225
Some long-term borrowings and capital lease obligations are floating-rate financial liabilities, so
their carrying amounts are their fair values. As of December 31, 2019 and 2018, the fair values of
long-term borrowings and private bonds with fixed interest rates are estimated at the present value
of expected cash flows discounted at rates of 0.67% and 0.68%, respectively, prevailing in the
market for long-term borrowings (Level 2). Fair values of bond payable trading in OTC and based
on quoted market prices (Level 1).
2) Fair value measurements recognized in the balance sheets
The following table provides an analysis of financial instruments that are measured subsequent to
initial recognition at fair value, grouped into Levels 1 to 3 based on the degree to which the fair
value is observable:
a) Level 1 fair value measurements are those derived from quoted prices (unadjusted) in active
markets for identical assets or liabilities;
b) Level 2 fair value measurements are those derived from inputs other than quoted prices included
within Level 1 that are observable for the asset or liability, either directly (i.e. as prices) or
indirectly (i.e. derived from prices); and
- 69 -
c) Level 3 fair value measurements are those derived from valuation techniques that include inputs
for the asset or liability that are not based on observable market data (unobservable inputs).
December 31, 2019
Level 1 Level 2 Level 3 Total
Financial assets at
FVTPL
Domestic money
market funds $ 511,758 $ - $ - $ 511,758
Foreign exchange
agreement - 434 - 434
$ 511,758 $ 434 $ - $ 512,192
Financial assets at
FVTOCI
Investments in equity
instruments
United shares -
domestic $ - $ - $ 26,865 $ 26,865
Unlisted shares -
foreign - - 182,356 182,356
$ - $ - $ 209,221 $ 209,221
Financial liabilities at
FVTPL
Derivative
instruments $ - $ 11,749 $ - $ 11,749
Financial assets for
hedging $ - $ 147 $ 9,479 $ 9,626
Financial liabilities for
hedging $ 50,997,687 $ 37,069 $ 3,955 $ 51,038,711
December 31, 2018
Level 1 Level 2 Level 3 Total
Financial assets at
FVTPL
Domestic money
market funds $ 206,001 $ - $ - $ 206,001
(Continued)
- 70 -
Level 1 Level 2 Level 3 Total
Financial assets at
FVTOCI
Investments in equity
instruments
United shares -
domestic $ - $ - $ 21,746 $ 21,746
Unlisted shares -
foreign - - 110,445 110,445
$ - $ - $ 132,191 $ 132,191
Financial liabilities at
FVTPL
Derivative
instruments $ - $ 221 $ - $ 221
Financial assets for
hedging $ - $ 28,005 $ 4,901 $ 32,906
Financial liabilities for
hedging $ - $ 560 $ - $ 560
(Concluded)
There were no transfers between Levels 1 and 2 in the current periods.
d) Valuation techniques and inputs applied for Level 2 fair value measurement
Financial Instruments Valuation Techniques and Inputs
Derivatives - foreign exchange
forward contracts and
interest rate swaps
Discounted cash flows.
Future cash flows are estimated based on observable forward
exchange rates at the end of the reporting period and
contract forward rates, discounted at a rate that reflects the
credit risk of various counterparties.
e) Valuation techniques and inputs applied for Level 3 fair value measurement
The fair values of foreign exchanges and fuel options are determined using option pricing
models where the significant unobservable inputs are implied fluctuation. Changes in the
implied fluctuations used in isolation would result in an increase or decrease in the fair value of
the foreign exchange forward contracts and fuel options.
The domestic unlisted equity investment is based on the comparative company valuation to
estimate the fair value. The main assumptions are based on the multiplier of the market price of
the comparable listed company and the net value per share, which have considered the liquidity
discount. The higher the multiplier or the lower the liquidity discount, the higher the fair value
of the relevant financial instruments.

- 71 -
The movements of Level 3 financial instruments are as follows:
Multiplicator
Liquidity
Discount
December 31, 2019 0.75-13.23 80%
December 31, 2018 0.74-15.29 80%
Derivative
Instruments
Equity
Instruments
Balance at January 1, 2019 $ 4,901 $ 132,191
Recognized in other comprehensive income 623 77,030
Balance at December 31, 2019 $ 5,524 $ 209,221
Balance at January 1, 2018 $ - $ 84,075
Adjustments on initial application of IFRS 9 - 47,510
Other comprehensive income recognized during the
period 4,901 606
Balance at December 31, 2018 $ 4,901 $ 132,191
Because some financial instruments and nonfinancial instruments may not have their fair values
disclosed, the total fair value disclosed herein is not the total value of the Group’s collective
instruments.
b. Categories of financial instruments
December 31
2019 2018
Financial assets
Financial assets at FVTPL $ 512,192 $ 206,001
Financial assets for hedging 9,626 32,906
Financial assets at amortized cost (Note 1) 41,479,556 40,496,618
Financial assets at FVTPCI - equity instrument investment 209,221 132,191
Financial liabilities
Financial liabilities at FVTPL 11,749 221
Financial liabilities for hedging 51,038,711 560
Financial liabilities at amortized cost (Note 2) 134,240,993 127,271,892
Note 1: The balances include loans and receivables measured at amortized cost, which comprise cash
and cash equivalents, notes and accounts receivable, accounts receivable - related parties,
other receivables, refundable deposits, other financial assets and other restricted financial
assets.
Note 2: The balances include financial liabilities measured at amortized cost, which comprise
short-term debts, short-term notes payable, notes and accounts payable, accounts payable -
related parties, other payables, bonds payable, long-term loans, lease liabilities payable, lease
liabilities, provisions, part of other current liabilities, part of other non-current liabilities and
guarantee deposits.
- 72 -
c. Financial risk management objectives and policies
The Group has risk management and hedging strategies to respond to changes in the economic and
financial environment and in the fuel market. To reduce the financial risks from changes in interest
rates, in exchange rates and in fuel prices, the Group has its operating costs stay within a specified
range by using appropriate financial hedging instruments and hedging percentages in accordance with
the “Processing Program of Derivative Financial Instrument Transactions” approved by the Group
shareholders to reduce the impact of market price changes on earnings. These risks include market risk
(including foreign currency risk, interest rate risk and other price risk), credit risk and liquidity risk.
In addition, the Group has a risk management committee, which meets periodically to evaluate the
performance of derivative instruments and determine the appropriate hedging percentage. This
committee informs the Group of global economic and financial conditions, controls the entire financial
risk resulting from changes in the financial environment and fuel prices, and develops the strategy and
response to avoid financial risk with the assistance of financial risk experts to effect risk management.
1) Market risk
The Group is primarily exposed to the financial risks of changes in foreign currency exchange rates
and interest rates. The Group entered into derivative financial instruments to manage its exposure to
foreign currency risk and interest rate risk. The Group enters into foreign exchange forward
contracts, foreign currency option contracts, and interest swap contracts with fair values that are
highly negatively correlated to the fair values of hedged items and evaluates the hedging
effectiveness of these instruments periodically.
a) Foreign currency risk
The Group enters into foreign currency option contracts to hedge against the risks on change in
related exchange rates, enters into forward contracts to hedge against the risks on changes in
foreign-currency assets, liabilities and commitments in the related exchange rates.
Sensitivity analysis
The Group was mainly exposed to the US dollar.
The following details the Group’s sensitivity to a one dollar increase or decrease in the New
Taiwan dollar (the functional currency) against the relevant foreign currencies (i.e. the US
dollar). This is the sensitivity rate used when reporting foreign currency risk internally to key
management personnel and represents management’s assessment of the reasonably possible
change in foreign exchange rates. The sensitivity analysis included only outstanding foreign
currency denominated monetary items and foreign currency forward contracts designated as
cash flow hedges and adjusts their translation at the end of the reporting period for a one US
dollars increase/decrease against the New Taiwan dollar.
When New Taiwan dollars increase one dollar against U.S. dollars and all other variables were
held constant, there would be a increase in pre-tax profit and increase in pre-tax other
comprehensive income gain and losses for the year ended December 31, 2019 of $105,266
thousand and $1,612,256 thousand and a decrease in pre-tax profit and decrease in pre-tax other
comprehensive income gain and loss for the year ended December 31, 2018 of $91,397
thousand and $13,620 thousand, respectively.
The Group’s hedging strategy is to enter into foreign exchange forward contracts to avoid
exchange rate exposure of its foreign currency denominated receipts and payments and to
manage exchange rate exposure of its aircraft prepayments in the next year. Those transactions
are designated as cash flow hedges. When forecasted purchases actually take place, basis
adjustments are made to the initial carrying amounts of hedged items.

- 73 -
For the hedges of highly probable aircraft prepayments, as the critical terms (i.e. the notional
amount, useful life and underlying asset) of the foreign exchange forward contracts and their
corresponding hedged items are the same, the Group performs a qualitative assessment of the
effectiveness, and it is expected that the value of the foreign exchange forward contracts and the
value of the corresponding hedged items will systematically change in the opposite direction in
response to movements in the underlying exchange rates.
The following table summarizes the information relating to the hedges of foreign currency risk.
December 31, 2019
Notional Line Item in Carrying Amount
Hedging Instruments Currency Amount Maturity Forward Rate Balance Sheet Asset Liability
Cash flow hedge
Aircraft rentals -
forward exchange
contracts
NTD/USD NTD509,507/
USD16,967
2020.1.21-
2020.12.24
29.5-30.8 Financial assets for
hedging - current/
liabilities for hedging -
current
$ 38 $ 8,491
Aviation fuel - forward
exchange contracts
NTD/USD NTD660,661/
USD22,000
2020.2.27-
2020.11.30
29.7-30.7 Financial assets for
hedging - current/
liabilities for hedging -
current
32 10,193
Aircraft prepayments-
forward exchange
contracts
NTD/USD NTD1,411,411/
USD47,000
2020.11.4 29.6-30.5 Financial assets for
hedging - current/
liabilities for hedging -
current
77 18,385
The abovementioned hedging instruments continue to be applied to hedging accounting. The
book value of other equity which belongs to each hedging item (aircraft rentals in U.S. dollars,
aviation fuel and aircraft prepayments) are $(8,453) thousand, $(10,161) thousand and
$(18,308) thousand, respectively.
December 31, 2018
Notional Line Item in Carrying Amount
Hedging Instruments Currency Amount Maturity Forward Rate Balance Sheet Asset Liability
Cash flow hedge
Aircraft rentals -
forward exchange
contracts
NTD/USD NTD2,265,231/
USD13,620
2019.1.7-
2019.12.26
28.3-30.9 Financial assets for
hedging/liabilities for
hedging
$ 28,005 $ 560
The above mentioned hedging instruments continue to be applied to hedging accounting. The
book value of other equity which belongs to each hedging item (aircraft rentals in U.S. dollars
and Aircraft prepayment) are $27,445 thousand.
For the year ended December 31, 2019
Comprehensive Income
Hedging Gain
(Loss)
Recognized in
Other
Comprehensive
Income
Amount
Reclassified to
Profit and Loss
and the
Adjusted Line
Item
Cash flow hedge
Aircraft rentals $ (35,897) $ 9,137 (Note)
Aviation fuel (10,161) (53)
Aircraft prepayments (17,705) -
$ (63,763) $ 9,084
Note: Increase in operating costs or exchange loss.
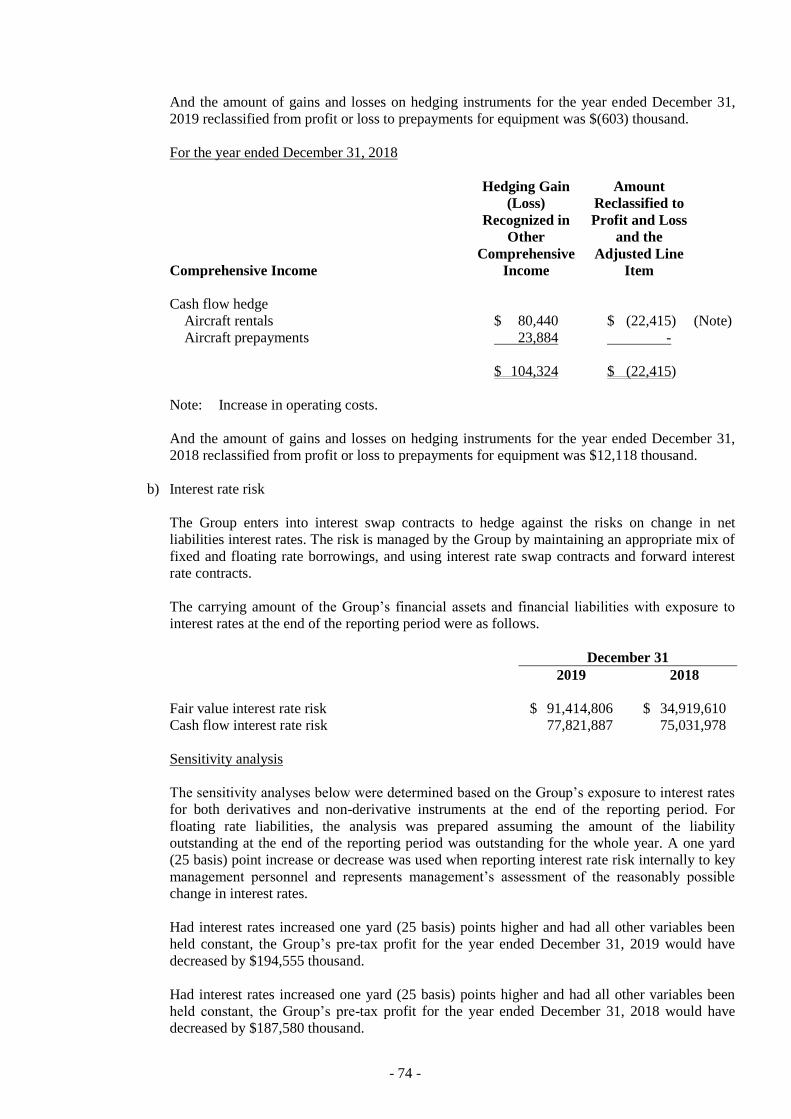
- 74 -
And the amount of gains and losses on hedging instruments for the year ended December 31,
2019 reclassified from profit or loss to prepayments for equipment was $(603) thousand.
For the year ended December 31, 2018
Comprehensive Income
Hedging Gain
(Loss)
Recognized in
Other
Comprehensive
Income
Amount
Reclassified to
Profit and Loss
and the
Adjusted Line
Item
Cash flow hedge
Aircraft rentals $ 80,440 $ (22,415) (Note)
Aircraft prepayments 23,884 -
$ 104,324 $ (22,415)
Note: Increase in operating costs.
And the amount of gains and losses on hedging instruments for the year ended December 31,
2018 reclassified from profit or loss to prepayments for equipment was $12,118 thousand.
b) Interest rate risk
The Group enters into interest swap contracts to hedge against the risks on change in net
liabilities interest rates. The risk is managed by the Group by maintaining an appropriate mix of
fixed and floating rate borrowings, and using interest rate swap contracts and forward interest
rate contracts.
The carrying amount of the Group’s financial assets and financial liabilities with exposure to
interest rates at the end of the reporting period were as follows.
December 31
2019 2018
Fair value interest rate risk $ 91,414,806 $ 34,919,610
Cash flow interest rate risk 77,821,887 75,031,978
Sensitivity analysis
The sensitivity analyses below were determined based on the Group’s exposure to interest rates
for both derivatives and non-derivative instruments at the end of the reporting period. For
floating rate liabilities, the analysis was prepared assuming the amount of the liability
outstanding at the end of the reporting period was outstanding for the whole year. A one yard
(25 basis) point increase or decrease was used when reporting interest rate risk internally to key
management personnel and represents management’s assessment of the reasonably possible
change in interest rates.
Had interest rates increased one yard (25 basis) points higher and had all other variables been
held constant, the Group’s pre-tax profit for the year ended December 31, 2019 would have
decreased by $194,555 thousand.
Had interest rates increased one yard (25 basis) points higher and had all other variables been
held constant, the Group’s pre-tax profit for the year ended December 31, 2018 would have
decreased by $187,580 thousand.

- 75 -
c) Other price risk
The Group was exposed to fuel price risk on its purchase of aviation fuel. The Group enters into
fuel swap contracts to hedge against adverse risks on fuel price changes.
December 31, 2019
Notional Line Item in Carrying Amount
Hedging Instrument Currency Amount Maturity Forward Rate Balance Sheet Asset Liability
Cash flow hedges -
fuel options USD NT$5,524 2020.3.31-
2020.12.31
US$49.65-
US$80.75
Financial assets for
hedging
$ 9,479 $ 3,955
Hedge accounting is continued to be applied to the abovementioned hedging instruments
continue to be applied to hedging accounting. The carrying amount of other equity which
belongs to each hedging item (fuel payments) is $5,524 thousand.
December 31, 2018
Notional Line Item in Carrying Amount
Hedging Instrument Currency Amount Maturity Forward Rate Balance Sheet Asset Liability
Cash flow hedges -
fuel options USD NT$4,901 2019.1.31-
2019.12.31
US$72-US$88 Financial assets for
hedging
$ 4,901 $ -
Hedge accounting is continued to be applied to the abovementioned hedging instruments
continue to be applied to hedging accounting. The carrying amount of other equity which
belongs to each hedging item (fuel payments) is $4,901 thousand.
For the year ended December 31, 2019
Comprehensive Income
Hedging Gain
(Loss)
Recognized in
Other
Comprehensive
Income
Amount
Reclassified to
Profit and Loss
and the
Adjusted Line
Item
Cash flow hedges - fuel options $ 623 $ (13,597) (Note)
Note: Increase in operating costs.
For the year ended December 31, 2018
Comprehensive Income
Hedging Gain
(Loss)
Recognized in
Other
Comprehensive
Income
Amount
Reclassified to
Profit and Loss
and the
Adjusted Line
Item
Cash flow hedges - fuel options $ 4,901 $ (9,421) (Note)
Note: Increase in operating costs.

- 76 -
Sensitivity analysis
The sensitivity analysis below was determined based on the exposure to fuel price risks at the
end of the reporting period.
For the Year Ended December 31
2019 2018
Pre-tax Profit
Increase
(Decrease)
Other
Compre-
hensive
Income
Increase
(Decrease)
Pre-tax Profit
Increase
(Decrease)
Other
Compre-
hensive
Income
Increase
(Decrease)
Fuel price increase of
5% $ - $ 7,973 $ - $ -
Fuel price decrease of
5% - - - -
2) Credit risk
Credit risk refers to the risk that a counterparty will default on its contractual obligations resulting
in financial loss to the Group. The Group’s credit risk, primarily comes from accounts receivable
generated from operating activities and bank deposits generated from investing activities, fixed
investment income and other financial instruments, operation related credit risk and financial credit
risk are managed separately.
Operation - related credit risk
The Group has established procedures to management operations related credit risk to maintain the
quality of accounts receivable.
To assess individual customers, the Group consider into the financial condition of the customers,
the credit rating agency rating, the Group’s internal credit rating, transaction history and current
economic conditions and many other factors that may affect the repayment. Sometimes, the Group
uses certain credit enhancement tools to reduce the credit risk of specific customers. Since the
customers of the industry is dispersed and non-related, the credit risk concentration is not critical
aviation.
Financial credit risk
Credit risk on bank deposits, investments income and other financial instruments are measured and
monitor by the Group’s finance department. The Group’s trading partners and other parties were
well-performing banks and financial institutions, corporations, and government agencies, and so the
risk of counterparties failing to discharge an obligation is low; therefore, there is no significant
credit risk.
3) Liquidity risk
The objective of the Group’s management of liquidity is to maintain cash and cash equivalents
sufficient for operating purposes, marketable securities with high liquidity and loan commitments
that are sufficient to ensure that the Group has adequate financial flexibility.

- 77 -
Liquidity and interest risk rate table
The following table shows the remaining contractual maturity analysis of the Group’s financial
liabilities with agreed-upon repayment periods, which were based on the date the Group may be
required to pay the first repayment and financial liabilities is evaluated based on undiscounted cash
flows, including cash flows of interest and principal.
Bank loans with a repayment on demand clause were included in the second column of the table
below regardless of whether or not the banks would choose to exercise early their rights to
repayment. The maturity dates for other non-derivative financial liabilities were based on the
agreed-upon repayment dates. The Group’s liquidity analysis for its derivative financial instruments
is also shown in the following table. The table was based on the undiscounted contractual net cash
inflows and outflows on derivative instruments that settle on a net basis, and the undiscounted gross
cash inflows and outflows on those derivatives that require gross settlement. When the amount
payable or receivable is not fixed, the amount disclosed has been determined by reference to the
projected interest rates as illustrated by yield curves at the end of the reporting period.
December 31, 2019
The Weighted
Average
Effective
Interest Rate
(%) Less than 1
Year 1 to 5 Years Over 5 Years
Lease liabilities 1.1613 $ 3,357,996 $ 10,622,204 $ 8,949,194
Floating interest rate
liabilities 1.9058 15,254,687 36,274,033 16,785,664
Derivative instruments 3.1131 10,060,822 39,729,062 6,373,333
Bonds payable 2.2573 10,823,905 19,871,174 3,383,401
- $ 39,497,410 $ 106,496,473 $ 35,491,592
December 31, 2018
The Weighted
Average
Effective
Interest Rate
(%) Less than 1
Year 1 to 5 Years Over 5 Years
Lease liabilities 1.3104 $ 641,524 $ 3,024 $ -
Floating interest rate
liabilities 1.8105 14,853,360 42,143,959 20,810,464
Fixed interest rate
liabilities 0.1034 2,000,517 - -
Hedging instruments - 239,138 - -
Bonds payable 1.3905 5,999,321 30,835,449 1,051,418
$ 23,733,860 $ 72,982,432 $ 21,861,882

- 78 -
Loan commitments
December 31
2019 2018
Unused bank loan limit (unsecured) $ 18,422,000 $ 17,337,000
34. RELATED-PARTY TRANSACTIONS
The transactions, accounts balances, income and expenses between related parties were eliminated from the
consolidated report and, therefore, were not disclosed in this note. Except for the disclosures stated in other
notes, transactions between the Group and its related parties are disclosed below:
a. Related parties’ names and relationships
Name Relationship with the Company
Dynasty Holidays Associate (become associate in January 2019)
Kaohsiung Catering Services Subsidiary (become subsidiary in March 2018)
China Aircraft Service Associate
Airport Air Cargo Terminal (Xiamen) Co., Ltd. Associate
Airport Air Cargo Service (Xiamen) Co., Ltd. Associate
Eastern United International Logistics (Hong Kong) Associate
China Pacific Catering Services Joint venture investment
China Pacific Laundry Services Joint venture investment
NORDAM Asia Ltd. Joint venture investment
Delica International Co., Ltd. Joint venture investment
China Aviation Development Foundation Director of the Company and major shareholder
Others Director, key management personnel, chairman,
general manager of the Group, spouse and
second-degree relative
b. Operating income
For the Year Ended December 31
Account Items Related Party Type 2019 2018
Other income Major shareholder of the
Company
$ 25,457 $ 28,670
Associate $ 1,239 $ 523
Joint venture investment $ 42,457 $ 41,410
c. Purchases
For the Year Ended December 31
Related Party Type 2019 2018
Major shareholder of the Company $ 56,474 $ 64,188
Associate $ 414,106 $ 501,609
Joint venture investment $ 1,911,091 $ 1,912,995
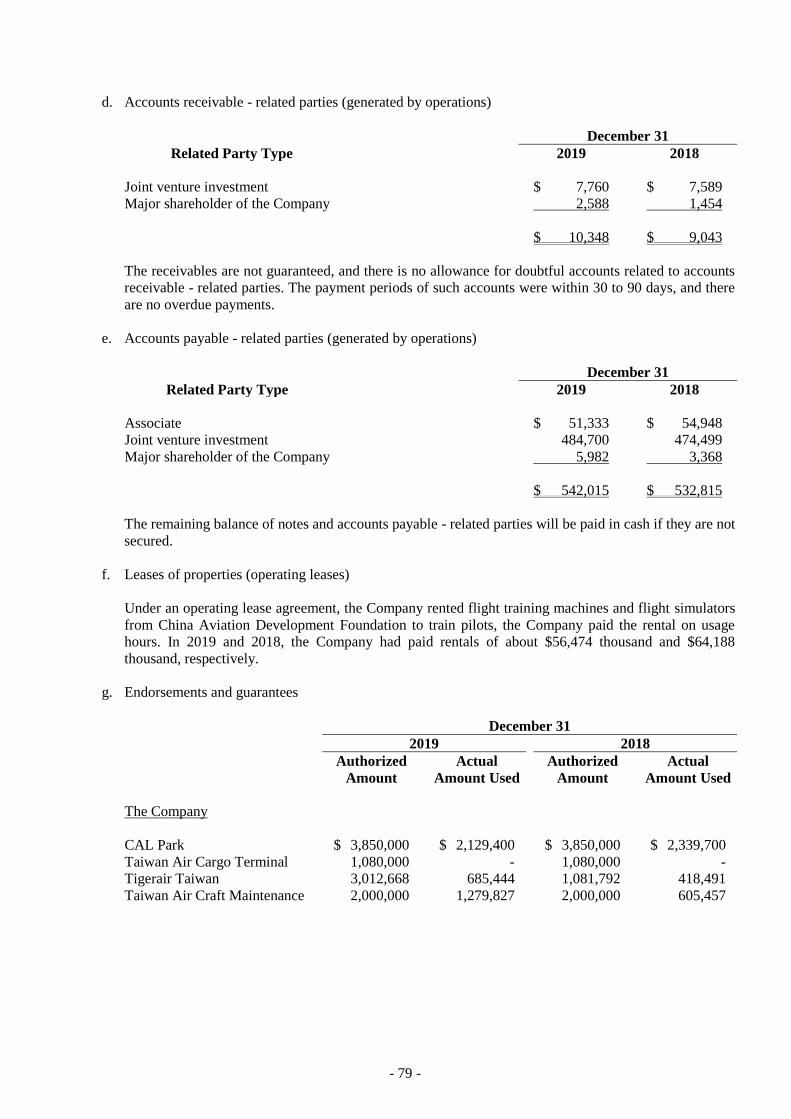
- 79 -
d. Accounts receivable - related parties (generated by operations)
December 31
Related Party Type 2019 2018
Joint venture investment $ 7,760 $ 7,589
Major shareholder of the Company 2,588 1,454
$ 10,348 $ 9,043
The receivables are not guaranteed, and there is no allowance for doubtful accounts related to accounts
receivable - related parties. The payment periods of such accounts were within 30 to 90 days, and there
are no overdue payments.
e. Accounts payable - related parties (generated by operations)
December 31
Related Party Type 2019 2018
Associate $ 51,333 $ 54,948
Joint venture investment 484,700 474,499
Major shareholder of the Company 5,982 3,368
$ 542,015 $ 532,815
The remaining balance of notes and accounts payable - related parties will be paid in cash if they are not
secured.
f. Leases of properties (operating leases)
Under an operating lease agreement, the Company rented flight training machines and flight simulators
from China Aviation Development Foundation to train pilots, the Company paid the rental on usage
hours. In 2019 and 2018, the Company had paid rentals of about $56,474 thousand and $64,188
thousand, respectively.
g. Endorsements and guarantees
December 31
2019 2018
Authorized
Amount Actual
Amount Used Authorized
Amount Actual
Amount Used
The Company
CAL Park $ 3,850,000 $ 2,129,400 $ 3,850,000 $ 2,339,700
Taiwan Air Cargo Terminal 1,080,000 - 1,080,000 -
Tigerair Taiwan 3,012,668 685,444 1,081,792 418,491
Taiwan Air Craft Maintenance 2,000,000 1,279,827 2,000,000 605,457

- 80 -
h. Compensation of key management personnel
For the Year Ended December 31
2019 2018
Short-term employee benefits $ 39,693 $ 44,551
Post-employment benefits 2,362 3,295
$ 42,055 $ 47,846
The remuneration of directors and key executives was determined by the remuneration committee
having regard to the performance of individuals and market trends.
35. PLEDGED ASSETS
The following assets were pledged or mortgaged as collateral for long-term bank loans, lease obligations
and business transactions:
December 31
2019 2018
Property, plant and equipment $ 31,260,801 $ 42,066,242
Right-of-use assets 71,033,617 -
Restricted assets - non-current
Pledged certificate deposits 130,052 169,925
$ 102,424,470 $ 42,236,167
36. COMMITMENTS AND CONTINGENT LIABILITIES
As of December 31, 2019, except for the disclosures stated in other notes, the Group had commitments and
contingent liabilities (except for those mentioned in other notes) as follows:
a. For operation needs, the board of directors of Mandarin Airlines resolved to enter into a contract to buy
six ATR72-600 aircraft, and the total list price of the six aircraft was $120,000 thousand. The expected
delivery period ranges from June 2018 to June 2020, as of December 31, 2019, four of the aircraft has
been handed over to the company, and the total list price of the lefts two aircraft was $40,000 thousand,
which has been paid in the amount of US$8,314 thousand (recognized as prepayments for aircraft).
b. Taiwan Air Cargo Terminal Co. (TACT) signed a terminal construction contract with the Civil
Aeronautics Administrations (CAA) on January 14, 2000. The chartered operation period (COP) is 20
years from the date of transfer of the chartered operation rights from CAA to TACT. The terminal
expansion and improvements and the equipment installation and upgrade in the Taiwan Taoyuan
International Airport cargo terminal and Kaohsiung cargo terminal were expected to be completed in
the first 10 years of the COP. This construction project was approved by TACT’s board of directors in
2003. TACT filed an application for a 10-year extension of the COP for the cargo terminals in the
Taiwan Taoyuan International Airport and Kaohsiung International Airport and received the approval
from the Taoyuan Airport Corporation and CAA in July 2013 and July 2015, respectively.
The original total expenditure of the previous main construction project was $8,490,000 thousand.
However, TACT filed an arbitration for the total amount of expenditure in 2012 to revise the total
amount to $6,840,000 thousand.

- 81 -
As of December 31, 2019, TACT had signed the following construction contracts with unrelated
parties:
Client Name Contract Title
Contract
Amount (VAT
Included)
CECI Engineering
Consultant, Inc., Taiwan
Cargo Terminal Expansion Construction Consultant
Contract
$ 552,285
As of December 31, 2019, the cumulated consultant service expense and construction equipment had
amounted to $481,776 thousand (VAT included) and $5,212,622 thousand (VAT included),
respectively. Upon completion of the projects, the amount of $468,755 thousand (VAT included) and
$5,200,780 thousand (VAT included) were reclassified to property, plant, and equipment. The
remaining cumulative payments were recognized under construction in progress.
Assets acquired from cargo terminal improvements, equipment acquisition and subsequent equipment
acquisition and replacement will be transferred to the government without any compensation when the
chartered operating license expires.
TACT should pay royalties to Taoyuan Airport Corporation and the CAA during the chartered
operation period. The calculation is based on annual sales (including operating and non-operating
revenue but excluding the rental revenue from specific districts), and Taoyuan Airport Corporation and
the CAA have the option to adjust the royalty rates every 3 years starting from the date of transfer of the
chartered operation rights on the basis of actual revenue and expenditures. The current royalty rate is
6%.
c. CAL Park Co., Ltd. (“CAL Park”) signed “Taiwan Taoyuan International Airport Aviation Operation
Center (including Airport Hotel) Construction Operating Contract” with the CAA on September 20,
2006. However, on November 1, 2010, the Taoyuan Airport Corporation took over the CAA’s rights on
this contract from the CAA. The contract is effective for 50 years (consisting of the development stage
and operating period) from the contract date. Three years before contract expiry date, CAL Park has the
first option to renew the contract once with a 20-year extension.
CAL Park’s business scope includes providing business and other operating space related to civil air
transport, hotels, aviation service and related industries adhered to the base and essential services law
and approved by the Taoyuan Airport Corporation.
CAL Park should pay land rentals on the date of the registration of surface rights. The rental rates for
the development stage differ from those for the operation period. The rental rates should follow Article
No. 2 of the “Regulations for Favorable Rentals Regarding Public Land Lease and Superficies in
Infrastructure Projects,” which states that rental calculation in the development stage should include the
land value added tax plus the necessary maintenance fee; in the operation period, rentals are 60% of the
amount based on the National Building Land Rental Standard plus land value tax, value-added tax and
the necessary maintenance fee.
During the 50 years beginning from the initial operation date of CAL Park to the end of the construction
period, CAL Park should pay royalties based on the operating revenue estimated in the financial plan of
its investment execution proposal. If the sales and business tax declared and filed by a business entity
for a single year exceeds 10% of the operating revenue as estimated in the financial plan in its
investment execution proposal, CAL Park should pay additional royalties at 10% of this excess.
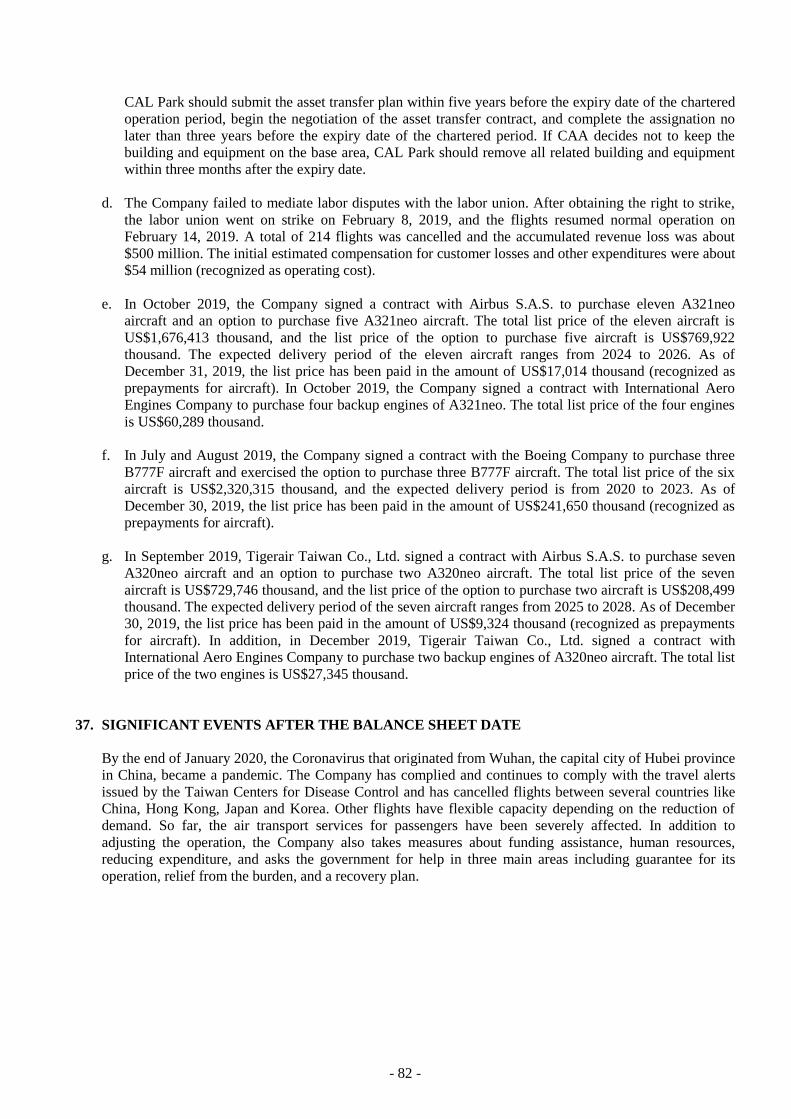
- 82 -
CAL Park should submit the asset transfer plan within five years before the expiry date of the chartered
operation period, begin the negotiation of the asset transfer contract, and complete the assignation no
later than three years before the expiry date of the chartered period. If CAA decides not to keep the
building and equipment on the base area, CAL Park should remove all related building and equipment
within three months after the expiry date.
d. The Company failed to mediate labor disputes with the labor union. After obtaining the right to strike,
the labor union went on strike on February 8, 2019, and the flights resumed normal operation on
February 14, 2019. A total of 214 flights was cancelled and the accumulated revenue loss was about
$500 million. The initial estimated compensation for customer losses and other expenditures were about
$54 million (recognized as operating cost).
e. In October 2019, the Company signed a contract with Airbus S.A.S. to purchase eleven A321neo
aircraft and an option to purchase five A321neo aircraft. The total list price of the eleven aircraft is
US$1,676,413 thousand, and the list price of the option to purchase five aircraft is US$769,922
thousand. The expected delivery period of the eleven aircraft ranges from 2024 to 2026. As of
December 31, 2019, the list price has been paid in the amount of US$17,014 thousand (recognized as
prepayments for aircraft). In October 2019, the Company signed a contract with International Aero
Engines Company to purchase four backup engines of A321neo. The total list price of the four engines
is US$60,289 thousand.
f. In July and August 2019, the Company signed a contract with the Boeing Company to purchase three
B777F aircraft and exercised the option to purchase three B777F aircraft. The total list price of the six
aircraft is US$2,320,315 thousand, and the expected delivery period is from 2020 to 2023. As of
December 30, 2019, the list price has been paid in the amount of US$241,650 thousand (recognized as
prepayments for aircraft).
g. In September 2019, Tigerair Taiwan Co., Ltd. signed a contract with Airbus S.A.S. to purchase seven
A320neo aircraft and an option to purchase two A320neo aircraft. The total list price of the seven
aircraft is US$729,746 thousand, and the list price of the option to purchase two aircraft is US$208,499
thousand. The expected delivery period of the seven aircraft ranges from 2025 to 2028. As of December
30, 2019, the list price has been paid in the amount of US$9,324 thousand (recognized as prepayments
for aircraft). In addition, in December 2019, Tigerair Taiwan Co., Ltd. signed a contract with
International Aero Engines Company to purchase two backup engines of A320neo aircraft. The total list
price of the two engines is US$27,345 thousand.
37. SIGNIFICANT EVENTS AFTER THE BALANCE SHEET DATE
By the end of January 2020, the Coronavirus that originated from Wuhan, the capital city of Hubei province
in China, became a pandemic. The Company has complied and continues to comply with the travel alerts
issued by the Taiwan Centers for Disease Control and has cancelled flights between several countries like
China, Hong Kong, Japan and Korea. Other flights have flexible capacity depending on the reduction of
demand. So far, the air transport services for passengers have been severely affected. In addition to
adjusting the operation, the Company also takes measures about funding assistance, human resources,
reducing expenditure, and asks the government for help in three main areas including guarantee for its
operation, relief from the burden, and a recovery plan.
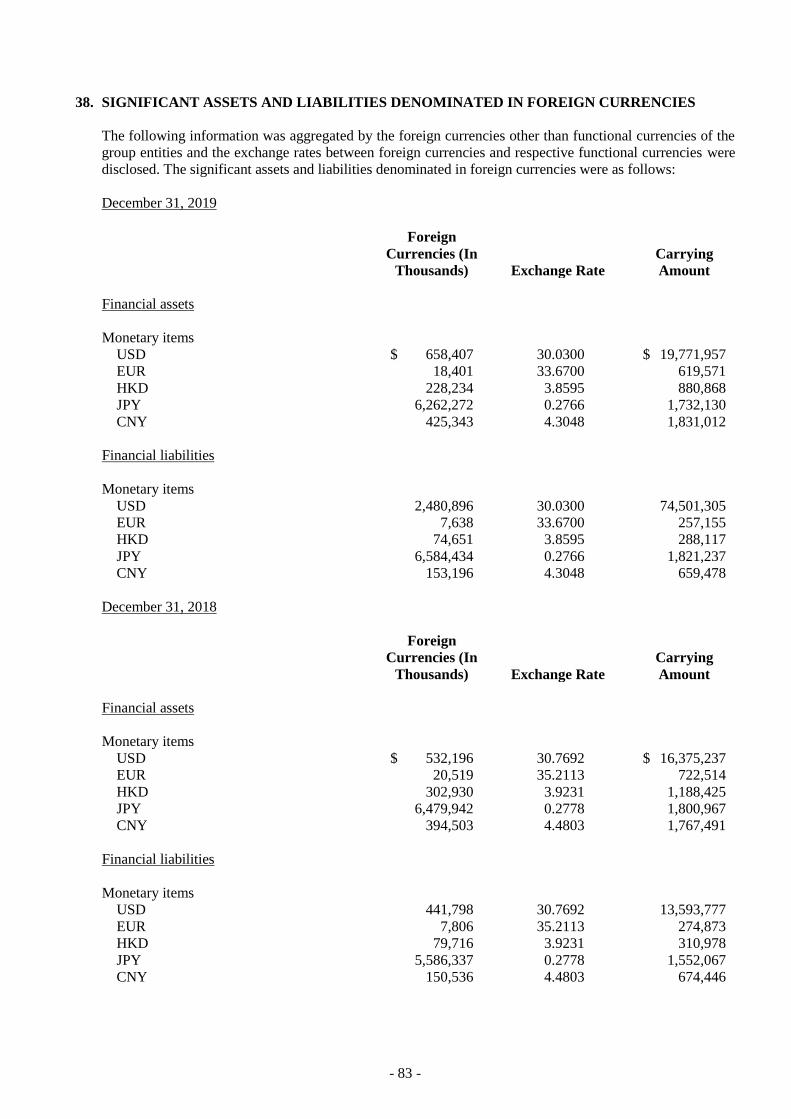
- 83 -
38. SIGNIFICANT ASSETS AND LIABILITIES DENOMINATED IN FOREIGN CURRENCIES
The following information was aggregated by the foreign currencies other than functional currencies of the
group entities and the exchange rates between foreign currencies and respective functional currencies were
disclosed. The significant assets and liabilities denominated in foreign currencies were as follows:
December 31, 2019
Foreign
Currencies (In
Thousands) Exchange Rate
Carrying
Amount
Financial assets
Monetary items
USD $ 658,407 30.0300 $ 19,771,957
EUR 18,401 33.6700 619,571
HKD 228,234 3.8595 880,868
JPY 6,262,272 0.2766 1,732,130
CNY 425,343 4.3048 1,831,012
Financial liabilities
Monetary items
USD 2,480,896 30.0300 74,501,305
EUR 7,638 33.6700 257,155
HKD 74,651 3.8595 288,117
JPY 6,584,434 0.2766 1,821,237
CNY 153,196 4.3048 659,478
December 31, 2018
Foreign
Currencies (In
Thousands) Exchange Rate
Carrying
Amount
Financial assets
Monetary items
USD $ 532,196 30.7692 $ 16,375,237
EUR 20,519 35.2113 722,514
HKD 302,930 3.9231 1,188,425
JPY 6,479,942 0.2778 1,800,967
CNY 394,503 4.4803 1,767,491
Financial liabilities
Monetary items
USD 441,798 30.7692 13,593,777
EUR 7,806 35.2113 274,873
HKD 79,716 3.9231 310,978
JPY 5,586,337 0.2778 1,552,067
CNY 150,536 4.4803 674,446
- 84 -
For the years ended December 31, 2019 and 2018, the Group’s net foreign exchange gain (losses) were
$(141,611) thousand and $41,843 thousand, respectively. It is impractical to disclose net foreign exchange
gains (losses) by each significant foreign currency due to the variety of the foreign currency transactions
and functional currencies of the group entities.
39. ADDITIONAL DISCLOSURES
a. Following are the additional disclosures required by the Securities and Futures Bureau for the Company
and its investees:
1) Financing provided: None
2) Endorsements/guarantees provided: Table 1 (attached)
3) Marketable securities held: Table 2 (attached)
4) Marketable securities acquired and disposed of at costs or prices of at least NT$300 million or 20%
of the paid-in capital: Table 3 (attached)
5) Acquisitions of individual real estates at costs or price of at least NT$300 million or 20% of the
paid-in capital: None
6) Disposals of individual real estates at costs or prices of at least NT$300 million or 20% of the
paid-in capital: None
7) Total purchases from or sales to related parties amounting to at least NT$100 million or 20% of the
paid-in capital: Table 4 (attached)
8) Receivables from related parties amounting to at least NT$100 million or 20% of the paid-in
capital: Table 5 (attached)
9) Names, locations, and related information of investees over which the Company exercises
significant influence: Table 6 (attached)
10) Derivative financial transactions (Notes 7 and 8)
b. Investment in mainland China: Table 7 (attached)
c. Business relationships and important transactions between China Airlines, Ltd. and its subsidiaries:
Table 8 (attached)

- 85 -
40. SEGMENT INFORMATION
a. Segment information
The Group mainly engages in air transportation services for passengers and cargo; the services include
airport service, storage service, and other air transportation services which are below the financial
threshold for an operating segment of the Group. Therefore, the Group’s main reportable segment is air
transportation. The accounting policies of the reportable segment are consistent with the accounting
policies described in Note 4.
For the Year Ended December 31, 2019
Air
Transportation Others
Adjustments
and Write-offs Total
Operating revenue $ 164,492,453 $ 11,067,323 $ (7,115,616) $ 168,444,160
Operation profit and losses $ 1,302,647 $ 1,449,620 $ (86,446) $ 2,665,821
Interest revenue 417,446
Investments income accounted for
using the equity method 332,305
Revenue 495,249
Financial costs (3,340,119)
Expenses (667,519)
Profit before income tax $ (96,817)
Identifiable assets $ 209,397,850 $ 15,915,060 (6,317,254) $ 218,995,656
Investments accounted for using
the equity method 2,223,793
Assets 71,828,530
Total assets $ 293,047,979
For the Year Ended December 31, 2018
Air
Transportation Others
Adjustments
and Write-offs Total
Operating revenue $ 167,370,925 $ 10,430,156 $ (7,089,474) $ 170,711,607
Operation profit and losses $ 2,617,116 $ 1,429,884 $ (24,617) $ 4,022,383
Interest revenue 330,710
Investments income accounted for
using the equity method 367,246
Revenue 157,301
Financial costs (1,379,985)
Expenses (416,406)
Profit before income tax $ 3,081,249
Identifiable assets $ 154,007,329 $ 11,036,945 138,787 $ 165,183,062
Investments accounted for using
the equity method 2,200,149
Assets 62,753,370
Total assets $ 230,136,582

- 86 -
b. Geographical segment
The geographical segment information of the Company and its subsidiaries in 2019 and 2018 are listed
below:
For the Year Ended December 31, 2019
America Northeast Asia Southeast Asia Europe Australia China Domestic
Adjustment and
Eliminations Consolidation
Operating revenue $ 40,324,160 $ 39,232,038 $ 33,354,405 $ 15,638,657 $ 7,073,170 $ 21,790,943 $ 18,146,403 $ (7,115,616 ) $ 168,444,160
Operation profit and losses $ (507,237 ) $ 2,537,003 $ (3,497,592 ) ($ 868,091 ) $ (139,573 ) $ 1,913,140 $ 3,314,617 ($ 86,446 ) $ 2,665,821
Interest revenue 417,446
Investments
income
accounted for
using the equity
method 332,305
Revenue 495,249
Interest expense (3,340,119 )
Expenses (667,519 )
Profit before
income tax $ (96,817 )
Identifiable assets $ 1,399,591 $ 222,584 $ 154,074 $ 26,707 $ 8,985 $ 50,948 $ 223,450,021 $ (6,317,254 ) $ 218,995,656
Investments
accounted for
using the equity
method 2,223,793
Assets 71,828,530
Total assets $ 293,047,979
For the Year Ended December 31, 2018
America Northeast Asia Southeast Asia Europe Australia China Domestic
Adjustment and
Eliminations Consolidation
Operating revenue $ 43,278,890 $ 38,464,450 $ 34,132,301 $ 16,092,452 $ 6,760,146 $ 22,114,227 $ 16,958,615 $ (7,089,474 ) $ 170,711,607
Operation profit and losses $ 582,721 $ 2,717,255 $ (2,412,823 ) ($ 756,263 ) $ (904,416 ) $ 2,454,935 $ 2,365,591 ($ 24,617 ) $ 4,022,383
Interest revenue 330,710
Investments
income
accounted for
using the equity
method 367,246
Revenue 146,667
Interest expense (1,369,351 )
Expenses (416,406 )
Profit before income tax $ 3,081,249
Identifiable assets $ 1,328,004 $ 15,520 $ 94,631 $ 2,796 $ 2,619 $ 10,174 $ 163,590,530 $ 138,787 $ 165,183,061
Investments
accounted for
using the equity
method 2,200,149
Assets 62,753,372
Total assets $ 230,136,582

- 87 -
TABLE 1
CHINA AIRLINES, LTD. AND INVESTEES
ENDORSEMENT/GUARANTEE PROVIDED
FOR THE YEAR ENDED DECEMBER 31, 2019
(In Thousands of New Taiwan Dollars, Unless Stated Otherwise)
No.
Endorsement/
Guarantee
Provider
Counterparty
Limit on Each
Counterparty’s
Endorsement/
Guarantee
Amount
(Note 1)
Maximum
Balance for the
Period
Ending Balance
Actual
Borrowing
Amount
Value of
Collaterals
Property, Plant
or Equipment
Ratio of
Accumulated
Amount of
Collateral to
Net Equity of
the Latest
Financial
Statement (%)
Maximum
Collateral/
Guarantee
Amounts
Allowable
(Note 2)
Endorsement/
Guarantee
Given by Parent
on Behalf of
Subsidiaries
Endorsement/
Guarantee
Given by
Subsidiaries on
Behalf of Parent
Endorsement/
Guarantee
Given on Behalf
of Companies in
Mainland China
Name Nature of Relationship
0 China Airlines CAL Park 100% subsidiary $ 11,310,754 $ 3,850,000 $ 3,850,000 $ 2,129,400 $ - 6.81 $ 28,276,886 Y N N
(the “Company”) Taiwan Air Cargo Terminal 54% subsidiary 11,310,754 1,080,000 1,080,000 - - 1.91 28,276,886 Y N N
Tigerair Taiwan Co., Ltd. 77.17% subsidiary by
direct and indirect
holdings
11,310,754 3,055,475 3,012,668 685,444 - 5.33 28,276,886 Y N N
Taiwan Aircraft Maintenance
and Engineering Co., Ltd.
100% subsidiary 11,310,754 2,000,000 2,000,000 1,279,827 - 3.54 28,276,886 Y N N
Note 1: Based on the Company’s guidelines, the maximum amount of guarantee to an individual counterparty is up to 20% of the Company’s shareholders’ equity.
Note 2: Based on the Company’s guidelines, the allowable aggregate amount of collateral guarantee is up to 50% of the Company’s shareholders’ equity.

- 88 -
TABLE 2
CHINA AIRLINES, LTD. AND INVESTEES
MARKETABLE SECURITIES HELD
DECEMBER 31, 2019
(In Thousands of New Taiwan Dollars, Unless Stated Otherwise)
Holding Company Name Marketable Security Type and Issuer/Name
Relationship
with the Holding
Company
Financial Statement Account
December 31, 2019
Note Number of
Shares/Units
Carrying
Amount
Percentage of
Ownership
(%)
Market Value
or Net Asset
Value
China Airlines (“Parent company”) Shares
Everest Investment Holdings Ltd. - ordinary shares - Financial assets at FVTOCI - non-current 1,359,368 $ 73,628 13.59 $ 80,991 Note 1
Everest Investment Holdings Ltd. - preference shares - Financial assets at FVTOCI - non-current 135,937 7,363 - -
Chung Hua Express Co. - Financial assets at FVTOCI - non-current 1,100,000 26,865 11.00 26,865
Jardine Air Terminal Services - Financial assets at FVTPL - current 12,000,000 - 15.00 -
The Grand Hi Lai Hotel - Financial assets at FVTPL - current 4,021 - 0.02 -
Mandarin Airlines Shares
China Airlines Parent company Financial assets at FVTOCI - non-current 2,074,628 18,796 - 18,796 -
Cal-Asia Investment Shares
Taikoo (Xiamen) Landing Gear Services - Financial assets at FVTPL - current - - 2.59 - Note 2
HAECO Composite Structures (Jinjiang) - Financial assets at FVTOCI - non-current - 101,365 5.45 101,365 Note 2
Sabre Travel Network (Taiwan) Beneficiary certificates
Franklin Templeton SinoAm Money Market Fund - Financial assets at FVTPL - current 7,816,048 81,124 - 81,124 -
FSITC Money Market Fund - Financial assets at FVTPL - current 497,740 89,145 - 89,145
Allianz Global Investors Taiwan Money Market Fund - Financial assets at FVTPL - current 6,444,010 81,065 - 81,065
Capital Money Market Fund - Financial assets at FVTPL - current 2,842,146 46,035 - 46,035
Taiwan Airport Services Shares
TransAsia Airways - Financial assets at FVTPL - current 2,277,786 - 0.4 - -
Beneficial certificates
Fuh Hwa Emerging Market Short-term Income Fund - Financial assets at FVTPL - current 1,671,657 20,253 - 20,253 -
Fuh Hwa Global Bond Fund - Financial assets at FVTPL - current 1,233,211 18,045 - 18,045
Dynasty Aerotech International Corp. Shares
China Airlines Parent company Financial assets at FVTOCI - non-current 814,152 7,376 - 7,376 -
Beneficiary certificates
Taishin 1699 Money Market Fund - Financial assets at FVTPL - current 349,523 4,748 - 4,748 -
(Continued)

- 89 -
Holding Company Name Marketable Security Type and Issuer/Name
Relationship
with the Holding
Company
Financial Statement Account
December 31, 2019
Note Number of
Shares/Units
Carrying
Amount
Percentage of
Ownership
(%)
Market Value
or Net Asset
Value
Kaohsiung Catering Services Beneficiary certificates
Prudential Financial Money Market Fund - Financial assets at FVTPL - current 5,407,832 $ 85,886 - $ 85,885 -
Prudential Financial Return Fund - Financial assets at FVTPL - current 4,493,628 70,423 - 70,423
Taishin 1699 Money Market Fund - Financial assets at FVTPL - current 1,106,807 15,035 - 15,035
Tigerair Taiwan Co., Ltd. Government bond
Philippines government bond - Amortized cost financial assets - 299 Not applicable 299
Note 1: The subsidiary’s net asset value was $80,991 thousand, which included ordinary shares and preference shares as of and for the year ended December 31, 2019.
Note 2: The Company does not issue shares because it is a limited company.
Note 3: The table only lists financial assets that are IFRS 9 regulated.
(Concluded)
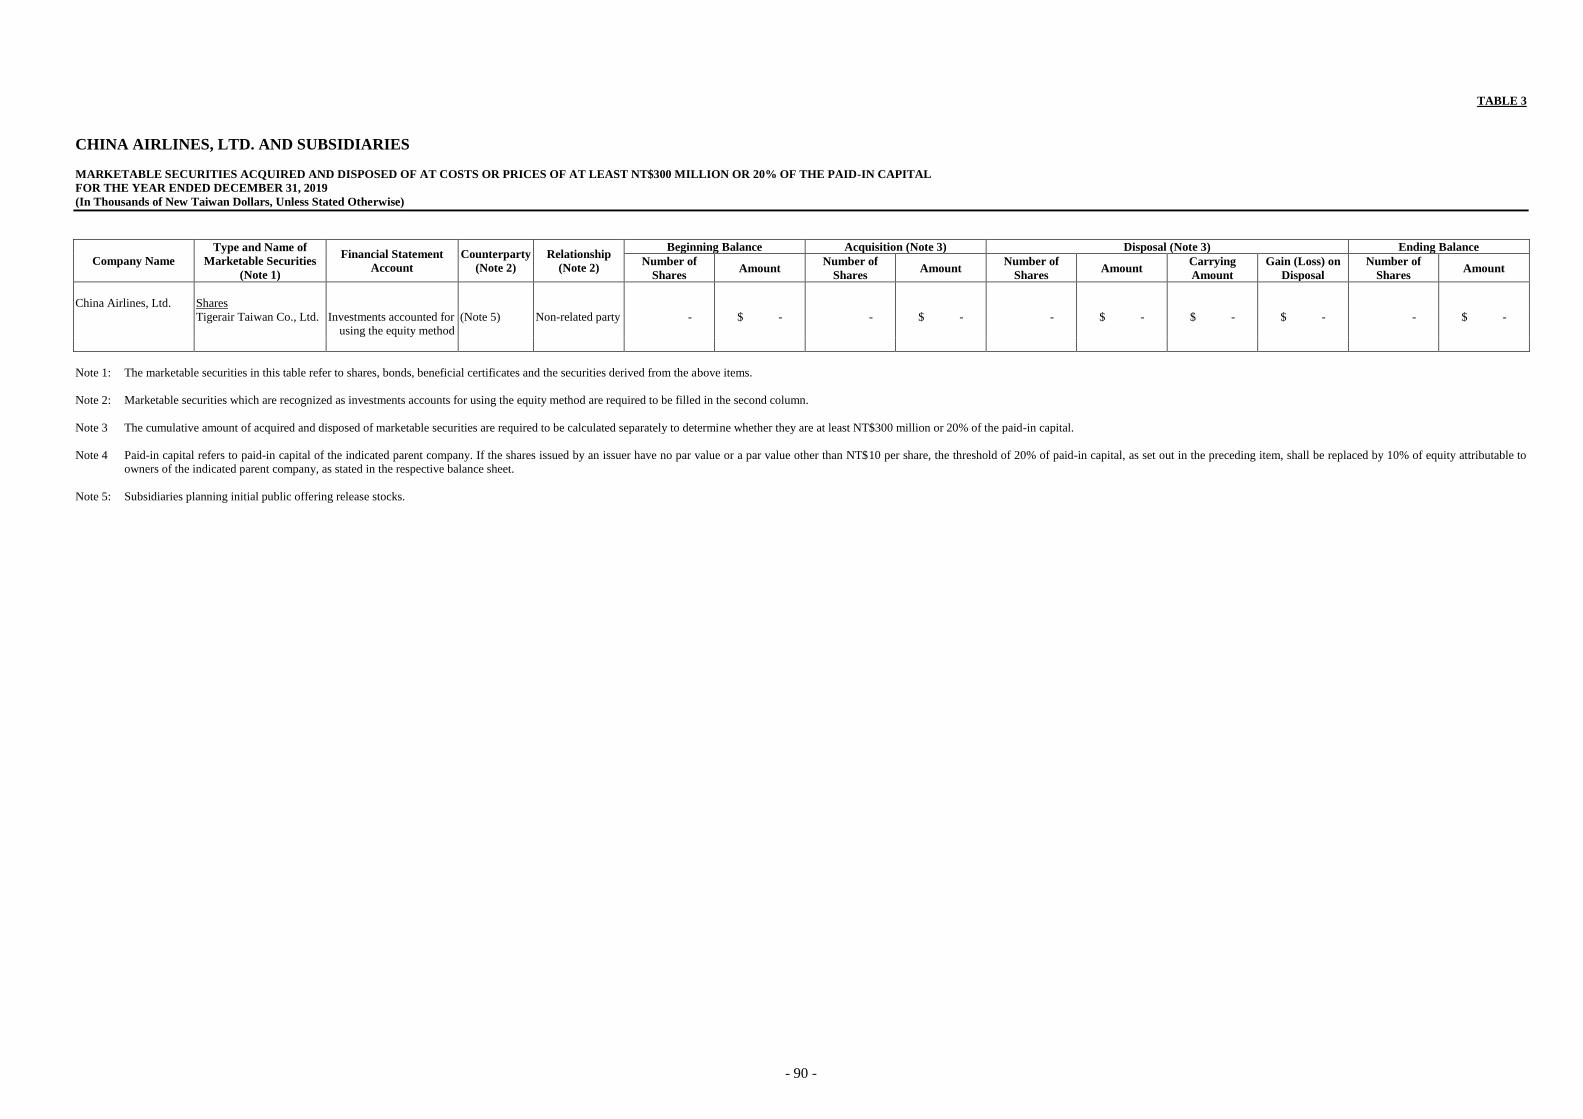
- 90 -
TABLE 3
CHINA AIRLINES, LTD. AND SUBSIDIARIES
MARKETABLE SECURITIES ACQUIRED AND DISPOSED OF AT COSTS OR PRICES OF AT LEAST NT$300 MILLION OR 20% OF THE PAID-IN CAPITAL
FOR THE YEAR ENDED DECEMBER 31, 2019
(In Thousands of New Taiwan Dollars, Unless Stated Otherwise)
Company Name
Type and Name of
Marketable Securities
(Note 1)
Financial Statement
Account
Counterparty
(Note 2)
Relationship
(Note 2)
Beginning Balance Acquisition (Note 3) Disposal (Note 3) Ending Balance
Number of
Shares Amount
Number of
Shares Amount
Number of
Shares Amount
Carrying
Amount
Gain (Loss) on
Disposal
Number of
Shares Amount
China Airlines, Ltd. Shares
Tigerair Taiwan Co., Ltd. Investments accounted for
using the equity method
(Note 5) Non-related party - $ - - $ - - $ - $ - $ - - $ -
Note 1: The marketable securities in this table refer to shares, bonds, beneficial certificates and the securities derived from the above items.
Note 2: Marketable securities which are recognized as investments accounts for using the equity method are required to be filled in the second column.
Note 3 The cumulative amount of acquired and disposed of marketable securities are required to be calculated separately to determine whether they are at least NT$300 million or 20% of the paid-in capital.
Note 4 Paid-in capital refers to paid-in capital of the indicated parent company. If the shares issued by an issuer have no par value or a par value other than NT$10 per share, the threshold of 20% of paid-in capital, as set out in the preceding item, shall be replaced by 10% of equity attributable to
owners of the indicated parent company, as stated in the respective balance sheet.
Note 5: Subsidiaries planning initial public offering release stocks.
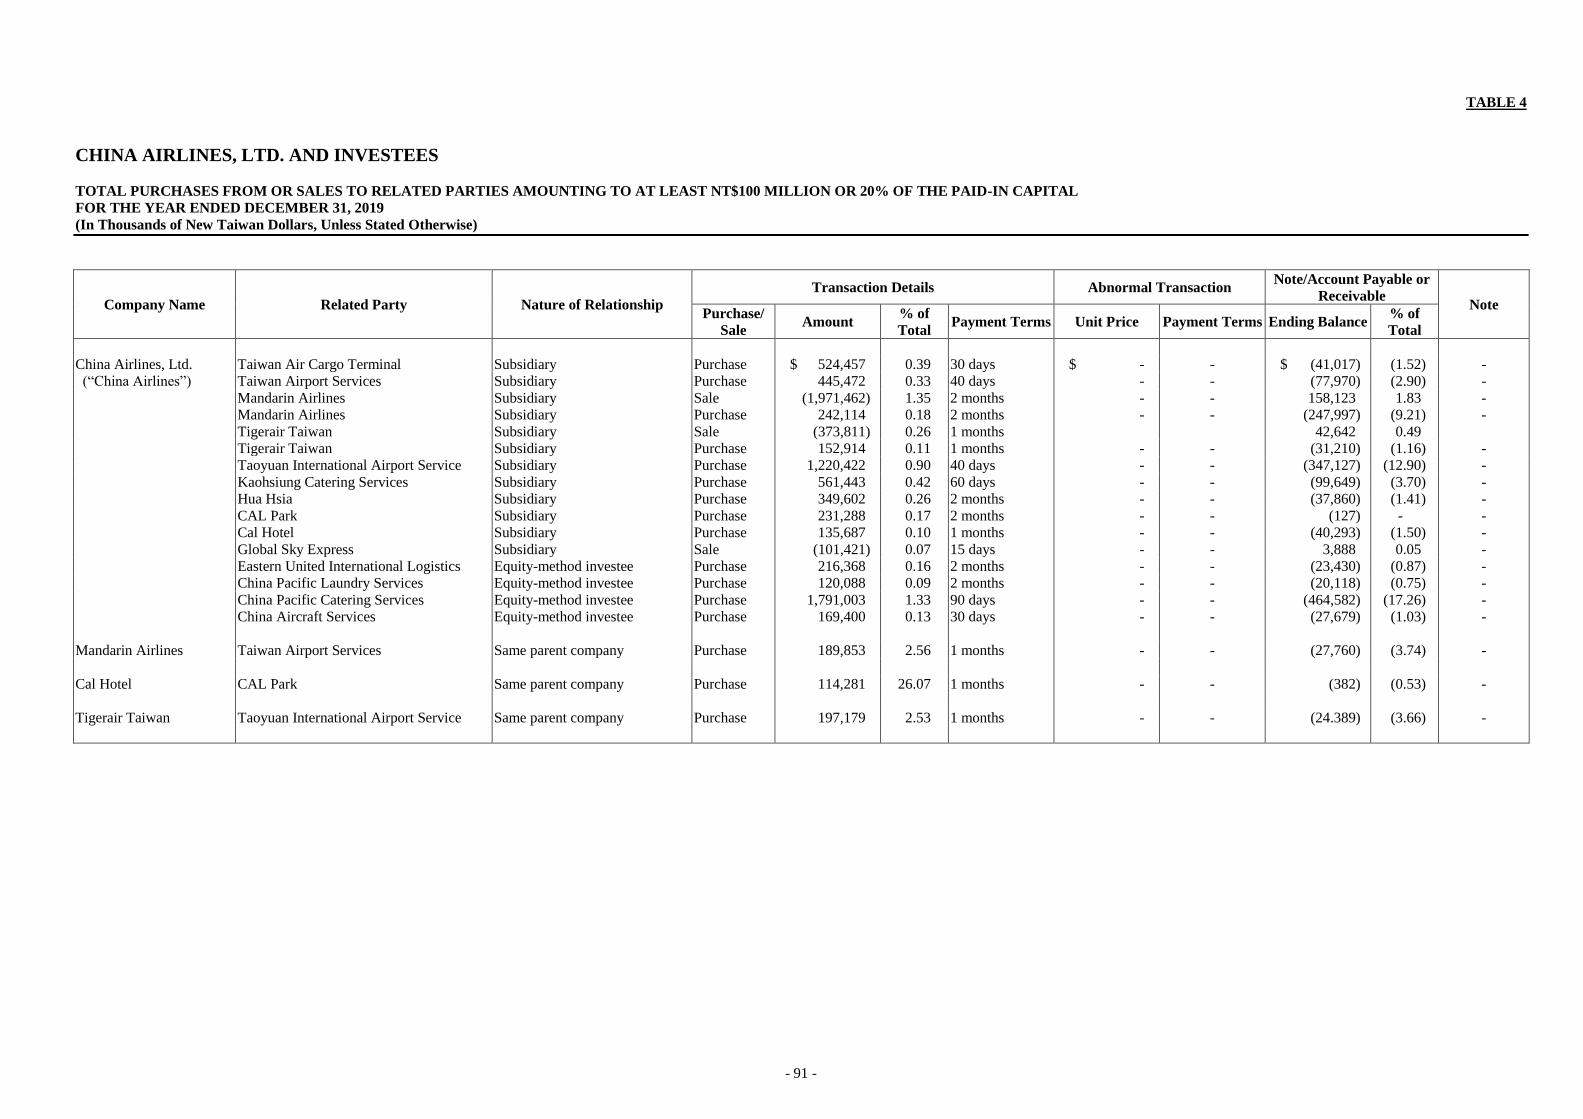
- 91 -
TABLE 4
CHINA AIRLINES, LTD. AND INVESTEES
TOTAL PURCHASES FROM OR SALES TO RELATED PARTIES AMOUNTING TO AT LEAST NT$100 MILLION OR 20% OF THE PAID-IN CAPITAL
FOR THE YEAR ENDED DECEMBER 31, 2019
(In Thousands of New Taiwan Dollars, Unless Stated Otherwise)
Company Name Related Party Nature of Relationship
Transaction Details Abnormal Transaction Note/Account Payable or
Receivable Note
Purchase/
Sale Amount
% of
Total Payment Terms Unit Price Payment Terms Ending Balance
% of
Total
China Airlines, Ltd. Taiwan Air Cargo Terminal Subsidiary Purchase $ 524,457 0.39 30 days $ - - $ (41,017) (1.52) -
(“China Airlines”) Taiwan Airport Services Subsidiary Purchase 445,472 0.33 40 days - - (77,970) (2.90) -
Mandarin Airlines Subsidiary Sale (1,971,462) 1.35 2 months - - 158,123 1.83 -
Mandarin Airlines Subsidiary Purchase 242,114 0.18 2 months - - (247,997) (9.21) -
Tigerair Taiwan Subsidiary Sale (373,811) 0.26 1 months 42,642 0.49
Tigerair Taiwan Subsidiary Purchase 152,914 0.11 1 months - - (31,210) (1.16) -
Taoyuan International Airport Service Subsidiary Purchase 1,220,422 0.90 40 days - - (347,127) (12.90) -
Kaohsiung Catering Services Subsidiary Purchase 561,443 0.42 60 days - - (99,649) (3.70) -
Hua Hsia Subsidiary Purchase 349,602 0.26 2 months - - (37,860) (1.41) -
CAL Park Subsidiary Purchase 231,288 0.17 2 months - - (127) - -
Cal Hotel Subsidiary Purchase 135,687 0.10 1 months - - (40,293) (1.50) -
Global Sky Express Subsidiary Sale (101,421) 0.07 15 days - - 3,888 0.05 -
Eastern United International Logistics Equity-method investee Purchase 216,368 0.16 2 months - - (23,430) (0.87) -
China Pacific Laundry Services Equity-method investee Purchase 120,088 0.09 2 months - - (20,118) (0.75) -
China Pacific Catering Services Equity-method investee Purchase 1,791,003 1.33 90 days - - (464,582) (17.26) -
China Aircraft Services Equity-method investee Purchase 169,400 0.13 30 days - - (27,679) (1.03) -
Mandarin Airlines Taiwan Airport Services Same parent company Purchase 189,853 2.56 1 months - - (27,760) (3.74) -
Cal Hotel CAL Park Same parent company Purchase 114,281 26.07 1 months - - (382) (0.53) -
Tigerair Taiwan Taoyuan International Airport Service Same parent company Purchase 197,179 2.53 1 months - - (24.389) (3.66) -
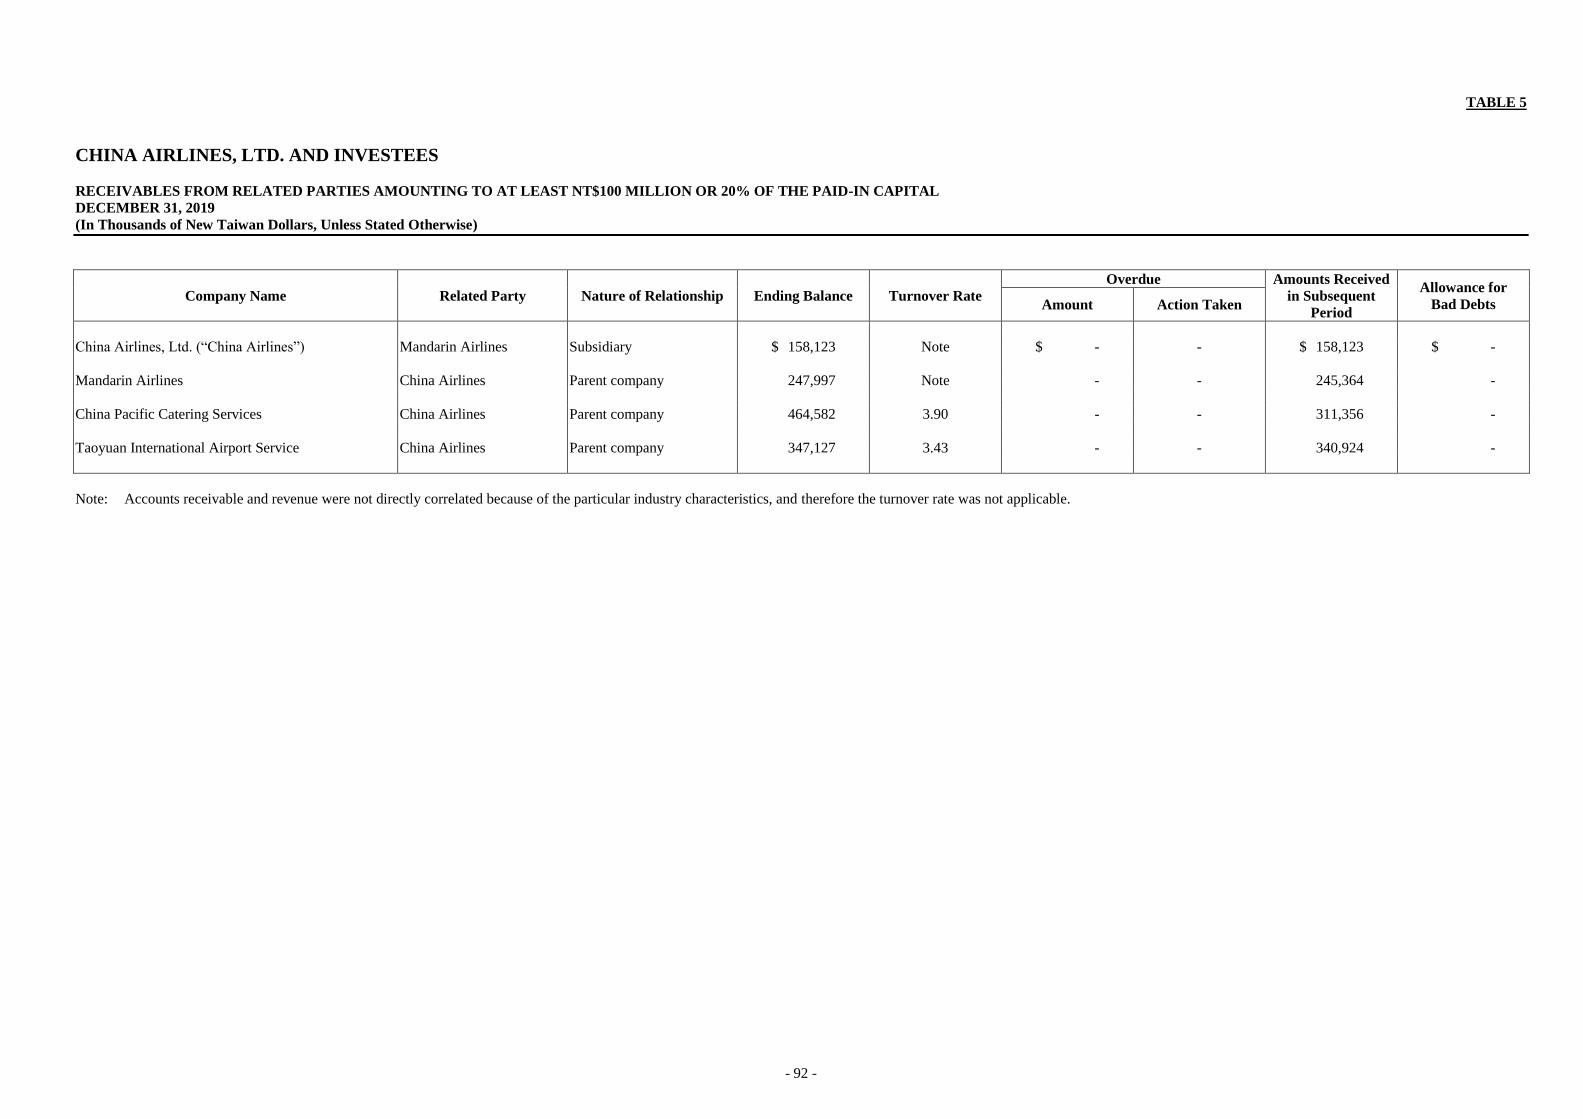
- 92 -
TABLE 5
CHINA AIRLINES, LTD. AND INVESTEES
RECEIVABLES FROM RELATED PARTIES AMOUNTING TO AT LEAST NT$100 MILLION OR 20% OF THE PAID-IN CAPITAL
DECEMBER 31, 2019
(In Thousands of New Taiwan Dollars, Unless Stated Otherwise)
Company Name Related Party Nature of Relationship Ending Balance Turnover Rate
Overdue Amounts Received
in Subsequent
Period
Allowance for
Bad Debts Amount Action Taken
China Airlines, Ltd. (“China Airlines”) Mandarin Airlines Subsidiary $ 158,123 Note $ - - $ 158,123 $ -
Mandarin Airlines China Airlines Parent company 247,997 Note - - 245,364 -
China Pacific Catering Services China Airlines Parent company 464,582 3.90 - - 311,356 -
Taoyuan International Airport Service China Airlines Parent company 347,127 3.43 - - 340,924 -
Note: Accounts receivable and revenue were not directly correlated because of the particular industry characteristics, and therefore the turnover rate was not applicable.

- 93 -
TABLE 6
CHINA AIRLINES, LTD. AND INVESTEES
NAMES, LOCATIONS, AND OTHER INFORMATION OF INVESTEES OVER WHICH THE COMPANY EXERCISES SIGNIFICANT INFLUENCE
FOR THE YEAR ENDED DECEMBER 31, 2019
(In thousands of New Taiwan Dollars and Foreign Currencies in Thousands, Unless Stated Otherwise)
Investor Company Investee Company Location Main Business and Product
Investment Amount Balance as of December 31, 2019
Net Income
(Loss) of the
Investee
Investment
Income (Loss) Note December 31,
2019
December 31,
2018
Number of
Shares/Units
Percentage
of
Ownership
(%)
Carrying
Amount
China Airlines, Ltd. CAL Park Taoyuan, Taiwan Real estate lease and international trade $ 1,500,000 $ 1,500,000 150,000,000 100.00 $ 1,552,310 $ 1,163 $ 47,694 Note 4
Mandarin Airlines Taipei, Taiwan Air transportation and maintenance of aircraft 2,042,368 2,042,368 188,154,025 93.99 1,494,603 204,018 191,322 Notes 1 and 4
Taiwan Air Cargo Terminal Taoyuan, Taiwan Air cargo and storage 1,350,000 1,350,000 135,000,000 54.00 1,517,946 271,552 146,642 Note 4
Cal-Dynasty International Los Angeles, USA A holding company, real estate and hotel services US$ 26,145 US$ 26,145 2,614,500 100.00 1,276,546 41,262 41,262 Notes 2 and 4
China Pacific Catering Services Taoyuan, Taiwan In-flight catering 439,110 439,110 43,911,000 51.00 801,071 511,121 256,899 -
Taoyuan International Airport Services Taoyuan, Taiwan Airport services 147,000 147,000 34,300,000 49.00 737,245 291,522 142,846 -
CAL-Asia Investment Territory of the British Virgin Islands General investment US$ 7,172 US$ 7,172 7,172,346 100.00 559,562 30,820 30,819 -
Sabre Travel Network (Taiwan) Taipei, Taiwan Sale and maintenance of hardware and software 52,200 52,200 13,021,042 93.93 460,213 195,347 183,490 -
China Aircraft Service Hong Kong International Airport Airport services HK$ 58,000 HK$ 58,000 28,400,000 20.00 461,263 51,828 10,365 -
Taiwan Airport Services Taipei, Taiwan Airport services 12,289 12,289 20,626,644 47.35 276,134 156,861 74,274 -
Kaohsiung Catering Services Kaohsiung, Taiwan In-flight catering 383,846 383,846 21,494,637 53.67 661,170 292,632 142,886 Note 5
Cal Hotel Co., Ltd. Taoyuan, Taiwan Hotel business 465,000 465,000 46,500,000 100.00 479,259 16,787 18,020 Note 4
China Pacific Laundry Services Taoyuan, Taiwan Cleaning and leasing of the towel of airlines, hotels,
restaurants and health clubs
137,500 137,500 13,750,000 55.00 168,547 27,327 15,030 -
Dynasty Aerotech International Corp. Taoyuan, Taiwan Cleaning of aircraft and maintenance of machine and
equipment
77,270 77,270 77,270 100.00 88,313 17,008 16,857 Notes 1 and 4
Yestrip Taipei, Taiwan Travel business 26,265 26,265 1,600,000 100.00 25,268 (480) (384) Note 4
Dynasty Holidays Tokyo, Japan Travel business JPY 8,000 JPY 20,400 160 20.00 10,004 (894) (480) -
Global Sky Express Taipei, Taiwan Forwarding and storage of air cargo 2,500 2,500 250,000 25.00 7,294 6,392 1,598 -
Tigerair Taiwan Co., Ltd. Taipei, Taiwan Air transportation and maintenance of aircraft 1,272,063 1,648,387 138,906,275 69.45 1,946,328 808,718 699,039 Note 4
Taiwan Aircraft Maintenance and
Engineering Co., Ltd.
Taoyuan, Taiwan Aircraft maintenance 1,350,000 1,350,000 135,000,000 100.00 921,989 (206,151) (206,149) -
NORDAM Asia Ltd. Taoyuan, Taiwan Aircraft maintenance 37,975 2,450 3,797,500 49.00 37,813 (144) (70) -
Mandarin Airlines Tigerair Taiwan Co., Ltd. Taipei, Taiwan Air transportation and maintenance of aircraft 154,330 200,000 15,433,000 7.72 216,243 808,718 77,587 -
Taiwan Airport Services Taipei, Taiwan Airport services 11,658 11,658 469,755 1.08 6,281 156,861 1,689 -
CAL-Asia Investment Eastern United International Logistics Hong Kong Forwarding and storage of air cargo HK$ 3,329 HK$ 3,329 1,050,000 35.00 42,717 9,678 3,387 -
Taiwan Airport Services Taiwan Airport Service (Samoa) Samoa Airport services and investment US$ 5,877 US$ 5,877 - 100.00 347,551 23,107 23,107 Note 3
Kaohsiung Catering
Services
Delica International Co., Ltd. Kaohsiung, Taiwan Catering business 10,200 10,200 1,020,000 51.00 7,867 (4) (2) -
Note 1: Adopted the treasury shares method in recognizing investment income or loss.
Note 2: Represents the consolidated financial information of the foreign holding company disclosed in accordance with local regulations.
Note 3: The Company does not issue shares because it is a limited company.
Note 4: Difference caused by lease arrangement between consolidated entities.
Note 5: Difference cause by acquisition.

- 94 -
TABLE 7
CHINA AIRLINES, LTD. AND INVESTEES
INVESTMENTS IN MAINLAND CHINA
FOR THE YEAR ENDED DECEMBER 31, 2019
(In thousands of New Taiwan Dollars/Renminbi/US Dollars)
China Airlines
Investee Company Name Main Business and
Product
Total Amount
of Paid-in
Capital
Investment
Type
Accumulated
Outflow of
Investment
from Taiwan as
of January 1,
2019
Investment Flow Accumulated
Outflow of
Investment
from Taiwan as
of December 31,
2019
Net Income
(Loss) of
the Investee
% Ownership
of Direct or
Indirect
Investment
Investment
Gain (Loss)
Carrying
Amount
as of
December 31,
2019
Accumulated
Inward
Remittance of
Earnings as of
December 31,
2019
Outflow Inflow
Airport Air Cargo Terminal
(Xiamen) Co., Ltd.
Forwarding and storage
of air cargo
$ 10,95,480
(RMB 254,480)
Indirect
(Note 1)
$ 125,705
(US$ 4,186)
$ - $ - $ 125,705
(US$ 4,186)
$ 76,711
(RMB 17,107)
14.00 $ 10,795
(RMB 2,395)
$ 223,683
(RMB 51,962)
$ 86,208
(US$ 2,802)
(Note 2)
Airport Air Cargo Service
(Xiamen) Co., Ltd.
Forwarding and storage
of air cargo
60,267
(RMB 14,000)
Indirect
(Note 1)
58,482
(US$ 1,947)
- - 58,482
(US$ 1,947)
89,573
(RMB 19,975)
14.00 12,606
(RMB 2,796)
124,071
(RMB 28,822)
26,933
(US$ 875)
(Note 2)
Taikoo (Xiamen) Landing
Gear Services
Landing gear
maintenance services
2,495,195
(US$ 83,090)
Indirect
(Note 1)
64,601
(US$ 2,151)
- - 64,601
(US$ 2,151)
- 2.589 - - -
HAECO Composite
Structures (Jinjiang)
Composite material 350,240
(US$ 11,663)
Indirect
(Note 1)
19,099
(US$ 636)
- - 19,099
(US$ 636)
- 5.45 - 42,718
(RMB 9,923)
-
Accumulated Investment in
Mainland China as of
December 31, 2019
Investment Amount
Authorized by Investment
Commission, MOEA
Limit on Investment
$267,886 (US$8,920) $650,192 (Note 3) $36,079,270 (Note 4)
(Continued)

- 95 -
Taiwan Airport Services
Investee Company Main Business and
Product Paid-in Capital
Method of
Investment
Accumulated
Outward
Remittance for
Investment
from Taiwan as
of January 1,
2019
Remittance of Funds Accumulated
Outward
Remittance for
Investment
from Taiwan as
of December 31,
2019
Net Income
(Loss) of the
Investee
% Ownership
of Direct or
Indirect
Investment
Investment
Income (Loss)
Carrying
Amount as of
December 31,
2019
Accumulated
Repatriation of
Investment
Income as of
December 31,
2019
Outward Inward
Airport Air Cargo Terminal
(Xiamen) Co., Ltd.
Forwarding and storage
of air cargo
$ 1,095,480
(RMB 254,480)
Indirect
(Note 5)
$ 120,671
(US$ 4,018)
$ - $ - $ 120,671
(US$ 4,018)
$ 76,711
(RMB 17,107)
14.00 $ 10,740
(RMB 2,395)
$ 222,478
(RMB 51,682)
$ 114,304
(US$ 3,806)
Airport Air Cargo Service
(Xiamen) Co., Ltd.
Forwarding and storage
of air cargo
60,267
(RMB 14,000)
Indirect
(Note 5)
57,860
(US$ 1,927)
- - 57,860
(US$ 1,927)
89,573
(RMB 19,975)
14.00 12,540
(RMB 2,796)
124,279
(RMB 28,870)
42,240
(US$ 1,407)
Accumulated Outward
Remittance for Investment in
Mainland China as of December 31, 2019
Investment Amounts Authorized by
Investment Commission, MOEA
Upper Limit on the Amount of
Investment Stipulated by
Investment Commission, MOEA
$178,532 (US$5,945) $178,532 (US$5,945) $349,906 (Note 4)
Note 1: China Airlines, Ltd. the “Company” invested in CAL-Asia Investment, which, in turn, invested in a company located in mainland China.
Note 2: The inward remittance of earnings in 2019 amounted to US$2,801,749 and US$875,330.
Note 3: The amount comprised US$19,828,324, RMB4,200,000 and NT$36,666,667.
Note 4: The limit stated in the Investment Commission’s regulation, “Investment or Technical Cooperation in Mainland China Adjustment Rule,” is the larger of the Company’s net asset value or 60% of the consolidated net asset value.
Note 5: Taiwan Airport Services invested in Taiwan Airport Services (Samoa), which in return, invested in a company located in mainland China.
Note 6: The RMB and U.S. dollar amounts of assets are translated at year-end rates and those of gains (losses), at the average of the year-end rates of refer for the reporting period.
(Concluded)

- 96 -
TABLE 8
CHINA AIRLINES, LTD. AND SUBSIDIARIES
BUSINESS RELATIONSHIPS AND IMPORTANT TRANSACTIONS BETWEEN CHINA AIRLINES, LTD. AND ITS SUBSIDIARIES
FOR THE YEAR ENDED DECEMBER 31, 2019
(In Thousands of New Taiwan Dollars)
No. Company Name Related Party
Natural of
Relationship
(Note 1)
Intercompany Transactions
Financial Statement Account Amount Transaction Criteria
% of Total
Consolidated
Total Revenue
or Assets
0 China Airlines, Ltd. Mandarin Airlines a Passenger revenue $ 1,728,158 The same as ordinary transactions 1.03
Mandarin Airlines a Other operating revenue 243,304 The same as ordinary transactions 0.14
Tigerair Taiwan Co., Ltd. a Other operating revenue 373,811 The same as ordinary transactions 0.22
Mandarin Airlines a Passenger costs 242,114 The same as ordinary transactions 0.14
Taoyuan International Airport Services a Airport service costs 1,220,422 The same as ordinary transactions 0.72
Taiwan Airport Service a Airport service costs 445,472 The same as ordinary transactions 0.26
Dynasty Aerotech International Corp. a Airport service costs 349,602 The same as ordinary transactions 0.21
Taiwan Air Cargo Terminal a Other operating costs 524,457 The same as ordinary transactions 0.31
CAL Park a Other operating costs 231,288 The same as ordinary transactions 0.14
Cal Hotel Co., Ltd. a Other operating costs 135,687 The same as ordinary transactions 0.08
Kaohsiung Catering Services a Other operating costs 561,443 The same as ordinary transactions 0.33
Mandarin Airlines a Accounts receivable - related parties 158,123 The same as ordinary transactions 0.05
Mandarin Airlines a Accounts payable - related parties 247,997 The same as ordinary transactions 0.08
Taoyuan International Airport Services a Accounts payable - related parties 347,127 The same as ordinary transactions 0.11
Mandarin Airlines a Bonds payable - non-current 250,000 The same as ordinary transactions 0.08
1 Taiwan Air Cargo Terminal China Airlines, Ltd. b Sales revenue 524,457 The same as ordinary transactions 0.31
2 Mandarin Airlines China Airlines, Ltd. b Passenger costs 1,728,158 The same as ordinary transactions 1.03
Taiwan Airport Service c Airport service costs 189,853 The same as ordinary transactions 0.11
China Airlines, Ltd. b Passenger revenue 242,114 The same as ordinary transactions 0.14
China Airlines, Ltd. b Operating expenses 243,304 The same as ordinary transactions 0.14
China Airlines, Ltd. b Accounts receivable - related parties 247,997 The same as ordinary transactions 0.08
China Airlines, Ltd. b Financial assets at amortized costs 250,000 The same as ordinary transactions 0.08
China Airlines, Ltd. b Notes payable and accounts payable - related
parties
158,123 The same as ordinary transactions 0.05
3 Taoyuan International Airport Services Tigerair Taiwan Co., Ltd. c Airport service revenue 197,179 The same as ordinary transactions 0.12
China Airlines, Ltd. b Airport service revenue 1,220,422 The same as ordinary transactions 0.72
China Airlines, Ltd. b Accounts receivable - related parties 347,127 The same as ordinary transactions 0.11
4 Taiwan Airport Service China Airlines, Ltd. b Operating revenue 445,472 The same as ordinary transactions 0.26
Mandarin Airlines c Operating revenue 189,853 The same as ordinary transactions 0.11
5 Dynasty Aerotech International Corp. China Airlines, Ltd. b Operating revenue 349,602 The same as ordinary transactions 0.21
(Continued)

- 97 -
No. Company Name Related Party
Natural of
Relationship
(Note 1)
Intercompany Transactions
Financial Statement Account Amount Transaction Criteria
% of Total
Consolidated
Total Revenue
or Assets
6 CAL Park China Airlines, Ltd. b Operating revenue $ 231,288 The same as ordinary transactions 0.14
Cal Hotel Co., Ltd. c Operating revenue 114,281 The same as ordinary transactions 0.07
7 Cal Hotel Co., Ltd. China Airlines, Ltd. b Operating revenue 135,687 The same as ordinary transactions 0.08
CAL Park c Operating costs 114,281 The same as ordinary transactions 0.07
8 Tigerair Taiwan Co., Ltd. China Airlines, Ltd. b Operating expenses 373,811 The same as ordinary transactions 0.22
Taoyuan International Airport Services c Airport service costs 197,179 The same as ordinary transactions 0.12
9 Kaohsiung Catering Services China Airlines, Ltd. b Operating revenue 561,443 The same as ordinary transactions 0.18
Note 1: The three directional types for transactions by business relationship between China Airlines, Ltd. and its subsidiaries are as follows:
a. Parent to subsidiaries.
b. Subsidiaries to parent.
c. Subsidiaries to subsidiaries.
Note 2: Intercompany transactions were written off in the consolidated financial statements.
Note 3: The Company only discloses transaction amounts or balances of more than $100,000 thousand.
(Concluded)