china going global investment index€¦ · of their attractiveness for chinese outward direct...
TRANSCRIPT

China Going Global Investment IndexA report from the Economist Intelligence Unit
www.eiu.com


China Going Global Investment Index
© The Economist Intelligence Unit Limited 2013 1
Table of contents
Executive summary 2
Introduction 4
Methodology 5
Rankings 7
Opportunity 14
Natural resources 14
Entering new markets—from exports to local production 15
Offshoring, but from China 17
Brands and technology 18
Risk 20
Domestic risk 21
International risk 22
Cultural proximity 24
China: The world’s largest exporter of... jobs? 25
Appendix A - Index structure and data sources 26
Appendix B - Methodological notes 28
China Going Global Investment Index
© The Economist Intelligence Unit Limited 20132
Executive summaryChina’s role in the global economy is changing. The country’s imports are catching up with its exports. Consumers are closing the gap with businesses as the main drivers of spending in the world’s second largest economy. And foreign direct investment outflows are closing in on inflows: by 2017, the Economist Intelligence Unit expects China to become a net investor in the world. But where might this investment go? Our index uses a robust and quantitative approach to rank countries on the basis of their attractiveness for Chinese outward direct investment (ODI); it can assist Chinese firms in narrowing down the list of potential investment destinations, and also focus the minds of recipient governments on the issues that matter for Chinese investors.
While ODI from China has soared in recent years, most of it remains state-driven, resulting in a preference among Chinese investors for resource-rich and developing countries. That, too, is changing. Private players are becoming increasingly active in international expansion and the primary motivation for investing overseas will be to tap new markets, as well as to acquire new brands and technology.
That puts the US at the top of the Economist Intelligence Unit’s China Going Global Investment Index, which balances opportunities against risk for 67 countries. The top 10 countries are shown in in the table above; and the data are also presented in an interactive online tool, available at [http://www.eiuresources.com/China_investment_2013/]. To reflect investor preferences accurately, the index incorporates the results of an earlier EIU survey of Chinese firms investing abroad, the results of which can be found in A Brave New World: The Climate for Chinese M&A Abroad.
China Going Global Investment Index
Final ranking (100 = Best)
Rank Country Score
1 US 54.9
2 Singapore 48.9
3 Hong Kong 45.9
4 Japan 43.8
5 Australia 43.7
6 Canada 43.2
7 Switzerland 40.2
8 Norway 39.8
9 Russia 39.6
10 Germany 37.7

China Going Global Investment Index
© The Economist Intelligence Unit Limited 2013 3
Findings from the index include:
l Countries differ in their elements of strength, and so tailoring the list to a particular company’s objectives may result in a very different ranking.
l Chinese firms are not just interested in frontier markets: many attractive destinations are large and wealthy OECD countries with big domestic markets and valuable brands and technologies. Seven of the top 10 countries are OECD members, suggesting that, on balance, developed economies provide significant investment opportunities for Chinese firms.
l Countries with attractive markets tend to perform better than those with only resources—a result which may be partly attributable to the growing role of non-state-owned enterprises in overseas investment and their differing motivations.
l A decisive factor working in favour of developed economies, and the US in particular, is that the brands and technology sought after by many Chinese investors are found almost exclusively in these economies.
l Cultural differences pose an important risk to Chinese investors. Countries that are culturally similar to China, such as Singapore and Malaysia, thus tend to perform relatively well.
l Political risk matters to Chinese firms, but it is not a decisive factor according to our survey. The US achieves the least attractive ranking in our category of international risk, which includes political risk as well as risk stemming from protectionism. Nonetheless, this is not enough to knock the US off the top spot.
l Developing countries often score well in two areas: natural resources and export manufacturing opportunities. However, they fall short when it comes to the top motivation for Chinese firms to invest abroad, which is to access new markets.
The findings contrast somewhat with the experience of Chinese ODI thus far, which has flowed predominantly to developing countries. However, as more privately owned Chinese firms expand abroad, there is likely to be a shift toward investing in the developed world. There is some evidence that this is already occurring; the share of large Chinese investments by value (defined as projects of more than US$100m in value) going to North America, Australia and Europe increased from 16% in 2005 to 53% in 2012, according to data compiled by the Heritage Foundation.
More and more Chinese firms are starting to “go global” and are seeking investment opportunities around the globe. This index shows which countries are likely to be attractive destinations for such investment, what issues matter for Chinese investors and how they will affect the coming wave of investment.
China Going Global Investment Index
© The Economist Intelligence Unit Limited 20134
IntroductionChinese companies have come a long way in their quest to become multinationals. In 2005 the fast-growing Asian economy accounted for 5% of global GDP but only 1.3% of global outward direct investment (ODI) flows. In 2012 China accounted for 11.6% of global output and 6.7% of ODI, according to Economist Intelligence Unit estimates. Thus, Chinese firms invest overseas less than those from other countries. However, the gap is closing quickly. Indeed, since ODI from China took off in 2005, annual outflows have grown at an average rate of 35% per year, reaching US$115bn in 2012. That has pushed China up the global ODI rankings from 16th place in 2011 to 3rd place (excluding tax havens), after the US and Japan.
Just as interesting, however, has been the changing composition of Chinese ODI. Most significantly, non-state firms have increasingly been participating in outward investment activity. While the veracity of official data on Chinese ODI is subject to some debate, multiple sources suggest that the share of state-owned enterprises (SOEs) is falling. As the size of Chinese domestic firms reaches a critical scale in the domestic market and domestic economic growth rates are expected to moderate, venturing overseas has become a matter of strategic necessity. There is official support for such a move: Chinese policymakers have expressed confidence that the bulk of outward investment will be undertaken by privately owned firms by the mid-2010s.
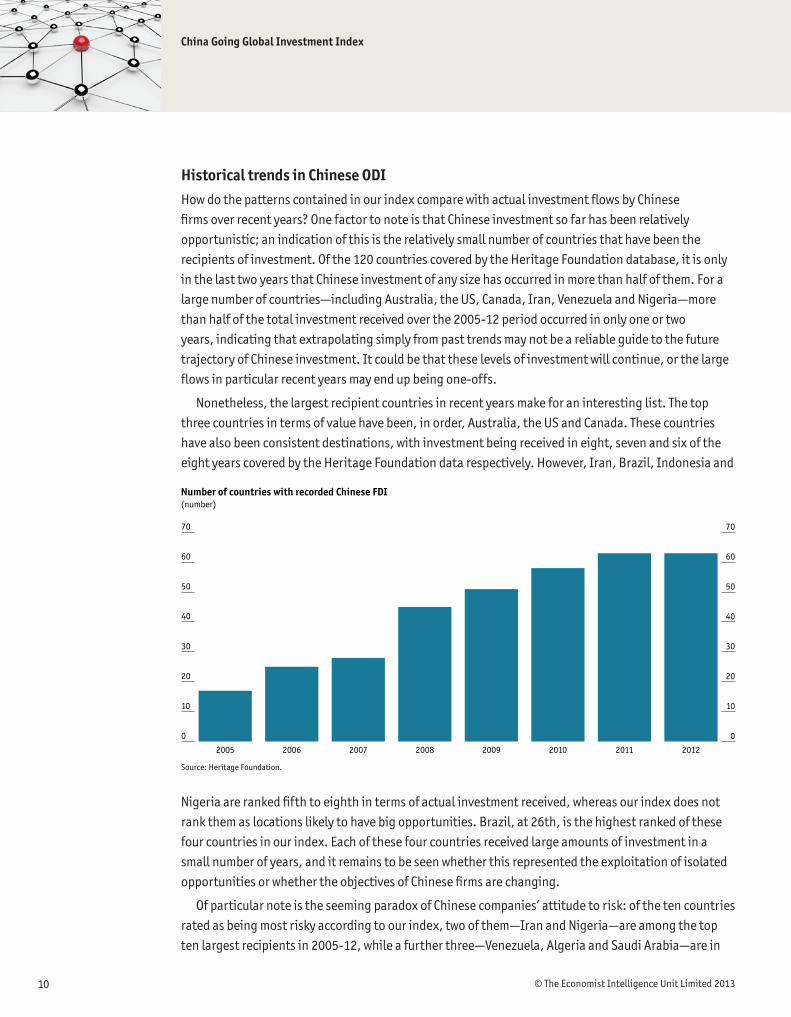
In a related trend, the range of countries now hosting Chinese ODI has broadened, reflecting increasingly diverse motives for the decision to invest abroad. In 2005 Chinese ODI flows were reported in only 17—predominantly resource-rich—countries according to data compiled by the Heritage Foundation. By 2012 that had grown to 63, bringing the total number of countries in which Chinese firms are active to 119.
Aside from seeking natural resources, Chinese investors now cite access to new markets, technology and brands as the primary reasons for setting up shop overseas. An EIU survey conducted in 2010 revealed that the primary motivation for 48% of firms planning an overseas investment was to access new markets. Only 26% cited natural resources as the main driver.
While most large Chinese firms recognise a need to expand abroad, not all are able to articulate a strategy for doing so. Many of those who have made investments have done so opportunistically (for instance, establishing a factory in a particular location because a customer was also located there). That may not be a bad reason for investing initially; entering a foreign country where managers have little experience and no networks is highly risky. Yet, as a company grows its overseas presence, expansion is better guided by strategy than by convenience. The EIU’s China Going Global Investment Index is designed to provide some quantitative evidence to fuel the discussion around this expansion, and to use a robust and data-driven approach to highlight countries where Chinese firms might find good investment options.
“90 percent of global GDP is out there waiting for us.”Feng Jun, President, Aigo, 2013
China Going Global Investment Index
© The Economist Intelligence Unit Limited 2013 5
MethodologyThe EIU’s China Going Global Investment Index is a tool for investors and policymakers alike to benchmark countries according to their perceived attractiveness for Chinese investors. The index is built on two pillars, Opportunity and Risk, reflecting the fact that the expected return presented by an investment must always be weighed against the chance of things going wrong. A brief outline of the methodology is given here, and interested readers are referred to Appendix A for more detail.
The choice of which components and indicators to include in each of these two pillars is based upon the factors that Chinese firms cite as being important in their decision-making. Accordingly, each of the two pillars comprises components chosen on the basis of survey results presented in A Brave New World: The Climate for Chinese M&A Abroad, a publicly available EIU report for which 110 Chinese firms were surveyed and asked, among other things, what were the biggest motivations and challenges for overseas investment.
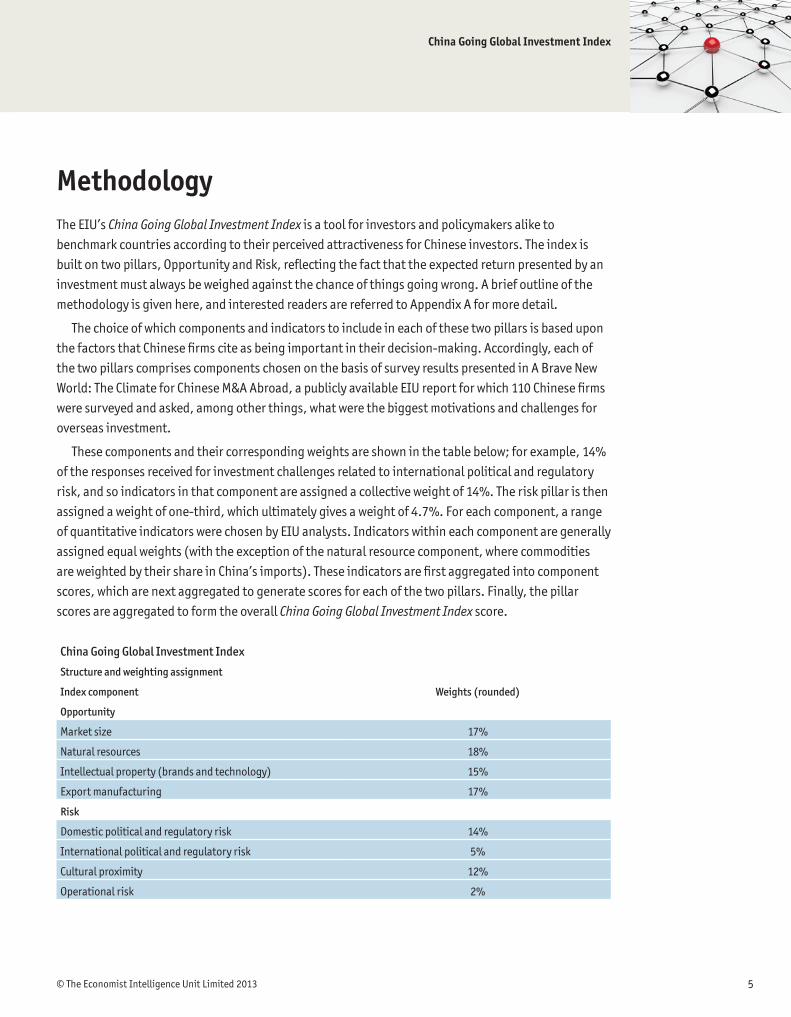
These components and their corresponding weights are shown in the table below; for example, 14% of the responses received for investment challenges related to international political and regulatory risk, and so indicators in that component are assigned a collective weight of 14%. The risk pillar is then assigned a weight of one-third, which ultimately gives a weight of 4.7%. For each component, a range of quantitative indicators were chosen by EIU analysts. Indicators within each component are generally assigned equal weights (with the exception of the natural resource component, where commodities are weighted by their share in China’s imports). These indicators are first aggregated into component scores, which are next aggregated to generate scores for each of the two pillars. Finally, the pillar scores are aggregated to form the overall China Going Global Investment Index score.
China Going Global Investment Index
Structure and weighting assignment
Index component Weights (rounded)
Opportunity
Market size 17%
Natural resources 18%
Intellectual property (brands and technology) 15%
Export manufacturing 17%
Risk
Domestic political and regulatory risk 14%
International political and regulatory risk 5%
Cultural proximity 12%
Operational risk 2%

China Going Global Investment Index
© The Economist Intelligence Unit Limited 20136
For the rankings presented in this report, the Opportunity and Risk pillars are assigned weights of two-thirds and one-third, respectively. There is scope for debate in this final choice of weights as different firms may wish to consider different weightings, depending on their own attitudes towards risk. The online interactive data tool associated with this report, available at (http://www.eiuresources.com/China_investment_2013/), provides readers with the opportunity to consider the impact of different weighting schemes.
The indicators include a mix of data that has both general relevance for investors regardless of their country of origin (such as those on macroeconomic, political and regulatory risk) and more targeted indicators to tailor the index to the preferences of Chinese investors.
For instance, the Opportunity pillar comprises indicators on market size such as GDP and the EIU’s forecasts for economic growth, as well as the number of free-trade agreements signed with China and China’s biggest trading partners. Risk is considered using a number of the EIU’s business environment rankings, which assign quantitative scores to areas ranging from the risk of social conflict to the reliability of the telecommunications network, as well as China-specific indicators such as the number of ethnic Chinese in the host country, the number of Chinese investments rejected by regulators and the historical number of militarised disputes with China. This enables us to assess risk specific to Chinese firms—such as a perceived antipathy towards Chinese investment in some countries—on a rigorous basis and to consider the empirical reality rather than the political rhetoric, which we find are often not in concordance.
All indicators are normalised on a scale of 0 to 100. A total of 53 indicators have been used for the index, a full list of which and their assigned weights can be found in the appendix. 67 countries from all of the world’s continents are covered, with the choice of countries driven by the twin goals of data availability and, as far as data availability allows, a wide and balanced geographical coverage.

China Going Global Investment Index
© The Economist Intelligence Unit Limited 2013 7
RankingsChina Going Global Investment Index
Final ranking
Rank Country Score Rank Country Score
1 US 54.9 35 Thailand 31.0
2 Singapore 48.9 36 Poland 30.8
3 Hong Kong 45.9 37 Bahrain 29.9
4 Japan 43.8 38 Kazakhstan 29.5
5 Australia 43.7 39 Philippines 29.5
6 Canada 43.2 40 Portugal 29.4
7 Switzerland 40.2 41 Vietnam 29.4
8 Norway 39.8 42 Peru 29.3
9 Russia 39.6 43 Libya 29.3
10 Germany 37.7 44 Indonesia 29.0
11 UAE 37.7 45 Jordan 28.6
12 Taiwan 37.7 46 Sri Lanka 28.5
13 Sweden 37.5 47 Pakistan 27.9
14 Denmark 37.3 48 Tunisia 27.7
15 Saudi Arabia 36.7 49 South Africa 27.6
16 Finland 36.4 50 Colombia 27.2
17 New Zealand 36.1 51 Egypt 27.1
18 Malaysia 36.0 52 Bangladesh 27.0
19 United Kingdom 36.0 53 Turkey 27.0
20 France 35.7 54 El Salvador 26.9
21 Netherlands 35.4 55 Dominican Republic 26.8
22 Chile 35.4 56 Greece 26.7
23 Belgium 35.3 57 Iran 26.1
24 Qatar 35.1 58 Venezuela 26.0
25 Austria 34.8 59 Azerbaijan 25.7
26 Brazil 34.4 60 Morocco 25.6
27 Kuwait 34.1 61 Algeria 25.3
28 South Korea 33.4 62 Argentina 24.7
29 Spain 32.9 63 Cuba 24.1
30 Mexico 32.6 64 Ecuador 23.3
31 Israel 32.5 65 Kenya 23.2
32 Costa Rica 32.0 66 Nigeria 22.7
33 India 31.1 67 Angola 22.3
34 Italy 31.0

China Going Global Investment Index
© The Economist Intelligence Unit Limited 20138
The US, Singapore and Hong Kong top our index as the three most attractive destinations for Chinese foreign direct investment (FDI) out of the 67 countries included in our index. Our overall index is based upon the notion that overseas investment will be motivated by a balance between wanting to take advantage of investment opportunities around the world and being mindful of the additional risks inherent in moving into an overseas market; this is particularly the case for Chinese firms, which generally do not have a lot of experience in managing overseas projects.
In our index we have given the opportunity component a weighting of two-thirds, while risk has a weighting of one-third; as noted earlier, readers can use our online data tool to experiment with the impact of different weightings. Within each of these components, the variables included in the index and the weightings assigned to each are chosen on the basis of interviews with Chinese firms. The mix of objectives that actually motivate investment, rather than particular political or other narratives, therefore inform the resulting index and ensure that it is based upon objective criteria that are in concordance with actual business decisions.
This robust and impartial approach produces a list of investment destinations that contains many expected countries, although there are a few surprises and our quantitative method does challenge some elements of received wisdom. The key messages from our index are:
l Countries differ in their elements of strength, and so tailoring the list to a particular company’s objectives may result in a very different ranking.
l Countries with attractive markets tend to perform better than those with only resources, a result which may be partly attributable to the growing role of non-state owned enterprises in overseas investment and their differing motivations.
l Chinese firms are not just interested in frontier markets: many attractive destinations are large and wealthy OECD countries with big domestic markets and valuable brands and technologies.
l Openness to Chinese investment and cultural links with China play a particular role in moving some countries higher or lower in the index, but the empirical view of openness to Chinese investment is sometimes at odds with the political rhetoric.
The country that tops our index, the US, is an attractive destination for firms from all over the world. While there are some differences in motivation, Chinese firms are no exception. The US tops the market size component, scores highly for its endowment of natural resources, has the world’s best stock of existing brands, is highly innovative and has high human capital and a relatively stable business environment.
Yet within China, the US is widely perceived as engaging in protectionism against Chinese firms. The picture is decidedly mixed when one looks at the data. For example, the US does have a large number of trade disputes with China, but compared with the volume of trade, the rate of disputes is relatively low. Furthermore, only 5% of the responses from Chinese firms indicated that international relations were a key factor in making their decisions. For those for whom it is important, the US will be a less attractive destination. However, there is a lot of trade and investment flowing between the US and China that does not make the headlines.

China Going Global Investment Index
© The Economist Intelligence Unit Limited 2013 9
Singapore and Hong Kong also score well for their favourable business environment, openness to trade and strong cultural links to China. In fact, these two countries are scored as the two least risky destinations for Chinese FDI and this, combined with the fact they also score in the top quartile for Opportunity, leads to their high overall performance. These two city economies have high levels of GDP per capita, and while they are not large economies, they provide an excellent base for Chinese firms to access regional and global markets as a result of their good transport infrastructure and open economic policies. Xiaofeng Cheng, Partner in charge of outbound investment at Chinese law firm Jingtian & Gongcheng, further notes that “both Singapore and Hong Kong have large Chinese communities alongside sufficient financial resources, so most Chinese entrepreneurs prefer incorporating a holding entity in this jurisdiction as a platform for their further outbound investment.”
Japan is something of a surprise in fourth place, considering the historical tensions between itself and its larger neighbour. Nonetheless, it is important to note that despite a prolonged period of economic stagnation, it remains the world’s third-largest economy, the world’s top patent holder and a prolific source of innovation. Japan also has good infrastructure, and is close to both China and other major markets. On the other hand, Japan has not traditionally received much FDI in the past, has limited natural resources of interest to Chinese firms and is dragged down by its history of military disputes with China and negative perceptions of China among the Japanese population. While Japan represents the second-largest opportunity for Chinese firms, there are 20 countries in our index that are less risky for Chinese firms, and this leads to its overall position being fourth. Japan may be one country in which qualitative factors, which are difficult to include satisfactorily in an index such as ours, are particularly important to consider alongside the quantitative evidence.
The top ten is rounded out, in order, by Australia, Canada, Switzerland, Norway, Russia and Germany. Australia, Canada and Norway each have an attractive combination of high GDP per capita, good human capital and substantial natural resource endowments, as well as being open to trade. Russia scores highly almost entirely because of its natural resource endowment, although low wages and proximity to major markets also contribute to it being rated as the third biggest opportunity. However, Russia does not score highly in other components of the Opportunities pillar, and is also the 12th most risky location out of the 67 countries in the index. Switzerland and Germany score well because of their access to markets, high levels of GDP per capita, good transport infrastructure, low risk and high levels of innovation.
The bottom three countries in our index are Angola, Nigeria and Kenya. This will probably surprise many readers, who hear that Africa offers a great opportunity for Chinese—and, indeed, global—firms. Although there are individual opportunities in these countries, and for some particular Chinese firms they will be attractive targets, the overall level of opportunity is low. Risky environments, a lack of technology and low per capita income levels make doing business difficult. Although they do have some natural resources, the scale is often small: for example, Angola’s oil reserves are only around 5% as large as those of Venezuela or Saudi Arabia.
China Going Global Investment Index
© The Economist Intelligence Unit Limited 201310
Historical trends in Chinese ODIHow do the patterns contained in our index compare with actual investment flows by Chinese firms over recent years? One factor to note is that Chinese investment so far has been relatively opportunistic; an indication of this is the relatively small number of countries that have been the recipients of investment. Of the 120 countries covered by the Heritage Foundation database, it is only in the last two years that Chinese investment of any size has occurred in more than half of them. For a large number of countries—including Australia, the US, Canada, Iran, Venezuela and Nigeria—more than half of the total investment received over the 2005-12 period occurred in only one or two years, indicating that extrapolating simply from past trends may not be a reliable guide to the future trajectory of Chinese investment. It could be that these levels of investment will continue, or the large flows in particular recent years may end up being one-offs.
Nonetheless, the largest recipient countries in recent years make for an interesting list. The top three countries in terms of value have been, in order, Australia, the US and Canada. These countries have also been consistent destinations, with investment being received in eight, seven and six of the eight years covered by the Heritage Foundation data respectively. However, Iran, Brazil, Indonesia and
Nigeria are ranked fifth to eighth in terms of actual investment received, whereas our index does not rank them as locations likely to have big opportunities. Brazil, at 26th, is the highest ranked of these four countries in our index. Each of these four countries received large amounts of investment in a small number of years, and it remains to be seen whether this represented the exploitation of isolated opportunities or whether the objectives of Chinese firms are changing.
Of particular note is the seeming paradox of Chinese companies’ attitude to risk: of the ten countries rated as being most risky according to our index, two of them—Iran and Nigeria—are among the top ten largest recipients in 2005-12, while a further three—Venezuela, Algeria and Saudi Arabia—are in
Number of countries with recorded Chinese FDI (number)
Source: Heritage Foundation.
0
10
20
30
40
50
60
70
0
10
20
30
40
50
60
70
20122011201020092008200720062005

China Going Global Investment Index
© The Economist Intelligence Unit Limited 2013 11
the top 15. There are three major possibilities for the observation of such a trend: first, it may be that the competitive environment for Chinese firms is more favourable in countries that are often shunned by investors from OECD economies; second, the strong bilateral relations between China and counties that we assess as being more risky may provide advantages, particularly for state-owned enterprises; and, finally, it may be that the high levels of early investment in riskier countries will not persist.
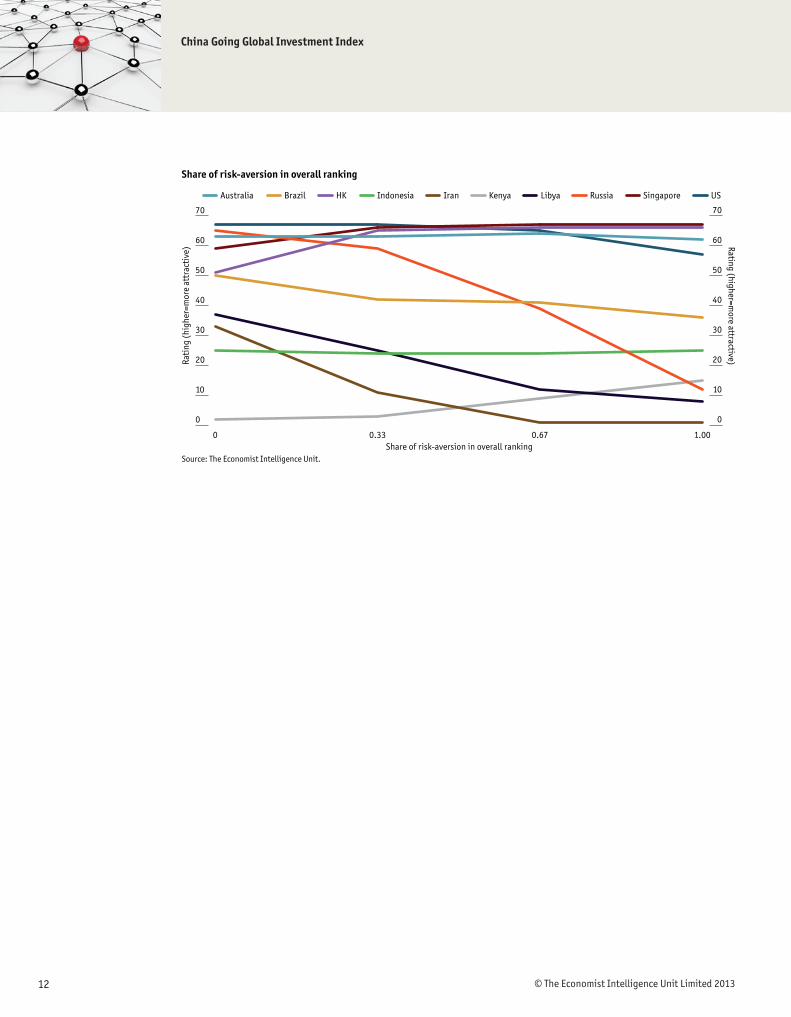
Trading off risk and opportunityRisk and opportunity sometimes – but not always – necessitate a trade-off. In many cases, a stable and low-risk environment supports economic growth which, in turn, provides more opportunities for foreign investors. In other cases, large opportunities – often in the resources sector – are found in countries which present a higher level of risk to Chinese investors. In our index, we use a weight of two-thirds for the size of the opportunity for Chinese firms and a weight of one-third for a country presenting a low-risk destination for Chinese firms. The appropriate combination of these two factors will differ for each individual firm, and perhaps even for each individual investment; interested readers can visit our interactive website to see the impact of different choices. The figure on page 12 illustrates the impact on the ranking for a selection of economies when the balance between risk and opportunity is changed. Some countries – such as Russia, Libya, the US and Iran – fall down the index as the importance given to a low-risk environment increases; while others – such as Hong Kong and Singapore – move up the index.
Total Chinese outbound investment received 2005-12 (nominal US$ bn)
Source: Heritage Foundation.
0
10
20
30
40
50
60
70
80
0
10
20
30
40
50
60
70
80
KazakhstanRussianFederation
BritainNigeriaIndonesiaBrazilIranCanadaUSAAustralia
China Going Global Investment Index
© The Economist Intelligence Unit Limited 201312
Share of risk-aversion in overall ranking
Source: The Economist Intelligence Unit.
0
10
20
30
40
50
60
70
0
10
20
30
40
50
60
70
KenyaIran LibyaIndonesia USSingaporeRussiaHKBrazilAustralia
1.000.670.330
Rati
ng (
high
er=m
ore
attr
acti
ve) Rating (higher=m
ore attractive)
Share of risk-aversion in overall ranking
China Going Global Investment Index
© The Economist Intelligence Unit Limited 2013 13
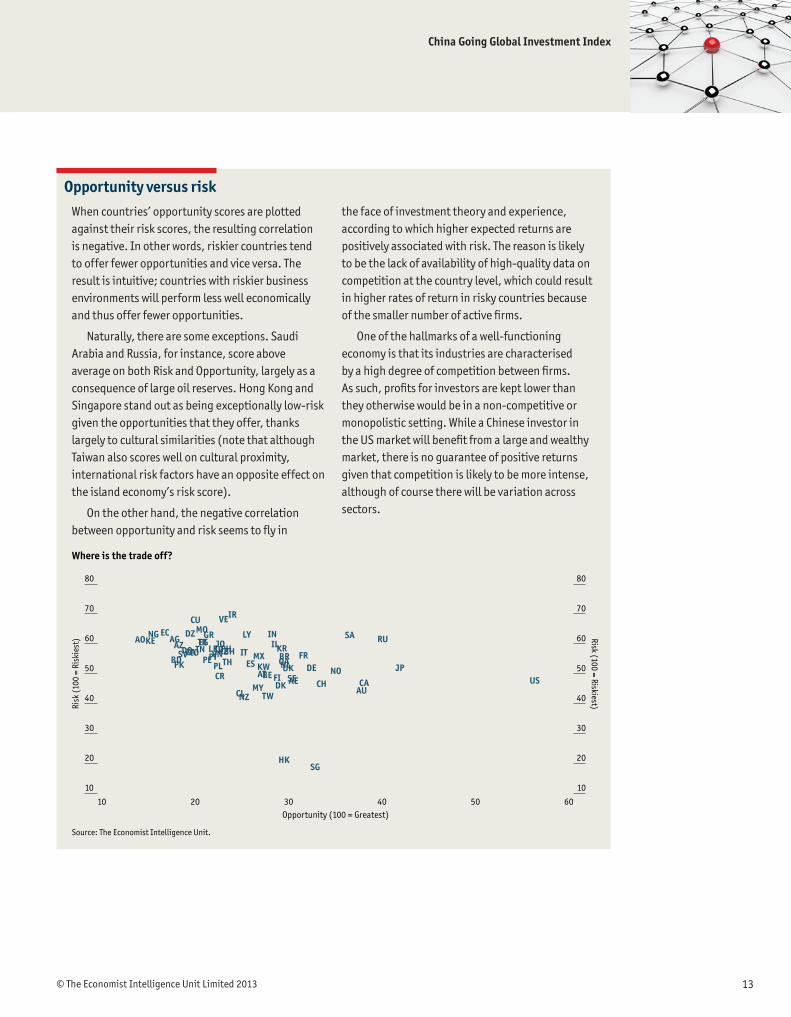
When countries’ opportunity scores are plotted against their risk scores, the resulting correlation is negative. In other words, riskier countries tend to offer fewer opportunities and vice versa. The result is intuitive; countries with riskier business environments will perform less well economically and thus offer fewer opportunities.
Naturally, there are some exceptions. Saudi Arabia and Russia, for instance, score above average on both Risk and Opportunity, largely as a consequence of large oil reserves. Hong Kong and Singapore stand out as being exceptionally low-risk given the opportunities that they offer, thanks largely to cultural similarities (note that although Taiwan also scores well on cultural proximity, international risk factors have an opposite effect on the island economy’s risk score).
On the other hand, the negative correlation between opportunity and risk seems to fly in
the face of investment theory and experience, according to which higher expected returns are positively associated with risk. The reason is likely to be the lack of availability of high-quality data on competition at the country level, which could result in higher rates of return in risky countries because of the smaller number of active firms.
One of the hallmarks of a well-functioning economy is that its industries are characterised by a high degree of competition between firms. As such, profits for investors are kept lower than they otherwise would be in a non-competitive or monopolistic setting. While a Chinese investor in the US market will benefit from a large and wealthy market, there is no guarantee of positive returns given that competition is likely to be more intense, although of course there will be variation across sectors.
Opportunity versus risk
Where is the trade off?
Source: The Economist Intelligence Unit.
10 20 30 40 50 60
10
20
30
40
50
60
70
80
10
20
30
40
50
60
70
80
Risk
(10
0 =
Risk
iest
) Risk (100 = Riskiest)
Opportunity (100 = Greatest)
SGHK
AESEUKNLQABR
KRILIN
IRVE
LY
MXKWATBE FI
DKTW
MYCLNZ
ZADOCOTNEGTR
GRMOCU
DZECNGKEAO AG
AZSV
PKBD ESIT
THPLCR
BHKZPHJOIDVNPTPELK
USJP
RUSA
CAAU
NOCH
FRDE

China Going Global Investment Index
© The Economist Intelligence Unit Limited 201314
Opportunity
The Opportunity component of the index is constructed on the basis of domestic market size, natural resource endowment, the amount of intellectual property and the export manufacturing environment. The creation of components is based on feedback from Chinese investors, who have listed the four components above as the primary motivation for overseas expansion.
The top 10 countries in terms of Opportunity scores reflect economies with a combination of large and fast-growing markets and deep stocks of either intellectual property (US, Japan, and Germany) or natural resources (Russia, Canada, and Australia). However, small countries also have the opportunity to perform well in the index. Singapore’s business-friendly regulations, high-quality port infrastructure and participation in regional trade agreements give it an edge in the export manufacturing component.
Natural resources The narrative about Chinese ODI being predominantly resource-seeking is not new. 46% of Chinese ODI value in 2005-2012 period was accounted for by investments in the energy sector, with another 15% coming from metals, according the Heritage Foundation’s dataset. However, according to the EIU’s survey, only 26% of outbound investors stated that securing access to natural resources was the primary motivation. What accounts for the discrepancy?
There may not be one. Investments in the oil sector tend to be big in value terms, given that extraction and processing are particularly capital-intensive processes. Thus, a handful of investment projects has skewed the picture. Taking the number of deals, rather than their value, as the key measure, the share of Chinese ODI accounted for by energy falls to 33% in 2012.
Top 10 – Opportunity
(100 = Best)Rank Country Score
1 US 56.3
2 Japan 41.9
3 Russia 40.1
4 Canada 38.1
5 Australia 37.9
6 Saudi Arabia 36.6
7 Norway 35.1
8 Switzerland 33.6
9 Singapore 32.8
10 Germany 32.5
China Going Global Investment Index
© The Economist Intelligence Unit Limited 2013 15
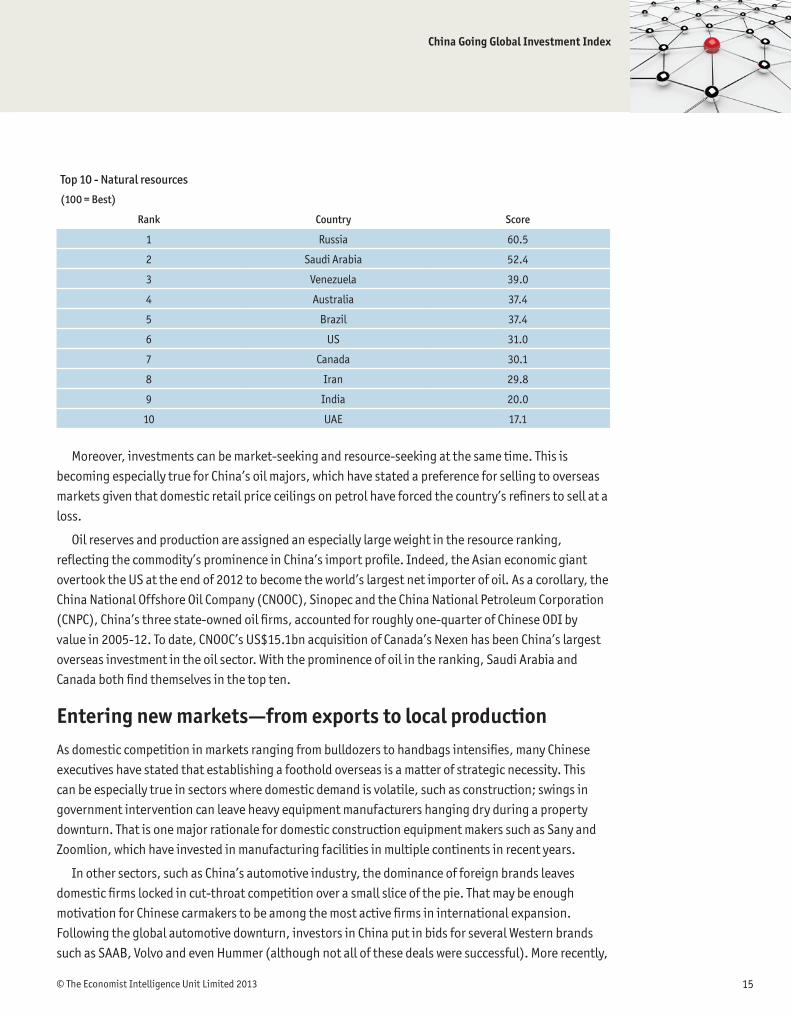
Top 10 - Natural resources
(100 = Best)
Rank Country Score
1 Russia 60.5
2 Saudi Arabia 52.4
3 Venezuela 39.0
4 Australia 37.4
5 Brazil 37.4
6 US 31.0
7 Canada 30.1
8 Iran 29.8
9 India 20.0
10 UAE 17.1
Moreover, investments can be market-seeking and resource-seeking at the same time. This is becoming especially true for China’s oil majors, which have stated a preference for selling to overseas markets given that domestic retail price ceilings on petrol have forced the country’s refiners to sell at a loss.
Oil reserves and production are assigned an especially large weight in the resource ranking, reflecting the commodity’s prominence in China’s import profile. Indeed, the Asian economic giant overtook the US at the end of 2012 to become the world’s largest net importer of oil. As a corollary, the China National Offshore Oil Company (CNOOC), Sinopec and the China National Petroleum Corporation (CNPC), China’s three state-owned oil firms, accounted for roughly one-quarter of Chinese ODI by value in 2005-12. To date, CNOOC’s US$15.1bn acquisition of Canada’s Nexen has been China’s largest overseas investment in the oil sector. With the prominence of oil in the ranking, Saudi Arabia and Canada both find themselves in the top ten.
Entering new markets—from exports to local productionAs domestic competition in markets ranging from bulldozers to handbags intensifies, many Chinese executives have stated that establishing a foothold overseas is a matter of strategic necessity. This can be especially true in sectors where domestic demand is volatile, such as construction; swings in government intervention can leave heavy equipment manufacturers hanging dry during a property downturn. That is one major rationale for domestic construction equipment makers such as Sany and Zoomlion, which have invested in manufacturing facilities in multiple continents in recent years.
In other sectors, such as China’s automotive industry, the dominance of foreign brands leaves domestic firms locked in cut-throat competition over a small slice of the pie. That may be enough motivation for Chinese carmakers to be among the most active firms in international expansion. Following the global automotive downturn, investors in China put in bids for several Western brands such as SAAB, Volvo and even Hummer (although not all of these deals were successful). More recently,

China Going Global Investment Index
© The Economist Intelligence Unit Limited 201316
Top 10 - Market size
(100 = Best)
Rank Country Score
1 US 55.1
2 Qatar 42.4
3 Norway 39.6
4 Libya 34.9
5 Switzerland 33.7
6 Japan 33.6
7 Australia 32.0
8 Germany 27.2
9 Canada 26.5
10 Sweden 25.1
a series of new plants by Chinese auto firms in emerging markets such as India and Brazil have marked efforts to grow organically.
Despite a gloomy economic outlook for most OECD economies, we still find that the developed world leads the market size component of the index, which is based on the host country’s GDP, income per head and projected GDP growth. More importantly, profit margins tend to be higher than in the competitive Chinese market. There are some counter-intuitive cases in the top 10; Qatar’s oil revenue gives it an unusually high GDP per capita, while forecast GDP growth in Libya as it recovers from its recent war makes the North African economy something of an anomaly. Naturally, being a large, rich and fast-growing market does not automatically qualify a country as a great place to invest; that issue is addressed in the Risk pillar of the index.
While the establishment of overseas operations still remains a distant ambition for many Chinese firms, which prefer to export, producing abroad offers unique advantages. Exporting from China may allow managers to control costs better in a familiar production environment, but localised product development allows firms to better cater to local consumer tastes. Many Chinese firms initially learn about foreign tastes through original equipment manufacturer (OEM) relationships, but those seeking to build original product lines for overseas markets have recognised the need to conduct local research
Over the decades, China’s FDI policies have leveraged the attractiveness of its domestic market to extract the most from multinationals. Other emerging markets are now doing the same. When Brazil introduced new measures to discourage imports of cars (which, incidentally, were booming from China), Chinese carmakers such as JAC and
Chery reacted swiftly by announcing plans to establish local production facilities in the Latin American economy. That may give them an edge over their Western rivals, who are still pondering legal action against Brazil at the World Trade Organization over the new policies.
If you can’t beat ’em, join ’em

China Going Global Investment Index
© The Economist Intelligence Unit Limited 2013 17
and development (R&D). For instance, Haier, a pioneer among Chinese firms going global, quickly discovered that Americans prefer larger refrigerators, which it produces in its US plant.
Offshoring, but from ChinaAs production costs—notably wages—rise in China, firms are seeking to relocate manufacturing sites elsewhere, beginning with the most labour-intensive sectors such as apparel and footwear. The World Bank estimated in 2011 that China employs around 85m workers in such low-value-added sectors. Many of these jobs are likely to be transferred elsewhere in the world over the course of the coming decade.
The export manufacturing component of the index gauges countries’ attractiveness as destinations for making products for the rest of the world. The employability of the local workforce is emphasised using a combination of indicators on wages and education. Logistics is a natural concern for manufacturers, and we therefore account for the quality of port infrastructure and the distance between the host country and both China and large, traditional export markets (US, Japan, Germany). The inclusion of a “distance to China” indicator is apparent in the rankings, which are dominated by Asian countries. The number of regional trade agreements participated in by the host country is used as a proxy for ease of market access. Projected inflation and historical exchange rate volatility are used as indicators of macroeconomic stability.
In terms of export manufacturing opportunities, South-east Asian countries are the strongest performers in the index. Lower wages, relatively stable political environments (compared with other developing regions in the world) and proximity to China make them natural destinations for manufacturers searching for a cheaper locale. Hong Kong’s days as a low-cost manufacturing hub are long gone; however, its role as a key logistics hub for China, skilled workforce and excellent trade links mean it remains an attractive base for higher-value production (including in services) and as a distribution centre.
Top 10 - Export manufacturing
(100 = Best)
Rank Country Score
1 Singapore 80.0
2 Hong Kong 73.6
3 Malaysia 72.7
4 South Korea 71.5
5 Philippines 70.6
6 Thailand 69.4
7 Jordan 69.1
8 Taiwan 68.8
9 Vietnam 68.3
10 Israel 67.6

China Going Global Investment Index
© The Economist Intelligence Unit Limited 201318
Brands and technologyIn the past, managers at Chinese firms spent most of their energy slashing costs and engaging in price competition in the domestic market. Nowadays, one would be hard pressed to find a CEO who was not also focusing on building the company brand. Product differentiation through branding is now seen as an invaluable way to increase margins and escape the corporate bloodshed of price wars seen in the past.
Yet a recognised brand takes years to build and minutes to destroy. The same can be said of technology; larger Chinese firms are investing more nowadays in R&D than ever, but innovation can be a slow and uncertain process.
That is why 22% of investors surveyed by the EIU viewed the acquisition of brands and technology as
In 2006 the Chinese government announced the establishment of special economic zones (SEZs) across Africa. Six SEZs are currently under construction in five countries: Zambia, Egypt, Nigeria, Mauritius and Ethiopia. The zones in Ethiopia and Mauritius are 100% Chinese-owned, while the others are joint ventures, mainly with local governments as minority partners. Chinese state-owned and private enterprises, which have thus far invested US$250m in related infrastructure, have been assigned to develop the zones. While the zones were initially slow to get going, more recent progress has been promising.
SEZs are intended to replicate China’s own growth experience, in which a number of export-oriented industrial hubs successfully attracted FDI and became the country’s growth engines. Similarly, both China and African governments hope that the SEZs in Africa will develop into new growth nodes by creating an enabling environment where both local and foreign companies can move in and gradually form industrial clusters. Each zone will focus on a few key industries, mainly in manufacturing and services. Only one zone will concentrate on mineral processing, countering criticism that Chinese interest in Africa is limited to raw material extraction.
China’s special economic zones in Africa
Top 10 - Brands and technology
(100 = Best)
Rank Country Score
1 US 84.3
2 Japan 75.3
3 Germany 44.3
4 France 41.7
5 UK 38.3
6 Switzerland 37.6
7 Canada 35.4
8 Sweden 35.4
9 Netherlands 34.9
10 Denmark 34.3
China Going Global Investment Index
© The Economist Intelligence Unit Limited 2013 19
the primary motivation for future outward investments. Along these lines, the US, Japan and Germany were the winners in the intellectual property component of the index, which emphasises the brand visibility of companies headquartered in a given country, as well as that country’s patent stock. The top 20 of this category is thus comprised exclusively of developed countries.
One peculiar characteristic of Chinese crossborder acquisition strategy is that an overseas acquisition is potentially viewed as a boost to a company’s domestic brand cachet. The acquisition of an iconic British breakfast cereal, Weetabix, by Brightfood was also undertaken with an eye towards boosting Brightfood’s image among consumers at home, where food safety has become a top concern for consumers in recent years.
For Chinese fashion brands, simply having an outlet in fashionable parts of the world may be enough of a domestic PR boost. Bosideng, a men’s clothing company, recently acquired and refurbished a glamorous property just off London’s Oxford Street, and plans to open another outlet on New York’s Fifth Avenue.
Two classic examples of Chinese investors’ brand and technology acquisition strategies at work can be found in Geely’s acquisition of Volvo in 2010 and Lenovo’s purchase of IBM’s PC business in 2005. A general challenge facing any Chinese firm acquiring a premium foreign brand is the question of how to piggyback on the acquired trademark without diluting its value.
Lenovo’s strategy with IBM’s highly-rated Thinkpad line of laptops was first to display both logos on the IBM-designed machines, then gradually to phase out the IBM trademark over a number of years. Moreover, in keeping with IBM’s tried-and-tested Thinkpad design, the Chinese firm managed to allay consumer fears of a potential drop in product quality. The strategy has worked
spectacularly, with Lenovo now the world’s second-largest PC maker and a household name around the world.
For Geely, things were more difficult. The Chinese automotive firm had chosen to maintain Volvo’s presence in the market, which meant it needed to preserve the Swedish carmaker’s reputation for safety and quality. Co-branding internationally was thus out of the question, although plans are in place to develop co-branded vehicles exclusively for the Chinese market. Geely’s hope is that Volvo’s design features and technology will help to set it apart from its domestic competitors. It remains to be seen whether Geely’s strategy will pay off. If it does, it could serve as a valuable model for other Chinese firms facing similar dilemmas.
A delicate balance

China Going Global Investment Index
© The Economist Intelligence Unit Limited 201320
Top 10 – Risk
(100 = Riskiest)
Rank Country Score
1 Iran 69.8
2 Venezuela 68.0
3 Cuba 67.8
4 Morocco 64.7
5 Ecuador 63.8
6 Algeria 63.3
7 India 63.2
8 Libya 63.1
9 Nigeria 63.1
10 Saudi Arabia 63.0
RiskWith a few exceptions, Chinese companies have been active players in the global ODI sphere for less than a decade. That puts them at a considerable disadvantage in comparison with their Western counterparts, which have been around in one form or another for centuries. Indeed, over the past half-millennium, the rulers of the Middle Kingdom have been better known for shunning engagement with
the world rather than seeking it.
The lack of an outward-looking past does not imply that Chinese businesses have been absent beyond the country’s borders. Today there are 80m ethnic Chinese spread across the globe, according to the Overseas Chinese Affairs Council of Taiwan. The Chinese diaspora has in the past played an instrumental role in facilitating the expansion of the country’s overseas commercial networks, and it remains just as relevant today.
Nonetheless, the lack of overseas experience on the part of many Chinese managers has led to a number of costly mishaps that have stemmed from a failure either to comply with local regulations or to adapt to social and cultural norms. (To be fair, the fate that has befallen many overseas business ventures need not necessarily be blamed on inexperienced managers; Chinese firms also have a tendency to invest in relatively high-risk countries with volatile economic and social environments.)
Attitudes toward risk have improved somewhat as Chinese investors learn from their own—and others’—mistakes. In the past, numerous cash-rich investing firms adopted a “guns blazing” approach, making large acquisitions of well-known firms. That approach is now increasingly being shunned in corporate circles. Instead, incremental expansion, beginning with small representative offices and taking minority stakes to test the waters, has become the preferred route.
China Going Global Investment Index
© The Economist Intelligence Unit Limited 2013 21
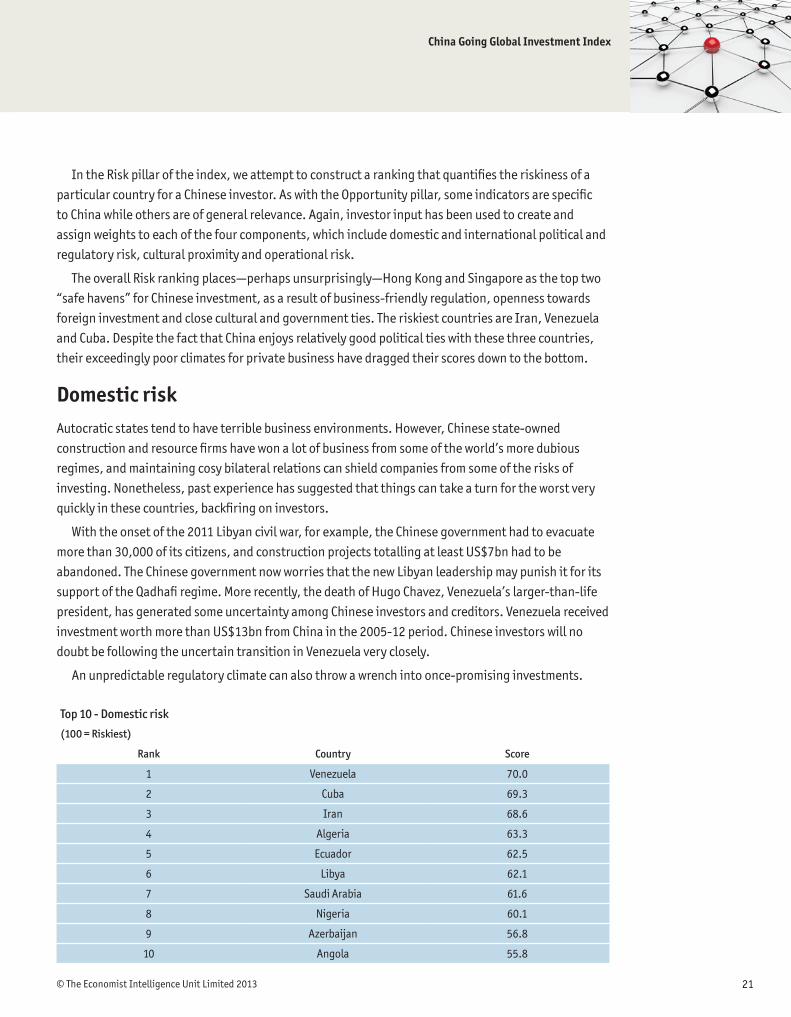
In the Risk pillar of the index, we attempt to construct a ranking that quantifies the riskiness of a particular country for a Chinese investor. As with the Opportunity pillar, some indicators are specific to China while others are of general relevance. Again, investor input has been used to create and assign weights to each of the four components, which include domestic and international political and regulatory risk, cultural proximity and operational risk.
The overall Risk ranking places—perhaps unsurprisingly—Hong Kong and Singapore as the top two “safe havens” for Chinese investment, as a result of business-friendly regulation, openness towards foreign investment and close cultural and government ties. The riskiest countries are Iran, Venezuela and Cuba. Despite the fact that China enjoys relatively good political ties with these three countries, their exceedingly poor climates for private business have dragged their scores down to the bottom.
Domestic riskAutocratic states tend to have terrible business environments. However, Chinese state-owned construction and resource firms have won a lot of business from some of the world’s more dubious regimes, and maintaining cosy bilateral relations can shield companies from some of the risks of investing. Nonetheless, past experience has suggested that things can take a turn for the worst very quickly in these countries, backfiring on investors.
With the onset of the 2011 Libyan civil war, for example, the Chinese government had to evacuate more than 30,000 of its citizens, and construction projects totalling at least US$7bn had to be abandoned. The Chinese government now worries that the new Libyan leadership may punish it for its support of the Qadhafi regime. More recently, the death of Hugo Chavez, Venezuela’s larger-than-life president, has generated some uncertainty among Chinese investors and creditors. Venezuela received investment worth more than US$13bn from China in the 2005-12 period. Chinese investors will no doubt be following the uncertain transition in Venezuela very closely.
An unpredictable regulatory climate can also throw a wrench into once-promising investments.
Top 10 - Domestic risk
(100 = Riskiest)
Rank Country Score
1 Venezuela 70.0
2 Cuba 69.3
3 Iran 68.6
4 Algeria 63.3
5 Ecuador 62.5
6 Libya 62.1
7 Saudi Arabia 61.6
8 Nigeria 60.1
9 Azerbaijan 56.8
10 Angola 55.8
China Going Global Investment Index
© The Economist Intelligence Unit Limited 201322
Algeria was one of fewer than ten sites in Africa initially selected to host Chinese-supported special economic zones. Despite the fanfare that came in 2008 with the announcement of the zone, which was led by a Chinese car company, Jiangling, abrupt changes in foreign investment regulations the following year led to the cancellation of the project in 2010.
Rich countries also present risks of their own. In particular, many Chinese investors have been shocked and puzzled by the extent of safety, environmental and labour regulation in a number of European countries. For instance, a highway construction project in Poland collapsed after the contractor, China Overseas Engineering Group, pulled out owing to severe cost overruns. Among the items for which the firm had failed to budget were passages under the highway to facilitate the movement of the local frog population.
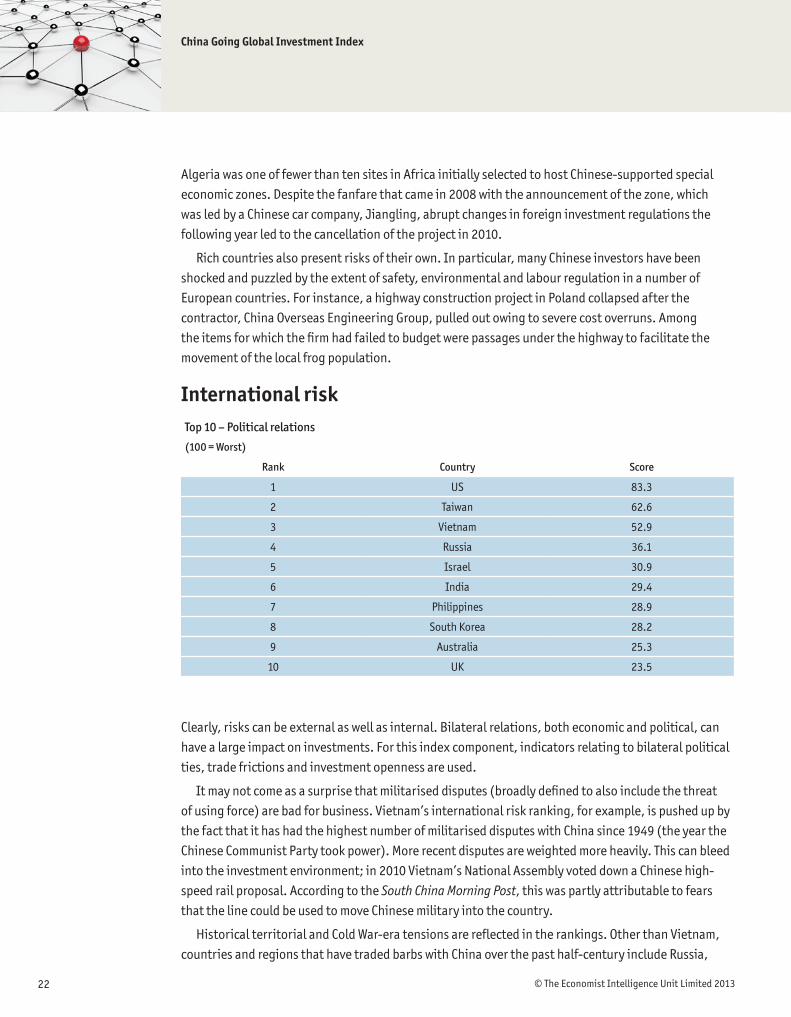
International risk
Clearly, risks can be external as well as internal. Bilateral relations, both economic and political, can have a large impact on investments. For this index component, indicators relating to bilateral political ties, trade frictions and investment openness are used.
It may not come as a surprise that militarised disputes (broadly defined to also include the threat of using force) are bad for business. Vietnam’s international risk ranking, for example, is pushed up by the fact that it has had the highest number of militarised disputes with China since 1949 (the year the Chinese Communist Party took power). More recent disputes are weighted more heavily. This can bleed into the investment environment; in 2010 Vietnam’s National Assembly voted down a Chinese high-speed rail proposal. According to the South China Morning Post, this was partly attributable to fears that the line could be used to move Chinese military into the country.
Historical territorial and Cold War-era tensions are reflected in the rankings. Other than Vietnam, countries and regions that have traded barbs with China over the past half-century include Russia,
Top 10 – Political relations
(100 = Worst)
Rank Country Score
1 US 83.3
2 Taiwan 62.6
3 Vietnam 52.9
4 Russia 36.1
5 Israel 30.9
6 India 29.4
7 Philippines 28.9
8 South Korea 28.2
9 Australia 25.3
10 UK 23.5

China Going Global Investment Index
© The Economist Intelligence Unit Limited 2013 23
India, the Philippines, Taiwan and the US. The largest surprise is that Japan does not appear in the top 10 for this component (it is ranked 11th), given the recent escalation in tensions surrounding the Senkaku Islands (known as the Diaoyu Islands in China). This is attributable to the data not capturing the recent conflicts: we would expect Japan to become a more risky country on this measure as new data become available.
Aside from militarised disputes, we also use scores calculated on the basis of UN General Assembly voting over the past decade as an indicator for how closely aligned countries are with China on international issues. This provides a useful proxy for the likelihood that the two nations may become involved in an international clash based on diverging national interests and ideologies. The US and Israel come in last on this indicator, voting differently from China, while South-east Asian countries tend to vote more similarly.
Trade frictions and investment opennessChinese managers often complain that their firms are discriminated against by regulators in the West. It is not hard to see why this suspicion exists; the US and EU have imposed anti-dumping and anti-subsidy duties on imports from China on 95 and 60 separate occasions respectively since China joined the World Trade Organization (WTO) in 2001, accounting for 30% of the total. The two Western economies have also respectively launched a total of 15 and six WTO dispute settlement cases against China, accounting for 70% of the global total.
That may seem like a lot of cases—enough to set off alarm bells over protectionism. However, no economies import more from China than the US and EU. In fact, if one adjusts the data for imports, the picture becomes very different. For every US$1m worth of imports over the 2002-12 period, the US and EU imposed 0.04 and 0.03 trade defence measures on China respectively. That compares with 1.24 for Argentina (the highest) and 0.61 for Turkey (the second-highest).
The same logic can be applied to investment. US regulators or politicians have rejected at least seven major acquisitions from China since 2005—more than any other country. However, we count at
Top 10 - Economic relations
(100 = Worst)
Rank Country Score
1 US 53.8
2 India 52.7
3 Mexico 44.2
4 South Korea 42.2
5 Colombia 41.0
6 Philippines 40.6
7 Taiwan 40.5
8 Canada 37.0
9 Brazil 36.5
10 Israel 36.0

China Going Global Investment Index
© The Economist Intelligence Unit Limited 201324
least 71 major investment projects (valued at more than US$100m) that were not rejected—also the world’s highest number.
Thus, for the sake of fairness, we use both rejected and non-rejected investments as indicators for investment openness. Countries that do not currently have a bilateral investment treaty in force with China (notable examples include the US and Russia) are penalised. Anti-dumping and countervailing duties per unit of imports, as well as number dispute settlement cases launched against China, serve as building blocks for the trade frictions sub-index.
Cultural proximity
A total of 37% of investors surveyed by the EIU cited cultural differences as the leading challenge in managing overseas acquisitions. However, cultural differences are difficult to measure. Language barriers are an obvious impediment, but so are more subtle differences in business culture. Chinese managers often complain, for instance, about differences in what are considered acceptable working hours.
To quantify cultural proximity, indicators used include the proportion of the population that is ethnically Chinese and the stock of Chinese-born migrants (as a proxy for Chinese speakers). Having local networks with a shared language or cultural background can be a powerful force for business. Networks can help to acquire new clients and educate new arrivals about local dos and don’ts. They can also provide a useful pool from which to recruit new employees.
Also included is an indicator that quantifies attitudes towards China–the proportion of population that views China favourably—provided by a polling agency, Pew Research. This indicator provides an indication of the risk emanating from potential anti-Chinese sentiment, which has recently culminated in violence in various countries, including Algeria, Papua New Guinea and the Solomon Islands. Finally, countries or regions that use Chinese as an official language (Hong Kong, Taiwan and Singapore)
Top 10 - Cultural proximity
(0 = Most culturally similar)
Rank Country Score
1 Singapore 28.0
2 Hong Kong 33.6
3 Taiwan 58.6
4 Malaysia 64.2
5 US 68.8
6 Thailand 74.3
7 Pakistan 75.0
8 Bangladesh 77.4
9 Kenya 78.4
10 Australia 78.7

China Going Global Investment Index
© The Economist Intelligence Unit Limited 2013 25
receive bonus points. Unsurprisingly, the highest-ranked countries for cultural proximity tend to be in Asia, with the exception of the US, which boasts a large ethnic Chinese population, and Kenya, where China is viewed very favourably.
China: The world’s largest exporter of... jobs?China is at a turning point in its economic relationship with the world. Its current-account surplus, at 2.7% of GDP in 2012, is now closer to balance than it has been at any point in the past decade, and will probably continue to fall: indeed, the EIU forecasts that China’s current account will switch into deficit in 2016. Over the half-decade, China is likely to become a net investor in the world as direct investment outflows overtake inflows.
Just as China has benefitted immensely from FDI inflows over the past three decades, the world stands to gain from Chinese capital and technology. To some extent, the rise of Chinese ODI represents the reversal of a trend that began with the country’s economic awakening in the 1980s. In subsequent decades, Western politicians bemoaned the “giant sucking sound” of jobs being transferred to China. How times change. Chinese capital has begun to flow out of the country, and with capital comes jobs.
Rising wages in China mean that labour-intensive firms will seek to move production to less expensive locations—a process that has already begun, with the migration of China’s garments industry to countries such as Bangladesh and Vietnam. As industry in China moves up the technological ladder, opportunities for other low-wage countries to attract FDI are substantial.
It is not just in labour-intensive sectors that this shift will happen, but also in capital-intensive ones. For instance, China’s oil majors have stated a preference for overseas markets, given that domestic retail price ceilings on petrol cause them to sell at a loss. Moreover, as state resource firms become more profit-driven they will seek to rationalise their supply chains. China currently imports vast amounts of unprocessed natural resources from around the world for domestic processing: that makes little economic sense. Chinese-owned steel mills are thus springing up in iron-rich countries, as are refineries in oil-rich locations.
Chinese firms’ appetite for going global is thus set to be one of the defining themes of the global economy in the current decade. The challenge for host country governments, particularly those in developing countries, will be to formulate and implement strategies to ensure that their own businesses and consumers gain the most from it. In doing so, they may consider taking a leaf from China’s playbook, where the government has micro-managed FDI projects to the point of handpicking local joint venture partners and ensuring that as much technology as possible is transferred from multinationals.
At the same time, it would be wise to avoid giving Chinese investors the impression that they are unwelcome or discriminated against. Again, the key is to have a well-articulated FDI policy so that rules are clear and implemented with as little exception as possible. Moves to blacklist certain Chinese companies in the US, for instance, have been particularly unhelpful, as have efforts to exclude China from a web of bilateral and regional trade agreements.
The stakes are high. Despite recurring spats over trade and outsourcing, the developed world has,
China Going Global Investment Index
© The Economist Intelligence Unit Limited 201326
on balance, endured the structural economic shocks emanating from the proverbial “bull in the China shop” reasonably well. To adopt a policy of disengagement now would see those decades of often-painful transition laid to waste, just at a time when the benefits of China’s participation in globalisation are becoming apparent.

China Going Global Investment Index
© The Economist Intelligence Unit Limited 2013 27
Appendix A - Index structure and data sourcesWeight (%) Source Period
OPPORTUNITY
Host country market
GDP, US$ bn at market exchange rates 5.6 EIU 2011
GDP per head, US$ at market exchange rates 5.6 EIU 2011
Real GDP growth, three-year forecast 5.6 EIU 2011-2014
Natural resources
Natural gas reserves 0.4 BP Statistical Review 2011
Crude oil reserves 5.0 BP Statistical Review 2011
Coal reserves 0.5 BP Statistical Review 2011
Iron ore reserves 2.8 USGS 2011
Copper reserves 0.4 USGS 2011
Natural gas production 0.4 BP Statistical Review 5-year sum to 2011
Crude oil production 5.0 BP Statistical Review 5-year sum to 2012
Coal production 0.5 BP Statistical Review 5-year sum to 2013
Iron ore production 2.8 USGS 5-year sum to 2014
Copper production 0.4 USGS 5-year sum to 2015
Intellectual property
Number of patents in force 4.9 WIPO 2001-2011
Innovation inputs and environment 4.9 EIU innovation index 2004-2008
Number of brands in top 500 4.9 Brand Finance 2011
Export manufacturing
Number of regional trade agreements (RTAs) signed with China’s largest
export markets1.9 WTO 2011
Number of RTAs signed with China 1.9 WTO 2011
Quality of port infrastructure 1.9 EIU 2012-2017
Distance between host country and large markets 1.9 CEPII 2011
Distance to China 1.9 CEPII 2011
Average hourly wage 1.9 EIU 2011
Average years of schooling of population over 15 1.9 Barro Lee 2010
Exchange-rate volatility 1.9 Financial Times 2011
Forecast inflation 1.9 EIU 2011-2014
RISK
Domestic political and regulatory risk
Risk of armed conflict 1.4 EIU 2012-2017
Risk of social conflict 1.4 EIU 2012-2017
Risk of expropriation of foreign assets 1.4 EIU 2012-2017

China Going Global Investment Index
© The Economist Intelligence Unit Limited 201328
Weight (%) Source Period
OPPORTUNITY
Domestic political and regulatory risk
Government regulation on setting up new private business 1.4 EIU 2012-2017
Restrictiveness of labour laws 1.4 EIU 2012-2017
Extent of wage regulation 1.4 EIU 2012-2017
Hiring of foreign nationals 1.4 EIU 2012-2017
Government policy towards foreign capital 1.4 EIU 2012-2017
FDI inflows as % of GDP 1.4 EIU 2011
External debt as % of GDP 1.4 BIS/EIU 2011
International political and regulatory risk
Bilateral relations
Voting affinity with China in UN General Assembly 0.5 Erik Voeten 2001-2011
Number of militarised disputes with China since 1949 0.5 COW 1949-2001
Number of militarised disputes with China since 1978 0.5 COW 1978-2001
Trade frictions
Number of anti-dumping and anti-subsidy cases against China per US$
m of imports from China0.5 WTO 2005-2012
Number of WTO dispute settlement cases against China 0.5 WTO 2005-2013
Number of anti-dumping and anti-subsidy cases against local country
by large markets per US$m of imports0.5 WTO 2005-2014
Investment openness
Number of rejected investments from China 0.5 Heritage Foundation 2005-2012
Number of non-rejected investments from China 0.5 Heritage Foundation 2005-2013
Bilateral investment treaty with China in force 0.5 World Bank Ongoing
Cultural affinity
% of population viewing China favourably 3.1 Pew 2007/2011
Ethnic Chinese as % of total population 3.1 OCAC 2011
Stock of Chinese-born migrants 3.1 World Bank 2011
Chinese language use 3.1 CIA 2011
Operational risk
Incidence of strikes 0.4 EIU 2012-2017
Production of electricity per head 0.4 EIU 2012-2017
Road density 0.4 EIU 2012-2017
Rail density 0.4 EIU 2012-2017
Fixed line telephone faults 0.4 EIU 2012-2017
China Going Global Investment Index
© The Economist Intelligence Unit Limited 2013 29
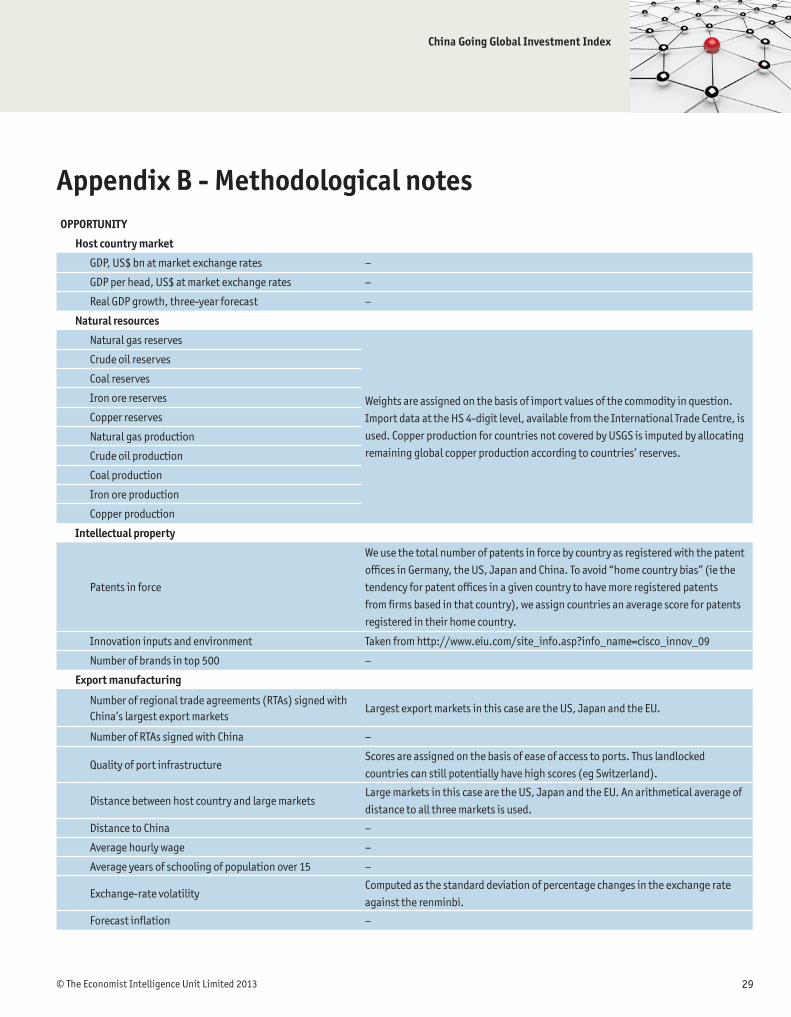
Appendix B - Methodological notesOPPORTUNITY
Host country market
GDP, US$ bn at market exchange rates –
GDP per head, US$ at market exchange rates –
Real GDP growth, three-year forecast –
Natural resources
Natural gas reserves
Weights are assigned on the basis of import values of the commodity in question.
Import data at the HS 4-digit level, available from the International Trade Centre, is
used. Copper production for countries not covered by USGS is imputed by allocating
remaining global copper production according to countries’ reserves.
Crude oil reserves
Coal reserves
Iron ore reserves
Copper reserves
Natural gas production
Crude oil production
Coal production
Iron ore production
Copper production
Intellectual property
Patents in force
We use the total number of patents in force by country as registered with the patent
offices in Germany, the US, Japan and China. To avoid “home country bias” (ie the
tendency for patent offices in a given country to have more registered patents
from firms based in that country), we assign countries an average score for patents
registered in their home country.
Innovation inputs and environment Taken from http://www.eiu.com/site_info.asp?info_name=cisco_innov_09
Number of brands in top 500 –
Export manufacturing
Number of regional trade agreements (RTAs) signed with China’s largest export markets
Largest export markets in this case are the US, Japan and the EU.
Number of RTAs signed with China –
Quality of port infrastructureScores are assigned on the basis of ease of access to ports. Thus landlocked
countries can still potentially have high scores (eg Switzerland).
Distance between host country and large marketsLarge markets in this case are the US, Japan and the EU. An arithmetical average of
distance to all three markets is used.
Distance to China –
Average hourly wage –
Average years of schooling of population over 15 –
Exchange-rate volatilityComputed as the standard deviation of percentage changes in the exchange rate
against the renminbi.
Forecast inflation –

China Going Global Investment Index
© The Economist Intelligence Unit Limited 201330
RISKS
Domestic political and regulatory risk
Risk of armed conflict –
Risk of social conflict –
Risk of expropriation of foreign assets –
Government regulation on setting up new private business –
Restrictiveness of labour laws –
Extent of wage regulation –
Hiring of foreign nationals –
Government policy towards foreign capital –
FDI inflows as % of GDP –
External debt as % of GDPFor countries where the latest BIS data are unavailable we use EIU estimates. An
initial comparison of the two datasets suggests that they are compatible.
International political and regulatory risk
Bilateral relations
Voting affinity with China in UN General Assembly Average voting affinity scores, or “S3”, over the 2001-11 period.
Number of militarised disputes with China since 1949 Note: The definition of a militarised dispute does not require actual military conflict,
but merely a display of force. Wars are not classified as militarised disputes.Number of militarised disputes with China since 1978
Trade frictions
Number of anti-dumping and anti-subsidy cases
against China per US$ m of imports from ChinaIncludes only measures imposed, not initiations.
Number of WTO dispute settlement cases against China Third parties and observers not included in the final count.
Number of anti-dumping and anti-subsidy cases
against local country by large markets per US$m of
imports
Includes only measures imposed, not initiations. Large markets defined as the US,
Japan and the EU.
Investment openness
Number of rejected investments from ChinaIncludes only investments that were blocked by host country regulators or
politicians.
Number of non-rejected investments from China –
Bilateral investment treaty with China in force –
Cultural affinity
% of population viewing China favourably
2011 data used as primary source. 2007 data used where 2011 data are unavailable,
adjusted for change over time (calculated using same-country change). Missing
data are imputed by using regional averages.
Ethnic Chinese as % of total population –
Stock of Chinese-born migrants –
Chinese language useCountries in which Chinese is an official language are assigned full points (100).
Other countries receive zero.

China Going Global Investment Index
© The Economist Intelligence Unit Limited 2013 31
Operational risk
Incidence of strikes –
Production of electricity per head –
Road density –
Rail density –
Fixed-line telephone faults –

Cover image - © 3DProfi/Shutterstock
While every effort has been taken to verify the accuracy of this information, The Economist Intelligence Unit Ltd. cannot accept any responsibility or liability for reliance by any person on this report or any of the information, opinions or conclusions set out in this report.
LONDON20 Cabot SquareLondon E14 4QWUnited KingdomTel: (44.20) 7576 8000Fax: (44.20) 7576 8500E-mail: [email protected]
NEW YORK750 Third Avenue5th FloorNew York, NY 10017United StatesTel: (1.212) 554 0600Fax: (1.212) 586 1181/2E-mail: [email protected]
HONG KONG6001, Central Plaza18 Harbour RoadWanchai Hong KongTel: (852) 2585 3888Fax: (852) 2802 7638E-mail: [email protected]
GENEVARue de l’Athénée 321206 GenevaSwitzerlandTel: (41) 22 566 2470Fax: (41) 22 346 93 47E-mail: [email protected]