china offshore wind hotspot - wwfassets.wwf.no/...an_emerging_offshore_wind_hotspot... · with a...
TRANSCRIPT

China:
An Emerging Offshore
Wind Development Hotspot
With a new assessment of China’s offshore wind potential
Prepared by:
WWF 2010

ii
Date: August 2010
This report was commissioned by:
WWF China Programme Office
Beijing Working People‟s Culture Palace
(Laodong Renmin Wenhuagong Dongmen)
Bejing 100006, P.R. China
www.wwfchina.org
This report was prepared by:
Chinese Wind Energy Association
Floor 11, 28 North 3rd
Ring Rd East, Beijing, P.R. China
www.cwea.org.cn
Authors:
CWEA Chinese Wind Energy Association: Qin Haiyan, Liu Mingliang, Wang Yao, Zhao Jinzhuo
Sun Yatsen University: Dr. Zeng Xuelan
Editors:
Rasmus Reinvang, WWF.
Rachel Enslow and Hubert Beaumont, Azure International, Beijing.
© Copyright: WWF Norway, www.wwf.no
ISBN: 978-82-90980-44-2
This report is part of a WWF project receiving support from
the Norwegian Agency of Development Cooperation (Norad).

iii
EXECUTIVE SUMMARY
Background
China‟s economic growth and rapid urbanization during the 21st century has required
substantial energy consumption. Between 2001 and 2007 this growth was fueled by 92.7% traditional fossil fuels, consumption of which has a damaging impact on the environment. In 2007, coal, one of the most polluting fossil fuels, accounted for 69.5% of China‟s energy consumption. In order to maintain considerable economic progress, China needs to utilize energy resources with less damaging environmental impact. One opportunity to provide the country with clean, renewable energy is to utilize China‟s wind energy potential.
The 21st century‟s acceleration of urbanization and economic growth has not only required
China to consume large amounts of environmentally damaging fossil fuels, it has also put increasing pressure on China to maintain its energy security. Since 2001, China‟s energy supply shortage has continued to increase with only slight decreases during the 2008 financial crisis. The energy shortage peaked in 2007 with a total of 302 million tons of coal equivalent (Mtce), a 20% increase over the previous year.
1 It is predicted that if China stays on its current
track, the total energy consumption of China will reach 5 billion tce in 2020.2 In order to bridge
the energy shortage gap China has the choice to use traditional energy sources such as coal, which would cause further environmental degradation, or promote and develop non-traditional energy resources such as renewable energy.
The Chinese government is taking a proactive approach towards energy and power supply to support economic growth while reducing environmental impact and degradation. This requires not only energy restructuring, such as phasing out small coal fire power plants and introducing renewable energy sources, but also cutting down on energy consumption through energy efficiency initiatives. Two of the major political milestones along this path were the passing of the Renewable Energy Law in China in 2006 and the “Medium-Long Term Development Plan for Renewable Energy” (2007) which requires 15% non-fossil fuel energy sources by 2020.
Mr. Hu Jintao, President of the P.R. of China, further emphasized China‟s commitment to reducing climate change on September 22, 2009 at a UN Summit on Climate Change by announcing internationally that China will meet its goal of 15% of its primary energy from non-fossil energy sources such as nuclear and renewables by 2020. On November 11, 2009 Mr. Wen Jiabao, Premier of the P.R. of China, convened a conference to discuss how China will address climate change, announcing a goal for China to commit to reducing carbon dioxide emissions per unit of GDP by 40-45% of 2005 levels by 2020.
Wind energy, an industry which has doubled installations in China every year since 2006, is one of many energy sources that China is actively promoting to meet the renewable energy and carbon emission reduction goals. Onshore wind development has been rapid and successful in China, doubling in installed capacity every year since 2006 and reaching an installed cumulative capacity of 26GW
3 by 2009. However, the land required for such
development is located mostly in the north and northwest of China - far from the highly dense populations along the coast. This requires large amounts of electricity to be transmitted across the country for use. Guangdong province (pop. 110 million, 2005), which imports the most energy of the coastal provinces, had to import 24% of its consumed energy in 2008. Offshore wind energy provides a strong opportunity to deliver clean energy to coastal regions, thereby relieving pressure on the long-distance, west-to-east transmission projects.
1 State Statistics Bureau, 2009
2 Statistical Communiqué of the People's Republic of China on the 2008 National Economic and Social Development
National Bureau of Statistics of China, February 26, 2009 3 Including installed offshore wind capacity of 102MW.

iv
Offshore wind resource potential - background
The offshore wind industry is ramping up in China with at least 11.9GW in the development pipeline and an invitation for offshore wind project tendering on 18 May 2010. This study provides wind speed and energy density maps along with estimates of the wind energy technical potential within 100km of the Chinese coast in order to assist the identification of key wind resource areas for China‟s offshore wind development. The wind resource analysis seeks to improve upon previous studies by estimating the wind energy generation potential for offshore wind power in China.
The study models how much energy offshore wind can produce along China‟s coast up to 100km from the shore by calculating the energy output of theoretical wind farms by applying the power curve of a 3MW turbine at a 100m hub height. In addition the study further expands by giving special consideration to the deep-sea offshore potential at +50m water depths. While deep-sea offshore technology is not yet commercially viable it is an area with great potential. The study focuses particularly on the coastline from Shandong down to Hainan.
It should be noted that meteorological data collection and management in China has been subject to considerable improvements and modifications in the past years, and as a consequence the data available is not always reliable or consistent over time. There is also a lack of information necessary to correct the meteorological data which goes back to 1970. Such areas of uncertainty are not unusual for a study like this and it is today impossible to provide much more accurate results.
Typhoons pose a significant risk to offshore wind farm development along China‟s southern coast. In order to prevent the data and maps from being affected by the occasional extreme wind speeds, the data for the annual average wind speed was adjusted to remove the influence of typhoons. Energy density and technical potential data is not skewed by extreme wind speeds which are above turbine cut out wind speeds. Therefore the maps and data can be considered as representative of a standard year without typhoons.
The final results provide very good indication of the offshore wind resource in China when comparing one area to the other. The report can therefore be used as a tool to identifying most interesting provinces and locations for offshore wind development. Nevertheless the absolute number indicating how much energy could potentially be produced is given for indication. The absolute numbers in this report should only be used for estimation of the market‟s growth potential and preliminary identification of attractive areas.
This report does not assess the offshore wind farm development from an economic standpoint. This information may be integrated in future reports to assess an economic potential based on more sufficient data.
Offshore wind resource potential - results
The strongest wind speeds in China are found in the Taiwan Strait off the coast of Fujian, followed by Zhejiang, and the west coast of Hainan. In Fujian the wind speeds reach up to 9 -10m/s at 100m hub heights, similar to those found in the North Sea in Europe due to the funnel effect of the straight. There is also good wind resource off the coast of Guangdong, reaching up to 9m/s. Otherwise in Shandong and Jiangsu the offshore wind speeds at 100m range mostly between 7m/s and 8.5m/s. In summary, Fujian, Zhejiang and Hainan stand out with the highest offshore wind speeds in China while Guangdong also shows significant potential. Even though current offshore wind development is mainly taking place in Fujian and Jiangsu, this study shows that the potential is likely even greater in other provinces.

v

vi

vii
The technical potential is the amount of energy that could be generated if wind farms were evenly spaced all along the coast and the energy density is the technical potential per unit of area, as is shown in the map above. In order to more accurately predict the energy generation potential for offshore wind farm development, areas with annual average wind speeds lower than 7m/s were not included in the calculation of the technical potential.
China's Offshore Wind Speed and Energy Density Ranges per Province
Annual average
wind speed range (m/s)
Energy density
range (GWh/km2)
Shandong 7.0-8.5 15-24
Jiangsu 6.5-8.5 14-24
Zhejiang 6.5-9.5 13-30
Fujian 7.0-10.2 15-36
Guangdong 7.0-9.0 15-27
Hainan 6.5-9.0 12-30
Source: Sun Yat-sen University
The total technical potential of China along the entire coast from Liaoning to Hainan is 11,580TWh/year. In this study the focus is on provinces from Shandong to Hainan, which have a technical potential of 9,735TWh/year including the resources available on islands. The greatest technical potential is in Guangdong, with 2,007TWh/year followed very closely by Fujian (1,989TWh/year) and Hainan (1,944TWh/year). If just considering areas within 30m water depths, then Shandong (990TWh/year), Guangdong (859TWh/year) and Jiangsu (803TWh/year) have the largest technical potentials.
China's Technical Offshore Wind Potential per Province with 100km from Shore (TWh)
Water Depth 0-10m 10-30m 30-50m 50-70m >70m Total Total (Islands inc.)
Shandong 167 823 301 203 23 1,517 1,536
Jiangsu 322 481 24 0 0 827 837
Zhejiang 267 372 304 280 61 1,284 1,330
Fujian 152 512 557 652 116 1,989 2,031
Guangdong 219 640 715 278 155 2,007 2,049
Hainan 63 213 264 404 1,000 1,944 1,954
Total 1,190 3,041 2,166 1,816 1,354 9,568 9,735
Source: Sun Yat-sen University
Offshore Technical Potential
0-10m
10-30m
30-50m
50-70m
>70m
0
200
400
600
800
1000
1200
1400
1600
1800
2000
Guangdong Fujian Hainan Shandong Zhejiang Jiangsu
Provinces
Annual E
nerg
y P
ote
ntial (T
Wh)
Source: Sun Yat-sen University
As new technology develops, offshore wind farms can be developed in deeper waters

viii
potentially using floating technology. Hainan, Guangdong and Fujian have most of their wind resource in water deeper than 50m. In particular 72% of Hainan‟s total wind resource is located in water depths greater than 50m and 51% in water depths greater than 70m. Fujian follows Hainan with 39% of its wind resource in water depths above 50m. The west coast of Hainan may be interesting for deep sea offshore development as its wind speeds are higher than on the eastern shore and the area is also more protected from the effects of typhoons.
Typhoons may pose a challenge to offshore wind farm development in southern China, as they often destroy wind turbine blades, and damage nacelles and towers. Therefore wind farm development will have to overcome the challenging hurdle of designing equipment that can withstand the destructive wind speeds in order to fully develop in provinces such as Guangdong, Hainan, and Fujian. Guangdong has had the highest occurrence of typhoons in the last 50 years, with approximately 160 typhoons coming on land. The wish to avoid risks of typhoons contributes to push early offshore development towards Shandong and Jiangsu.
Offshore Wind Policy
Due to the offshore wind industry being in early stages of development, there are very limited policies directed specifically at the offshore wind industry. However, several onshore wind policies will help encourage the development of this industry. Policies directed at encouraging manufacturers include special tax refunds for key parts and raw materials, R&D support for equipment development and a 15% income tax levy for „high tech‟ enterprises. The Chinese government also tries to create a stable and supportive wind development environment through mandatory installation requirements, wind concession projects, value-added-tax levied at 50%, and mandatory grid connection and power purchase. Although there is already a feed-in tariff for onshore wind, the long term feed-in tariff for offshore is still unclear and will likely be set after successful completion of the concession projects which are now underway.
Offshore Wind Status and Pipeline
China has already successfully installed several offshore wind turbines. The first offshore wind turbine was installed in China was in 2007 when CNOOC installed a single Goldwind 1.5MW turbine on an oil platform. The electricity was used by the oil station to complement that generated by 4 generators. The first offshore project went into operation in 2010; a 102MW project installed by the Donghai Bridge near Shanghai using 34 3MW Sinovel turbines.
Offshore Wind Development Pipeline - April 2010
0
500
1000
1500
2000
2500
3000
3500
4000
4500
5000
Fujian Jiangsu Guangdong Shandong Shanghai Zhejiang Hainan
Pla
nned I
nsta
llations (
MW
)
Source: CWEA

ix
Per April 2010, the offshore wind development pipeline in China stands at approximately 11.9GW, with 650MW installed or under construction. The largest offshore pipeline is in Fujian with 4.8GW, which can be expected considering Fujian has the highest offshore wind speeds throughout China. Jiangsu with just under half of its offshore capacity in the intertidal zone and waters less than 10m deep, ranks second in terms of pipeline and can serve as a testing ground for the further development of offshore wind.
Further Considerations
China‟s current national offshore wind development plan needs to be strengthened in order to promote responsible, high-quality offshore wind development. While many offshore wind projects are in the pipeline, some of these proposals are not up to international standards and most are very far from implementation. Short-sighted money-saving tactics currently employed in the industry may increase the number of early unsuccessful development projects, and thereby undermine the future potential of the offshore wind industry. As offshore wind projects are increasingly attracting more attention and investment, it will be important for the Chinese Government to ensure realistic and qualitatively sound planning and development.
Offshore wind resource surveys should be carried out as soon as possible along the whole Chinese coastline, especially surveys that assess offshore wind resource reservations, technical potentials and economical potentials. Such findings should be used to make high-resolution offshore wind resource maps, which can serve as a sound foundation for future planning and development. In addition a national database needs to be established, with relevant data on regional wind resource, meteorological data, geological conditions, the electrical grid, transportation systems, and ocean development plans. With such a database offshore wind farm developers will have universal access to standardized and reliable information, which will enable an efficient and fair exploitation of offshore wind resources.
China‟s current onshore wind capacity attests to the success of the series of incentivizing regulations that promote the development of onshore wind power. Now, a similar package of incentive regulations need to be implemented for offshore wind development, which faces a number of different challenges compared with onshore wind.
The lack of a proper Chinese guiding policy for offshore wind means that the pricing system for offshore wind energy is unclear, and thus the economic indicators of the industry remain uncertain. Though the first offshore wind farm, Donghai Bridge, is fully constructed, the project remains profitless with the current price system. Possibly the most important next step will be to formulate an attractive feed-in-tariff system for offshore wind development.
Offshore wind conditions require more complex and challenging technical solutions compared with onshore wind development. The success of Europe‟s offshore wind industry is in a large part due to the experience Europe gained from the development of its onshore wind and involvement in the offshore oil and gas industry. The accumulation of technologies developed for onshore wind has established a trusted R&D pathway in China and provided a foundation for development of offshore wind technologies. As China‟s offshore wind industry develops, it is crucial to continue investing in R&D and to import and cooperate on technology development with companies and research institutions from experienced countries to effectively make use of China‟s substantial offshore wind energy potential.

Page 1 of 55
TABLE OF CONTENTS
1 Introduction ......................................................................................................... 4
1.1 China‟s Energy Profile .............................................................................. 4
1.2 China‟s Renewable Energy Policy ............................................................ 5
1.2.1 Renewable Energy Law .................................................................. 6
1.2.2 Onshore Wind Industry Policy Environment .................................... 6
1.3 China‟s Onshore Wind Industry ................................................................ 6
1.4 China‟s Electrical Load Center ................................................................. 7
1.4.1 Grid Development Plans and Ultra High Voltage Transmission ....... 8
1.5 Recent Developments in Offshore Wind ................................................... 9
1.5.1 Offshore Wind Industry Policy Environment .................................... 9
1.5.2 Offshore Wind Resource Assessments .......................................... 11
1.5.3 Offshore Wind Energy Pipeline ..................................................... 12
1.5.4 Offshore Wind Demonstration Projects ......................................... 15
2 China‟s Offshore Wind Data Simulation ............................................................ 16
2.1 Introduction ............................................................................................ 16
2.2 MM5 Numerical Simulation ..................................................................... 16
2.3 Data ....................................................................................................... 17
2.4 Output data extraction ............................................................................ 18
2.5 Output data validation ............................................................................. 18
2.6 Long Term Correction ............................................................................. 19
3 Wind Energy Potential Modeling ....................................................................... 20
3.1 Model Introduction .................................................................................. 20
3.2 Model Assumptions and Definitions ........................................................ 20
3.2.1 Model Area ................................................................................... 20
3.2.2 Wind Data .................................................................................... 20
3.2.3 Turbine Layout and Park Power Curve ......................................... 20
3.2.4 Other Assumptions ....................................................................... 20
4 China‟s Offshore Wind Resource Potential ....................................................... 22
4.1 Overall Offshore Wind Resource Potential ............................................. 22
4.2 Provincial Offshore Wind Energy Technical Potential .............................. 25
4.3 Deep Sea Regional Wind Resource ....................................................... 26
4.4 Risk of Typhoons Reduces Potential Wind Energy Resources ............... 28
5 Constrained Potential ....................................................................................... 29
5.1 Constrained Potential ............................................................................. 29
5.2 Constrained Potential Maps .................................................................... 30
6 Future Considerations ...................................................................................... 32
6.1 Supportive Policy .................................................................................... 32
6.2 Technology Development ....................................................................... 32

Page 2 of 55
List of Appendixes ................................................................................................... 34
Appendix A - Provincial Offshore Wind Power Technical Potential Description and
Maps ....................................................................................................................... 35
Appendix B –Annual Energy Density Map from Zhejiang to Hainan ........................ 53
Sources ................................................................................................................... 54
Abbreviations
CAS China Academy of Sciences
CNOOC China National Offshore Oil Corporation
CSG China Southern Power Grid
CWEA China Wind Energy Association
GDP Gross domestic product
GHG Greenhouse gas
GW Gigawatt
km Kilometer
kWh Kilo-Watt hour
MM5 Fifth Generation NCAR/Penn State Mesoscale Model
MW Megawatt
NCAR National Center for Atmospheric Research
NDRC National Development and Reform Commission of the P.R. of China
NEA National Energy Administration of the People's Republic of China
NERC Natural Environmental Research Council
NREL US National Renewable Energy Laboratory
PSU Pennsylvania State University
SOA State Oceanic Administration of the People's Republic of China
tce Ton of coal equivalent
tCO2e Ton of carbon dioxide equivalent
TWh Terra-Watt hour
UHV Ultra-high voltage
WWF World Wide Fund for nature
Page 3 of 55
List of Tables and Figures
Figure 1: China's Energy Consumption from 2001- 2007 ............................................................................................ 4
Figure 2: China's Energy Consumption Resource Mix from 1990 to 2007 ................................................................... 4
Figure 3: Increase in China‟s Energy Supply Shortage from 2001 to 2008 .................................................................. 5
Figure 4: China's Installed Wind Power Capacity from 2000 to 2009 ........................................................................... 6
Figure 5: Power Consumption and Generation in China's Coastal Provinces 2008 ..................................................... 8
Figure 6: China offshore wind pipeline development locations - 2009 ....................................................................... 14
Figure 7: China‟s First Erected Offshore Wind Turbine in Bohai Bay ....................................................................... 15
Figure 8: China‟s First Offshore Wind Farm 102MW Constructed near Donghai Bridge in Shanghai in 2009 ............ 15
Figure 9: Partition areas for the 9-km resolution layer calculation .............................................................................. 17
Figure 10: Annual Mean Wind Speed Correlation ...................................................................................................... 18
Figure 11: Meteorological Mast Data Locations ......................................................................................................... 19
Figure 12: China-National offshore annual wind speed, 100m hub height within 100km ............................................ 23
Figure 13: China-National offshore annual wind energy density, 100m hub height within 100km ............................... 24
Figure 14: Annual Wind Energy Technical Potential by Province and Water Depth .................................................... 25
Figure 15: Southern China – Zhejiang to Hainan – Offshore annual average wind speed ......................................... 26
Figure: 16 Foundation Water Depths ........................................................................................................................ 27
Figure 17: Deep Sea Annual Wind Energy Technical Potential within 100km from the Coast .................................... 27
Figure 18: Typhoon landings by month in China – 1951-2005 ................................................................................... 28
Figure 19: Typhoon landings by province in China - 1951-2005 ................................................................................ 28
Figure 20: Technical versus constrained potential wind energy within 10km from shore ............................................ 29
Figure 21: Zhejiang province: restricted areas within 10km off shore ........................................................................ 30
Figure 22: Fujian province: restricted areas within 10km off shore ............................................................................ 31
Figure 23: Shandong Province - Offshore annual average wind speed, 100m hub height within 100km .................... 36
Figure 24: Shandong Province - Offshore annual wind energy density, 100m hub height within 100km .................... 37
Figure 25: Jiangsu Province - Offshore annual average wind speed, 100m hub height within 100km ........................ 39
Figure 26: Jiangsu Province - Offshore annual wind energy density, 100m hub height within 100km ........................ 40
Figure 27: Zhejiang Province - Offshore annual average wind speed, 100m hub height within 100km ...................... 42
Figure 28: Zhejiang Province - Offshore annual wind energy density, 100m hub height within 100km ....................... 43
Figure 29: Fujian Province - Offshore annual average wind speed, 100m hub height within 100km .......................... 45
Figure 30: Fujian Province - Offshore annual wind energy density, 100m hub height within 100km ........................... 46
Figure 31: Guangdong Province - Offshore annual average wind speed, 100m hub height within 100km ................. 48
Figure 32: Guangdong Province - Offshore annual wind energy density, 100m hub height within 100km .................. 49
Figure 33: Hainan Province - Offshore annual average wind speed, 100m hub height within 100km ......................... 51
Figure 34: Hainan Province - Offshore annual wind energy density, 100m hub height within 100km ......................... 52
Figure 35: Southern China - Zhejiang to Hainan - Offshore wind energy density/an, 100m hub height within 100km 53

Page 4 of 55
China's Energy Consumption
0
50,000
100,000
150,000
200,000
250,000
300,000
2001 2002 2003 2004 2005 2006 2007
Year
En
erg
y C
on
su
me
d (
tce
)
Source: National Bureau of Statistics - China
1 Introduction
1.1 China’s Energy Profile
China‟s economic growth during the 21st
century has required considerable energy consumption. Fig. 1 gives an overview of the continual growth of China‟s energy consumption from 2001 to 2007. Figure 2 further breaks down China‟s overall energy consumption by fuel type standardized into tons of coal equivalent (tce). As Figure 2 depicts, China‟s economic growth and rapid urbanization has been fueled by 92.7% traditional fossil fuels, whose consumption can be coupled with damaging environmental consequences.
In 2007, coal accounted for 69.5% of China‟s energy consumption. The burning of coal has severe environmental consequences, specifically the emission of sulfur dioxide into the atmosphere and water. In 2008 the volume of sulfur dioxide emissions reached 23 million tons, 90% of which is attributed to the combustion of coal.
4 In order to
maintain its considerable economic progress, China must utilize energy resources with less harmful environmental impact. Exploiting China‟s wind energy potential is one opportunity to provide the country with clean, renewable energy.
China's Energy Resource Mix 1990-2007
Coal
Oil
Gas
Hydro, Nuclear & Wind
0
10
20
30
40
50
60
70
80
90
1990
1991
1992
1993
1994
1995
1996
1997
1998
1999
2000
2001
2002
2003
2004
2005
2006
2007
Year
(%)
Source: China State Statistics Bureau
Figure 2: China's Energy Consumption Resource Mix from 1990 to 2007.
4 2008 Report on the State of the Environment in China, Ministry of Environmental Protection of P. R. China 4 June.
2009
Fig. 1: China's Energy Consumption 2001-07

Page 5 of 55
The 21st century‟s acceleration of urbanization and economic growth has put increasing
demands on China‟s energy supply. Since 2001 the China‟s energy supply has been insufficient, and the shortage has been increasing. The energy shortage peaked in 2007 at a total of 302 million tons of coal equivalent (Mtce) in 2007, a 20% increase over the previous year.
5
China's 2001-2008 Energy Supply Shortage
58
250
302
0
50
100
150
200
250
300
350
2001 2002 2003 2004 2005 2006 2007 2008
Mtce
Source: State Statistics Bureau
China's energy
shortage has been
increasing every
year.
Energy shortages
increasing to
244Mtce - 2007 and
192Mtce - 2008
above 2001 levels.
Figure 3: Increase in China’s Energy Supply Shortage from 2001 to 2008
Year on year China is facing increasing energy security risk with a continually widening gap between energy supply and demand as depicted in Figure 3. It is predicted that if China stays on its current track, then the energy consumption of China will reach 5 billion tce in 2020.
6 This
gap between energy supply and demand cannot be reduced if China continues to rely primarily on traditional energy resources such as coal and natural gas. China must develop non-traditional energy resources, such as renewable energy to avoid environmental degradation.
1.2 China’s Renewable Energy Policy
The Chinese Government is concerned about the effects of climate change and is developing a strategy that leverages renewable energy to address the associated challenges. Annual average air temperature has increased 0.5~0.8ºC over the past 100 years, a measure slightly higher than the average global temperature rise.
7 According to preliminary estimations by
Chinese experts, China‟s total greenhouse gas (GHG) emissions in 2004 were about 6,100 million tCO2e.
8 These figures coincide with an increase in frequency and intensity of extreme
weather events throughout China during the past 50 years. Northern and Northeastern China have experienced severe droughts, while flooding in the middle and lower reaches of the Yangtze River and Southeastern China has become increasingly devastating.
On the September 22, 2009 at the UN Summit on Climate Change, President Hu Jintao announced that China will work towards addressing climate change by committing to produce 15% of its primary energy from non-fossil energy sources such as nuclear and renewables by 2020. In order to mitigate climate changing consequences of its economic development, China is committed to obtaining energy security and reducing environmental impact through the
5 State Statistics Bureau, 2009
6 Statistical Communiqué of the People's Republic of China on the 2008 National Economic and Social Development
National Bureau of Statistics of China February 26, 2009 7China's National Climate Change Program, NDRC (National Development and Reform Commission), June 2007 pg 6
8 Ibid.

Page 6 of 55
development of clean, renewable energy.
On November 11, 2009 Premier Wen Jiabao convened a conference to decide how China will address climate change moving forward. Following the conclusion of the conference, China committed to reducing Chinese carbon dioxide emissions per unit of GDP by 40-45% of 2005 levels by 2020. This pledge demonstrates that China is fully dedicated to tackling climate change.
1.2.1 Renewable Energy Law
The implementation of the Renewable Energy Law of the People‟s Republic of China in 2006 was the beginning of a new era of renewable energy development. The Law was amended in 2009 to ensure that the relevant government bodies were directing the development and approval of China‟s renewable energy strategy. The Amendment also elaborated on the indemnificatory purchase rules and the system by which electricity produced from renewable energy is accepted onto the electrical grid. A renewable energy development fund was also established within the government‟s budget to subsidize the cost of operating and managing renewable energy projects.
1.2.2 Onshore Wind Industry Policy Environment
The Renewable Energy Law prompted the establishment of policies that further support the development of China‟s onshore wind industry. The policies fall into two basic categories: those policies that directly encourage the domestic development of wind power equipment manufacturing and those policies that provide incentives for wind power development by guaranteeing a stable market for wind power (Table 1).
1.3 China’s Onshore Wind Industry
Onshore wind energy, due to its mature technology and low cost, has become the preferred renewable energy source for short-term, large-scale development in China. The implementation of the Renewable Energy Law of 2005 and the 2009 Amendment to the Law have prompted rapid growth of the onshore wind industry. The most recent statistics from the China Wind Energy Association (CWEA) state that annual installed wind capacity in 2009 was 13.8GW, totaling an accumulative capacity of 25.8 GW (see Figure 4) – making China second only to the USA in terms of capacity to generate wind energy. Recent reports expect China‟s wind power capacity to exceed 150 GW by 2020.
9
China Installed Wind Power Capacity 2000-2009
0
5,000
10,000
15,000
20,000
25,000
30,000
Insta
lled C
apacity (
MW
)
Newly 77 57 66 98 197 507 1,288 3,311 6,154 13,803
Accmu. 342 399 465 563 760 1,267 2,555 5,866 12,020 25,805
2000 2001 2002 2003 2004 2005 2006 2007 2008 2009
Source: CWEA
Figure 4: China's Installed Wind Power Capacity from 2000 to 2009
9 CWEA & NEA estimated

Page 7 of 55
Table 1
Current Incentives for Onshore Wind Power Development
Financial subsidies
"The Interim Administrative Measures on
Special Funds of the Industrialization of
Wind Power Generation Equipment"
subsidizes qualified localized wind power
equipment.
Tariff preference
A tax refund policy applied to key parts
and raw materials of wind turbines with a
capacity >1.2MW.
Tax incentiveIncome tax of high-tech enterprises is
levied at the reduced rate of 15%.
Turbine certification Voluntary certification.
Research and
development support
Technology Supporting Program, 863
Program, 973 Program, etc.
Onshore feed-in tariff
Benchmark pricing. It includes four levels,
0.51(Yuan/kWh), 0.54, 0.58 and 0.61
according to the four wind energy resource
territories.
Mandatory market share
"Medium and Long Term Development
Plan for Renewable Energy" sets the
renewable energy installation and
generation targets, but does not set
specific implementation and management
methods.
Wind concession project bid
Wind base project bid.
Tax incentiveValue added tax is levied at the reduced
rate of 50%.
It is compulsory to connect wind power to
the power grid.
The portion that exceeds the benchmark
price is shared by national users.
Source: CWEA
Incentive policies guaranteeing
the stable development of wind
power marketResources concession
/competitive bid
Mandatory grid
connection
Policies directly encouraging the
development of wind power
equipment manufacturing
1.4 China’s Electrical Load Center
Figure 3 reveals that as China‟s demand for energy grew, the magnitude of energy supply shortages grew as well. Energy supply shortages likely occur where there is a high load demand and bottlenecks in distribution infrastructure. In China, the load centers are located in the developed eastern coastal region. Figure 5 highlights the power consumption and generation capacity of six coastal provinces and Shanghai. In 2008, the power consumption of Guangdong, Jiangsu, Shandong, Zhejiang, Shanghai, Fujian, and Hainan equaled 1,400 TWh, accounting for 41% of China‟s overall power consumption that year.
10 Coastal provinces south
of Beijing consume more energy than they produce and are required to import energy from surrounding provinces, with exception of Fujian-see Figure 5. Guangdong in 2008, for example, imported 83 TWh of electricity accounting for 24% of its total power consumption.
10
China Electric Power Yearbook 2009

Page 8 of 55
Power Consumption and Generation in China's Coastal Provinces - 2008
0
100
200
300
400
Power Consumed (TWh) 351 312 273 232 114 107 12.3
Power Generated (TWh) 268 289 270 213 80 109 11.8
Guangdong Jiangsu Shandong Zhejiang Shanghai Fujian Hainan
Source: China Electric Yearbook 2009
Figure 5: Power Consumption and Generation in China's Coastal Provinces 2008
While onshore wind development has been successful in some regions of the country, the land required to construct wind farms large enough to impact the coastal provinces‟ energy shortages, may be a limiting factor for their development, especially in highly populated regions. Offshore wind is an opportunity to deliver clean energy to these regions, while relieving pressure on the long-distance, west-to-east transmission projects.
1.4.1 Grid Development Plans and Ultra High Voltage Transmission
Offshore wind energy must be connected to the electrical grid onshore. These connections may require extensive grid construction; therefore offshore wind development research needs to be executed as early as possible to allow for appropriate grid planning. Many provinces are in the process of making both offshore wind and grid development plans. In Hainan Province, for example, grid improvement projects began in 2009, with China Southern Power Grid (CSG) investing an estimated 2.6 billion RMB towards the improvement of the electrical grid, to be implemented in 2010.
11 Hainan provides an example of how understanding the offshore wind
potential will help grid planners accommodate grid expansion for offshore wind.
The construction of an ultrahigh voltage (UHV) transmission grid aims to relieve the current energy shortages along the eastern seaboard by transporting electricity generated from renewable resources in China‟s western provinces. The commitment to construct the UHV transmission grid is an indicator to some experts that large-scale development of offshore wind energy may be reduced or delayed since both offshore wind and the UHV grid are solutions to the energy supply shortage problem.
12 However, recent policies and investment decisions
indicate that the Chinese government will support large-scale development of offshore wind. The goal of the UHV project is to create a strong, reliable electrical system utilizing Smart Grid technologies.
Table 2 below outlines the capacity and deployment schedule of the UHV transmission network.
11
“Cooperation Framework Agreement of Provincial Government and the China Southern Power Grid Corporation” Hainan Provincial Government Website, March 23,2009 www.hainan.gov.cn 12
Experts‟ analysis from CWEA

Page 9 of 55
Table 2
China's UHV Grid Development
Location Technology CapacityGrid length
(km)
Construction
started
Construction
completedOperation
JNJ
Jindongnan-Nanyang
-Jingmen UHVAC, 1000kV 6000MVA 654 Nov-06 Dec-08 Jan-09
YG Yunnan-Guangdong
UHVDC ± 800kV
12 pulses bipolar 5000MW 1438 Dec-06 2009 2010
XS Xianjiba-Shanghai
UHVDC ± 800kV
12 pulses bipolar 6400MW 1907 Dec-07 Aug-09 2010
JS Jinping-Sunan
UHVDC ± 800kV
12 pulses bipolar 7200MW 2096 2009 2012 na
Source: Li, Asia Energy Platform Sept. 2009
Table 3 below provides a reference for understanding how much wind is installed in coastal provinces and how far they are from reaching wind penetration levels which may affect the stability of the grid. Wind capacity is only a small portion of the overall energy generation capacity in coastal provinces to date and adding the planned offshore wind capacity is not even enough to reach 10% of the overall generation capacity. Therefore grid instability due to wind penetration will not likely pose a limiting factor in the deployment of offshore wind projects at this point. In addition construction of the Smart Grid will likely help address the technical challenges associated with higher levels of wind penetration.
Table 3
Coastal Provincial Wind Penetration Potential 2008
Overall Generation Onshore Offshore
unit MW Capacity 10% capacity 20% capacity installed capacity planned
Guangdong 60,080 6,008 12,016 569 1,828
Shandong 57,360 5,736 11,472 1,219 1,252
Jiangsu 54,420 5,442 10,884 1,097 2,450
Zhejiang 53,170 5,317 10,634 234 600
Fujian 26,270 2,627 5,254 567 4,760
Shanghai 16,820 1,682 3,364 142 1,100
Hainan 2,790 279 558 196 na
Source: China Electric Power Yearbook 2009, CWEA
Potential Wind Penetration
1.5 Recent Developments in Offshore Wind
1.5.1 Offshore Wind Industry Policy Environment
In 2005 the National Development and Reform Commission (NDRC) included a research and development (R&D) project for offshore wind technology in the “Renewable Energy Industry Development Guiding Catalog”. The following year, the Donghai Bridge offshore wind farm project in Shanghai was launched. These two occasions stand as landmarks in the development of China‟s offshore wind industry.
Since 2006, it has been proposed in the “Outline of the Eleventh Five-Year Plan for Renewable Energy Development” that China will:
Explore and accumulate experience in developing offshore wind in offshore areas of
Jiangsu and Shanghai;
Enhance the research of offshore wind development technology;
Start the preliminary works of offshore wind prospecting, assessment, and demonstration

Page 10 of 55
projects;
Establish 1-2 100MW class demonstration offshore wind farms which to gain experience
and technology to further the development of large offshore wind power.
On January 15, 2009, the National Energy Administration of the People‟s Republic of China (NEA) organized the Workshop of Offshore Wind Development and Offshore Large Wind Farm. This workshop was attended by both local and central government departments, institutions, and enterprises. By bringing together relevant parties, the workshop concluded by identifying a strategy to implement offshore wind development. As a result of the workshop, the NEA issued a technical standard: “Compiling Method of Offshore Wind Farm Project Planning (for Trial Implementation)” and “Compiling Method of Offshore Wind Farm Project Pre-Feasibility Study (for Trail Implementation).” More recently, NEA Director Zhang Guobao indicated on December 27, 2009, that the government will promote scaling up wind energy and will continue to promote the construction of large wind energy bases, particularly focusing on the development of offshore wind projects.
Most recently, on January 22, 2010, NEA and State Oceanic Administration of the People‟s Republic of China (SOA) issued the “Interim Administrative Measures of Offshore Wind Power Development.” This Measure intends to standardize offshore wind management and to promote systematic implementation of offshore wind development. In order to achieve this, the Measure outlines a plan for permissions, approvals, sea region utilization, environmental protection, and project acceptance and operation management.
The Measure further stipulates which relevant National Energy Administration departments are in charge of offshore wind project development in China. Provincial and Local Energy Administrations are to manage their local offshore wind projects under the direction of the national departments. Relevant national departments are responsible for the development of offshore wind power technology. The Measure also signals to local government officials to start planning for project approvals.
Significant for foreign investors, although the Measure requires that offshore project developers must have a majority Chinese share or JV in order to participate in the concession project tenders, there are still many possibilities for the foreign investors to enter Chinese offshore wind development. One of the possible reasons for this is the sensitivity of marine related data (which may include military zones) needed for offshore wind project development.
The Chinese government recognizes the significant economic and development opportunities presented by the potential to develop its offshore wind resources. However, it is also realistic in recognizing the need to research and develop appropriate technologies to overcome technical challenges before large-scale development can be successful. A better understanding of foundation structure design, project construction, and equipment and operation is required. To address these issues the Ministry of Science and Technology of the People Republic of China dedicated funds to relevant departments and institutions to support their research and technology development. These funds established the National Key Technology R&D Program
13 which will be active for the duration of the Eleventh Five-Year period.
A series of policies demonstrates that the Chinese national government has begun to manage and supervise offshore wind development and will likely continue to provide support for the scaling-up of offshore wind.
13
National Key Technology R&D Program(国家科技支撑计划) http://kjzc.jhgl.org/

Page 11 of 55
Table 4
Research Objective Organization
Shanghai Electric Group Co., Ltd.
China Three Gorges Corporation
CNOOC
China Three Gorges Corporation
Technological and economic analysis and environment
effects of offshore windCNOOC
Offshore wind farm construction handbook CNOOC
Baoding Tianwei Group Co., Ltd.
Beijing Corona Science & Technology
Sino-wind Energy co., Ltd
Source: Ministry of Science and Technology of the P.R.China
Offshore wind farm construction methodology and
technology research
Equipment research and development for offshore
wind turbines installation and maintenance
3MW offshore wind turbine with independent
intellectual property rights
Offshore Wind Power Projects: National Key Technology R&D Program
1.5.2 Offshore Wind Resource Assessments
This study seeks to improve upon previous studies by estimating the wind energy generation potential for offshore wind power in China. The study models how much energy offshore wind can produce along China‟s coast up to 100km from the shore by applying a theoretical wind farm along the coast and calculating the wind potential at 100m hub height using the turbine‟s power curve. The results and methodology can be found in Sections 2.4.
Table 5
China's Offshore Wind Assessment by Study Organization
Organization Technical Potential (GW) Methodology
China Meteorology
Administration (1990s)750
Based on the second onshore wind
energy general investigation. Defines
the offshore wind energy as
3xonshore, 10m height
China Meteorology
Administration (2007)180 Numerical simulation, 50m height
Institute of Geographic Science
and Natural Resources
Research, CAS
2,000Estimating by satellite remote sensing
and wave observation
NREL 610
Numerical simulation and revise the
data by meteorological stations and
anemometer tower data
Energy Research Institute of
NDRC150
Calculating the installation capacity
based on the data of State Oceanic
administration PRC
Chinese Academy of
Engineering180
Total wind technical potential within the
distance of 20 km off the coastline.
The technical area is 37,000 km2, 50m
height
Source: China Renewable Energy Development Strategy Research Project
In addition the study further expands by giving special consideration to the deep-sea offshore

Page 12 of 55
potential at +50m water depths. While deep-sea offshore technology is not yet commercially viable it is an area with great potential. Deep-sea offshore wind technology and development experience from other nations will make the development of China‟s deep-sea offshore wind resources feasible. Deep-sea operations in other fields, such as oil and gas exploration and production, may also contribute to the knowledge base necessary for offshore wind energy development of 50m water depths and above. See Section 4.2
Several institutions have assessed offshore wind resources in China beginning in the 1990‟s. While these assessments used different methodologies to determine China‟s potential offshore wind capacity, the general conclusion from each study was that China has abundant offshore wind resources. The results of the studies are included in Table 5 below to provide some reference of the work already done in this field.
1.5.3 Offshore Wind Energy Pipeline
The combination of good offshore wind resource and the growing support by the national government has prompted several provincial governments to actively promote offshore wind development. In order to set an example and accelerate the preliminary work for offshore wind development, the NEA organized the planning development work for the large 10GW offshore wind base located in Jiangsu. The planning is expected to be complete in 2010. Table 6 presents offshore wind projects that are at various stages of development. The map (Figure 6 ) shows the location for each project.

Page 13 of 55
Table 6
Offshore Wind Farm PipelineProvince Project Capacity (MW) Status
1Huaneng Rongcheng offshore
wind Project102
Under
construction
2 Chang island 150Preliminary work
finished
3CNOOC Weihai offshore wind
project1,000 Planning
4 Guodian offshore wind project 800 Planning
5 Binhai offshore wind project 500 Planning
6 Dafeng offshore wind farm 200 Feasibility study
7 Dongtai offshore wind project 200Planning (1000,
by 2016)
8National experiment offshore
wind farm300 Planning
9Xiangshui offshore wind
experiment project200
Under
construction
10National demonstration offshore
wind project30 0 Preliminary work
11Lianyungang offshore wind
project200 Planning
12 Qidong offshore wind project 50Under
construction
13Donghai bridge offshore wind
farm100
Under
construction
14 Fengxian offshore wind farm 100 Preliminary work
15 Nanhui offshore wind farm 400 Preliminary work
16Fengxian large offshore wind
farm300
Middle and long
term plan
17Hengsha large offshore wind
farm200
Middle and long
term plan
18 Liuheng offshore wind project 200 Planning
19Lvneng Kaomen offshore wind
farm200 Planning
20 Cixi offshore wind project 200 Construction
21National experiment Ningde
offshore wind project2,000 Planning
22 Quanzhou offshore wind farm 460 Planning
23 Pingtan offshore wind farm 1,500 Planning
24 Xiamen offshore wind farm 100 Planning
25 Fuqing offshore wind project 500 Planning
26 Liuao offshore wind project 200 Planning
27 Jiahuwan offshore wind project 1,250 Planning
28Xuwen offshore wind project
first-stage30 Planning
29 Nanao offshore wind project 48 Planning
30 Dongle offshore wind project 500 Planning
11,990
Source: CWEA
Location
Shandong
1,252MW
Tantu area, north of Weihai
Southwest of Miao Island
Weihai
Jiangsu
2,450MW
Ganyu, Lianyungang
Binhai harbor, Yancheng
Dafeng, Yancheng
Dongtai, Yancheng
Sheyang, Yancheng
Xiangshui, Yancheng
Rudong, Nantong
lianyugang
Qidong, Nantong
Donghai bridge
Fengxian
Nanhui
Dacheng island, Xiamen
Zhejiang
600MW
Fujian
4,760MW
Chongming
Liuheng, Putuo
Kaomen, Daishan
Shanghai
1,100MW
Fengxian
Hangzhou Bay
Ningde
Quanzhou
Pingtan
TOTAL (MW)
Fuqing
Liuao, Zhangpu
Guangdong
1,828MW
Jiahuwan, lufeng
Xuewen, Zhanjiang
Nanao
Dongle, Leizhou

Page 14 of 55
Figure 6: China offshore wind pipeline development locations - 2009

Page 15 of 55
1.5.4 Offshore Wind Demonstration Projects
First Offshore Turbine - Bohai Bay
On November 8, 2007, China National Offshore Oil Corporation (CNOOC) constructed the first offshore wind station located in the Bohai Bay of Bohai Gulf, 70km away from CNOOC‟s Suizhong 36-1 platform (Figure 7). This wind station transmits the electricity to the oil field‟s independent grid attached through a 5km submarine cable, and it complements the energy produced by the 4 generators. The project was approved, developed, and constructed within 7 months and was successfully connected to the grid in November 2007. The 1.5MW turbine, adapted for offshore use, was jointly developed by Goldwind Science & Technology and CNOOC.
First Offshore Project - Donghai Bridge
China‟s first offshore wind farm located near the Donghai Bridge was built, managed, and maintained by a group of four companies including China Power International New Energy Holding Ltd., China Datang Corporation, CGN Wind Power Co., Ltd, and Shanghai Donghai Wind Power Ltd.
14 This wind farm is located 1km away from the Donghai Bridge, which
connects the Lingang Xincheng and Yangshan deep-water ports. The wind farm falls within the borders of Shanghai, lying south of Nanhui district, the northern edge is 8km from the coast and the southern edge is 13km from coast. In March 2009, the first offshore wind turbine developed and operated by Sinovel Wind Corp. was installed (Figure 8). To date all 34 units of Sinovel 3MW turbines (total of 102MW) have been installed and the first three are in operation. The project is expected to be completed and to go into operation before the opening of the Shanghai EXPO in May 2010. The annual on-grid generated electricity is forecasted to be 2.6TWh, an amount that could meet the electricity needs of approximately 200,000 households. The total project cost is 3 billion RMB.
Figure 8: China’s First Offshore Wind Farm 102MW Constructed near Donghai Bridge in
Shanghai in 2009 Source: Sinovel
14
The Shanghai Donghai Wind Power Ltd. was setup by the Shanghai Green Energy Corporation.
Figure 7: China’s First Erected Offshore Wind
Turbine in Bohai Bay – Constructed by
CNOOC on an Oil Platform in 2007.
Source: CNOOC

Page 16 of 55
2 China’s Offshore Wind Data Simulation
2.1 Introduction
The aim of this section is to describe the calculation methods used in this study. The study uses NCEP/NCAR wind atmospheric data and Chinese meteorological met station wind data as inputs to the MM5 mesoscale model further introduced below. The final result is one year of hourly time series of wind speeds at a height of 100m on a 9kmx9km grid within 100km of the Chinese coast. The result is corrected to be representative of long term.
It should be noted that meteorological data collection and management in China has been subject to considerable improvements and modifications in the past years, and as a consequence the data available is not always reliable or consistent over time. There is also a lack of information necessary to correct the meteorological data which goes back to 1970. Such areas of uncertainty are not unusual for a study like this and it is today impossible to provide much more accurate results – this is the first study that we know of to approach regional wind resource assessment with the more accurate method of analysis presented below.
The results of the simulations provide very good indication of the offshore wind resource in China when comparing one area to the other. The report can therefore be used as a key tool to identifying most interesting provinces and locations for offshore wind development. Nevertheless the absolute number indicating how much energy could potentially be produced is given for indication. The absolute numbers in this report should only be used for estimation of the market‟s growth potential and preliminary selection of attractive areas.
2.2 MM5 Numerical Simulation
MM5 is a numerical weather prediction model developed by the Pennsylvania State University and National Center for Atmospheric Research with the ability to simulate atmospheric conditions with resolutions ranging from 100 to 1 km. Version 3 of MM5 is a non-hydrostatic, prognostic model with explicit description of pressure, momentum and temperature. The numerical solution is computed onto a rectangular-structured staggered grid by finite difference schemes. The physical package of MM5 consists of a set of parameter schemes for cumulus, radiation, planetary boundary layer, microphysics and surface processes. A four-dimensional data assimilation scheme is implemented in the model with the capability of nudging the solution towards analysis or observations.
15
For wind speed predictions over land the spatial variability of the surface condition makes a high spatial resolution of the model necessary. This increases the computational effort greatly and prohibits long-term simulations for a larger area, as needed for wind resource maps. Offshore the surface conditions vary little in space, allowing a rather coarse spatial resolution of the model, which makes long-term calculations feasible.
16
In this study, the Chinese offshore coastline was divided into several zones and the double direction nesting function of MM5 was applied to every zone to set two layers of nested domains. The first layer for the large domain has a horizontal resolution of 27 km, the second layer for the small domain has a horizontal resolution of 9 km. Figure 9 shows the partition of the second layer domain. Vertical direction is divided into 23 levels, the atmospheric pressure of the top level being 100hPa.
15
A more complete description of the MM5 model can be found in Grell GA, Dudhia J, Stauffer DR. A description of the fifth-generation Penn State/NCAR mesoscale model (MM5). Technical Report NCAR/TN-398+STR, National Center for Atmospheric Research, Boulder, CO, 1994.
16 MM5 introduction from Wiley Interscience Wind Energy research article DOI:10.1002/we.212 published online 13
December 2006

Page 17 of 55
Figure 9: Partition areas for the 9-km resolution layer calculation
2.3 Data
Below is a list of the different data sets used in the study
Topographical data
Terrain elevation, land use/vegetation, land-water mask, soil types, vegetation fraction, and deep soil temperature data which can be downloaded from the United States Geological Survey (USGS) ftp platform
17 are automatically available for the TERRAIN program which is a
module of the MM5 model.
Bathymetric data
Bathymetry data was introduced in this study to define water depth contours on wind resource maps shown in this report and to organize the results in different water depth subcategories. The data, available on a 30 arc-second horizontal resolution grid and initially generated by combining quality-controlled ship depth soundings with interpolation between sounding points guided by satellite-derived gravity data was published by the UK Natural Environment Research Council (NERC) in January 2009.
Background data for MM5 model
Values of zonal and meridional components of wind vector, relative humidity and air temperature for different pressure levels ranging from 1000hPa to 100hPa as well as sea level pressure and surface temperature at a resolution of 2.5 degrees along latitude and longitude on a 6-hour basis for year 2005, derived from the NCEP/NCAR Reanalysis project database, is used as background data for the MM5 simulation.
18
To complete this data wind data measured during 2005 at a number of meteorological stations
17
More detailed information can be found at http://edc2.usgs.gov/geodata/index.php
18 NCEP Reanalysis data provided by the NOAA/OAR/ESRL PSD, Boulder, Colorado, USA, from their website at
http://www.cdc.noaa.gov

Page 18 of 55
in China was obtained from the Research Data Archive (RDA) which is maintained by the Computational and Information Systems Laboratory (CISL) at the National Center for Atmospheric Research (NCAR).
19 Some of this data was also used to validate the output of
the MM5 model (see section 2.5). Due to the lack of offshore wind observation data, assessment in this report uses only coastal stations observational data for adjustments and verifictaion of the numerical simulation results.
Long term wind data
Annual average wind speeds from ground observation stations collected between 1970 and 2000 were downloaded from the China Meteorological Administration data sharing system.
20
This data was use to perform a long term correction further introduced in section 2.6.
2.4 Output data extraction
Results of the MM5 simulation presented in this report contain per hour meteorological elements on 25 altitudes (from earth's surface to 100hpa) including meridional wind (U) and
zonal wind (V) for a 9x9km grid. The MM5 model uses σ terrain-following constant pressure
level coordinates in the vertical direction, rather than ground coordinates commonly used in wind resource assessments. Consequently, wind data at different hub heights cannot be directly extracted from the MM5 model result. To obtain the desired hub height wind data, this
study uses vertical direction σ coordinates transferred to geometric height Z through solving of
atmospheric static equations. Determining the real temperature and air density distribution is complex and outside the scope of this study which therefore assumes that the atmosphere satisfies reference state of static equilibrium and idealized temperature profile.
21 This is
equivalent to assuming that adjacent Sigma levels are isothermal which allows solving atmospheric static equations.
22 Based on this method, an internal data interface program was
compiled to extract (U\V) data at selected hub heights.
2.5 Output data validation
Simulated hourly time series at 10m, 70m
and 100m heights were extracted for a
limited number of points on the 9kmx9km
grid and correlated to simultaneous wind
speed data from corresponding locations on
islands and in offshore areas available from
RDA previously introduced. Due to the lack
of historical wind measurements at
significant altitudes for offshore areas, only
10m data extracted from MM5 is used in
this part of the study. Daily mean wind
speed correlation coefficients are shown in
19
More detailed information can be found at http://dss.ucar.edu/datasets/ds464.0/
20 More detailed information can be found at http://cdc.cma.gov.cn/
21 Jiny Dudhia, Dave Gill, Yong-Run Guo, et al. PSU/NCAR Mesoscale Modeling System Tutorial Class Notes and
User‟s Guide:MM5 Modeling System Version 3[M]. Mesoscale and Microscale Meteorology Division, National Center for Atmospheric Research, 2003.
22 Zeng Xuelan, Yu Zhi, Deng Yuanchang . Wind Field Data-Acquisition Method at Hub-Height Based on MM5.
ACTA SCIENTIARUM NATURALIUM UNIVERSITATIS SUNYATSENI 2008,47(9):130-132
Figure 10: Annual Mean Wind Speed Correlation

Page 19 of 55
Site Location
Day-Pearson
Correlation
Pingtan 0.83
Lusi 0.80
Dachen Island 0.84
Tangshan 0.67
Leting 0.54
Dalian/Dairen/Luda 0.72
Chang Island 0.82
Longkou 0.78
Chengshantou (Cape) 0.87
Qingdao/Tsingtao 0.83
Haiyang 0.78
Rizhao 0.76
Lau Fau Shan (Aut) 0.59
Zhanjiang 0.63
Yangjiang 0.77
Shanchuan Island 0.83
Dongsha 0.90
Daily Mean Wind Speed Correlation
Table 7 and annual average wind speeds are graphed in Figure 10.
This analysis shows that for most observation stations, the simulated mean wind speed is larger than the observed mean wind speed, with the error almost within 1m/s. Most correlation coefficients between simulated and observed mean wind speeds are above 70%. The results of this correlation are not used to correct the initial data or calculation but provide confidence regarding the accuracy of the study‟s results.
Table 7
2.6 Long Term Correction
A long term analysis was conducted to insure that the initial data used as input for the MM5 model was representative of long-term trends. The two data sets used for this study were:
Data set 1: 2005 data from 18 different observation stations located in China obtained from RDA
Data set 2: Long term data introduced in section 2.3 measured between 1970 and 2000 at similar met stations as for data set 1.
The annual average wind speeds of data set 1 were found to be on average 5% below long term average wind speeds of data set 2 with a standard deviation of 18 percentage points. It is noted that indications of possible changes in the wind measuring equipment and site conditions of the different met stations were not available.
As a consequence of this long term analysis, hourly time series extracted from the MM5 model were increased by 5%. Resulting final data is considered representative of long term.
Figure 11: Meteorological Mast Data Locations

Page 20 of 55
3 Wind Energy Potential Modeling
3.1 Model Introduction
This section aims at providing the offshore wind technical potential and technical potential density of the Chinese coast and individual provinces based on the results of the wind resource assessment introduced in the previous section and on a number of assumptions further detailed below.
The technical potential of an area is the annual energy production (GWh)of this area based on
a specified wind generator technology, wind distribution and wind energy power curve. Technical potential density is defined as annual energy production for each square kilometer (GWh/km
2).
3.2 Model Assumptions and Definitions
3.2.1 Model Area
Considering offshore wind farms globally, the farthest an offshore wind farm has been installed from the shore to date is 100km and floating technology is prototyped for above 70m water depths. Therefore the geographic region was limited to within 100km from shore and at depth intervals of 0-10m, 10-30m, 30-50m, 50-70m, 70m+ to provide perspective about the potential based on foundation technology available.
As China‟s offshore region is known to have lower wind speeds than those in Europe, tall hub heights may be necessary to capture more wind and as technology goes beyond 3MW it is likely that hub heights will also go beyond 80m. Therefore the study uses data from 100m to account for the potential technology to be applied. In addition areas with an average wind speed of less than 7m/s were not included in the study.
3.2.2 Wind Data
One year of hourly wind speed time series on a grid of 9x9km at a height of 100m resulting of the study detailed in the previous section was used in the present study. After a 5% increase, the data is considered representative of long term.
3.2.3 Turbine Layout and Park Power Curve
A layout of Vestas V90 3MW IEC class I turbines with a 100m hub height spaced by 7 diameters (i.e 630m) in both diameters covering the whole model area is introduced. There are thus 225 turbines in each 9x9km block.
The technical potential was calculated by applying a park power curve to the hourly time series. A specific offshore park power curve was used taking into account the wake between turbines. In addition in this study, wind direction was ignored and a “free standing” turbine model was applied.
3.2.4 Other Assumptions
The technical potential calculation is based on the following remaining assumptions:
1. Nearby wind farms do not influence the wind farm in the 9x9 km block under scrutiny.
2. All calculations have been performed assuming no limits on capacity due to extra transformer stations and grid connection cabling.
3. A constant spacing is used: normally one can slightly reduce the distance between turbines as higher wind speeds decrease the recovering length of the wind (wake

Page 21 of 55
effect decreases).
4. Wake losses within turbine layout are included in the power curve
5. Based on EEA's European Wind Energy Assessment Report analyzing performance of wind farms in Europe, a factor of 0.91 is applied to energy production results to account for overall losses such as turbine unavailability, electrical losses, hysteresis losses, bad weather losses (not including Typhoons) etc…

Page 22 of 55
4 China’s Offshore Wind Resource Potential
4.1 Overall Offshore Wind Resource Potential
The results of the wind resource and wind potential studies are summarized in the following maps, for provincial level maps – see Appendix A.
The wind resource is presented as long term average wind speed maps. To eliminate the effects of typhoons, which make the annual average wind speed inaccurately high, the study removed the days which typhoons occurred in 2005 from the average annual wind speed data.
23The effects of typhoons do not influence the energy density calculation as the wind
turbines stop producing energy above 25m/s.
China‟s offshore wind resource is abundant. After simulated calculation by integrating different kinds of observational data, this study found that the Wind Energy Technical Potential, constrained to less than 100 km distance from coastal lines and at 100m hub height and within China‟s ocean territory (including all coastal provinces - except Taiwan), is 11,580TWh/year. Annual Mean Wind Speeds within 100km of the country‟s coastline are shown in Figure 12. Technical Potential Density is shown in Figure 13. The technical wind potential of Shandong, Jiangsu, Zhejiang, Fujian, Guangdong and Hainan are 9,735TWh/year (islands included).
Table 8
China's Technical Offshore Wind Potential per Province with 100km from Shore (TWh)
Water Depth 0-10m 10-30m 30-50m 50-70m >70m Total Total (Islands inc.)
Shandong 167 823 301 203 23 1,517 1,536
Jiangsu 322 481 24 0 0 827 837
Zhejiang 267 372 304 280 61 1,284 1,330
Fujian 152 512 557 652 116 1,989 2,031
Guangdong 219 640 715 278 155 2,007 2,049
Hainan 63 213 264 404 1,000 1,944 1,954
Total 1,190 3,041 2,166 1,816 1,354 9,568 9,735
Source: Sun Yat-sen University
Table 9
China's Offshore Wind Speed and Energy Density Ranges per Province
Annual average
wind speed range (m/s)
Energy density
range (GWh/km2)
Shandong 7.0-8.5 15-24
Jiangsu 6.5-8.5 14-24
Zhejiang 6.5-9.5 13-30
Fujian 7.0-10.2 15-36
Guangdong 7.0-9.0 15-27
Hainan 6.5-9.0 12-30
Source: Sun Yat-sen University
The greatest wind resource is in the Taiwan Strait and in nearby areas. Here the annual mean wind speed at 100m hub height is above 9m/s and the technical potential density is above 30GWh/km
2, which is caused by the effect of the narrow strait. The annual wind mean speed
at 70 meters height of other areas is above 7m/s and technical potential density is above 18GWh/ km
2, which indicates abundant wind energy conditions that are ideal for building large
scale wind farms.
23
See Section 4.4 for more information about typhoons and their affect on China‟s offshore wind resource.

Page 23 of 55
Figure 12: China – annual offshore wind speed, 100m hub height within 100km

Page 24 of 55
Figure 13: China – annual offshore wind energy density, 100m hub height within 100km

Page 25 of 55
4.2 Provincial Offshore Wind Energy Technical Potential
The offshore wind potential varies along China‟s coast, with the greatest overall potential in Guangdong, Fujian and Hainan - see the provincial wind speed and energy density maps in Appendix A. The development of offshore wind in these areas is however, dependent not only on wind resource, but also on the suitability of offshore wind equipment to withstand the local wind conditions such as typhoons. As mentioned in Section 4.1, the effect of typhoons was removed from the data processing, yet typhoons can significantly increase the risk of developing offshore wind farms.
Fujian has the largest offshore pipeline, see Table 6. The offshore projects are likely to be constructed using technology more similar to that in Europe as Fujian has a more limited area with water depths less than 10m. Fujian also has some potential for deep sea offshore projects with 40% of total offshore wind resource with water depths +50m.
Even though Jiangsu has the lowest wind energy technical potential, it currently has the second largest offshore project pipeline after Fujian, one reason for this may be its low frequency of typhoons, see Figure 19. Therefore, it is likely due to this reason that Jiangsu has been singled out for initial offshore development in the “Medium Long Term Renewable Energy Plan.” In addition most of the offshore resource in Jiangsu is less than 30m water depths including the shallow waters of the intertidal zone. Therefore starting with offshore wind projects in this area is lower risk as the offshore foundation technology is well established for water depths in the 10-30m range. The intertidal zone, particular for China, below 5-10m water depths requires specialized foundations and equipment for the soft sea bed conditions and several pilot projects are under construction.
The most recent notice for concession projects24
require projects to be located within 50m water depths, therefore in the near term more development may happen in Jiangsu, Shandong, and Zhejiang provinces as they have good wind potential in water depths below 50m and have a lower frequency of typhoons.
Offshore Technical Potential
0-10m
10-30m
30-50m
50-70m
>70m
0
200
400
600
800
1000
1200
1400
1600
1800
2000
Guangdong Fujian Hainan Shandong Zhejiang Jiangsu
Provinces
Annual E
nerg
y P
ote
ntial (T
Wh)
Source: Sun Yat-sen University
Figure 14: Annual Wind Energy Technical Potential by Province and Water Depth
24
China Economic Herald Feb. 2, 2010 http://www.ceh.com.cn/ceh/jryw/2010/2/4/59416.shtml

Page 26 of 55
4.3 Deep Sea Regional Wind Resource
Figure 15: Southern China – Zhejiang to Hainan – annual average wind speed offshore, 100m
hub height within 100km

Page 27 of 55
The offshore wind industry is moving from developing projects within 30m water depths to up to 50 to 70m+. Figure: 16 outlines some of the technology that is currently available for offshore foundation design. As floating technology becomes commercially viable water depth for offshore wind farm development will become less of a constraint. The technical potential in deep seas of 50-70m depth in Fujian, Guangdong and Hainan is 1,330TWh/year, and in areas deeper than 70m, the technical potential is 1,270TWh/year. See Appendix B for the Annual energy density map from Zhejiang to Hainan.
Hainan, Fujian, and Guangzhou have the largest potential for deep sea (+50m water depths) offshore wind development within 100km from the coast. Typhoon occurrence will pose a constraint to deep sea offshore development particularly in provinces such as Guangzhou which have high typhoon frequency, see Section 4.4. In Hainan (72% of total wind resource is in the deep sea area) - the west edge of the island, and Fujian (38% of the provincial wind resource in deep sea) - the Taiwan Strait, have are areas which are somewhat sheltered from typhoons and also have good offshore wind resource potential.
China's Deep Sea Technical Potential
50-70m
>70
0
200
400
600
800
1000
1200
1400
Hainan Fujian Guangdong Zhejiang Shandong Jiangsu
Annual E
nerg
y P
ote
ntial (T
Wh)
Source: Sun Yat-sen University
Figure 17: Deep Sea Annual Wind Energy Technical Potential within 100km from the Coast
Figure: 16 Foundation Water Depths
Source: PB Network

Page 28 of 55
4.4 Risk of Typhoons Reduces Potential Wind Energy Resources
Typhoons present a unique challenge to offshore wind farm developers because, although the storms create higher wind speeds, the violent storms can cause severe damage to turbine components, and in some cases can rip off blades and pull down erected towers. When siting wind farms, regions with high typhoon frequency should not be developed unless appropriate technology is utilized to prevent turbine damage.
In China, typhoons frequently occur in Hainan, Guangdong, and Fujian. Guangdong, including Hong Kong and Macao, account for approximately half of China‟s landed typhoons. Figure 19 shows the occurrence of typhoons by province from 1951 to 2005
25.
Typhoon Landings by Month in China 1951- 2005
0
20
40
60
80
100
120
May June July Aug. Sept. Oct. Nov. Dec.
Tota
l N
um
ber
of
Typhoon L
andin
gs
Guangxi Hainan Guangdong Fujian Zhejiang
Shanghai Jiangsu Shandong Liaoning
Source: Guangdong Climate Center, CWEA
Figure 18: Typhoon landings by month in China – 1951-2005
Typhoons Landings by Province in China 1951- 2005
0
20
40
60
80
100
120
140
160
180
Guangdong
Hainan
Fujian
Zhejiang
Guangxi
Shandong
Liaoning
Shanghai
Jiangsu
Num
ber
of
Typhoons
May June July August September October November December
Source: Guangdong Climate Center, CWEA
Figure 19: Typhoon landings by province in China - 1951-2005
25
Note: Guangdong statistics include Hong Kong and Macao.

Page 29 of 55
5 Constrained Potential
5.1 Constrained Potential
In China, plans for offshore wind development are in the process of being made at the provincial level. For this study, the Provincial Ocean and Fishery Bureaus were contacted to understand their development plans. Only Fujian and Zhejiang provinces were able to provide a general ocean development plan from 2005. It is likely that future ocean development plans will include more detail for offshore wind development. Currently, most of the development plans are restrained to within 10km from the coastline and water depths less than 10m. Thus, the constrained potentials provided in this report should only be used as a rough reference.
The constrained potential is the energy (TWh) that can be generated when restricted areas - not considered possible for wind farm development – are not included in the technical potential calculation. Restricted areas which are not possible for offshore wind development include: fisheries and fish hatcheries, tourism areas, tidal energy development, salt refineries, mines, land reclamation, military zones, environmental protection areas, scientific research areas, and waste water treatment areas. Maps of the restricted areas within 10km from the coast are included in Section 5.2.
337.1
223.4
189
111.7
Fujian Zhejiang
TW
h
Technical Potential Wind Energy
Constrained Potential Wind
Energy
Technical vs. Constrained
Potential with 10km from Shore
56%
50%
Source: Sun Yat-sen University, CWEA
Figure 20: Technical versus constrained potential wind energy within 10km from shore
In Fujian and Zhejiang the constrained potential within 10km of the coast is approximately 50% of the technical potential. This means that 50% of the energy generating capacity is not available within 10km from shore due to other oceanic uses. The constrained potential would probably decrease significantly with more accurate data about the areas, including updated oceanic development plans, and shipping routes. There are many shipping routes along the coast which could hinder offshore wind development. Further work could be done in the future to quantify the constrained potential after the new development plans are released.

Page 30 of 55
5.2 Constrained Potential Maps
Figure 21 and Figure 22 outlines the areas restricted for development in Zhejiang Province and Fujian Province respectively. The potential to develop offshore wind projects in areas that are used for other industrial purposes may be feasible; however, details of this arrangement must be discussed with the Local or Provincial Ocean and Fishery Bureau.
Figure 21: Zhejiang province: restricted areas within 10km off shore

Page 31 of 55
Figure 22: Fujian province: restricted areas within 10km off shore

Page 32 of 55
6 Future Considerations
6.1 Supportive Policy
China‟s current national level offshore wind development plan must be strengthened in order to promote responsible, high-quality offshore wind development. While Table 4 presents a long list of projects, some of these proposals are speculatory and most are very far from implementation. It is important as offshore wind projects attract more attention and investment that there is sound planning of future projects. Many wind farm developers have signed agreements with regional governments and have deployed preliminary studies. A number of meteorological masts have been installed; however, due to higher costs of offshore development, these projects have not used current standards. These money-saving tactics may increase the number of early unsuccessful development projects, and thus undermine the potential of the offshore wind industry. Therefore, offshore wind resource surveys need to be deployed immediately and nationally, especially surveys that assess offshore wind resource reservations, technical potentials and economical potentials. Findings should be used to make high-resolution offshore wind resource maps. A database that details regional wind resources, the electrical grid, climate, meteorological disasters, geological conditions, transportation systems, and ocean development plans, must be established. With this tool offshore wind farm developers will have access to standardized, reliable information, which will enable a more efficient exploitation of offshore wind resources.
China‟s current onshore wind capacity attests to the success of the series of incentivizing regulations that promote the development of onshore wind power. Table 1 lists these current incentives. However, no special incentives for offshore wind development exist except for those that support R&D funding for key technologies.
The uncertain pricing system for offshore wind means that the economic indicators of the industry remain unclear. Though the first offshore wind farm, Donghai Bridge, has begun its construction, the project remains profitless in the future according to the previous bidding price. Thus, the next step is to formulate an attractive feed-in-tariff system for offshore wind development.
6.2 Technology Development
The specific conditions of offshore wind require more complex and challenging technical solutions than onshore wind development. The success of Europe‟s offshore wind industry is in a large part due to the experience Europe gained from the development of its onshore wind and the offshore oil and gas industry. The accumulation of technologies developed for onshore wind established a trusted R&D pathway and has provided a foundation for offshore technologies. While onshore wind development in China has reached a level of large scale development, there are still gaps in key technological support. As China‟s offshore wind industry expands, it should be sure to continue investing in R&D and to import technologies from experienced countries. The following are the technological challenges that will be encountered:
Technology of offshore wind resource assessment;
Oceanic prospecting (waves, tide, current, sedimentation, eroding, component of seawater, icing, and history investment .etc);
Seabed and geological prospecting (seabed‟s historical development, sea-bed's topography, geological structure and condition, offshore areas‟ archeology .etc);

Page 33 of 55
The formulations of rules and standards on development and design of offshore wind turbines;
Technologies of micro sitting and distribution of wind farms;
Technologies of foundation design of offshore wind turbine (in different depths, seabed conditions);
Technologies of grid integration of offshore wind farm;
Technology of cable casting and electricity transmission;
Technologies of transmission, installation, operation, maintenance of offshore wind turbines;
Technologies of mechanical loading and electricity quality testing of offshore wind turbines;
Technologies of evaluation of offshore wind farm;
Technologies of environmental impact assessment of offshore wind farm.

Page 34 of 55
List of Appendixes
Appendix A – Provincial Offshore Wind Power Technical Potential Description and Maps
Appendix B – Annual Energy Density Map from Zhejiang to Hainan

Page 35 of 55
Appendix A - Provincial Offshore Wind Power Technical
Potential Description and Maps
A1 Shandong Province Offshore Wind Energy Resource Development Potential
100 meters height wind energy technical potential within a distance of 100km off Shandong‟s coastline is 1,536TWh/year. As a whole, wind energy technical potential density is between 18-24 GWh/km
2 in most areas. Wind energy resources of northern and eastern seas within 30
meters coastal water depth is richer than that of the same range in southeast.
A1.1 Key Development Region of Shandong Offshore Wind Power
According to „the Division of Marine Functional Regionalization in Shandong Province‟ issued in 2004, the key regions are Changdao, Rongcheng, Rizhao, which are presented as red points on the map below (Fig. 24).

Page 36 of 55
Figure 23: Shandong Province - Offshore annual average wind speed, 100m hub height within
100km

Page 37 of 55
Figure 24: Shandong Province - Offshore annual wind energy density, 100m hub height within
100km

Page 38 of 55
A2 Jiangsu Province Offshore Wind Energy Resource Development Potential
100 meters height wind energy technical potential within a distance of 100km off Jiangsu‟s coastline is 837TWh. The average wind energy density within the distance of 100km off the coastline and 30 meters coastal water depth is between 18-24 GWh/km
2. Wind is stronger in
the south compared to the north.
A1.2 Key Development Region of Jiangsu Offshore Wind Power
According to “The Division of Marine Functional Regionalization in Jiangsu Province”, wind energy regionalization areas include Guanyun, Qiansandao (Cheniushan, Dashan, Pingdao), Fusheshazhou, Rudong, Qidong, which are presented as red points on the map below (fig. 26).

Page 39 of 55
Figure 25: Jiangsu Province - Offshore annual average wind speed, 100m hub height within
100km

Page 40 of 55
Figure 26: Jiangsu Province - Offshore annual wind energy density, 100m hub height within
100km

Page 41 of 55
A3 Zhejiang Province Offshore Wind Energy Resource Development Potential
100 meters height wind energy technical potential within a distance of 100km off Zhejiang‟s coastline is 1,330TWh/year. For the south of Zhejiang sea area is near to narrow strait outlet, wind is stronger in the south compared to the north. The wind energy density ranges between 24-30GWh/km
2 including islands, which are suitable for offshore wind energy development.
A1.3 Key Development Region of Zhejiang Offshore Wind Power
According to “The Division of Marine Functional Regionalization in Zhejiang Province”, the key wind regions are Shengsi Sijiao, Beilun Lishan, Yushan Island, Dachen Island, Dongji Island, Zhonglu Island, Beiji, Nanji, Dongtou, Beiguan Island, Beikong, which are presented as red points on the map below (fig. 28) above. Some development areas also include a number of small wind energy utilization zones.

Page 42 of 55
Figure 27: Zhejiang Province - Offshore annual average wind speed, 100m hub height within
100km
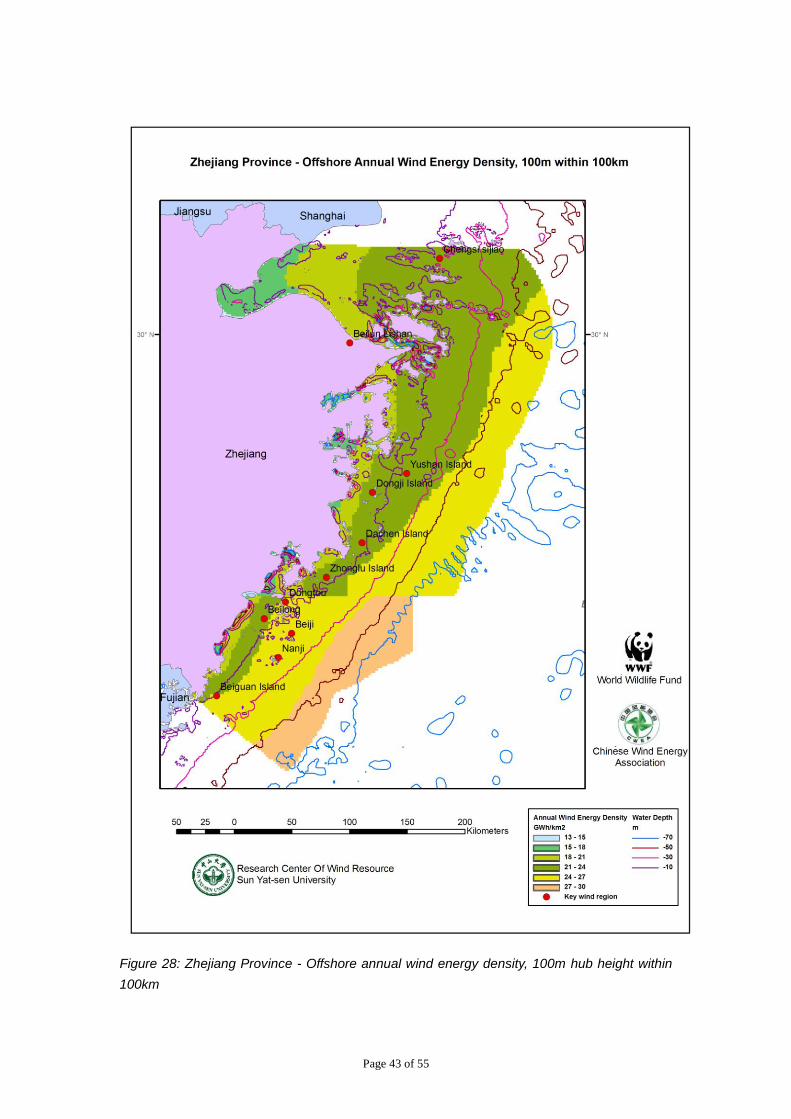
Page 43 of 55
Figure 28: Zhejiang Province - Offshore annual wind energy density, 100m hub height within
100km

Page 44 of 55
A4 Fujian Province Offshore Wind Energy Resource Development Potential
100 meters height wind energy technical potential within a distance of 100km off Fujian‟s coastline is 2,031TWh/year. The wind energy technical potential within 30 meters coastal water depth is 542 TWh/year, for deep water of Taiwan Strait and smaller Fujian sea area within 30 meters. The wind energy density in most areas is above 24 G Wh/km
2, some areas
within a distance of 100km off the coastline reach up to 30-36 GWh/km2, which is caused by
the effect of narrow strait.
A1.4 Key Development Region of Fujian Offshore Wind Power
According to „the Division of Large-Scale Marine Functional Regionalization in Fujian Province‟ article 15, rich wind energy regions of Fujian are distributed on islands and promontory. Now, wind turbines being into operation are located in Pingze island and Dongshan island.
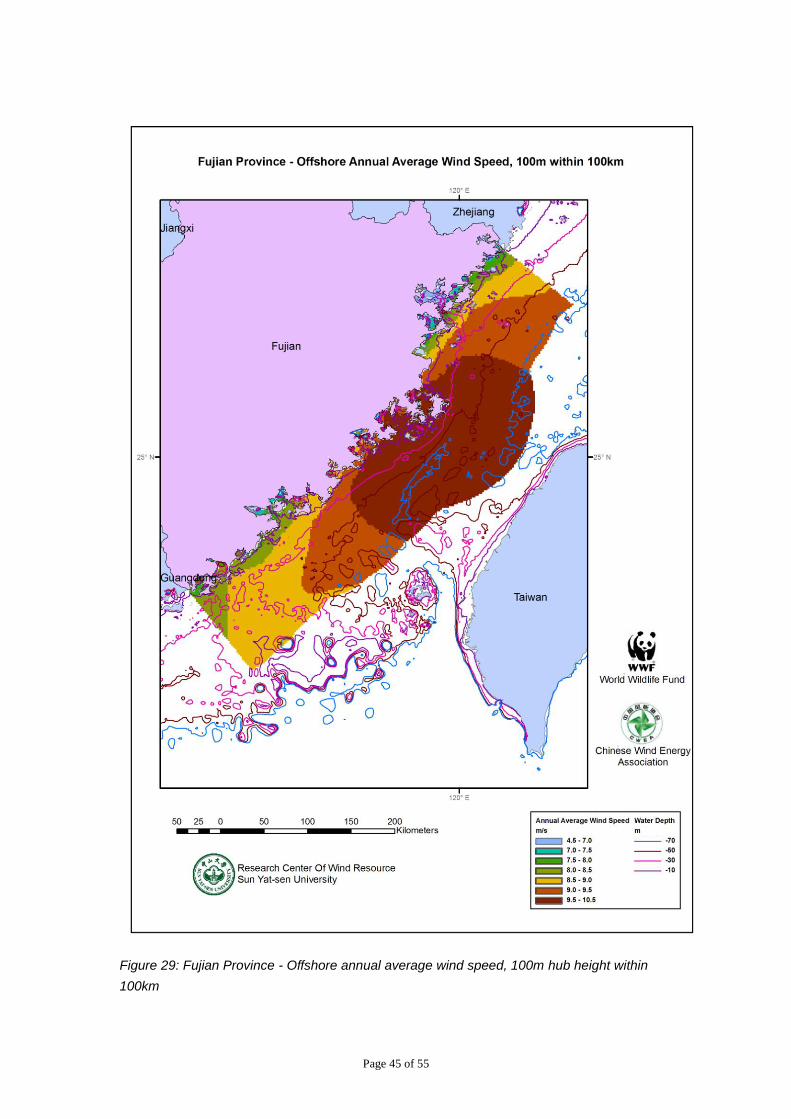
Page 45 of 55
Figure 29: Fujian Province - Offshore annual average wind speed, 100m hub height within
100km

Page 46 of 55
Figure 30: Fujian Province - Offshore annual wind energy density, 100m hub height within
100km

Page 47 of 55
A5 Guangdong Province Offshore Wind Energy Resource Development Potential
100 meters height wind energy technical potential within a distance of 100km off Guangdong‟s coastline is 2,049TWh/year. The wind energy density within the distance of 100km off the coastline ranges between 18 - 24Wh/km
2, wind resource near Pearl River Mouth is less than
that in the east and west of Guangdong Province.
A1.5 Key Development Region of Guangdong Offshore Wind Power
There are no special wind energy planning regions in „the Division of Marine Functional Regionalization‟ in Guangdong Province. Guangdong Yudean Group Co., Ltd and Ming Yang Wind Power Industry Group Co., Ltd. work together to promote the first offshore wind power demonstration project of South China- Zhanjiang Xuwen offshore wind farm, This project is expected to go into operation in 2010.

Page 48 of 55
Figure 31: Guangdong Province - Offshore annual average wind speed, 100m hub height
within 100km

Page 49 of 55
Figure 32: Guangdong Province - Offshore annual wind energy density, 100m hub height
within 100km

Page 50 of 55
A6 Hainan Province Offshore Wind Energy Resource Development Potential
100 meters height wind energy technical potential within a distance of 100km off Hainan‟s coastline is 1,954TWh/year. The wind energy density within the distance of 100km off the coastline ranges above 18 GWh/km
2 except in the southwest.
A1.6 Key Development Region of Hainan Offshore Wind Power
According to "Hainan Sea Economic Development Plan," Hainan encourages foreign investment and technology and domestic cooperation, actively expands the scale of wind power, forms a large-scale wind power generation area and develops island wind power industry in the west and east of Hainan Island. However, the plan didn‟t specify exact locations for wind development regions.

Page 51 of 55
Figure 33: Hainan Province - Offshore annual average wind speed, 100m hub height within
100km

Page 52 of 55
Figure 34: Hainan Province - Offshore annual wind energy density, 100m hub height within
100km

Page 53 of 55
Appendix B –Annual Energy Density Map Zhejiang to Hainan
Figure 35: Southern China - Zhejiang to Hainan - Offshore annual wind energy density, 100m
hub height within 100km

Page 54 of 55
Sources
China Electric Power Press [CEPP]. “Development strategy on China‟s Renewable Energy : Wind Energy ”. 2008
China Electricity Council. China Electricity Statistics Analysis 2008
Cui Minxuan, Report on the Energy Development in China (2008) Social Sciences Documentation Publishing House
Division of Large-Scale Marine Functional Regionalization in Fujian Province(2001). http://www.fjof.gov.cn/col564/article.htm1?id=21109
Division of Marine Functional Regionalization in Guangdong Province(2006). http://search.gd.gov.cn/detail?record=24&channelid=8907
Division of Marine Functional Regionalization in Jiangsu Province
(2006—2010).http://www.jsof.gov.cn/art/2007/1/24/art_24_6327.html
Division of Marine Functional Regionalization in Shandong Province(2004). http://www.lxdaj.gov.cn/read.php?Pid=1918
Division of Marine Functional Regionalization in Zhejiang Province(2006). http://www.zjoaf.gov.cn/zfxxgk/ghjh/zxgh/2009/10/15/2009101500025.shtml
Editorial of China Electric Power Yearbook 2009. China Electric Power Yearbook 2009
Grell GA, Dudhia J, Stauffer DR. “A description of the fifth-generation Penn State/NCAR mesoscale model (MM5)”. Technical Report NCAR/TN-398+STR, National Center for Atmospheric Research, Boulder, CO, 1994.
Hainan Provincial People's Government Web site. “Cooperation Framework Agreement of Provincial Government and the China Southern Power Grid Corporation”. March 23, 2009 www.hainan.gov.cn
Hainan Sea Economic Development Plan(2008) http://www.hainan.gov.cn/data/hnzb/2006/02/318/
Jiny Dudhia, Dave Gill, Yong-Run Guo, et al. “PSU/NCAR Mesoscale Modeling System Tutorial Class Notes and User‟s Guide:MM5 Modeling System” Version 3[M]. Mesoscale and Microscale Meteorology Division, National Center for Atmospheric Research, 2003.
Ministry of Environmental Protection of P. R. China. 2008 Report on the State of the Environment in China. 4 June. 2009
MM5 introduction from Wiley Interscience Wind Energy research article DOI:10.1002/we.212 published online 13 December 2006
National Bureau of Statistics of China. Statistical Communiqué of the People's Republic of China on the 2008 National Economic and Social Development. February 26, 2009
National Key Technology R&D Program http://kjzc.jhgl.org/
NCEP Reanalysis data provided by the NOAA/OAR/ESRL PSD, Boulder, Colorado, USA, from their website at http://www.cdc.noaa.gov
NDRC (National Development and Reform Commission) China's National Climate Change Program, Printed in June 2007. Page 4

Page 55 of 55
China: An Emerging Offshore Wind Development Hotspot