china passenger vehicle fuel consumption development ... · pdf filechina passenger vehicle...
TRANSCRIPT

China Passenger Vehicle Fuel Consumption
Development Annual Report 2016
The Innovation Center for Energy and Transportation
September, 2016

-2-
Executive Summary
One of the main drivers of the national increase of oil consumption, greenhouse
gases and pollutant emissions is the rapid growth of passenger vehicles ownership in
China over the past decade. International experiences demonstrate that fuel economy
standards are one of the most effective policy initiatives for improving vehicle fuel
efficiency, promoting technological development, and reducing greenhouse gas
emissions.
China started implementing its fuel economy standards in July 2005. Since then,
China’s fuel economy standard regime has expanded the original by-vehicle
weight-group fuel consumption limitation standard to also include by-vehicle
weight-group fuel consumption targets, corporate average fuel consumption targets,
also known as CAFC, and imported vehicles inclusion (as of Phase III, since 2012).
The Innovation Center for Energy and Transportation (iCET), as the only domestic
non-governmental organization to participate in China’s passenger car fuel consumption
standards system development, continues to track and analyze development of China’s
passenger car fuel consumption standard implementation. iCET’s efforts are primarily
aimed at advising policy-makers to design and enforce a robust and effective standard
regime.
iCET’s “2016 China Passenger Vehicle Fuel Consumption Development Annual
Report” – the sixth report of its kind – analyzes the gaps of Phase III and IV of China’s
fuel consumption standard based on China’s 2015 reported fuel consumption (FC)
data and production of each auto manufactures , presents auto manufactures’ individual
FC performance, evaluates New Energy Vehicles’ (NEVs) contribution to corporate and
overall car market performance, and proposes recommendations towards the 2020
target of 5L/100km and translates to CO2 emissions of 167kg/km (from the 2015 target
of 6.9L/100km or about CO2 120kg/km). The report’s key findings are highlighted
below:
1. In 2015, domestic passenger vehicle manufacturers’ CAFC reached an
average of 6.95L/100km; after including FC credits from NEV production,
the average CAFC decreased to 6.60L/100km, outperforming Phase III FC
target.
The 2015 domestic passenger vehicle FC target of 6.9L/100km was first announced
in the “Energy Saving and New Energy Automobile Industry development plan
(2012-2020)”. iCET’s analysis finds that, if calculating FC values and production volumes
of internal combustion engines vehicles (ICE) alone, China’s domestic passenger vehicle
manufacturers’ corporate average fuel consumption (CAFC) reached 6.95L/100km.

-3-
However, when accounting for new energy vehicles (NEVs, namely electric power engine
vehicles) production and FC figures, the 2015 domestic average CAFC score improved by
0.35L/100km to 6.60 L/100km, well below the average FC target. On the other hand,
importing enterprises’ CAFC was much higher than that of domestic passenger car
manufacturers, reaching 8.44L/100km if excluding NEVs, the national average fuel
consumption was improving slightly to 7.02L/100km if excluding NEVs, still some
0.12L/100km higher than the national average fuel consumption. Generally, the Phase III
target is still loose for manufactures to achieve.
Note: TCAFE-III stands for Target CAFC for the year 2015, the last implementation year of Phase III; By
definition, domestic manufacturers CAFC is inclusive of both joint ventures (JVs) and independent
manufactures.
2015 CAFC versus 2015 Target CAFC (By manufacturer type)
2. In the past decade, passenger car fuel consumption (excluding NEVs) has
slowly improved, due in large part to a gradual increase in the production
of larger and heavier vehicle models; thus, the standard and management
regime could gain greater impacts on fuel consumption (and respected
emissions) by encouraging lighter and smaller vehicle production.
Overall FC levels have shown an average annual decline of less than 2% over the
past decade representing a very modest 0.10 to 0.25 L/100km annual reduction rate.
Independent enterprises’ FC reduction rates were the slowest, with an average annual
decline of less than 1% (0.5L/100km decrease in the last decade). Increases in large
weight-group models manufacturing helps to explain the annual slowing FC
improvements. Statistics indicate that, between 2012 and 2015(phase III duration),
93.1% 93.2% 92.4%95.1%
91.5%
85%
90%
95%
100%
105%
110%
4.0
5.0
6.0
7.0
8.0
9.0
10.0
National Average Domestic JV Independent Import
CAFC2015 TCAFC-III CAFC2015/TCAFC-III

-4-
domestic passenger cars’ average curb weight increased by 70kg while that for
independent passenger cars increased by 150kg. Generally, a 100kg increase in curb
weight is accountable for an increase of about 0.4-0.6L/100km. Therefore, independent
enterprises’ FC performance declines 0.6-0.9L/100km due to an increase in curb-weight.,
Better FC results could be achieved through an increased attention to model type and
production volumes in China’s FC standards regime.
2006-2015 national average fuel consumption and curb weight trends
2006-2015 fuel consumption and curb weight trends for JVs and
independent manufacturers
3. The NEV super credits in CAFC calculation helps independent
manufacturers to reach short-term targets, but also weakens the
8.11 7.99
7.88 7.97
7.71
7.53
7.33 7.22
7.02
13131330
13631372
1387
1200
1240
1280
1320
1360
1400
6.50
7.00
7.50
8.00
8.50
2007 2008 2009 2010 2011 2012 2013 2014 2015
Cu
rb W
eigh
t,k
g
Natianal Average Fuel Consumption Average Curb Weight
Phase I Phase II Phase III
16.3% 12.2% 4.4%
8.37
8.13 7.99
7.97
8.02
7.69
7.42 7.31
7.11
6.92
7.55
7.75
7.54 7.43
7.49 7.23 7.30
6.95
7.14
7.01
1313 1321
1361 1363 1369
1192
1233
13181335
1357
1100
1150
1200
1250
1300
1350
1400
6.50
7.00
7.50
8.00
8.50
2006 2007 2008 2009 2010 2011 2012 2013 2014 2015
Cu
rb W
eigh
t, k
g
Fu
el C
on
sum
pti
on,
L/1
00
km
JV FC Independent FC JV CW Independent CW
Phase I Phase II Phase III
-5-
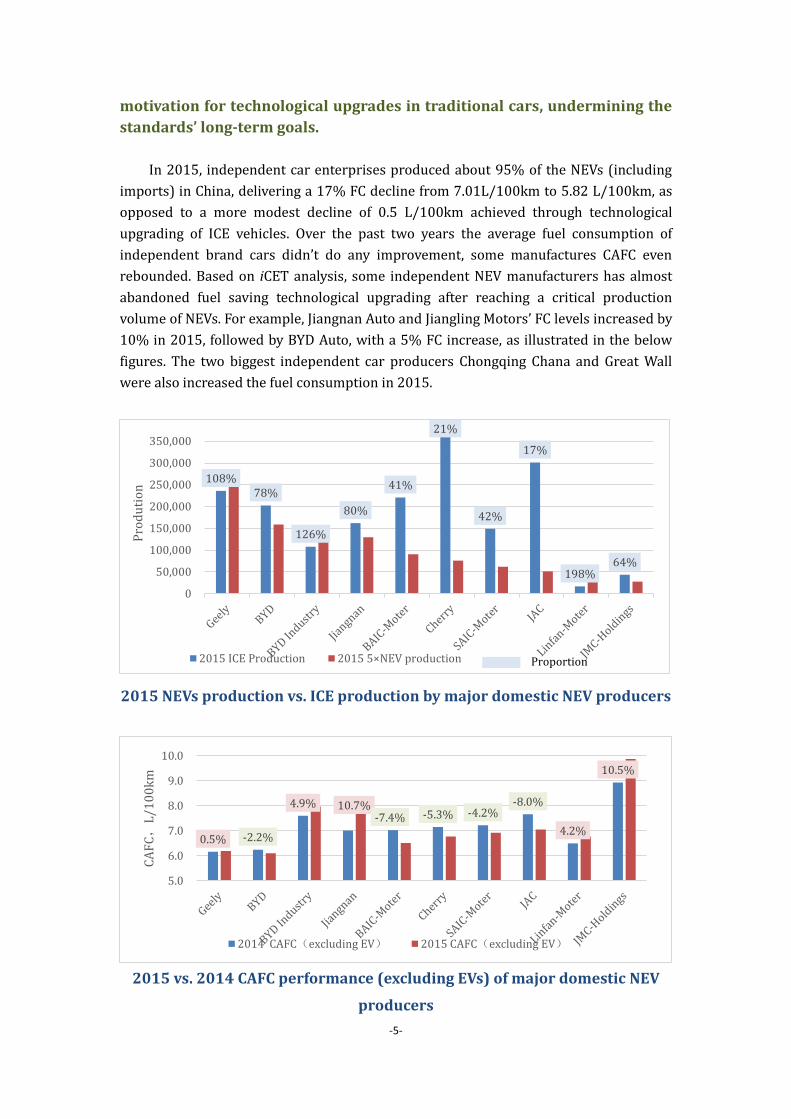
motivation for technological upgrades in traditional cars, undermining the
standards’ long-term goals.
In 2015, independent car enterprises produced about 95% of the NEVs (including
imports) in China, delivering a 17% FC decline from 7.01L/100km to 5.82 L/100km, as
opposed to a more modest decline of 0.5 L/100km achieved through technological
upgrading of ICE vehicles. Over the past two years the average fuel consumption of
independent brand cars didn’t do any improvement, some manufactures CAFC even
rebounded. Based on iCET analysis, some independent NEV manufacturers has almost
abandoned fuel saving technological upgrading after reaching a critical production
volume of NEVs. For example, Jiangnan Auto and Jiangling Motors’ FC levels increased by
10% in 2015, followed by BYD Auto, with a 5% FC increase, as illustrated in the below
figures. The two biggest independent car producers Chongqing Chana and Great Wall
were also increased the fuel consumption in 2015.
2015 NEVs production vs. ICE production by major domestic NEV producers
2015 vs. 2014 CAFC performance (excluding EVs) of major domestic NEV
producers
108%78%
126%
80%
41%
21%
42%
17%
198%64%
0
50,000
100,000
150,000
200,000
250,000
300,000
350,000
Pro
du
tio
n
2015 ICE Production 2015 5×NEV production Proportion
0.5% -2.2%
4.9% 10.7%-7.4% -5.3% -4.2%
-8.0%
4.2%
10.5%
5.0
6.0
7.0
8.0
9.0
10.0
CA
FC,
L/1
00
km
2014 CAFC(excluding EV) 2015 CAFC(excluding EV)

-6-
2015 NEVs CAFC credits effects on CAFC of major domestic NEV producers
4. Greater FC improvements, on the vehicle and corporate levels, are still in
need and fuel saving technologies could effectively deliver the necessary FC
improvements on the vehicle and corporate levels. CAFC Phase IV’s
increased stringency requires profound strategic changes in corporate
technological development.
iCET’s 2016 CAFC analyses reveals that the CAFC2015/TCAFC-IV ratio is 136% and
decreases to 129% only after including NEVs. Moreover, about 25% of the vehicle
models produced in 2015 do not reach the FC limits of CAFC Phase IV, despite the fact
that the new FC limits should have been met by 1st Jan 2016 for newly certified models,
and by 1st Aug 2018 for produced models. While the first implementation years of Phase
IV allow for some flexibility, with a 5-fold calculation privilege for NEVs (with FC counted
as 0 for EVs), the task of meeting the standards that increase in stringency over time will
be tough. From 2018 to 2020, the required 10% decrease in CAFC2015/TCAFC-IV ratio
(annual FC decline of 0.5L/100km on average) will suffice fuel saving technologies. The
projected 3 or 2-fold calculation privilege for NEVs replacing the current 5-fold in later
stages of Phase IV, or re-considerations of NEVs’ energy consumption (from the current
value of 0), poses a great challenge in meeting the CAFC target. Furthermore, iCET’s
scenario analysis reveals that a 40-80% FC decline can be obtained through fuel saving
technologies, and another 5-25% FC decline can be gained through off-cycle energy
saving technologies (e.g. kinetic energy recovery systems, efficient air conditioning, idle
start-stop system, and shift reminder). That means 65-85% FC declines for CAFC Phase
IV still depends on energy saving technologies, making it essential for the corporate
sector to advance its traditional manufacturing lines.
Geely
BYDBYDIndustry
Jiangnan
BAIC-
Moter
Cherry
SAIC-
Moter
JAC
Linfan-
Moter
JMC-Holdings
CAFC(excluding NEVs) 6.17 5.88 7.98 7.75 6.55 6.72 6.92 7.01 6.52 9.64
CAFC(including NEVs) 2.69 3.15 3.30 3.95 4.39 5.37 4.70 5.82 1.93 5.46
-56%
-46%
-58%-49%
-33% -20% -32% -17%-70%
-43%
0.0
2.0
4.0
6.0
8.0
10.0
12.0
L/1
00
km
CAFC(excluding NEVs) CAFC(including NEVs)
-7-
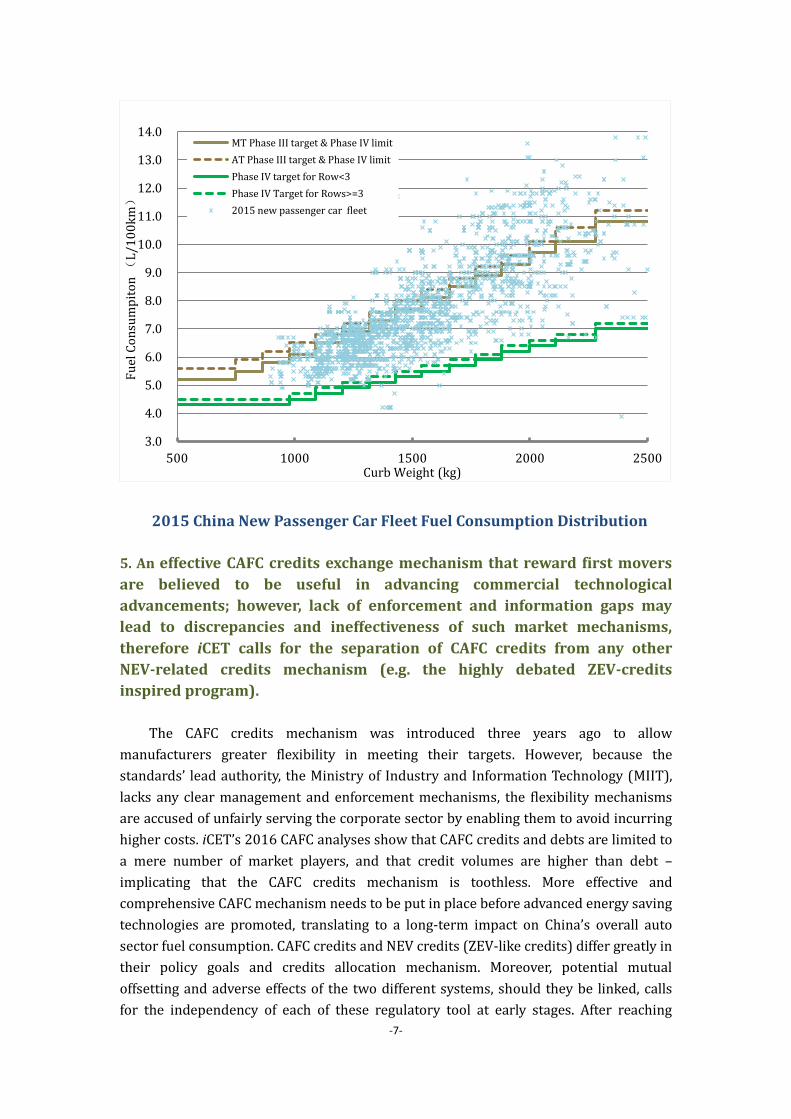
2015 China New Passenger Car Fleet Fuel Consumption Distribution
5. An effective CAFC credits exchange mechanism that reward first movers
are believed to be useful in advancing commercial technological
advancements; however, lack of enforcement and information gaps may
lead to discrepancies and ineffectiveness of such market mechanisms,
therefore iCET calls for the separation of CAFC credits from any other
NEV-related credits mechanism (e.g. the highly debated ZEV-credits
inspired program).
The CAFC credits mechanism was introduced three years ago to allow
manufacturers greater flexibility in meeting their targets. However, because the
standards’ lead authority, the Ministry of Industry and Information Technology (MIIT),
lacks any clear management and enforcement mechanisms, the flexibility mechanisms
are accused of unfairly serving the corporate sector by enabling them to avoid incurring
higher costs. iCET’s 2016 CAFC analyses show that CAFC credits and debts are limited to
a mere number of market players, and that credit volumes are higher than debt –
implicating that the CAFC credits mechanism is toothless. More effective and
comprehensive CAFC mechanism needs to be put in place before advanced energy saving
technologies are promoted, translating to a long-term impact on China’s overall auto
sector fuel consumption. CAFC credits and NEV credits (ZEV-like credits) differ greatly in
their policy goals and credits allocation mechanism. Moreover, potential mutual
offsetting and adverse effects of the two different systems, should they be linked, calls
for the independency of each of these regulatory tool at early stages. After reaching
3.0
4.0
5.0
6.0
7.0
8.0
9.0
10.0
11.0
12.0
13.0
14.0
500 1000 1500 2000 2500
Fu
el C
on
sum
pit
on(
L/1
00
km)
Curb Weight (kg)
MT Phase III target & Phase IV limit
AT Phase III target & Phase IV limit
Phase IV target for Row<3
Phase IV Target for Rows>=3
2015 new passenger car fleet

-8-
maturity and proving their effectiveness, an integration of some sort should be
considered.
2012-2015 Main CAFC Credits/Debts Producers for Domestic Car
Companies
-20
0
20
40
60
80
100
120
140
160
180
CA
FC
cred
its/
deb
t,1
00
00
L/1
00
km
2015 2014 2013 2012
CAFC credits producers CAFC debt producters