china’s corporate governance - princeton university
TRANSCRIPT

CORPORATE
GOVERNANCE IN CHINA Cong Wang
Shenzhen Finance Institute
School of Management and Economics
Chinese University of Hong Kong, Shenzhen

Agency Problems
• The type I agency problem • Firms with diffused ownership structure
• Conflict of interests between managers and
shareholders
• The type II agency problem • Firms with concentrated ownership structure
• Conflict of interests between controlling shareholders
and minority shareholders

The Type II Agency Problem:
The conflict of interests between controlling and
minority shareholders
• Ownership held by controlling owners (in percentage points)
SOE
Year N Mean Std P10 P25 Median P75 P90
2003 677 46.74 16.48 25.00 33.36 47.31 59.68 67.57
2004 904 46.05 16.57 24.31 31.48 46.62 59.63 67.57
2005 881 44.53 16.18 23.62 30.18 44.65 57.95 65.81
2006 877 39.75 15.71 19.82 27.45 39.04 51.51 60.08
2007 899 39.16 15.73 19.43 26.61 38.74 50.50 60.01
2008 914 39.12 15.62 18.86 26.58 38.92 50.74 59.81
2009 919 39.87 16.02 19.19 27.46 39.28 51.45 61.04
2010 962 39.73 15.87 19.68 26.91 39.37 51.51 61.06
2011 965 39.74 16.06 19.36 26.78 39.27 51.33 61.36
2012 969 40.00 15.99 19.86 27.00 39.37 51.64 61.49
2013 961 40.05 15.96 20.00 27.26 39.34 51.73 61.51
2014 959 39.93 15.82 20.07 27.19 39.46 51.33 61.42
2015 992 39.07 15.54 20.08 26.59 37.82 50.25 60.19
NonSOE
Year N Mean Std P10 P25 Median P75 P90
2003 108 31.08 12.61 16.53 23.75 28.97 36.13 52.34
2004 317 32.38 12.85 18.62 24.58 29.01 39.94 52.50
2005 343 31.52 12.31 18.12 23.86 28.88 37.41 51.92
2006 417 30.59 12.92 17.80 21.74 27.40 36.91 49.66
2007 504 31.95 14.09 16.90 21.84 29.19 41.01 51.62
2008 546 32.49 14.42 16.54 21.95 29.49 41.86 52.28
2009 674 33.23 15.28 16.39 22.10 29.90 42.49 53.66
2010 971 34.40 15.69 16.97 22.56 31.39 44.46 55.06
2011 1206 33.79 14.66 16.48 22.77 31.29 43.16 53.82
2012 1300 34.00 14.62 17.04 22.67 31.56 43.23 54.55
2013 1332 33.84 14.80 16.65 22.57 31.46 42.93 54.08
2014 1437 33.12 14.33 16.38 22.17 31.14 42.01 52.36
2015 1611 32.02 13.64 15.72 21.45 30.29 40.91 50.36
Data Source: CSMAR
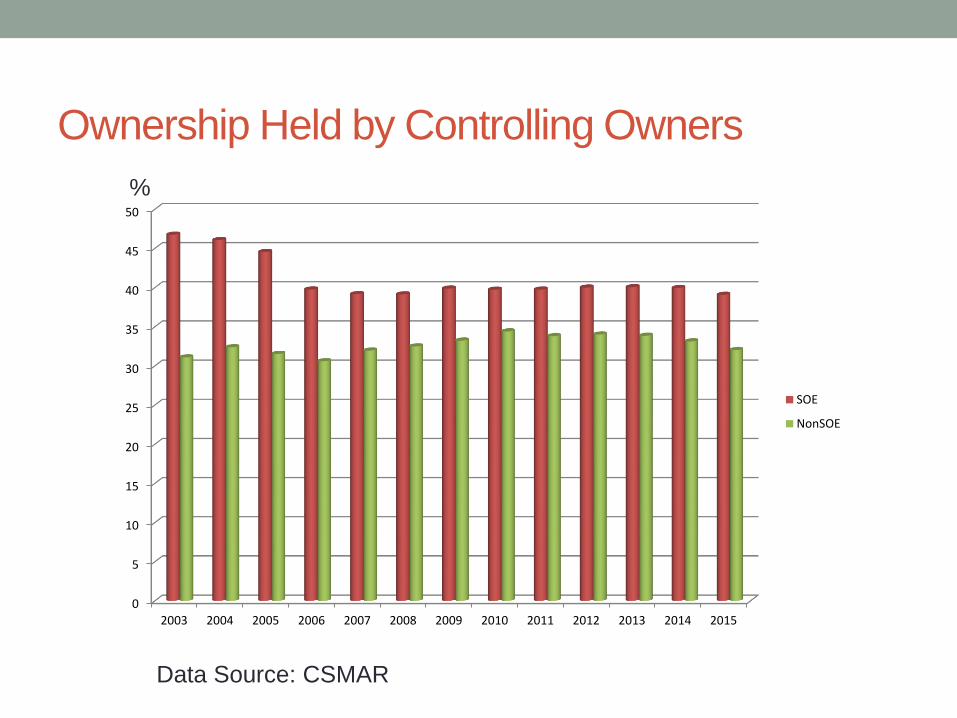
Ownership Held by Controlling Owners
0
5
10
15
20
25
30
35
40
45
50
2003 2004 2005 2006 2007 2008 2009 2010 2011 2012 2013 2014 2015
SOE
NonSOE
%
Data Source: CSMAR

The Type II Agency Problem • Separation of ownership and control (excess control rights in percentage
points)
year SOE NonSOE
p-values for
mean/median
difference test
2003
Mean 2.09 9.76 <0.001
Median 0.00 9.17 <0.001
2004
Mean 3.71 11.82 <0.001
Median 0.00 11.22 <0.001
2005
Mean 4.20 11.81 <0.001
Median 0.00 11.12 <0.001
2006
Mean 4.12 10.97 <0.001
Median 0.00 9.91 <0.001
2007
Mean 4.27 10.14 <0.001
Median 0.00 8.66 <0.001
2008
Mean 4.46 9.20 <0.001
Median 0.00 7.32 <0.001
2009
Mean 4.18 8.46 <0.001
Median 0.00 5.92 <0.001
2010
Mean 4.17 6.58 <0.001
Median 0.00 2.61 <0.001
2011
Mean 4.22 6.06 <0.001
Median 0.00 1.58 <0.001
2012
Mean 4.19 6.00 <0.001
Median 0.00 1.16 <0.001
2013
Mean 4.23 5.85 <0.001
Median 0.00 0.73 <0.001
2014
Mean 4.10 5.29 <0.001
Median 0.00 0.40 <0.001
2015
Mean 4.22 4.92 0.019
Median 0.00 0.13 <0.001
Data Source:
CSMAR

Wedge between Control Rights and Cash-flow Rights
%
Data Source: CSMAR
0.0
2.0
4.0
6.0
8.0
10.0
12.0
2003 2004 2005 2006 2007 2008 2009 2010 2011 2012 2013 2014 2015
SOE
NonSOE

The Type II Agency Problem: An Example
• The Fraud and Delisting of Dandong Xintai Electric Stock
Co. Ltd.(丹东欣泰电气股份有限公司)
• Founded in 1999, main line of business is manufacturing
electronic capacitors;
• IPO in January 2014, but was charged of fraudulent listing
and forced to be delisted in June 2017(the first company
delisted from the growth enterprise board);
• Convicted of providing fake financial data in its IPO
application and releasing false information in regular
reports.

The Type II Agency Problem: An example
• Had kept a large balance of receivables, a risk that can
increase of the chance of IPO failure.
• Reduce the balance of receivables at the end of
accounting period via external loans or forged bank bills.
• Continued to do so after IPO.
• Investigation from CSRC showed that the company made
up that it had taken back 72.62 million RMB of receivables
and 74.78 million RMB of other receivables in year 2014.
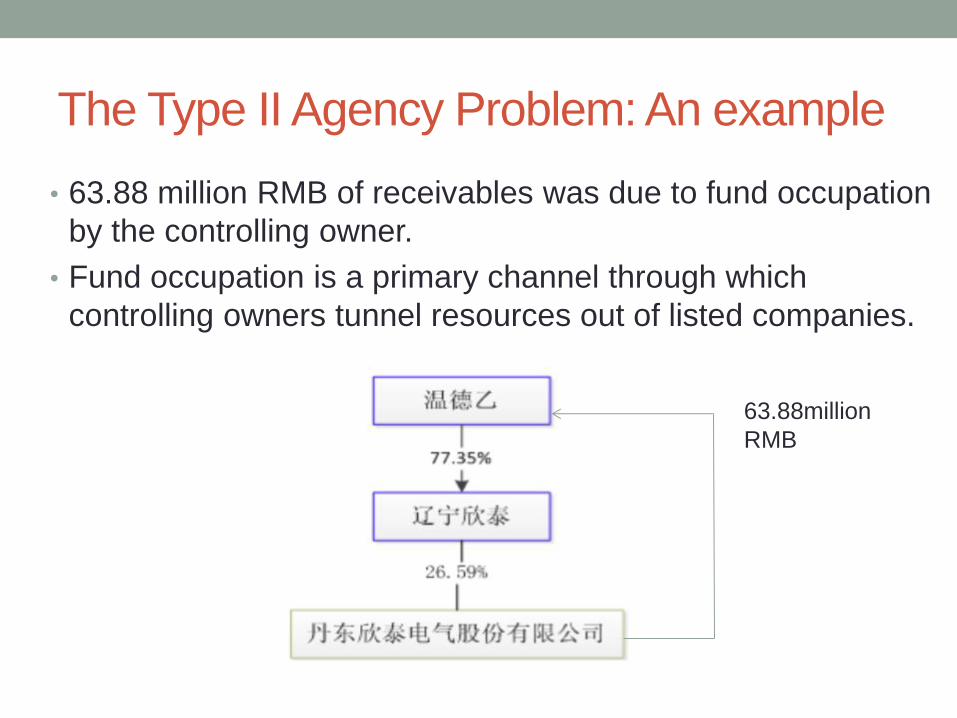
The Type II Agency Problem: An example
• 63.88 million RMB of receivables was due to fund occupation
by the controlling owner.
• Fund occupation is a primary channel through which
controlling owners tunnel resources out of listed companies.
63.88million
RMB
The Type II Agency Problem:
Ways to Expropriate Minority Shareholders
• Fund occupation by the controlling shareholder (termed
“intercorporate loans in Jiang, Lee, and Yue (2010)
• Most of these loans do not accrue interest, and sometimes the
principals were never paid back
• Buying assets at high premiums from the controlling
shareholder
• Selling high quality assets at cheap price to the controlling
shareholder
• Provide loan guarantee when the controlling shareholder
borrows from banks

Corporate Governance Mechanisms
Governance
Mechanisms
Internal
External
Board of Directors
Compensation Design
Takeover Markets
Institutional
Shareholders
Blockholder Activism
Rules and Regulations

Board of Directors
• Two-tier board system: The board of directors and the
supervisory board;
• The number of director sitting on the board must be at least
5 and no more than 19;
• The supervisory board must have at least 3 members, 1/3 of
which have to be employee representatives;
• 1/3 of board members must be independent directors (after
2003);
• An independent director cannot be a significant shareholder
who owns more than 1% of shares or be related to a
shareholder who holds more than 5% of the shares.

Board of Directors
• Staggered boards are not allowed in China
• But a director can serve up to two consecutive terms on the board and each term is three years
• Only directors whose first terms are expiring stand up for reelection each year, rather than all at once
• Similar to a staggered board
• Cumulative voting system for director election
• Board committees
• Most companies have 4 committees: an audit committee, a nomination committee, a compensation committee, and a corporate strategy committee.
• The first three committees must be chaired by independent directors and have the majority of committee members being independent.
• At least one independent director on the audit committee needs to be an accounting expert

Board of Directors
• Which types of directors can enhance board
monitoring?—U.S. evidence • Independent directors with no social connections with
managers (former colleagues at other firms, went to the
same school, belong to the same golf club, etc.) (Hwang
and Kim, 2009)
• Directors who are less busy (Fich and Shivdasani, 2006)
• Independent directors with expertise in the firm’s industry
(Wang, Xie, and Zhu, 2015)

Board of Directors: Board Size and the Number of
Independent Directors
Data Source: CSMAR
0.0
1.0
2.0
3.0
4.0
5.0
6.0
7.0
8.0
9.0
10.0
2002 2003 2004 2005 2006 2007 2008 2009 2010 2011 2012 2013 2014 2015 2016
Board Size
Number ofIndependentDirectors
Number of directors

Board of Directors: Percentage of Independent
Directors
Data Source: CSMAR
0.0%
5.0%
10.0%
15.0%
20.0%
25.0%
30.0%
35.0%
40.0%
2002 2003 2004 2005 2006 2007 2008 2009 2010 2011 2012 2013 2014 2015 2016
% of Independent Directors
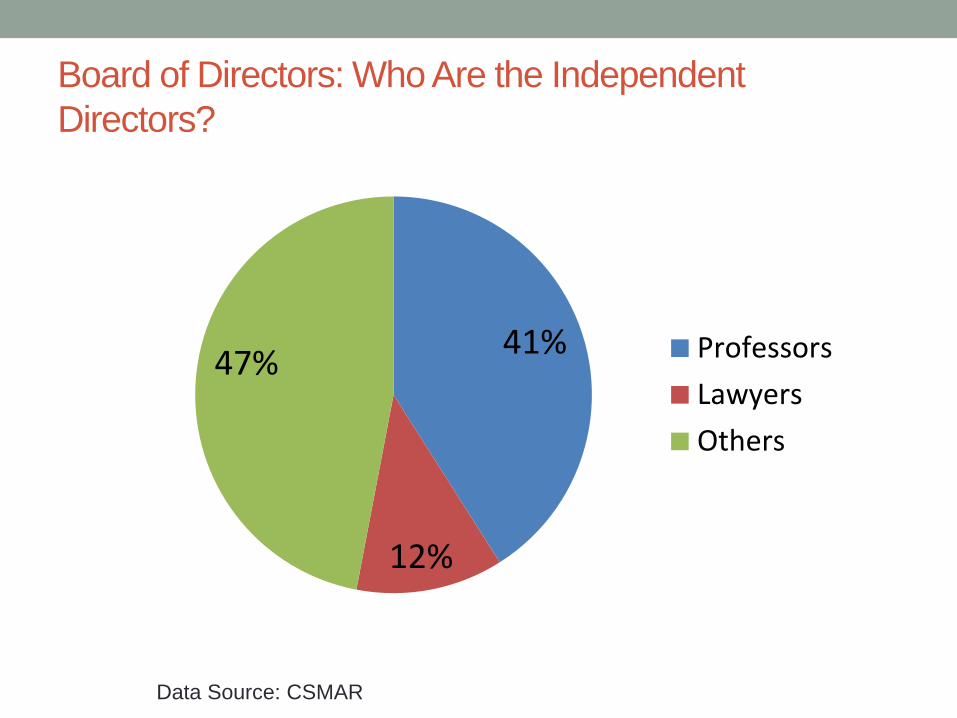
Board of Directors: Who Are the Independent
Directors?
Data Source: CSMAR
41%
12%
47% Professors
Lawyers
Others

Board of Directors: How Do Directors Vote?
Data Source: CSMAR
99.83%
0.17%
Vote for
Disenting orAbstention
In 2004, CSRC mandated that public-traded firms in China
disclose how directors vote on proposals sponsored by
management or controlling shareholders.

Executive Compensation
• Li, Lou, Wang, Yuan (2013), “A survey of executive
compensation contracts in China’s listed companies” (China
Journal of Accounting Research)
• Hand-collected 228 executive compensation contracts disclosed by
public firms
• Firms are required to disclose the total compensation for top
managers, directors, and members of the supervisory board
• Firms are also required to disclose equity-based incentive plans when
adopting such plans
• Disclosure of the details of compensation contracts is voluntary

Executive Compensation
• Findings of Li, Lou, Wang, Yuan (2013)
• Chinese companies do use performance-based compensation

Executive Compensation
• Findings of Li, Lou, Wang, Yuan (2013) • Chinese companies do use performance-based
compensation
• Performance measures in compensation contracts are
mostly accounting measures, rarely based on stock returns
• Performance measures are in absolute terms, rarely
benchmarked to industry peers
• Executive compensation primarily consists of basic salary
and performance compensation (bonus), but relatively little
equity-based compensation
• SOEs offer more performance-based pay than Non-SOEs

Institutional Shareholders • Ownership held by institutional shareholders(in percentage
points)
Year Number
of firms Mean Std. P10 P25 Median P75 P90
2003 930 7.30 14.28 0.16 0.72 2.45 6.25 16.60
2004 969 8.80 15.00 0.33 1.08 3.12 9.05 23.64
2005 975 9.24 14.56 0.40 1.19 4.00 10.25 22.80
2006 1078 9.41 13.13 0.60 1.59 4.62 11.60 22.18
2007 1166 9.69 12.75 0.53 1.52 5.47 12.76 21.84
2008 1134 9.57 12.67 0.68 1.76 5.35 12.10 21.56
2009 1375 8.37 11.41 0.48 1.48 4.95 10.35 18.60
2010 1753 8.00 10.49 0.60 1.86 5.04 9.83 16.80
2011 2051 7.08 9.75 0.54 1.48 4.29 8.87 14.75
2012 2174 6.36 9.59 0.44 1.08 3.28 7.66 13.99
2013 2045 6.94 9.90 0.46 1.30 3.91 8.56 15.14
2014 2360 6.54 9.18 0.58 1.54 3.74 8.04 13.99
2015 2615 6.40 8.57 0.67 1.82 4.25 7.72 12.36
2016 2781 6.63 8.60 0.67 1.93 4.38 8.01 13.54
2017 2847 6.08 8.35 0.53 1.56 3.66 7.44 12.88
Data
Source:
CSMAR

Institutional Shareholders • Ownership held by different types of institutional
shareholders(in percentage points, at the end of 2017)
Types of Institutional Investors Mean Median
Security Fund 1.49 0.54
Insurance Company 0.50 0.00
QFII 0.22 0.00
Trust 1.97 0.41
Banks 0.04 0.00
Finance Company 0.02 0.00
Non Finance Company 1.20 0.00
Data Source: CSMAR

High Turnover Ratio in China • Turnover ratio= Value of domestic shares traded divided by
their market capitalization (in percentage points)
0.00
50.00
100.00
150.00
200.00
250.00
300.00
350.00
400.00
450.00
500.00
2003 2004 2005 2006 2007 2008 2009 2010 2011 2012 2013 2014 2015 2016 2017
Turover Ratio (China A Shares)
Turover Ratio
Data Source: World Bank

Turnover Ratios: Cross-country comparison (2017)
0.00
20.00
40.00
60.00
80.00
100.00
120.00
140.00
160.00
180.00
200.00
Arg
en
tina
Pe
ru
Mo
rocco
Sri
La
nka
Jord
an
Ira
n
Colo
mbia
Ph
ilipp
ines
New
Zea
land
Chile
Qa
tar
Indo
nesia
Un
ite
d A
rab
…
Ire
lan
d
Me
xic
o
Russia
n…
So
uth
Afr
ica
Au
str
ia
Sin
ga
pore
Gre
ece
Isra
el
Ma
laysia
Eg
yp
t
Vie
tna
m
Hun
ga
ry
Po
lan
d
Norw
ay
Hon
g K
on
g(C
hin
a)
Sa
ud
i A
rab
ia
India
Au
str
alia
Ca
nad
a
Sw
itze
rlan
d
Th
aila
nd
Ge
rma
ny
Bra
zil
Sp
ain
Jap
an
Ko
rea
Un
ite
d S
tate
s
Tu
rke
y
Chin
a
2017 Turnover Ratio
Data Source: World Bank

The Market for Corporate Control • Takeover Market in the U.S.: (1)Targets are public firms (2) Transactions result in
change-in-control (acquired over 51% of shares).
0
100
200
300
400
500
600
700
800
0
200
400
600
800
1000
1200
19
90
19
91
19
92
19
93
19
94
19
95
19
96
19
97
19
98
19
99
20
00
20
01
20
02
20
03
20
04
20
05
20
06
20
07
20
08
20
09
20
10
20
11
20
12
20
13
20
14
20
15
20
16
20
17
Deal Value
Number of Deals
Value of deals (in $ billion) Number of deals
Data Source: Thomson Reuters SDC

The Market for Corporate Control • Takeover Market in China: (1)Targets are public firms (2) Transactions result in
change-in-control (acquired over 30% of shares).
Value of deals (in billion RMB) Number of deals
Data Source: WIND
0
5
10
15
20
25
30
35
0
10
20
30
40
50
60
70
80
90
2003 2004 2005 2006 2007 2008 2009 2010 2011 2012 2013 2014 2015 2016 2017
Value of Deals (inbillion RMB)
Number of Deals

The Takeover Battle between Vanke and Baoneng
• Vanke is one of the largest real estate developers in China. • Relatively diffused ownership structure
• Performance lagged behind industry peers
• Baoneng is a low-profile conglomerate based in Shenzhen • Bought over 25% of Vanke’s shares in June 2016 in an attempt
to oust its the management.
• The hostile takeover eventually failed. • Vanke rescued by a “white knight”, Shenzhen Metro Group
• Regulators investigated the Baoneng’s funding of the takeover
• Baoneng issued high-yield investment products to get the funding of the takeover
• Baoneng’s Chairman, Yao Zhenhua, was barred from insurance industry for 10 years.
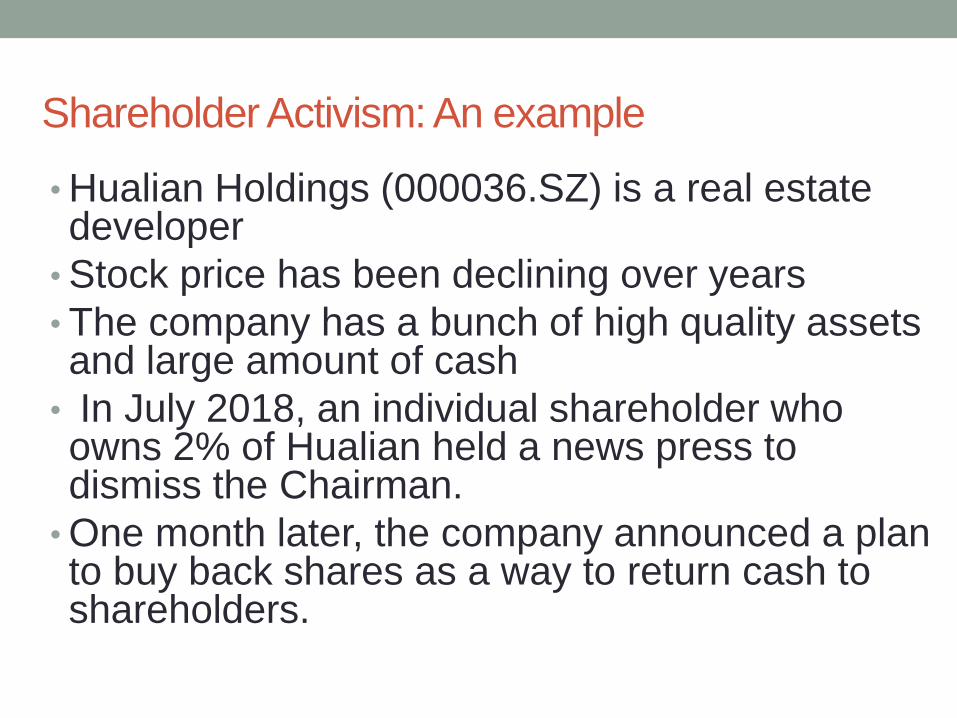
Shareholder Activism: An example
• Hualian Holdings (000036.SZ) is a real estate developer
• Stock price has been declining over years
• The company has a bunch of high quality assets and large amount of cash
• In July 2018, an individual shareholder who owns 2% of Hualian held a news press to dismiss the Chairman.
• One month later, the company announced a plan to buy back shares as a way to return cash to shareholders.


Governance Reform and Monitoring from
Regulators
• Split-share reform
• Prior to 2005, most listed firms had both tradable
shares (usually held by outside shareholders) and
non-tradable shares (held by controlling
shareholders)
• The split-share structure creates misincentives for
controlling shareholders
• The reform converts non-tradable shares into
tradable shares.

Governance Reform and Monitoring from
Regulators
• Split-share reform improves governance and
leads to more shareholder-value increasing
activities.
• Mitigates the “free cash flow” problem (Chen,
Chen, Schipper, Xu, and Xue, 2012)
• Improves performance of SOEs (Liao, Liu, and
Wang, 2014)
• Increases value-enhancing tax avoidance
activities (Li, Liu, and Ni, 2017)

Governance Reform and Monitoring from
Regulators
• Major regulators of governance-related matters:
CSRC and the two Stock Exchanges
• Regulatory agencies investigate violations of the
securities laws and regulations and bring actions
against alleged violators.
• Actions taken usually include: Monetary fines;
Disgorgement of illegal profits; Condemn; Criticize;
Warning; Banned from the market etc.
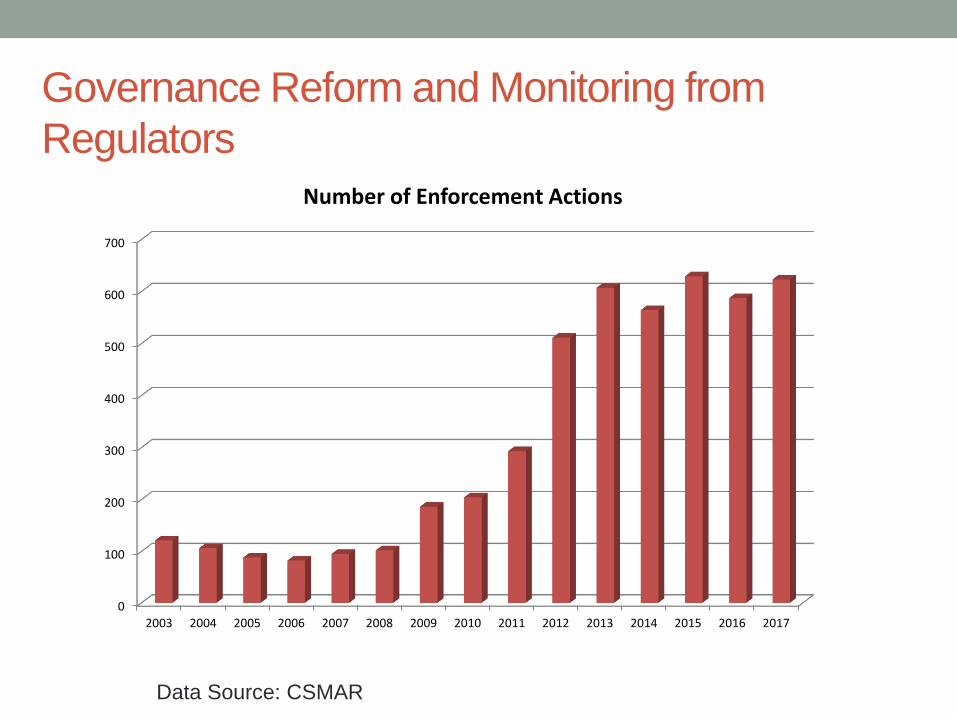
Governance Reform and Monitoring from
Regulators
0
100
200
300
400
500
600
700
2003 2004 2005 2006 2007 2008 2009 2010 2011 2012 2013 2014 2015 2016 2017
Number of Enforcement Actions
Data Source: CSMAR
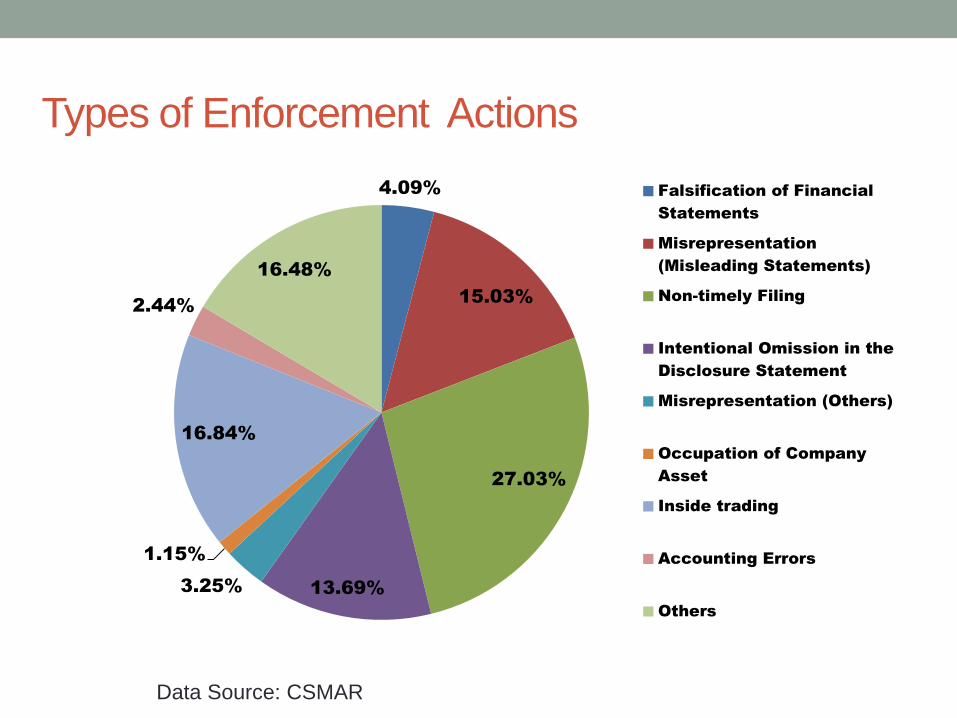
Types of Enforcement Actions
4.09%
15.03%
27.03%
13.69% 3.25%
1.15%
16.84%
2.44%
16.48%
Falsification of Financial
Statements
Misrepresentation
(Misleading Statements)
Non-timely Filing
Intentional Omission in the
Disclosure Statement
Misrepresentation (Others)
Occupation of Company
Asset
Inside trading
Accounting Errors
Others
Data Source: CSMAR

Conclusion
• The aim of corporate governance in China is to
mitigate the conflicts between controlling
shareholders and minority shareholders
• Internal governance, especially boards of directors,
are structured to fulfill regulatory requirements
• External governance still have a long way to
become truly effective
• Governance reforms, rules, and regulatory
enforcement actions play a dominant role.