china’s current account and exchange rate yin-wong cheung, ucsc & hku menzie d. chinn,...
Post on 22-Dec-2015
215 views
TRANSCRIPT

China’s Current Account and Exchange Rate
Yin-Wong CHEUNG, UCSC & HKU
Menzie D. CHINN, UW-Madison & NBER
Eiji FUJII, University of Tsukuba
NBER Conference
“China’s Growing Role in World Trade”
August 3, 2007

China’s Current Account
Source: IMF, World Economic Outlook April 2007 database
-40
0
40
80
120
160
200
240
280
320
-.04
-.02
.00
.02
.04
.06
.08
.10
.12
.14
1980 1985 1990 1995 2000 2005
Current Account(bn USD)[left scale]
Current Accountto GDP ratio[right scale]

The Value of CNY
Source: IMF, International Financial Statistics, author’s calculations
-5.2
-5.0
-4.8
-4.6
-4.4
-4.2
-4.0
86 88 90 92 94 96 98 00 02 04 06
Real TradeWeighted CNYExchange Rate
Feb.'075.5%
Thai bahtdevaluation
Chinese yuanrevaluation
Trend

Trade Balance and Forex Reserves
Source: IMF, International Financial Statistics
-10
-5
0
5
10
15
20
25
0
200
400
600
800
1,000
1,200
1,400
90 92 94 96 98 00 02 04 06
Chinese Trade Balance(nsa, bn. USD)[left scale]
Forex Reserves(ex-gold, bn. USD)[right scale]

Outline
• An analysis of the CNY misalignment issue using the standard deviations-from-Absolute PPP approach
• Highlighting the tension between economic and statistical significance
• Closer look at elasticities from a macro perspective
• The importance of uncertainty arises again
• Exchange rate is important but not central

Evaluating the Exchange Rate

Exploiting the “Penn Effect”
• Data from World Development Indicators, 1971-2005
• Vintages of WDI matter (the China path is substantially different than our previous paper)
• The r is in PPP terms, the y in USD, PPP terms

The “Penn Effect” Estimated
USD-based GDP PPP-based GDP [1] [2] [3] [4] [5] [6] [7] [8]
Pooled OLS
Between Fixed effects (Within)
Random effects
Pooled OLS
Between Fixed effects (Within)
Random effects
GDP per capita
0.259** (0.003)
0.259** (0.013)
0.387** (0.020)
0.309** (0.012)
0.317** (0.005)
0.309** (0.025)
0.386** (0.020)
0.361** (0.013)
Constant -.023** (0.008)
-.040 (0.044)
- .099** (0.036)
-.147** (0.010)
-.184** (0.055)
- -.084* (0.037)
Adjusted R2 0.564 0.677 0.800 0.564 0.413 0.467 0.800 0.413 F-test statistic
33.557** 54.362**
Hausman test statistic
19.013** 0.167
Number of observations
4600 4600

The “Penn Effect” Illustrated (I)
-4
-3
-2
-1
0
1
2
-5 -4 -3 -2 -1 0 1 2
Relative per capita income in PPP terms
Relative price level
China 2006
China 1975

The “Penn Effect” Illustrated (II)
-4
-3
-2
-1
0
1
2
-7 -6 -5 -4 -3 -2 -1 0 1 2
Relative per capita income in USD terms
Relative price level
China 2006
China 1975
Observations
• The 2005 CNY is about 1.5 standard errors from conditional mean, so statistically not misaligned
• But the point estimate indicates a 50% (!) undervaluation (in log terms)
• If one changes the definition of undervaluation as (e.g.) 3 consecutive years of misalignment, not much changes since ρ ≈ 0.95

Investigating China’s Trade Elasticities
-40
0
40
80
120
160
200
240
280
90 92 94 96 98 00 02 04 06
TradeBalance
China-US GoodsTrade Balance

Multilateral Trade Elasticities
• Standard static imperfect substitutes approach.• Analysis conducted on quarterly frequency, over
1993-06 period.• Sample period largely dictated by data
availability (changes in data collection).• y, y* are real GDP, q is CPI deflated, z is supply
variable, w additional demand factor

Chinese Exports
0
200
400
600
800
1,000
1,200
1994 1996 1998 2000 2002 2004 2006
Total Exports
OrdinaryExports
Proc. &Parts

Two (Recurring) Problems
• Chinese export data don’t match rest-of-world import data, vice versa
• No Chinese deflators, pre-2005
• We rely on the Chinese data for multilateral exports, imports
• We try various proxies as deflators

Proxies for Export Deflators
-.10
-.05
.00
.05
.10
.15
.20
1994 1996 1998 2000 2002 2004 2006
PPI
GLUK
HK UV

Panel A: Aggregate Exports [1] [2] [3] PPI GLUK HK UV
y* 5.23*** 5.30*** 6.01*** (0.29) (1.42) (0.35)
q -1.63*** -2.14*** -1.69*** (0.39) (0.68) (0.47)
Adj.R2 0.89 0.76 0.88 SER 0.186 0.272 0.223
Sample 93Q3-06Q2 93Q3-04Q2 93Q3-06Q2
Panel B: Ordinary Exports PPI GLUK HK UV
y* 4.98*** 4.82*** 5.76*** (0.32) (1.52) (0.38)
q -1.46*** -2.00*** -1.51*** (0.42) (0.73) (0.50)
Adj.R2 0.85 0.68 0.84 SER 0.209 0.293 0.244
Sample 93Q3-06Q2 93Q3-04Q2 93Q3-06Q2
Panel C: Processing and Parts Exports PPI GLUK HK UV
y* 5.35*** 5.14*** 6.13*** (0.27) (1.15) (0.33)
q -1.86*** -2.68*** -1.92*** (0.37) (0.56) (0.45)
Adj.R2 0.92 0.84 0.90 SER 0.171 0.220 0.208
Sample 93Q3-06Q2 93Q3-04Q2 93Q3-06Q2

Panel A: Aggregate Exports [1] [2] [3] PPI GLUK HK UV y* 0.57 -0.56 0.31 (0.40) (0.53) (0.40) q -0.06 0.26 0.27 (0.23) (0.22) (0.22) z 1.68*** 2.35*** 2.06*** (0.16) (0.16) (0.15) Adj.R2 0.98 0.98 0.99 SER 0.077 0.080 0.076 Sample 93Q3-06Q2 93Q3-04Q2 93Q3-06Q2 Panel B: Ordinary Exports PPI GLUK HK UV y* 0.04 -1.26 -0.22 (0.55) (0.75) (0.55) q 0.31 0.61* 0.64* (0.32) (0.31) (0.32) z 1.83*** 2.51*** 2.22*** (0.22) (0.22) (0.22) Adj.R2 0.96 0.96 0.97 SER 0.106 0.108 0.105 Sample 93Q3-06Q2 93Q3-04Q2 93Q3-06Q2 Panel C: Processing and Parts Exports PPI GLUK HK UV y* 0.98*** 0.26 0.72** (0.30) (0.32) (0.31) q -0.47** -0.62*** -0.14 (0.19) (0.16) (0.18) z 1.52*** 1.99*** 1.91*** (0.11) (0.10) (0.11) Adj.R2 0.92 0.99 0.99 SER 0.065 0.060 0.062 Sample 93Q3-06Q2 93Q3-04Q2 93Q3-06Q2

Observations
• Holding z constant results in really high income elasticity estimates, wrong sign on exchange rate.
• For aggregate exports, only z matters.• For ordinary exports, income is
insignificant, while others come in significantly
• Processing and parts exports fit quite well• All results sensitive to inclusion of trend

Chinese Imports
0
100
200
300
400
500
600
700
800
900
1994 1996 1998 2000 2002 2004 2006
Total Imports
OrdinaryImports
Proc. &Parts

Proxies for Import Deflators
-.15
-.10
-.05
.00
.05
.10
.15
.20
.25
1994 1996 1998 2000 2002 2004 2006
PPI
GLUK
HK UV

Panel A: Aggregate Imports [1] [2] [3] PPI GLUK HK UV y 1.78*** 1.41*** 2.16*** (0.06) (0.04) (0.06)
q 1.48*** 0.39** 1.54*** (0.38) (0.19) (0.32)
Adj.R2 0.99 0.98 0.99 SER 0.056 0.050 0.055
Sample 94Q4-06Q2 94Q4-04Q2 94Q4-06Q2 Panel B: Ordinary Imports
PPI GLUK HK UV y 2.16*** 2.40*** 2.54*** (0.26) (0.32) (0.27)
q 2.75** 2.25** 2.80** (1.18) (1.06) (1.19)
Adj.R2 0.85 0.94 0.94 SER 0.209 0.152 0.196
Sample 94Q4-06Q2 94Q4-04Q2 94Q4-06Q2 Panel C: Processing and Parts Imports PPI GLUK HK UV
y 1.68*** 0.85*** 2.06*** (0.08) (0.13) (0.06)
q 1.15*** -0.25 1.20*** (0.35) (0.34) (0.28)
R2 0.98 0.88 0.99 SER 0.072 0.080 0.060
Sample 94Q4-06Q2 94Q4-04Q2 94Q4-06Q2

Some Observations
• Aggregate, ordinary imports have wrong signed price elasticities
• Processing and parts imports only slightly better behaved
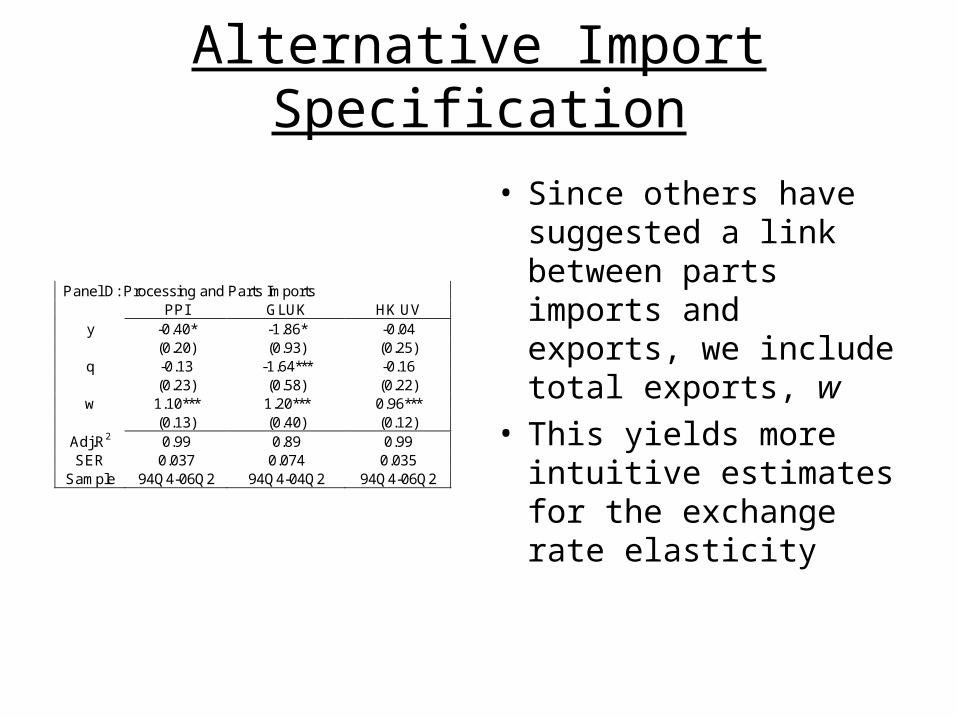
Alternative Import Specification
Panel D: Processing and Parts Imports PPI GLUK HK UV y -0.40* -1.86* -0.04 (0.20) (0.93) (0.25)
q -0.13 -1.64*** -0.16 (0.23) (0.58) (0.22)
w 1.10*** 1.20*** 0.96*** (0.13) (0.40) (0.12)
Adj.R2 0.99 0.89 0.99 SER 0.037 0.074 0.035
Sample 94Q4-06Q2 94Q4-04Q2 94Q4-06Q2
• Since others have suggested a link between parts imports and exports, we include total exports, w
• This yields more intuitive estimates for the exchange rate elasticity

Implications for Policy (I)
Multilateral basis, 10% appreciation leads to
• A decline of imports by 70 bn
• A rise in the TB of 15 bn
• Zeroing out the perverse elasticity leads to a decline in the TB of 46 bn
• 2006 TB was 956 bn (2000$)
• ( < $86 bn in Marquez-Schindler)
• A decline of exports by 25 bn (2000$)
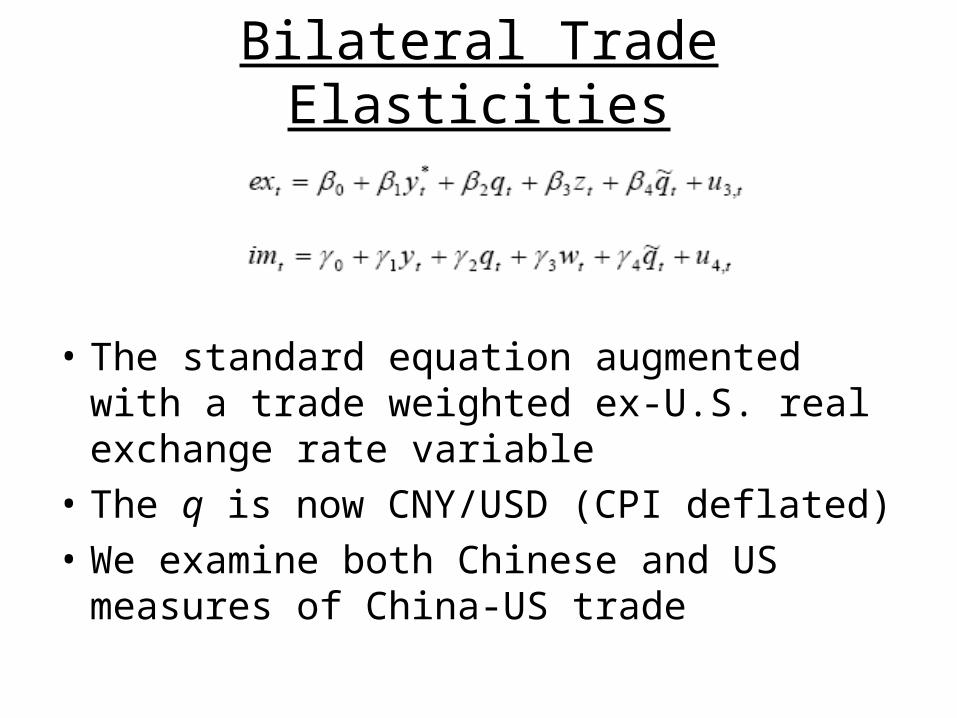
Bilateral Trade Elasticities
• The standard equation augmented with a trade weighted ex-U.S. real exchange rate variable
• The q is now CNY/USD (CPI deflated)
• We examine both Chinese and US measures of China-US trade

Chinese Exports to U.S.
0
50
100
150
200
250
300
350
1994 1996 1998 2000 2002 2004 2006
US data
Chinesedata

What Accounts for the Differences?
• For Chinese exports, Chinese record as f.o.b., US reports as c.i.f.
• Chinese goods transiting HK might or might not be correctly attributed to China
• Value added in HK might be improperly attributed to China
(see e.g., Schindler and Beckett, 2006)

Proxies for Chinese-U.S. Export Deflators
-.15
-.10
-.05
.00
.05
.10
.15
.20
92 94 96 98 00 02 04 06
PPI
Composite
HK UV

CNY/USD Real Exchange Rate
4
5
6
7
8
9
10
11
12
13
86 88 90 92 94 96 98 00 02 04 06
AdjustedNominalCNY/USD
AdjustedReal CNY/USD
Note: “Adjusted” indicates nominal exchange rate takes into account transactions taking place at floating rate.

Chinese Bilateral Export Elasticities
U.S. Data Chinese Data [1] [2] [3] [4] [5] [6] PPI P HK UV PPI P HK UV
y* 0.03 0.59 0.56 -1.75* -1.19 -0.62 (0.80) (0.73) (0.75) (0.99) (0.92) (0.99)
q 0.80*** 1.27*** 1.05*** 1.55*** 2.03*** 1.65*** (0.22) (0.22) (0.20) (0.30) (0.29) (0.31)
q~ 0.47 0.68 1.04 1.31 1.52 1.08 (0.72) (0.67) (0.71) (0.88) (0.89) (0.80) z .82*** 2.14*** 2.04*** 3.12*** 3.45*** 2.98*** (0.32) (0.31) (0.33) (0.47) (0.45) (0.46)
Adj.R2 0.99 0.99 0.99 0.99 0.99 0.99 SER 0.040 0.039 0.042 0.049 0.048 0.048
Sample 93Q4-06Q2
93Q4-06Q2
93Q4-06Q2
93Q4-06Q2
93Q4-06Q2
93Q4-06Q2

Chinese Imports from U.S.
0
10
20
30
40
50
60
70
1994 1996 1998 2000 2002 2004 2006
US data
Chinesedata

Proxies for Chinese-U.S. Import Deflators
-.15
-.10
-.05
.00
.05
.10
.15
.20
92 94 96 98 00 02 04 06
PPI
US capitalgoods exportsdeflator
HK UV

Chinese Bilateral Import Elasticities
U.S. Data Chinese Data [1] [2] [3] [4] [5] [6] PPI P HK UV PPI P HK UV y 1.45*** 2.02*** 1.85*** 1.24** 1.81*** 1.65*** (0.33) (0.35) (0.32) (0.46) (0.48) (0.45)
q -1.31*** -1.13*** -0.99*** 0.25 0.43 0.57 (0.33) (0.32) (0.32) (0.39) (0.42) (0.45)
q~ -0.26 0.69 -0.21 0.36 1.32 0.42 (1.06) (1.10) (1.04) (1.51) (1.56) (1.51)
Adj.R2 0.95 0.96 0.97 0.95 0.96 0.97 SER 0.101 0.101 0.100 0.087 0.091 0.087
Sample 94Q4-06Q2
94Q4-06Q2
94Q4-06Q2
94Q4-06Q2
94Q4-06Q2
94Q4-06Q2

Implications for Policy (II)
A 10% real appreciation of CNY/USD results in
• 33 bn (2000$) reduction in trade balance
• The 2006 China-US trade balance was 229 bn (2000)
• No necessary implication for overall US trade deficit

Next Tasks
• Formal calculation of misalignment probabilities
• Checking for sensitivity to additional regressors
• Alternative measures of rest-of-world GDP (export weighted GDP, world imports)