china's foreign of a more ba china's foreign trade in the - cepii
TRANSCRIPT
China’s foreign trade in the perspectiveof a more balanced economic growth
No 201
China’s foreign trade in the perspectiveof a more balanced economic growth
_____________
Guillaume GaulierFrançoise Lemoine
Deniz Ünal
11 – 03 March
DO
CU
ME
NT
DE
TR
AV
AIL
China’s foreign trade in the perspective of a more balanced economic growth
_____________
Guillaume Gaulier Françoise Lemoine
Deniz Ünal
CEPII, WP No 2011-03 China’s foreign trade in the perspective of a more balanced economic growth
2
TABLE OF CONTENTS
Non-technical summary ........................................................................................................... 3
Abstract .................................................................................................................................... 4
Résumé non technique ............................................................................................................. 5
Résumé court ............................................................................................................................ 6
Introduction .............................................................................................................................. 8
1. The limits of export-led growth ...................................................................................... 9
1.1. From opening-up to export-dependence (1978 to 2008) ................................................ 9
1.2. Domestic imbalances .................................................................................................... 10
1.3. Towards a new growth strategy .................................................................................... 12
1.4. The characteristics of foreign trade .............................................................................. 13
1.5. Who is responsible for the surge of trade surplus? ....................................................... 15
2. China’s export sector facing changes in international demand .................................... 16
2.1. Export-orientation of China’s industry ......................................................................... 17
2.2. Two export-dependent sectors: electronics and textiles ............................................... 18
2.3. Contrasted specialisation profiles: Chinese vs foreign-capital firms ............................ 20
2.4. Export-dependence of coastal provinces ...................................................................... 23
3. China’s rising domestic demand ................................................................................... 24
3.1. The rise of imports for domestic demand (ordinary imports) ....................................... 24
3.2. The structure of imports for domestic use .................................................................... 26
3.3. Foreign-capital firms in the forefront ........................................................................... 27
3.4. The breakthrough of Asian suppliers on China’s domestic market .............................. 28
3.5. Imports versus local production .................................................................................... 31
3.6. Inland provinces: a new frontier for China’s growth? .................................................. 32
4. Conclusion .................................................................................................................... 34
References .............................................................................................................................. 35
Appendices ............................................................................................................................. 38
List of working papers released by CEPII ............................................................................. 47
CEPII, WP No 2011-03 China’s foreign trade in the perspective of a more balanced economic growth
3
CHINA ’S FOREIGN TRADE IN THE PERSPECTIVE OF A MORE BALANCED ECONOMIC GROWTH
NON-TECHNICAL SUMMARY
China’s strong economic growth in the 2000s was associated with an acceleration of its foreign trade and with rising external and domestic imbalances. The global economic crisis which burst at the end of 2008 has revealed the vulnerability of China’s growth model. China’s economy had become too dependent on external markets and has to shift progressively towards a growth model that will be more centred on domestic demand.
The aim of the study is to investigate the possible consequences of such a new phase in China’s development on the future of its economic and trade relations with the rest of the world.
To understand what is at stake, the study analyses the importance of foreign trade and investment for China’s economy at the eve of the recent crisis. We have built a database covering the period from 1997 to 2007, derived from China’s customs statistics, which takes into account the fact that China’s foreign trade encompasses different trade segments (processing and ordinary trade) and various actors (Chinese firms and foreign-capital firms located in China) which have different determinants. These trade data were matched with output data for manufacturing industry, in order to provide an original contribution to the analysis of the dependence of China’s economy on exports, imports and FDI.
First, the paper assesses the reliance of China’s industry on exports, taking into consideration the specific role of foreign companies which use China as an export plate-form. Second, the study turns to China’s imports, focusing on ordinary imports, which reflect domestic demand (while imports for processing are determined by international demand). We analyse the positions of major partners and the role taken by foreign-capital firms in this market.
The paper puts forwards the following conclusions:
- From 1997 to 2007, the dependence of China’s economy on external markets increased significantly, but the trend was reversed in 2008-2009. In 2010, China’s foreign trade rebound, but the export to GDP is not likely to come back in the near future to its pre-crisis level.
- Exports play a crucial part in manufacturing production, especially in two sectors, Electronics and Textiles, and in coastal provinces. Domestic demand can be only a partial substitute to exports in the short run and the reorientation of industry towards the domestic market will take time.

CEPII, WP No 2011-03 China’s foreign trade in the perspective of a more balanced economic growth
4
- Processed exports by foreign-capital firms (FCF) are highly dependent on advanced economy markets. The structure of these exports is representative of Western demand and their switching to dynamic emerging markets is likely to be relatively difficult. Chinese exporting firms are in better position to redirect their exports to emerging economies (or to the domestic market) since they are already oriented towards these markets and sell less sophisticated goods.
- During the past decade, China’s ordinary imports have taken the lead over imports for processing, because of strong domestic demand and lower tariff and non-tariff barriers. Asian countries have made a remarkable breakthrough in China’s ordinary imports. Europe has maintained its relatively strong position, while North-America lost ground. These trends give support to the idea that China is becoming the engine of regional economic growth, which may allow its decoupling from Western markets. This also implies that China’s strong import demand will likely help to reduce China’s overall trade surplus in the future, but not automatically its large bilateral trade surpluses with the US.
Foreign-capital firms (FCF) have become a more and more important channel for China’s imports for domestic use. They accounted for almost half of ordinary manufactured imports in 2007, against one-fourth in 1997. FCF have also an increasing part in China’s industrial production and are responsible for about 25% of manufacturing output for domestic use in 2007 (against about 10% in 1997-1998). China’s policy towards FDI is at least as important as its exchange rate policy to determine foreign partners’ access to its domestic market.
ABSTRACT
The global crisis is forcing China’s economy to become less dependent on foreign markets. Manufacturing industry has to adjust to changes in international demand. Foreign affiliates’ processed exports are vulnerable to the slow-down of Western demand, while Chinese exporting firms are better placed to switch to dynamic emerging markets. China’s ordinary imports have risen fast. Asia has enlarged its share in the domestic market, Europe has kept a strong position while North-America has lost ground. China has become the engine of the regional economic growth. Foreign-capital firms have played an increasing part in China’s imports and industrial production. China’s policy towards FDI is at least as important as its exchange rate policy to determine foreign partners’ access to its domestic market.
JEL Classification: F2; F1; F15; F23; 053 Key Words: China; Growth model; FDI; Ordinary trade; Domestic market.

CEPII, WP No 2011-03 China’s foreign trade in the perspective of a more balanced economic growth
5
LE COMMERCE EXTÉRIEUR DE LA CHINE DANS LA PERSPECTIVE D’UNE CROISSANCE ÉCONOMIQUE PLUS ÉQUILIBRÉE
RÉSUMÉ NON TECHNIQUE
La forte croissance économique de la Chine dans les années 2000 s’est accompagnée de l’accélération de ses échanges extérieurs et de la montée de déséquilibres externes et internes. La crise économique mondiale qui a éclaté fin 2008 a révélé la vulnérabilité de son modèle de croissance, devenu trop dépendant des marchés extérieurs. La Chine doit évoluer progressivement vers un nouveau régime de croissance centré sur la demande intérieure.
Cette étude a pour but d’analyser les conséquences possibles de la nouvelle phase du développement de la Chine sur ses relations économiques et commerciales avec le reste du monde.
Pour comprendre ce qui est en jeu, l’étude évalue la dépendance de l'économie chinoise à l’égard des échanges extérieurs et des investissements étrangers à la veille de la crise récente. Nous avons construit une base de données, à partir des statistiques douanières de la Chine sur la période 1997-2007, qui tient compte de la segmentation du commerce extérieur chinois. Elle distingue les principales composantes des échanges (commerce ordinaire et d’assemblage) et les différents acteurs (entreprises chinoises et entreprises à capital étranger installées en Chine). Les données d’échanges sont raccordées aux données de production industrielle, ce qui permet une analyse originale de la dépendance économique de la Chine à l’égard des exportations, des importations et des investissements directs étrangers.
L’étude évalue d’abord la dépendance de l’industrie chinoise à l’égard des exportations, en prenant en compte le rôle spécifique des sociétés étrangères qui se servent de la Chine comme une plateforme d’'exportation.
Ensuite, l’analyse se concentre sur les importations ordinaires de la Chine, qui reflètent la demande intérieure (alors que les importations pour assemblage sont déterminées par la demande internationale). Nous examinons les positions des différents partenaires et le rôle pris par les entreprises à capitaux étrangers sur ce marché.
L'analyse conduit aux conclusions suivantes.
- De 1997 à 2007, la dépendance de l’économie chinoise à l’égard des marchés extérieurs a considérablement augmenté, mais la tendance s’est inversée en 2008-2009. En 2010, le commerce extérieur chinois a rebondi mais le poids des exportations dans le PIB ne devrait pas retrouver dans les années qui viennent le niveau très élevé qu’il avait atteint avant la crise.
CEPII, WP No 2011-03 China’s foreign trade in the perspective of a more balanced economic growth
6
- Les exportations jouent un rôle crucial dans la production manufacturière chinoise, en particulier dans deux industries, l’Électronique et le Textile, et dans les provinces côtières. À court terme, la demande intérieure ne peut être qu’un substitut partiel aux exportations et la réorientation vers le marché intérieur prendra du temps.
- Les exportations liées aux activités internationales d’assemblage (processing) sont très dépendantes des marchés des économies développées. La structure de ces exportations, menées essentiellement par des entreprises à capital étranger, correspond à la demande occidentale, ce qui risque de rendre difficile leur réorientation vers les marchés émergents. Les entreprises exportatrices chinoises sont mieux placées pour redéployer leurs ventes vers ces marchés (ou vers le marché intérieur) où elles sont déjà plus présentes et vendent des produits moins sophistiqués.
- Depuis dix ans, les importations « ordinaires » de la Chine ont pris le pas sur les importations pour réexportation, en raison de l’abaissement des barrières tarifaires et non tarifaires, et de la forte croissance de la demande intérieure. Les exportateurs asiatiques ont fait une percée remarquable sur le marché intérieur chinois au cours des dix dernières années. L’Europe a maintenu sa forte position alors que l’Amérique du nord a reculé. Ces évolutions confortent l’hypothèse que la Chine devient le moteur de la croissance économique régionale, ce qui rendrait possible son « découplage » des marchés occidentaux. Elles indiquent aussi que la forte demande d’importation de la Chine pourra contribuer à réduire son excédent commercial global sans pour autant réduire son excédent bilatéral sur les États-Unis.
Les entreprises à capitaux étrangers sont un canal de plus en plus important pour les importations à destination du marché intérieur. Elles sont responsables de près de la moitié des importations ordinaires de produits manufacturés en 2007, contre un quart en 1997. Elles ont aussi un rôle croissant dans l’industrie locale et assurent en 2007 environ un quart de la production manufacturière destinée au marché intérieur (contre 10 % en 1997). La politique chinoise à l’égard des investissements directs étrangers est au moins aussi importante que sa politique de change pour déterminer l’accès au marché chinois.
RÉSUMÉ COURT
La crise mondiale force la Chine à évoluer vers une croissance moins dépendante des marchés extérieurs. L’industrie manufacturière chinoise doit s’ajuster aux changements de la demande internationale. Les filiales étrangères menant des opérations d’assemblage sont vulnérables au ralentissement de la demande occidentale, alors que les entreprises chinoises sont mieux placées pour réorienter leurs exportations vers des marchés émergents plus dynamiques. Les importations ordinaires de la Chine sont en hausse rapide. L’Asie a fait une percée sur le marché intérieur, l’Europe a maintenu sa bonne position alors que l’Amérique du nord a reculé. La Chine devient le moteur de la croissance économique régionale. Les entreprises à capitaux étrangers jouent un rôle croissant dans les importations et la production industrielles

CEPII, WP No 2011-03 China’s foreign trade in the perspective of a more balanced economic growth
7
chinoises. La politique chinoise à l’égard des investissements directs étrangers est au moins aussi importante que sa politique de change pour déterminer l’accès au marché chinois.
Classification JEL : F2 ; F1 ; F15 ; F23 ; 053. Mots-clefs : Chine ; modèle de croissance ; IDE ; commerce ordinaire ; marché
intérieur.

CEPII, WP No 2011-03 China’s foreign trade in the perspective of a more balanced economic growth
8
CHINA ’S FOREIGN TRADE IN THE PERSPECTIVE OF A MORE BALANCED ECONOMIC GROWTH
Guillaume Gaulier, Françoise Lemoine & Deniz Ünal*
INTRODUCTION
China’s strong economic growth in the 2000s was associated with an acceleration of its foreign trade. The collapse of international trade in 2008-2009 has revealed the limits of its growth model which had become too dependent on external markets. A more balanced economic development had been advocated for several years (and especially in the 11th Five Year Plan 2006-2010), as the export-led model had engendered domestic tensions, but the external shock has made the shift more pressing. However, there are still diverging views in China on how fast the necessary changes will (or should) materialize.
The global crisis has also enhanced the position of China in the world economy. China which is already leading world economic growth is now expected to lead global demand.
To understand what is at stake, it is important to assess the dependence of China’s economy on foreign trade and direct investment at the eve of the global crisis. Two questions are raised. How the changes in global demand may affect China’s export sector; how China’s strong domestic demand will impinge on its economic and trade relations with the rest of the world.
We have elaborated a database, derived from China’s customs statistics from 1997 to 2007, in order to take into account the segmentation of China’s foreign trade (Appendix A). We distinguish two major trade segments (processing and ordinary trade) and two main categories of actors which have different determinants (Chinese and foreign-capital firms). We have matched the foreign trade data with output data for the manufacturing industry and are thus able to provide an original analysis of the dependence of China’s economy on exports, imports and FDI.
The paper is organized as follows. The first section briefly sketches out how since 1978 China’s economy has evolved from opening-up to export-dependence, and puts forward the arguments in favour of a reappraisal of the development strategy.
The second section examines China’s export sector and highlights the dependence of the various manufacturing sectors and of the different categories of firms on external markets.
* Guillaume Gaulier is economist the Bank of France and associated researcher at the CEPII; Françoise Lemoine and
Deniz Ünal are economists at the CEPII. Corresponding author: [email protected] – tel. 33 1 53 68 55 32 – address: 113, rue de Grenelle, 75007 Paris.
CEPII, WP No 2011-03 China’s foreign trade in the perspective of a more balanced economic growth
9
We analyse the reliance of China’s industry on exports, taking into consideration the specific role of foreign companies which use China as an export plateform and have benefited from the strong demand in advanced economies in the 2000s. The expected changes in world demand, namely a slow growth in advanced economies and the rise of emerging economies [IMF, 2010], will affect differently the various components of China’s exports.
The third section focuses on China’s ordinary imports, which reflect domestic demand, by contrast with imports for processing which are determined by international demand. We analyse the product composition of ordinary imports and the changes in their geographical origin; we put forward the role of foreign-capital firms in these imports as well as in local production for domestic use.
1. THE LIMITS OF EXPORT -LED GROWTH
1.1. From opening-up to export-dependence (1978 to 2008)
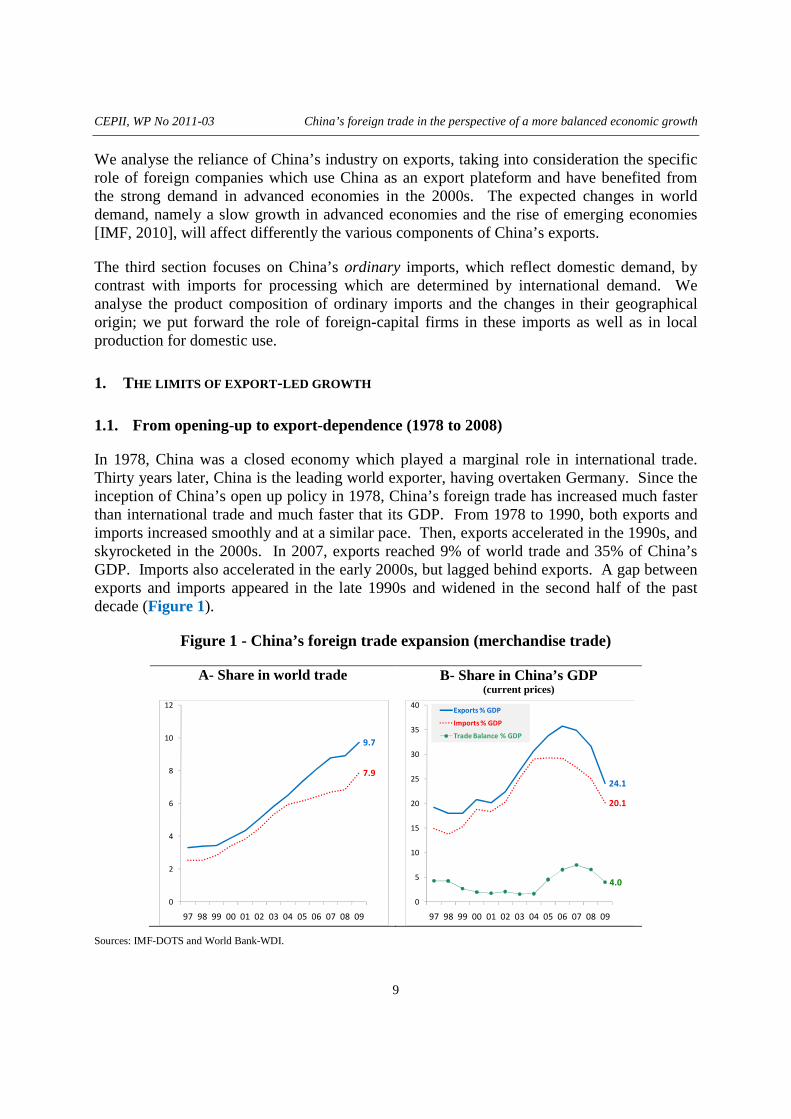
In 1978, China was a closed economy which played a marginal role in international trade. Thirty years later, China is the leading world exporter, having overtaken Germany. Since the inception of China’s open up policy in 1978, China’s foreign trade has increased much faster than international trade and much faster that its GDP. From 1978 to 1990, both exports and imports increased smoothly and at a similar pace. Then, exports accelerated in the 1990s, and skyrocketed in the 2000s. In 2007, exports reached 9% of world trade and 35% of China’s GDP. Imports also accelerated in the early 2000s, but lagged behind exports. A gap between exports and imports appeared in the late 1990s and widened in the second half of the past decade (Figure 1).
Figure 1 - China’s foreign trade expansion (merchandise trade)
A- Share in world trade
B- Share in China’s GDP (current prices)
Sources: IMF-DOTS and World Bank-WDI.
9.7
7.9
0
2
4
6
8
10
12
97 98 99 00 01 02 03 04 05 06 07 08 09
24.1
20.1
4.0
0
5
10
15
20
25
30
35
40
97 98 99 00 01 02 03 04 05 06 07 08 09
Exports % GDP
Imports % GDP
Trade Balance % GDP

CEPII, WP No 2011-03 China’s foreign trade in the perspective of a more balanced economic growth
10
Up to 1996, China’s foreign trade balance fluctuated but surpluses as well as deficits remained moderate. Since then China has recorded a structural surplus which surged to 4% of GDP during the Asian financial crisis in 1997-1998 and then ballooned to approximately 7% of GDP in 2006-2008.
From 2005 to 2007, external demand became a major driver of China’s growth. Net exports contributed to between 2 and 2.5 percentage points of GDP growth, which surged above 10% by year (Figure 2).
Figure 2 – The sources of China’s GDP growth (GDP in constant prices, percentage points)
Sources: China Statistical Yearbook, Table 2-20, 2009 and World Bank [2010].
1.2. Domestic imbalances
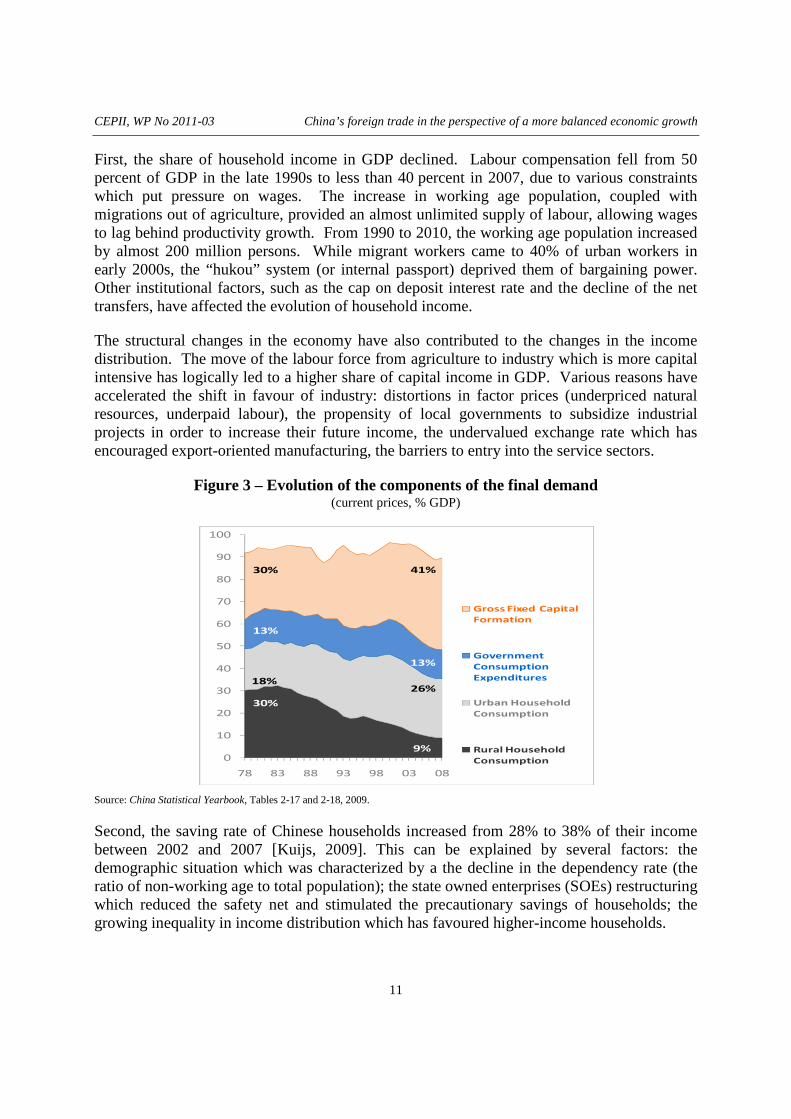
These external imbalances were associated with domestic imbalances. The investment rate rose over to 40% of GDP in 2007-2008. Export-led growth contributed to stimulate investment expenditures [Green, 2008; ADB, 2010]. Private consumption became the weak link of China’s economy, with a share falling from 46% to 35% of GDP between 2000 and 2007 (Figure 3).
Why the household consumption share in GDP has fallen so low is a debated topic [Ma and Yi, 2010; Huang, 2010; Chen and Yao, 2010; Wiemer, 2009; Aziz and Li, 2007]. The arguments can be summarised as follows.
4.45.7 5.5
4.1 4.0 3.5 3.9 4.0 4.5 4.7 4.1 4.6
2.1
1.8 1.9 4.2 4.46.4 5.6
3.9
4.9 4.9
4.1
8.8
1.31.0
0.7
0.6 2.5
2.2 2.3
0.8
-4.3
98 99 00 01 02 03 04 05 06 07 08 09
Net Exports of Goods and Services
Gross Capital Formation
Final Consumption Expenditure
CEPII, WP No 2011-03 China’s foreign trade in the perspective of a more balanced economic growth
11
First, the share of household income in GDP declined. Labour compensation fell from 50 percent of GDP in the late 1990s to less than 40 percent in 2007, due to various constraints which put pressure on wages. The increase in working age population, coupled with migrations out of agriculture, provided an almost unlimited supply of labour, allowing wages to lag behind productivity growth. From 1990 to 2010, the working age population increased by almost 200 million persons. While migrant workers came to 40% of urban workers in early 2000s, the “hukou” system (or internal passport) deprived them of bargaining power. Other institutional factors, such as the cap on deposit interest rate and the decline of the net transfers, have affected the evolution of household income.
The structural changes in the economy have also contributed to the changes in the income distribution. The move of the labour force from agriculture to industry which is more capital intensive has logically led to a higher share of capital income in GDP. Various reasons have accelerated the shift in favour of industry: distortions in factor prices (underpriced natural resources, underpaid labour), the propensity of local governments to subsidize industrial projects in order to increase their future income, the undervalued exchange rate which has encouraged export-oriented manufacturing, the barriers to entry into the service sectors.
Figure 3 – Evolution of the components of the final demand (current prices, % GDP)
Source: China Statistical Yearbook, Tables 2-17 and 2-18, 2009.
Second, the saving rate of Chinese households increased from 28% to 38% of their income between 2002 and 2007 [Kuijs, 2009]. This can be explained by several factors: the demographic situation which was characterized by a the decline in the dependency rate (the ratio of non-working age to total population); the state owned enterprises (SOEs) restructuring which reduced the safety net and stimulated the precautionary savings of households; the growing inequality in income distribution which has favoured higher-income households.
0
10
20
30
40
50
60
70
80
90
100
78 83 88 93 98 03 08
Gross Fixed Capital
Formation
Government
Consumption
Expenditures
Urban Household
Consumption
Rural Household
Consumption
30% 41%
13%
13%
18%26%
30%
9%
CEPII, WP No 2011-03 China’s foreign trade in the perspective of a more balanced economic growth
12
1.3. Towards a new growth strategy
The costs of the current growth model were already underlined in the 11th 5-year plan (2006-2010) and emphasised by Chinese and foreign economists [Yu, 2010; Wing, 2009]. The industry-led growth has been associated with high resource- and energy-intensity, soaring pollution, and can be considered as environmentally unsustainable. Already in 2004, manufacturing of goods for exports accounted for approximately 28% of China’s total energy consumption, and for 34% of its CO2 emissions [IEA, 2007].
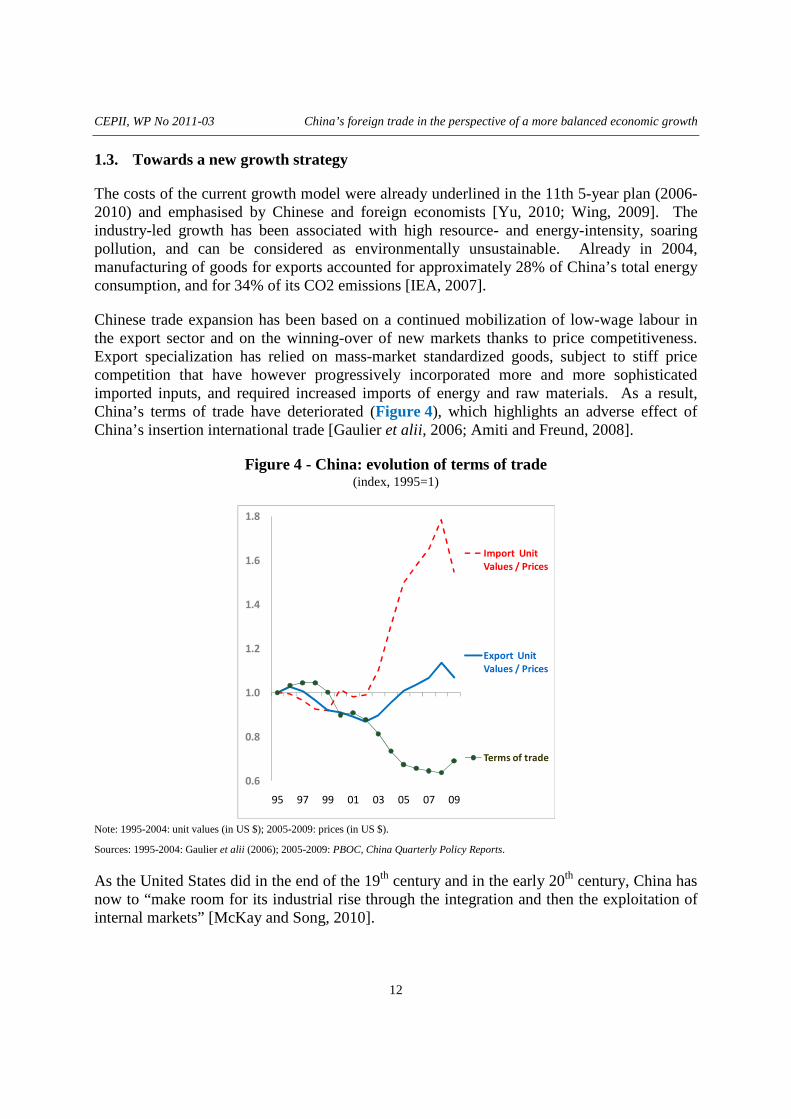
Chinese trade expansion has been based on a continued mobilization of low-wage labour in the export sector and on the winning-over of new markets thanks to price competitiveness. Export specialization has relied on mass-market standardized goods, subject to stiff price competition that have however progressively incorporated more and more sophisticated imported inputs, and required increased imports of energy and raw materials. As a result, China’s terms of trade have deteriorated (Figure 4), which highlights an adverse effect of China’s insertion international trade [Gaulier et alii, 2006; Amiti and Freund, 2008].
Figure 4 - China: evolution of terms of trade (index, 1995=1)
Note: 1995-2004: unit values (in US $); 2005-2009: prices (in US $).
Sources: 1995-2004: Gaulier et alii (2006); 2005-2009: PBOC, China Quarterly Policy Reports.
As the United States did in the end of the 19th century and in the early 20th century, China has now to “make room for its industrial rise through the integration and then the exploitation of internal markets” [McKay and Song, 2010].
0.6
0.8
1.0
1.2
1.4
1.6
1.8
95 97 99 01 03 05 07 09
Import Unit
Values / Prices
Export Unit
Values / Prices
Terms of trade

CEPII, WP No 2011-03 China’s foreign trade in the perspective of a more balanced economic growth
13
Demographics is expected to help rebalancing the economy. Starting from 2010, the number of the working age population will stagnate, and the young-age brackets will diminish. According to most Chinese economists, the situation of the labour market is reaching the point where the supply of labour is no longer “unlimited”. Between 2010 and 2035, the working age population will decrease by 71 millions. As the surplus of unskilled labour is exhausted the pattern of income is expected to change in favour of wages [Cai, 2010; Du and Pan, 2009]. In 2010, industries had already to adjust to higher wages: minimum wage levels were raised by 20% on average and the income of migrant workers were up by 11% [PBOC, 2010].
Urbanization (the urban population is expected to rise from 45% of total population in 2005 to 60% in 2020) should lead to an improvement in the level of income of the population, as far as the new comers will be granted the social benefits enjoyed by the urban citizens. The extension of the social security net is thus an important condition for a new growth strategy. The government is currently implementing redistribution policies and carrying out programs to expand social expenditure (health, education) which should help reduce precautionary savings and boost consumption.
The development of the domestic market would also mean the spatial integration of China’s economy and the catching-up of inland regions which account for 65% of China’s population and only 45% of GDP in 2009.
However, the shift to a new growth model can only be gradual. It will entail a redistribution of resources within China, between regions, sectors, firms, social groups. It can be argued that, given China’s level of development, there is still room for a strong and competitive manufacturing sector. China’s income per capita in 2010 (about 6000 dollars in PPP constant 2005 international dollars) is well below that of Japan in 1980 (17600). The change in the labour market will raise the wage level significantly only in the long run. All the more that there are diverging views among Chinese economists concerning the situation of the labor market and as Yang [2010] argues that the “Lewisian turning point has not yet arrived” and there is still plenty of surplus labour in agriculture.
1.4. The characteristics of foreign trade
China has become very deeply integrated into the world economy through foreign trade and FDI.
As has been amply evidenced in literature, China’s foreign trade sector is highly segmented [Ma and Assche, 2010; Upward et alii, 2010; Amiti and Freund, 2009; Yao and Liu, 2007; Lemoine and Ünal-Kesenci, 2004]. Foreign trade encompasses several segments which have different determinants and are handled by different types of firms.
China’s foreign trade is carried out within two distinct customs regimes: processing trade and ordinary trade. Processing trade corresponds to the duty-free imports of goods to be

CEPII, WP No 2011-03 China’s foreign trade in the perspective of a more balanced economic growth
14
assembled or transformed for re-export and the related exports. This trade reflects the integration of China’s manufacturing industry into international supply chains. Processing exports have a large import content and depend on international demand. Up to the end of the 1990s, processing trade was the leading segment and it still represented 51% of China’s exports and 39% of its imports in 2007. This trade is likely to slowdown in parallel to western demand.
Ordinary trade reflects the evolution of domestic supply and demand. It encompasses exports mainly based on local inputs and imports aimed at domestic use (firms and consumers). In 2007, Ordinary trade represented 44% of China’s exports and 45% of its imports. Strong economic growth in China has increased the relative importance of ordinary imports (40% of which are primary products) since 2000 and this trend is expected to continue in the future.
Besides processing and ordinary trade, “other customs regimes” encompass various types of transactions which constitute a marginal share of exports (5% in 2007) but a substantial share of imports (17% in 2007), which are linked mainly to warehousing and entrepot trade, and to the import of equipment for processing activity and by FCFs (foreign capital firms).
The other great divide in China’s foreign trade sector pertains to the nature of firms involved. Chinese and foreign-capital firms constitute two different categories of actors, the former handling most of ordinary trade (two-thirds in 2007), the latter dominating processing trade (at 85%). Chinese firms include state-owned firms (SOEs) and private firms,
1 but it is not
possible to know whether the observed rise of private firms in China’s foreign trade between 1997 and 2007 reflects the entry of new firms or only legal changes i.e. the privatization process and the foreign trade liberalization which has allowed any firm to undertake foreign trade activities.
Firms with foreign capital encompass joint-ventures (JV, with at least 25% of foreign capital) and fully-foreign firms (FFF, with 100% foreign capital).
2 The latter have taken a more and
more important part in recent years. Indeed, since China entered WTO, limits to foreign ownership have been removed in most sectors
3 and foreign partners have clearly showed their
preference for wholly-foreign firms, which are easier to manage and better fit to protect their technology or other specific advantages. Moreover, as foreign investors have become more familiar with the Chinese market, a local partnership has become less necessary. Many JV have been transformed into FFF.
At this turning point of China’s development strategy, it is worth stressing the role of FCFs. During the past thirty years, China encouraged inward FDI and this policy has met with
1 The “Chinese firms” group includes also collective and other firms. 2 A significant part of FDI flowing to China corresponds to capital flows originating from China and transiting through Hongkong (round tripping). Some FCF are thus in fact Chinese firms in disguise. However, as the relative importance of FDI coming from Hongkong declined overtime, it can be assumed that so did round tripping. 3 There are still exceptions. The most important ones concern the car industry and telecommunication services, where the foreign participation in capital is limited to 49%.

CEPII, WP No 2011-03 China’s foreign trade in the perspective of a more balanced economic growth
15
outstanding successes. Large investment inflows have contributed to the present pattern of China’s economy, characterised by a strong industrial sector, the leading role of coastal areas and the importance of foreign-capital firms in production and exports.
1.5. Who is responsible for the surge of trade surplus?
Disentangling the different components of China’s trade makes it possible to shed light into the sources of its trade surplus, which increased from US$ 32bn to US$ 262bn, between 2004 and 2007: was it mainly due to the demand in western economies which boosted the import of Chinese goods or to the expansion of excess capacities in China which boosted its exports [Anderson 2009; Goldstein and Lardy, 2009]? The analysis shows that, in an accounting sense, both foreign demand and domestic conditions came into play (Figure 5).
Figure 5 - Evolution of China’s trade balance by types of firms and trade regimes 1997-2007 (billion USD)
A. Trade balance by types of firms (all trade regimes)
B. Major surpluses & deficits by types of firms & trade regimes
Source: China’s Customs Statistics, authors’ calculations.
On the one hand, processing trade reflects the activity of foreign firms which use China as an export platform to serve the consumers’ demand in the West. From 2004 to 2007, processing trade surplus jumped from US$83bn to US$211bn, an increase (US$128bn) accounting for almost half the surge in the total trade surplus. Fully-foreign firms (FFF) were responsible of the bulk of it. The ballooning of processed exports seems mainly due to new firms entering the export markets thanks to low entry costs in processing trade (Upward et alii, 2010). They have developed globalized production sites, weakly integrated into the domestic economy, but
-50
-30
-10
10
30
50
70
90
110
130
150
97 99 01 03 05 07
Private
Fully Foreign
JVs
Other Chinese
SOEs -70
-20
30
80
130
97 99 01 03 05 07
Fully Foreign-
Processing
Private- Ordinary
JVs- Processing
JVs- Equipment for
FCF
SOEs- Ordinary
Fully
Foreign- Equipment
for FCF
CEPII, WP No 2011-03 China’s foreign trade in the perspective of a more balanced economic growth
16
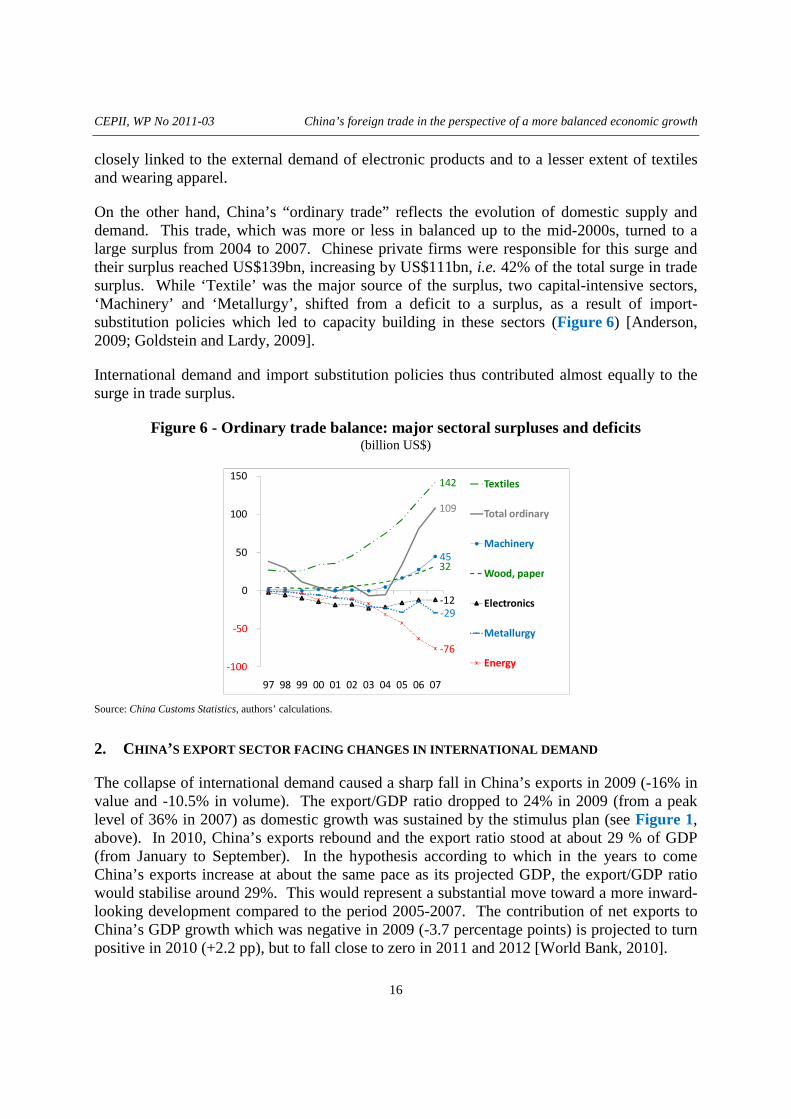
closely linked to the external demand of electronic products and to a lesser extent of textiles and wearing apparel.
On the other hand, China’s “ordinary trade” reflects the evolution of domestic supply and demand. This trade, which was more or less in balanced up to the mid-2000s, turned to a large surplus from 2004 to 2007. Chinese private firms were responsible for this surge and their surplus reached US$139bn, increasing by US$111bn, i.e. 42% of the total surge in trade surplus. While ‘Textile’ was the major source of the surplus, two capital-intensive sectors, ‘Machinery’ and ‘Metallurgy’, shifted from a deficit to a surplus, as a result of import-substitution policies which led to capacity building in these sectors (Figure 6) [Anderson, 2009; Goldstein and Lardy, 2009].
International demand and import substitution policies thus contributed almost equally to the surge in trade surplus.
Figure 6 - Ordinary trade balance: major sectoral surpluses and deficits (billion US$)
Source: China Customs Statistics, authors’ calculations.
2. CHINA ’S EXPORT SECTOR FACING CHANGES IN INTERNATIONAL DEMAND
The collapse of international demand caused a sharp fall in China’s exports in 2009 (-16% in value and -10.5% in volume). The export/GDP ratio dropped to 24% in 2009 (from a peak level of 36% in 2007) as domestic growth was sustained by the stimulus plan (see Figure 1, above). In 2010, China’s exports rebound and the export ratio stood at about 29 % of GDP (from January to September). In the hypothesis according to which in the years to come China’s exports increase at about the same pace as its projected GDP, the export/GDP ratio would stabilise around 29%. This would represent a substantial move toward a more inward-looking development compared to the period 2005-2007. The contribution of net exports to China’s GDP growth which was negative in 2009 (-3.7 percentage points) is projected to turn positive in 2010 (+2.2 pp), but to fall close to zero in 2011 and 2012 [World Bank, 2010].
142
109
45 32
-12
-29
-76
-100
-50
0
50
100
150
97 98 99 00 01 02 03 04 05 06 07
Textiles
Total ordinary
Machinery
Wood, paper
Electronics
Metallurgy
Energy
CEPII, WP No 2011-03 China’s foreign trade in the perspective of a more balanced economic growth
17
China’s share in world exports continued to increase in 2009 (from 8.9% in 2008 to 9.6%) and in 2010 (reaching 10.4% in the first three quarters). In a scenario where China’s economy is to grow at about 8-9% a year while its export/GDP ratio remains stable, and world exports increase at about 7% a year [IMF, 2010], China’s share in world markets would continue to increase in the coming years.
To understand what is at stake for China’s economy, this section examines the importance of exports for China’s industry in the pre-crisis period. Which industries are the most dependent on exports? How can the different categories of exporting firms adapt to the new international context?
2.1. Export-orientation of China’s industry
Measuring the export dependence of China’s economy is not straightforward. The share of exports in GDP has increased rapidly and is large by international standards (36% of GDP in 2007). But this ratio is generally considered as misleading since China exports manufactured goods which have a large import content due to the importance of assembly and processing activities [OECD, 2010]. The recent literature has given evidence that China’s exports have an exceptionally high import content. For instance, using the method applied to the case of OECD countries, Dean et alii [2007] estimate the local content of China’s exports at about 65%, that is much lower than the corresponding figure (79%) for OECD countries [Hummels et alii, 2001]. Taking into account the prevailing importance of processing trade in China’s exports, Koopman and Wang [2008] calculate that the average local content of China’s exports was approximately 50% in 2006, the ratio being as low as 35% in processed exports of industrial goods. Another study based on firm-level data [Upward et alii, 2010] calculated that the local content of exports declined from 32% to 29% between 2003 and 2006.
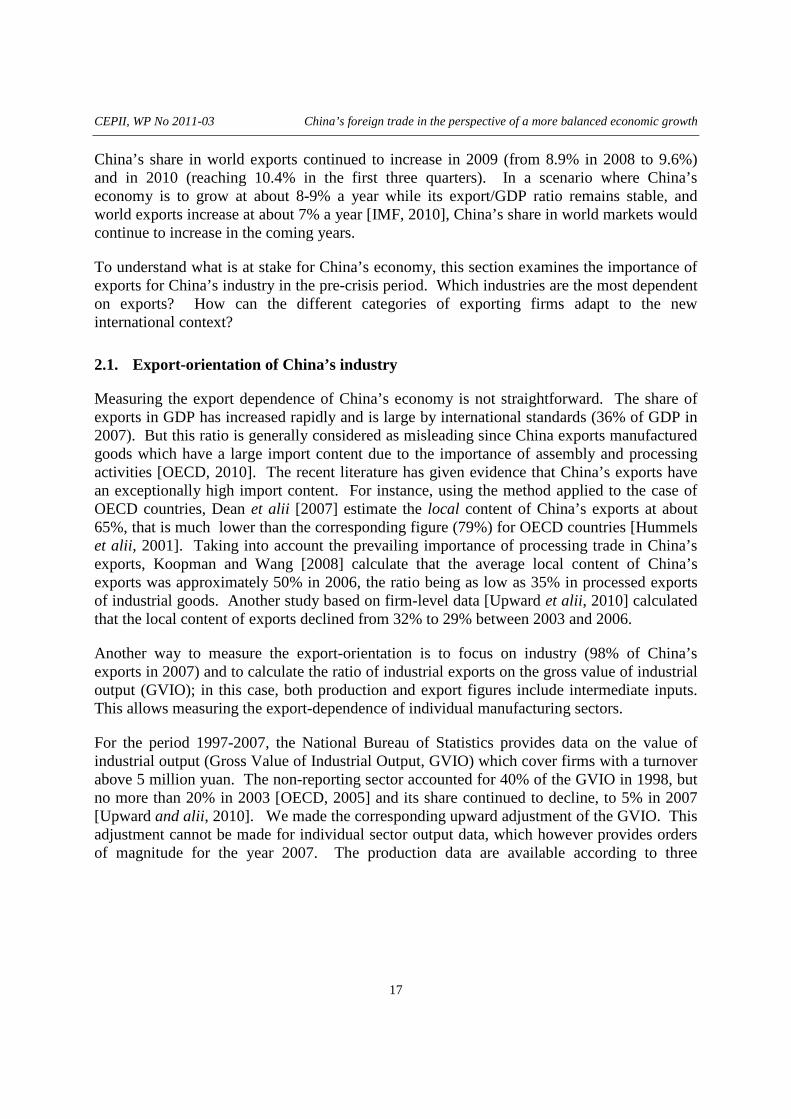
Another way to measure the export-orientation is to focus on industry (98% of China’s exports in 2007) and to calculate the ratio of industrial exports on the gross value of industrial output (GVIO); in this case, both production and export figures include intermediate inputs. This allows measuring the export-dependence of individual manufacturing sectors.
For the period 1997-2007, the National Bureau of Statistics provides data on the value of industrial output (Gross Value of Industrial Output, GVIO) which cover firms with a turnover above 5 million yuan. The non-reporting sector accounted for 40% of the GVIO in 1998, but no more than 20% in 2003 [OECD, 2005] and its share continued to decline, to 5% in 2007 [Upward and alii, 2010]. We made the corresponding upward adjustment of the GVIO. This adjustment cannot be made for individual sector output data, which however provides orders of magnitude for the year 2007. The production data are available according to three
CEPII, WP No 2011-03 China’s foreign trade in the perspective of a more balanced economic growth
18
categories of firms (Chinese state-owned and private firms as well as FCFs) and were matched with the export and import statistics.
4
Exports represented about 23% of China’s industrial output in 2007 (up from about 13% in 1997). Processed exports by FCFs accounted for 10% of the GVIO, and ordinary exports by Chinese firms for 8% (Figure 7). FCFs are much more dependent on exports than Chinese firms (they export respectively 41% and 14% of their output).
Figure 7 - China: breakdown of total industrial output by destination of sales and type of firms
(2007, in % of total industrial output)
Sources: China’s Customs Statistics and Statistical Yearbook, authors’ calculations.
2.2. Two export-dependent sectors: electronics and textiles
Figure 8 shows that there are two export-dependent industries, ‘Electronics’ and ‘Textiles’, which however display quite contrasted profiles.
China’s ‘Electronics’ industry is a globalized sector: exports represent two-thirds of output and FCFs dominate production (four-fifth) as well exports (90%). They are mainly involved in processing operations, with a large import content [Koopman and Wang, 2008; Linden et alii, 2007].
5 This industry is thus highly vulnerable to a slowdown in international demand,
4 The ratios of imports and exports to output are calculated in value data. If calculated in volume (quantity), the ratio would have presumably been lower as the prices of internationally traded goods are likely to be higher than domestic prices. 5 The case of mobile phone production is representative of the electronic industry. In 2007, China produced more than 650 million units of mobile phones, half of the world total output. Approximately 70% were exported. Five foreign companies (Nokia, Samsung, Motorola, LG and Samsung-Ericson) had a total share of 78% in the total production, of 70% in exports and took a domestic market share of more than two-thirds (see for instance http://www.prlog.org/10136853-brief-report-on-chinas-cell-phone-industry-2008.html).
77
59
19
11
8
3
12
2
10
0
10
20
30
40
50
60
70
80
90
100
All firms Chinese firms Foreign
capital firms
Processing
exports
Other exports
Domestic
market

CEPII, WP No 2011-03 China’s foreign trade in the perspective of a more balanced economic growth
19
but less exposed to the effects of exchange rate fluctuations of the yuan, as the local value-added is small.
The textile industry exports half its output, mainly as ordinary exports; Chinese firms dominate production and exports. This industry has kept the basic characteristics of a traditionally export-oriented industry, with most of the production chain located in China. According to Koopman and Wang [2008], the local value-added in textiles exports was large (approximately 70% in 2006). With most of the production chain located inside the country, Chinese exporting firms are vulnerable to an appreciation of the yuan, which explain why the Chinese authorities carry on a cautious exchange rate policy.
Figure 8 - China: breakdown of industrial output by type of firms, industry group and destination of sales
(2007, in % of total industrial output)
A. ALL FIRMS B. CHINESE FIRMS C. FOREIGN CAPITAL FI RMS
Note: see Appendices C and D for the sectoral classification.
Source: China’s Customs Statistics and Statistical Yearbook, authors’ calculations.
The other industries sell the major share of their production on the domestic market. However, with the exception of ‘Food’ and ‘Energy’ which are overwhelmingly domestic-oriented, the other sectors still exported a significant share of their output in 2007. ‘Machinery’ and ‘Electrical machinery’ exported respectively 27% and 23% of their output. ‘Transport equipment’, ‘Chemicals’ and ‘Metallurgy’ are less dependent on external markets, with exports accounting for respectively 16%, 14% and 10% of their output in 2009.
For most China’s industrial manufacturing sectors, exports represent a substantial part of output and domestic market can only be a partial substitute to external markets. The lack of comprehensive data on employment in industry does not allow into measure the actual
15
8
4 3
14 12
7
5 3
6
3
1
1
1
2
1
1
1
1
1
1
1
1
6
1
0
2
4
6
8
10
12
14
16
En
erg
y
Fo
od
Texti
les
Wo
od
-Pa
pe
r
Ch
em
ica
ls
Me
tallu
rgy
Ma
ch
ine
ry
Ele
ctr
ica
l ma
c.
Ele
ctr
on
ics
Tra
nsp
ort
Eq
.
14
6
3 2
11 11
6
3
1
3
2
1
1 1
1
En
erg
y
Fo
od
Texti
les
Wo
od
-Pa
pe
r
Ch
em
ica
ls
Me
tallu
rgy
Ma
ch
ine
ry
Ele
ctr
ica
l ma
c.
Ele
ctr
on
ics
Tra
nsp
ort
Eq
.
1 2 1 1
3
2 2 1 2 3
1 1 1
1
1
1 1
6
En
erg
y
Fo
od
Texti
les
Wo
od
-Pa
pe
r
Ch
em
ica
ls
Me
tallu
rgy
Ma
ch
ine
ry
Ele
ctr
ica
l ma
c.
Ele
ctr
on
ics
Tra
nsp
ort
Eq
.
Processing exports
Ordinary & other exports
Domestic market

CEPII, WP No 2011-03 China’s foreign trade in the perspective of a more balanced economic growth
20
importance of the labour force employed in exporting sectors, but as exports collapsed at the end of 2008, 20 millions of migrant workers were laid off.
2.3. Contrasted specialisation profiles: Chinese vs foreign-capital firms
In 2009, the exports to GDP ratio fell back to its 2002 level. Both ordinary and processed exports were affected (Figure 9). Only in July 2010 did China’s exports recover their record level of July 2008.
All categories of exporting firms were hit by the collapse of international demand. Chinese firms’ as well as FCF exports dropped by about 15% in 2009. However, they display highly contrasted export specialisation patterns, which may influence their capacity to adapt to the changing landscape of global economic growth.
Figure 9 – China: ratio of exports to GDP (%)
Sources: China’s Customs Statistics & CEPII CHELEM-GDP database, authors’ calculations.
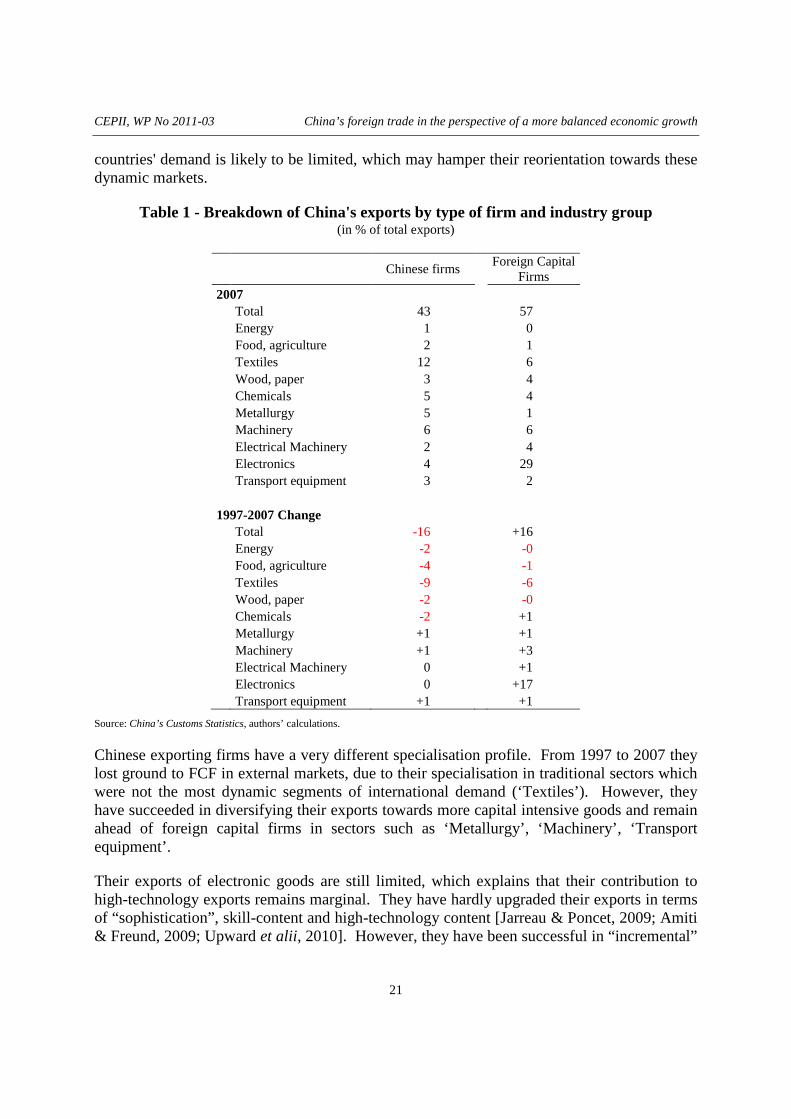
FCFs are highly and increasingly specialised in ‘Electronics’ (60% of their exports, 90% of China’s exports in this sector in 2007) which explains their dominant share in China’s high technology exports (Table 1). In ‘Textiles’, ‘Machinery’, ‘Electrical machinery’, ‘Wood and paper’, they direct about half their output to external markets. In capital-intensive sectors such as ‘Chemicals’, ‘Transport equipment’, they are more oriented towards the domestic demand and less vulnerable to a downturn of international demand (Figure 8). FCF exports are concentrated on advanced economies (90% of their exports) and they account for two-thirds of total Chinese exports to these areas (Table 2). They are thus most concerned by the uncertainty surrounding the demand recovery in these markets. Referring to Linder’s concept of “representative demand” [1961], the structure of FCF exports (in terms of quality, technological standards) is representative of Western demand which is very different from that of developing countries demand. The overlap between the FCF exports and emerging
19
26
10 12
8
11
1 20
5
10
15
20
25
30
35
97 98 99 00 01 02 03 04 05 06 07 08 09
Total
Processing
Ordinary
Other
CEPII, WP No 2011-03 China’s foreign trade in the perspective of a more balanced economic growth
21
countries' demand is likely to be limited, which may hamper their reorientation towards these dynamic markets.
Table 1 - Breakdown of China's exports by type of firm and industry group (in % of total exports)
Chinese firms
Foreign Capital
Firms 2007 Total 43 57 Energy 1 0 Food, agriculture 2 1 Textiles 12 6 Wood, paper 3 4 Chemicals 5 4 Metallurgy 5 1 Machinery 6 6 Electrical Machinery 2 4 Electronics 4 29 Transport equipment 3 2 1997-2007 Change Total -16 +16 Energy -2 -0 Food, agriculture -4 -1 Textiles -9 -6 Wood, paper -2 -0 Chemicals -2 +1 Metallurgy +1 +1 Machinery +1 +3 Electrical Machinery 0 +1 Electronics 0 +17 Transport equipment +1 +1
Source: China’s Customs Statistics, authors’ calculations.
Chinese exporting firms have a very different specialisation profile. From 1997 to 2007 they lost ground to FCF in external markets, due to their specialisation in traditional sectors which were not the most dynamic segments of international demand (‘Textiles’). However, they have succeeded in diversifying their exports towards more capital intensive goods and remain ahead of foreign capital firms in sectors such as ‘Metallurgy’, ‘Machinery’, ‘Transport equipment’.
Their exports of electronic goods are still limited, which explains that their contribution to high-technology exports remains marginal. They have hardly upgraded their exports in terms of “sophistication”, skill-content and high-technology content [Jarreau & Poncet, 2009; Amiti & Freund, 2009; Upward et alii, 2010]. However, they have been successful in “incremental”
CEPII, WP No 2011-03 China’s foreign trade in the perspective of a more balanced economic growth
22
innovation, i.e. in adapting existing technology to emerging economies demand [The Economist, 2010; Brandt and Thun, 2010].
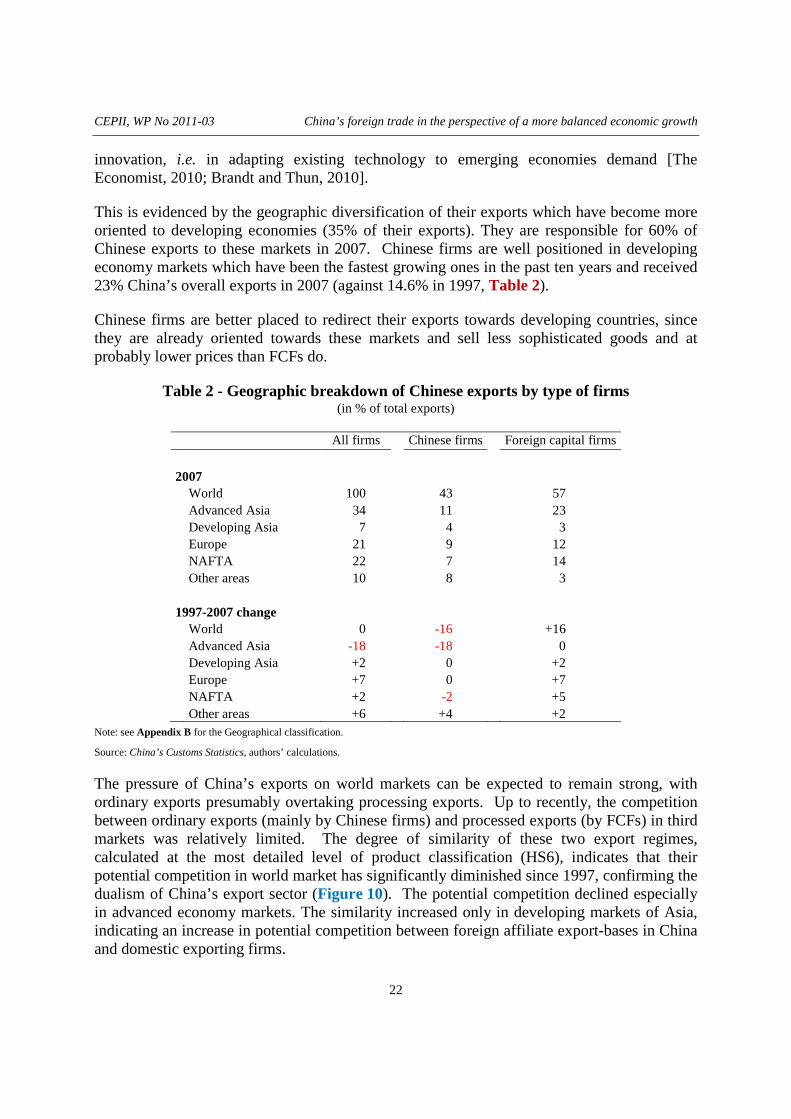
This is evidenced by the geographic diversification of their exports which have become more oriented to developing economies (35% of their exports). They are responsible for 60% of Chinese exports to these markets in 2007. Chinese firms are well positioned in developing economy markets which have been the fastest growing ones in the past ten years and received 23% China’s overall exports in 2007 (against 14.6% in 1997, Table 2).
Chinese firms are better placed to redirect their exports towards developing countries, since they are already oriented towards these markets and sell less sophisticated goods and at probably lower prices than FCFs do.
Table 2 - Geographic breakdown of Chinese exports by type of firms (in % of total exports)
All firms Chinese firms Foreign capital firms
2007 World 100 43 57 Advanced Asia 34 11 23 Developing Asia 7 4 3 Europe 21 9 12 NAFTA 22 7 14 Other areas 10 8 3 1997-2007 change World 0 -16 +16 Advanced Asia -18 -18 0 Developing Asia +2 0 +2 Europe +7 0 +7 NAFTA +2 -2 +5 Other areas +6 +4 +2
Note: see Appendix B for the Geographical classification.
Source: China’s Customs Statistics, authors’ calculations.
The pressure of China’s exports on world markets can be expected to remain strong, with ordinary exports presumably overtaking processing exports. Up to recently, the competition between ordinary exports (mainly by Chinese firms) and processed exports (by FCFs) in third markets was relatively limited. The degree of similarity of these two export regimes, calculated at the most detailed level of product classification (HS6), indicates that their potential competition in world market has significantly diminished since 1997, confirming the dualism of China’s export sector (Figure 10). The potential competition declined especially in advanced economy markets. The similarity increased only in developing markets of Asia, indicating an increase in potential competition between foreign affiliate export-bases in China and domestic exporting firms.

CEPII, WP No 2011-03 China’s foreign trade in the perspective of a more balanced economic growth
23
Figure 10 - Similarity of China’s processed and ordinary exports by destination
Note: The similarity is here calculated by FK Index at the HS6 level (Appendix H). See Appendix B for the Geographical classification.
Source: China’s Customs Statistics, authors’ calculations.
2.4. Export-dependence of coastal provinces
Foreign trade and investment are heavily concentrated in the coastal provinces which produced 80% of ordinary and 96% of processing exports, while only 59% of GDP in 2007. The coastal area shows a high dependence on exports while the inland area economy is more closed (Table 3). In fact four top exporting provinces (Shanghai, Jiangsu, Zhejiang, Guangdong) concentrate almost 70% of total exports, with extremely high export ratios (40% of GVIO, on average).
Table 3 - Openness: contrast between coastal and inland provinces
In % of industrial output (GVIO ) Total Exports Ordinary exports Processing exports
2007 National Coastal provinces 30 12 16 Inland provinces 7 5 1
1997 National Coastal provinces 18 7 11 Inland provinces 4 3 1
Source: China’s Customs Statistics, authors’ calculations.
10
15
20
25
30
35
40
45
97 98 99 00 01 02 03 04 05 06 07
Advanced Asia
Developing Asia Europe NAFTA Other Top Partners
Rest of the World
World
CEPII, WP No 2011-03 China’s foreign trade in the perspective of a more balanced economic growth
24
The collapse of external demand at the end of 2008 was thus an asymmetric shock, hurting the provinces which had been the spearhead of China’s growth for two decades. The fall in the value of exports in 2009 represented 3.1% of GVIO at national level, but more in the coastal economy GDP (3.7%) and especially in the top provincial exporters (4.6%).
At provincial level, there is a negative correlation between the export-orientation of industry and the growth of industrial output (see figures in Appendix I).
Exporting industries of coastal provinces will have to adapt to a new context in the coming decade. In the medium-run, domestic demand can only represent a partial substitute to exports, but the need to develop domestic sales will accelerate the progressive transfer of industrial capacities to inland areas (the share of inland provinces in GVIO already increased from 29% to 34% from 2000 to 2009). Economic growth in the central provinces is now slowing the supply of labour in the coastal provinces which face higher wages and will have to restructure their production towards high value-added industries and services.
China’s domestic demand is both a crucial alternative to exports for local producers and a coveted market for foreign suppliers.
3. CHINA ’S RISING DOMESTIC DEMAND
Even though China’s exports are to increase slower than in the past decade, their pressure on international markets is expected to remain strong and is likely to trigger international trade tensions. These would be alleviated if the rise of China’s imports were large enough to reduce its trade surplus.
Processing trade generates a structural surplus which cannot be expected to shrink as the local content of exported goods has been increasing regularly. A substantial reduction of China’s trade surplus can only come from ordinary trade, and this is what has happened since the last quarter of 2009. Ordinary trade has recorded a deficit as corresponding imports have accelerated.
It is thus interesting first to identify the structural trends in ordinary imports (1997-2007). What were the most dynamic sectors, the partners in best position to take advantage of this import demand, and the categories of firms the most involved in channelling imported goods into China’s market?
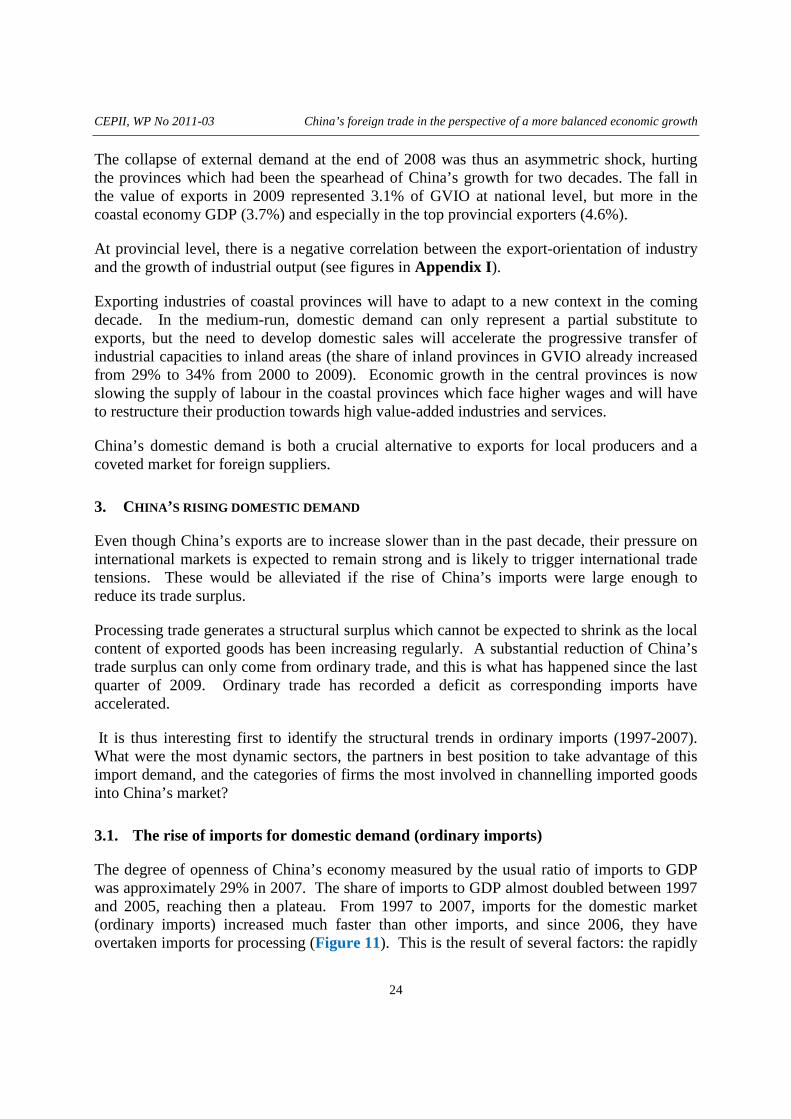
3.1. The rise of imports for domestic demand (ordinary imports)
The degree of openness of China’s economy measured by the usual ratio of imports to GDP was approximately 29% in 2007. The share of imports to GDP almost doubled between 1997 and 2005, reaching then a plateau. From 1997 to 2007, imports for the domestic market (ordinary imports) increased much faster than other imports, and since 2006, they have overtaken imports for processing (Figure 11). This is the result of several factors: the rapidly
CEPII, WP No 2011-03 China’s foreign trade in the perspective of a more balanced economic growth
25
expanding domestic demand, the reduction in tariff and non-tariff barriers after China entered the WTO in 2001, and the yuan appreciation between 2005 and 2008.
The global economic crisis has reduced the share of overall imports in GDP in 2009 to its 2002 level. All types of imports were affected but ordinary imports declined less than average. China’s demand resisted better to the crisis than international demand. In the first half of 2010, ordinary imports rebound to 14% of GDP, above their pre-crisis level, a degree of openness comparable to that of the US or Japan.
Figure 11 - China: ratio of imports to GDP (%)
Sources: China’s Statistical Yearbook and Customs Statistics, authors’ calculations.
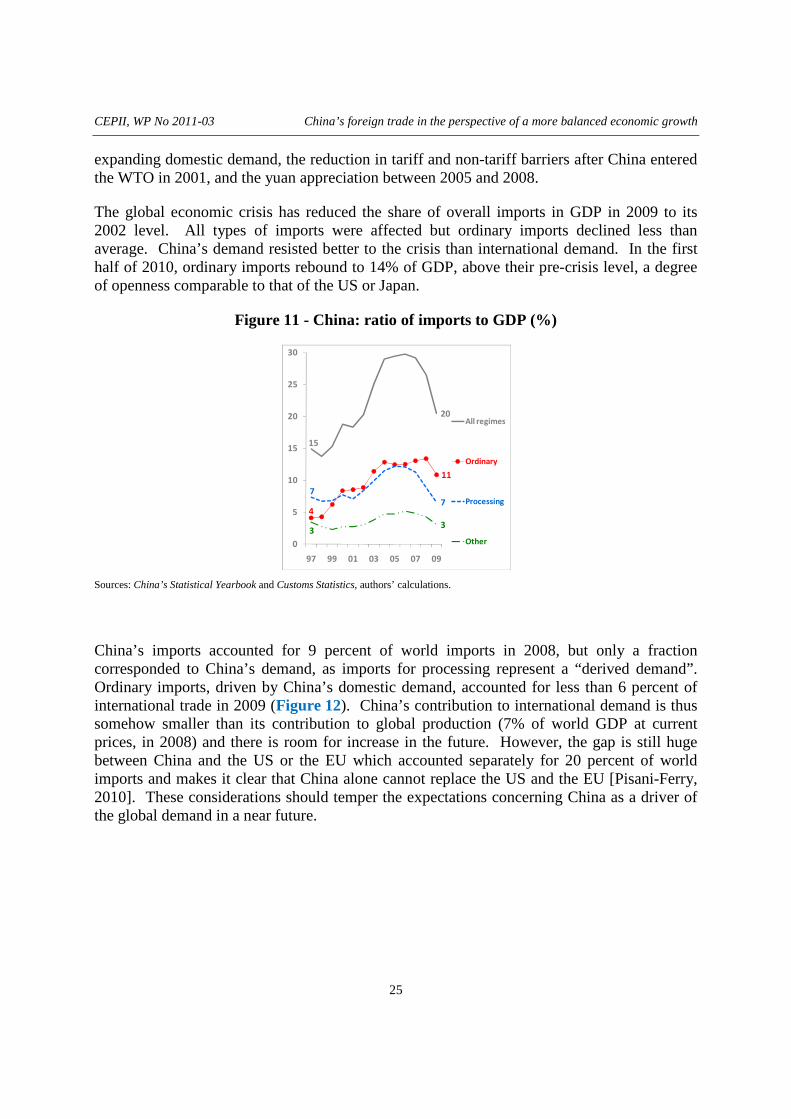
China’s imports accounted for 9 percent of world imports in 2008, but only a fraction corresponded to China’s demand, as imports for processing represent a “derived demand”. Ordinary imports, driven by China’s domestic demand, accounted for less than 6 percent of international trade in 2009 (Figure 12). China’s contribution to international demand is thus somehow smaller than its contribution to global production (7% of world GDP at current prices, in 2008) and there is room for increase in the future. However, the gap is still huge between China and the US or the EU which accounted separately for 20 percent of world imports and makes it clear that China alone cannot replace the US and the EU [Pisani-Ferry, 2010]. These considerations should temper the expectations concerning China as a driver of the global demand in a near future.
15
20
4
11
7
7
33
0
5
10
15
20
25
30
97 99 01 03 05 07 09
All regimes
Ordinary
Processing
Other
CEPII, WP No 2011-03 China’s foreign trade in the perspective of a more balanced economic growth
26
Figure 12 – Major trade powers: share in world imports (%)
Sources: CEPII, CHELEM-CIN database and China Customs Statistics, authors’ calculations.
3.2. The structure of imports for domestic use
The composition of ordinary imports by end-use (stage of production) has been relatively stable during the past decade (Table 4): semi-finished goods represent the largest although diminishing product category (43% of manufactured imports in 2007 against 53% in 1997); Parts & Components are the second largest and very dynamic category (rising from 20% to 26%). Capital goods imports are relatively stable (22%) while Consumption good imports have increased the fastest, from a low level (from 4% to 9%). This latter trend (driven by car imports) reflects the rising purchasing power of the most affluent Chinese households.
The composition by industry group shows that chemical products constitute the most important imports (25% in 2007), accounting for the bulk of intermediate goods imports; electronic goods are the second most important category with a rising share (20% in 2007); ‘Machinery’ and ‘Electrical Machinery’ account for stable shares (respectively around 16% and 6%). Imports of ‘Transport equipment’ are on the rise.
A remarkable trend is the relative decline of high-technology goods, from 12 to 10% in ordinary imports. The trend, which is observed in all production stages, can be explained by an import substitution policy and the improvement of the technological level of domestic production. But it may also put at risk the technological catch up of domestic-based production. In China’s total imports of high-technology goods, the share going to domestic needs (ordinary imports) fell from more than 30% in the early 2000s to 18% in 2007.
All in all, this analysis reveals that during the past decade of rapid economic growth and extraordinary trade expansion, the demand for imported goods generated by China’s domestic needs developed quite steadily. It is still dominated by intermediate goods, although final goods are the most dynamic. These trends will probably hold on in the future.
0
5
10
15
20
25
92 93 94 00 01 02 03 04 05 06 07 08 09
EU27 (without
intrazone)US
China total
Japan
China ordinary

CEPII, WP No 2011-03 China’s foreign trade in the perspective of a more balanced economic growth
27
Table 4 - Ordinary manufacturing imports by stages of production and industry groups 1997-2007 (in %)
1997 2007
Stages of production Semi-Finished products 53 43 Parts & Components 20 26 Consumption goods 4 9 Capital goods 22 22 Total 100 100
Industry groups Energy processed 9 2 Food 10 5 Textiles 0 1 Wood, paper 6 3 Chemicals 21 25 Metallurgy 8 10 Machinery 17 16 Electrical Machinery 5 6 Electronics 15 20 Transport equipment 9 11 Total 100 100
Note: see Appendices C and E for the sectoral classification.
Source: China Customs Statistics, authors’ calculations.
3.3. Foreign-capital firms in the forefront
Foreign-capital firms have played an increasing part in China’s ordinary imports from all areas: on average their share rose from 22% to 34%. They are an especially important channel for China’s ordinary imports from advanced economies, accounting in 2007 for respectively 47%, 43% and 38% of imports from Rich Asia, Europe and NAFTA. Their importance has increased in all production stages and in 2007 they accounted for respectively 60% and 50% of ordinary imports of P&C and Consumption goods. This comforts the idea that FDI and trade are more complementary than substitute. Foreign investment projects in industry generate imports of capital goods and intermediate products. The presence of foreign investment in distribution networks favours the import of consumption goods (Table 5).
FCF, which have been traditionally mostly involved in processing trade, have increased their ordinary imports, showing the attraction of China’s domestic market. They have become a major vehicle of high-technology imports (accounting for 46% of these products in 2007 against 34% in 1997).
CEPII, WP No 2011-03 China’s foreign trade in the perspective of a more balanced economic growth
28
Table 5 - Share of Foreign-Capital firms in ordinary imports by partner area and production stage, in 2007
Advanced Asia
Developing Asia
Europe NAFTA Rest of the World
World
Primary goods 14 8 27 41 11 14 Semi-finished goods 52 39 48 42 35 46 Parts & Components 63 55 59 47 60 60 Consumption goods 59 24 54 46 38 50 Capital goods 49 47 24 20 14 35 All products 47 26 43 38 15 34 Manufacturing Products 55 42 45 38 36 47
Note: see Appendix E for the sectoral classification.
Source: China Customs Statistics, authors’ calculations.
3.4. The breakthrough of Asian suppliers on China’s domestic market
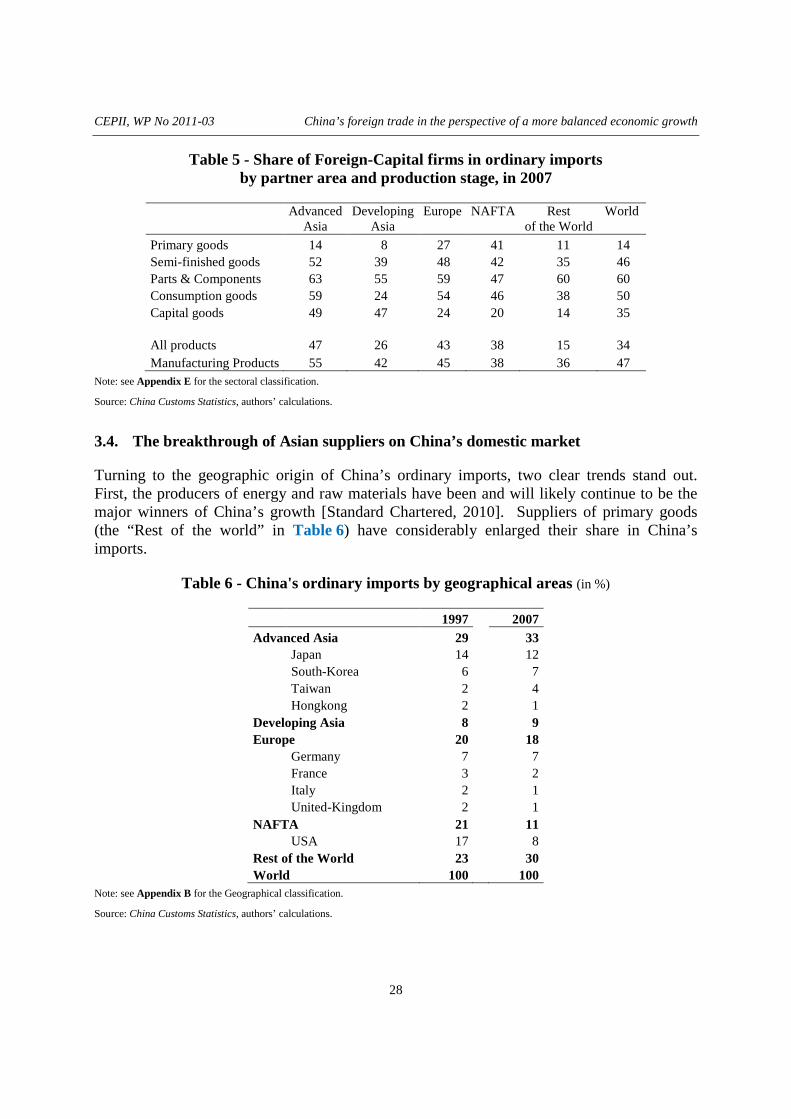
Turning to the geographic origin of China’s ordinary imports, two clear trends stand out. First, the producers of energy and raw materials have been and will likely continue to be the major winners of China’s growth [Standard Chartered, 2010]. Suppliers of primary goods (the “Rest of the world” in Table 6) have considerably enlarged their share in China’s imports.
Table 6 - China's ordinary imports by geographical areas (in %)
1997 2007 Advanced Asia 29 33 Japan 14 12 South-Korea 6 7 Taiwan 2 4 Hongkong 2 1 Developing Asia 8 9 Europe 20 18 Germany 7 7 France 3 2 Italy 2 1 United-Kingdom 2 1 NAFTA 21 11 USA 17 8 Rest of the World 23 30 World 100 100
Note: see Appendix B for the Geographical classification.
Source: China Customs Statistics, authors’ calculations.
CEPII, WP No 2011-03 China’s foreign trade in the perspective of a more balanced economic growth
29
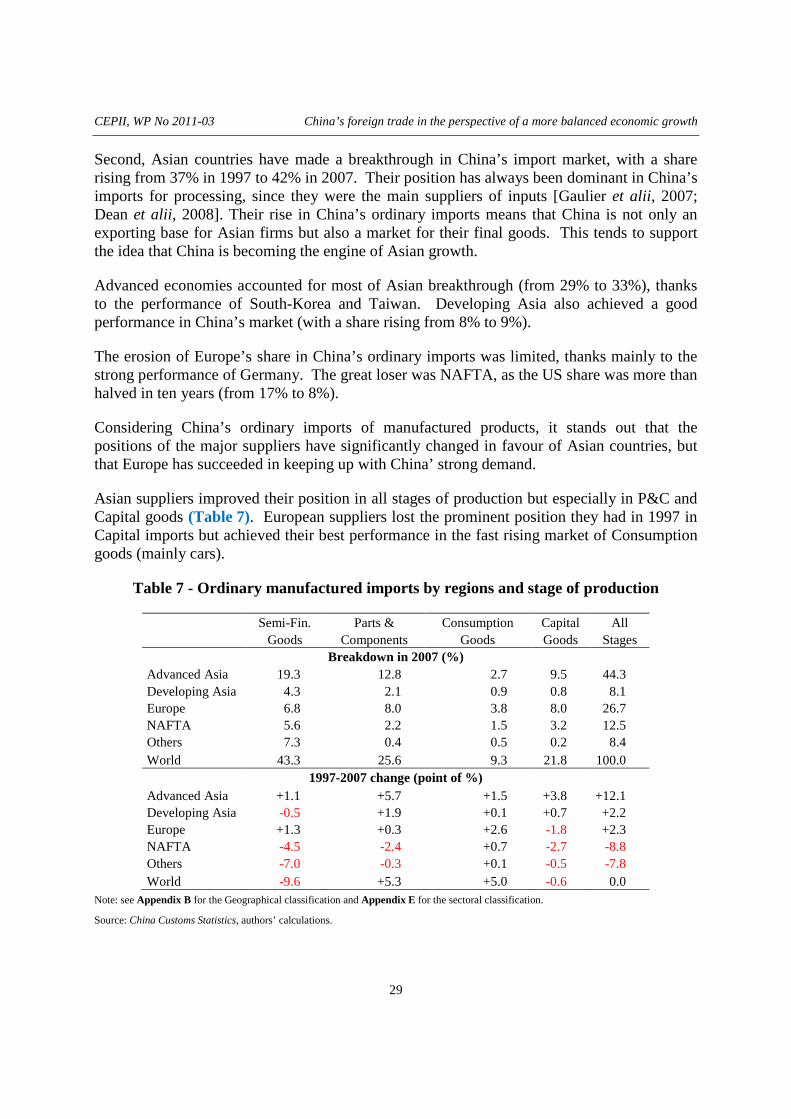
Second, Asian countries have made a breakthrough in China’s import market, with a share rising from 37% in 1997 to 42% in 2007. Their position has always been dominant in China’s imports for processing, since they were the main suppliers of inputs [Gaulier et alii, 2007; Dean et alii, 2008]. Their rise in China’s ordinary imports means that China is not only an exporting base for Asian firms but also a market for their final goods. This tends to support the idea that China is becoming the engine of Asian growth.
Advanced economies accounted for most of Asian breakthrough (from 29% to 33%), thanks to the performance of South-Korea and Taiwan. Developing Asia also achieved a good performance in China’s market (with a share rising from 8% to 9%).
The erosion of Europe’s share in China’s ordinary imports was limited, thanks mainly to the strong performance of Germany. The great loser was NAFTA, as the US share was more than halved in ten years (from 17% to 8%).
Considering China’s ordinary imports of manufactured products, it stands out that the positions of the major suppliers have significantly changed in favour of Asian countries, but that Europe has succeeded in keeping up with China’ strong demand.
Asian suppliers improved their position in all stages of production but especially in P&C and Capital goods (Table 7). European suppliers lost the prominent position they had in 1997 in Capital imports but achieved their best performance in the fast rising market of Consumption goods (mainly cars).
Table 7 - Ordinary manufactured imports by regions and stage of production
Semi-Fin. Parts & Consumption Capital All Goods Components Goods Goods Stages
Breakdown in 2007 (%) Advanced Asia 19.3 12.8 2.7 9.5 44.3 Developing Asia 4.3 2.1 0.9 0.8 8.1 Europe 6.8 8.0 3.8 8.0 26.7 NAFTA 5.6 2.2 1.5 3.2 12.5 Others 7.3 0.4 0.5 0.2 8.4 World 43.3 25.6 9.3 21.8 100.0
1997-2007 change (point of %) Advanced Asia +1.1 +5.7 +1.5 +3.8 +12.1 Developing Asia -0.5 +1.9 +0.1 +0.7 +2.2 Europe +1.3 +0.3 +2.6 -1.8 +2.3 NAFTA -4.5 -2.4 +0.7 -2.7 -8.8 Others -7.0 -0.3 +0.1 -0.5 -7.8 World -9.6 +5.3 +5.0 -0.6 0.0
Note: see Appendix B for the Geographical classification and Appendix E for the sectoral classification.
Source: China Customs Statistics, authors’ calculations.

CEPII, WP No 2011-03 China’s foreign trade in the perspective of a more balanced economic growth
30
Asian advanced economies thus supply more and more intermediate and investment goods to China’s productive system. This was associated with an upgrading of the technological content of their exports (the share of HT goods rose from 8% to 11%). They have become the major source of HT products, supplying half of China’s imports in 2007 (against 20% in 1997, Table 8). Asian industrial firms have thus been more and more involved in the development and modernisation of China’s manufacturing industry. Europe lost its position as China’s major supplier of HT imports and its share declined from 43% to 29%. This was not only due to the performance of Asian exporters but also to a decline in the HT content of the European own exports which dropped from 21% to 10%.
Table 8 - Origin of ordinary imports of high-technology products, 1997-2007
1997 2007 Breakdown of HT manufactured ordinary imports (in % )
Advanced Asia 20 50 Developing Asia 1 4 Europe 43 29 NAFTA 32 16 Rest of the World 4 1 World 100 100
HT content of ordinary imports from each zone (in %) Advanced Asia 8 11 Developing Asia 1 4 Europe 21 10 NAFTA 18 12 Rest of the World 8 4 World 12 10
Note: see Appendix B for the Geographical classification and Appendix F for the classification of hi-tech products.
Source: China Customs Statistics, authors’ calculations.
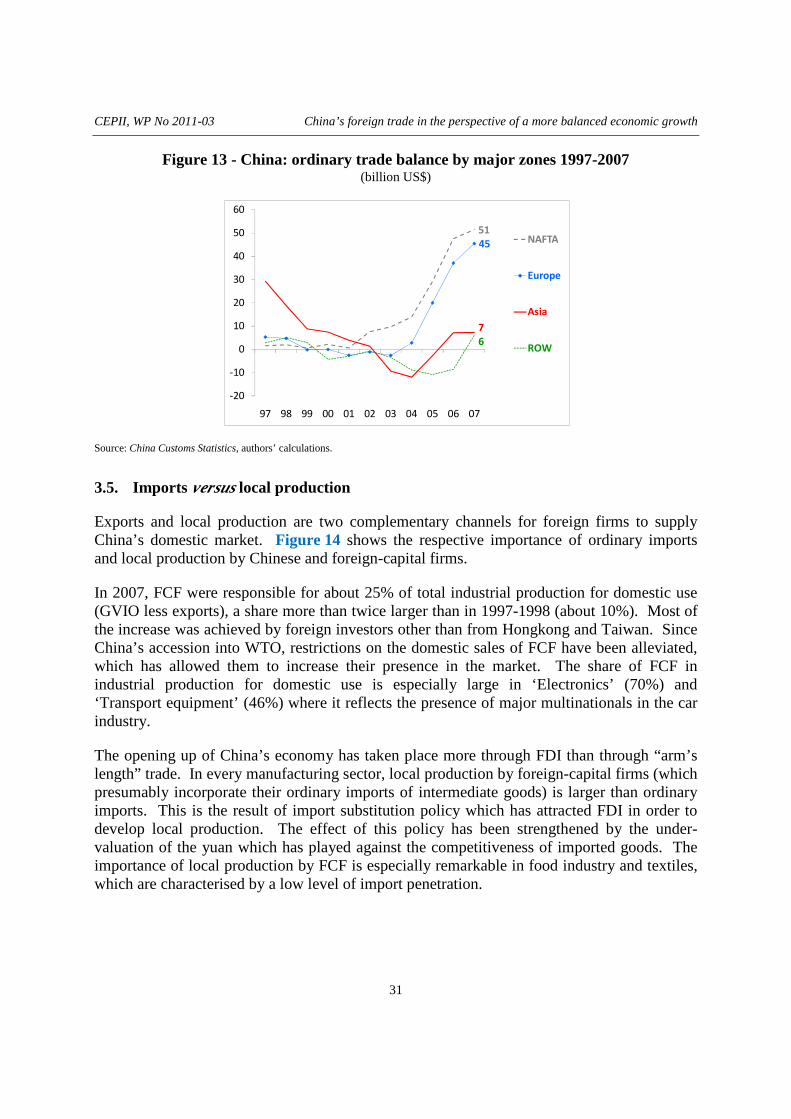
China’s economy may become an autonomous growth engine for Asia. In the past ten years, Asian economies have become more and more dependent on China’s demand. In 2007, China’s ordinary imports represented 1.2% of Japan’s GDP in 2007, 2.9% in the case of South-Korea and 4.6% in the case of Taiwan. This growing interdependence is leading Asian countries to strengthen regional cooperation.
As China’ imports come more and more from Asia and less from America (as shown in Table 7 above), an acceleration of its ordinary imports would reduce its overall trade deficit but not necessarily its major bilateral trade surplus with the US (Figure 13). Although we do not have China's recent trade data by customs regimes, overall trade data seem to confirm this hypothesis. Trade data (all customs regimes) show that in 2010 China's overall surplus was reduced by 30% compared to 2007; its trade surplus increased with NAFTA (+10%), decreased with Europe (-7%), while its deficit increased with Asia (doubled) and with the rest of the world (by a factor of 6).
CEPII, WP No 2011-03 China’s foreign trade in the perspective of a more balanced economic growth
31
Figure 13 - China: ordinary trade balance by major zones 1997-2007 (billion US$)
Source: China Customs Statistics, authors’ calculations.
3.5. Imports versus local production
Exports and local production are two complementary channels for foreign firms to supply China’s domestic market. Figure 14 shows the respective importance of ordinary imports and local production by Chinese and foreign-capital firms.
In 2007, FCF were responsible for about 25% of total industrial production for domestic use (GVIO less exports), a share more than twice larger than in 1997-1998 (about 10%). Most of the increase was achieved by foreign investors other than from Hongkong and Taiwan. Since China’s accession into WTO, restrictions on the domestic sales of FCF have been alleviated, which has allowed them to increase their presence in the market. The share of FCF in industrial production for domestic use is especially large in ‘Electronics’ (70%) and ‘Transport equipment’ (46%) where it reflects the presence of major multinationals in the car industry.
The opening up of China’s economy has taken place more through FDI than through “arm’s length” trade. In every manufacturing sector, local production by foreign-capital firms (which presumably incorporate their ordinary imports of intermediate goods) is larger than ordinary imports. This is the result of import substitution policy which has attracted FDI in order to develop local production. The effect of this policy has been strengthened by the under-valuation of the yuan which has played against the competitiveness of imported goods. The importance of local production by FCF is especially remarkable in food industry and textiles, which are characterised by a low level of import penetration.
51
45
7
6
-20
-10
0
10
20
30
40
50
60
97 98 99 00 01 02 03 04 05 06 07
NAFTA
Europe
Asia
ROW

CEPII, WP No 2011-03 China’s foreign trade in the perspective of a more balanced economic growth
32
Figure 14 - Chinese firms and FCF: industrial output for domestic use and ordinary imports
(2007, in billion US$)
Note: see Appendices C and D for the sectoral classification.
Source: China Customs Statistics, authors’ calculations.
For western companies, producing locally will remain a major channel for serving the local market. But they will face new challenges. First, attracting FDI has been a major instrument of the opening-up policy since 1978 and has proved very successful in helping China to modernise its manufacturing industry. But China seems now to rely less than in the past on inward FDI, and more on acquisition abroad, to acquire new technology. Second, Chinese firms have now emerged as powerful competitors in the domestic market as well as global players. The policy in favour of national “champions” and of indigenous innovation is challenging the interest of foreign investors. Moreover, the stimulus plan of 2008-2009 has enhanced public-led investment and thus local companies [European Chamber of Commerce, 2010].
This helps us to understand why, in 2010, the foreign business community in China expressed strong concerns about the use by the Chinese authorities of various market regulations (competition policy, standards, environment protection) as protectionist measures.
China’s policy towards FDI is at least as important as its exchange rate policy to determine foreign partners’ access to its domestic market.
3.6. Inland provinces: a new frontier for China’s growth?
Central provinces might be the winners of an economic policy which would emphasize domestic demand [Kwan, 2009; Deutsche Bank, 2010]. Since the early 2000s, they have benefited from large investment in infrastructures aimed at reducing regional disparities (“Go
0
100
200
300
400
500F
ood
Text
iles
Woo
d-P
ape
r
Che
mic
als
Me
tallu
rgy
Ma
chin
ery
Ele
ctric
al m
ac.
Ele
ctro
nics
Tra
nspo
rt E
q.
Industrial output for domestic use by Chinese firmsIndustrial output for domestic use by FCFOrdinary imports by Chinese firms
Ordinary imports by FCF

CEPII, WP No 2011-03 China’s foreign trade in the perspective of a more balanced economic growth
33
West” policy). More recently, these regions have benefited from the largest part of capital investments undertaken under the stimulus program. According to Okamoto and Inomata [2009] the positive impact of the stimulus program on the central regions could be larger than the negative impact from the crisis. Moreover, their growth prospects are supported by their labour cost advantage over coastal areas.
They have a large potential for catch up. The gap in income per capita between inland and coastal areas is still large (from one to two) although stabilised. Since 2000, interior manufacturing industries have recorded higher increase in output and labour productivity than coastal provinces. They seem to have benefited from the “advantages of backwardness” and to be on the way to closing the efficiency gap with coastal industries. As the latter are coming closer to international frontier, the “advantages of openness” become less important [Deng and Jefferson, 2010].
The economy of the inland provinces is relatively closed. Their involvement in international processing activities is minimal. Ordinary imports amounted to about 5% of the area’s GDP in 2007 (rising from 1% in 1997) but their contribution to China’s ordinary imports only slightly increased, from 10% to 12% (Table 9). Even if they become more open, it is probable that the largest part of their additional demand will be served by local production rather than imports [Deutsche Bank, 2010].
Table 9 - Regional distribution of imports (%)
Import share in GDP Breakdown of
Total imports Ordinary imports ordinary imports
1997 2007 1997 2007 1997 2007
Total 15 27 4 12 100 100
Coastal area 26 41 7 17 90 88
Inland area 2 6 1 5 10 12
Source: China Statistical Yearbook.
The presence of FCF in inland areas is still limited as they produce only 12% of local industrial output (against 38% in coastal area). Inland provinces have received up to now only approximately 20% of total FDI. Foreign firms will have to find ways to increase their presence in inland provinces or to use the coastal provinces as a springboard to these areas. This may imply alliances with Chinese firms which are naturally in better position to take advantage of the domestic demand, especially in the interior.

CEPII, WP No 2011-03 China’s foreign trade in the perspective of a more balanced economic growth
34
4. CONCLUSION
The economic crisis has enhanced China’s position in the world economy but has made more pressing a shift in its growth strategy. The study has addressed two questions: how the changes in global demand will affect China’s export sector? How China’s strong import demand will impinge on its economic and trade relations with the rest of the world?
China’s manufacturing industry is heavily dependent on world markets. Even if the growth of China’s exports slows down compared to the pre-crisis trend, their pressure in world markets is expected to remain strong, as the domestic market can only be a partial substitute to exports. The sluggish demand in advanced economies, if confirmed, would affect mainly China’s processing trade, handled by foreign-capital firms. Chinese firms are in a better position to take advantage from the fast-growing emerging markets and/or to shift to the domestic market.
China’s imports for domestic use have been on the rise, driven by its rapid economic growth. Asian exporters have made a breakthrough in the domestic market and China is not only the hub of an intra-regional division of labour but also a growing market for Asian final goods, which contributes to a regionally-centred economic growth. Europe maintained its strong position, taking advantage of China’s demand for consumption goods, while North-America lost ground. A global rebalancing of China’s foreign trade would thus not automatically lead to a reduction of its bilateral trade surplus with the US.
Foreign-capital firms have become more and more important actors in channelling foreign goods into China’s market. They have also played an increasing part in China’s industrial production for domestic use. China’s policy towards FDI is at least as important as its exchange rate policy to determine foreign partners’ access to its domestic market.
As more recent data on China’s foreign trade (2008-2010) will be available, it will be possible to assess first, to what extent the dynamic emerging markets can offset the sluggish demand in advanced economies for China’s exporting industries; second, whether the rebound in China’s import demand since early 2009 has strengthened the observed past trends in favour of its major suppliers in Asia and in Europe.

CEPII, WP No 2011-03 China’s foreign trade in the perspective of a more balanced economic growth
35
REFERENCES
ADB (Asian Development Bank) (2010), Regional Economic Outlook, April.
AMITI , M., C. FREUND (2009), “An Anatomy of China’s Export Growth”, Federal Reserve Bank of New York and CEPR, 31 January.
AZIZ, J., CUI LI (2007), “Explaining China’s Low Consumption: The Neglected Role of Household Income”, IMF Working Paper, July.
ANDERSON, J. (2009), “The Myth of Chinese Savings”, Far Eastern Economic Review, November, pp. 24-30.
BRANDT, L., E. THUN (2010) “The Fight for the Middle: Upgrading, Competition and Industrial Development in China”, University of Toronto, department of Economics Working Paper 395, March 16.
CAI Fang (2010), “An analysis of the causes and policy implications of “migrant worker shortage”, mimeo.
CHEN BINKAI , YAO, YANG, (2010), “The cursed virtue: Infrastructural investment and household consumption in Chinese provinces”, University of Oxford, China Growth Center Discussion Paper Series, n° 9, June,
DEAN, J., K.C.FUNG, WANG ZHI, (2008), “How Vertically Specilaized is Chinese Trade”, U.S. International Trade Commission Working Paper, n° 2008-09-D.
DU, YANG, PAN, WEIGUANG (2009), “Minimum Wage Regulation in China and Its Application to Migrant Workers in the Urban Labor Market”, China & World Economy, vol. 17, n° 2, pp. 79-93.
DENG, P., JEFFERSON, G., (2010), “Is inequality bad for China’s economic growth?”, China Growth Center (CGC) Discussion Paper Series, n° 8.
DEUTSCHE BANK (2010), Global Market Research, 18 February.
EUROPEAN CHAMBER OF COMMERCE (2010), “European Business in China”, Position Paper, 2010-2011 (http://www.europeanchamber.com.cn/view/static/?sid=7479).
FINGER, J. M., M. E. KREININ (1979), “A Measure of ‘Export Similarity’ and Its Possible Uses,” Economic Journal, n° 89, pp. 905-912.
FONTAGNÉ,L., M. FREUDENBERG, D. ÜNAL-KESENCI (1999), “Trade in Technology and Quality Ladders: Where do EU15 Countries Stand?”, International Journal of Development Planning Literature, Vol. 14, n° 4, pp. 561-582, October-December.
GOLDSTEIN, M., N. R. LARDY (2009), “The Future of China’s Exchange Rate Policy”, Policy Analyses in International Economics, n° 87, Peterson Institute For International Economics, July.
GREEN, S. (2008), The SCB China Chartbook, Quarter 4, 20 November.
CEPII, WP No 2011-03 China’s foreign trade in the perspective of a more balanced economic growth
36
GAULIER, G., F. LEMOINE, D. ÜNAL- KESENCI, (2006), “China: the price of competitiveness” La Lettre du CEPII, N°254 March.
GAULIER, G., F. LEMOINE, D. ÜNAL-KESENCI (2007), “China’s Emergence and the Reorganisation of Trade Flows in Asia”, China Economic Review, 18, 209-243.
HUANG, YIPING (2010), “Dissecting China’s Puzzle: Asymmetric Liberalisation and Cost Distorsions”, China Center for Economic Research Working Paper Series, n° 2010- 03, Beijing University.
HUMMELS, D., J. ISHII, K.-M. YI (2001): “The Nature and Growth of Vertical Specialization in World Trade,” Journal of International Economics, 54(1), 75–96.
IEA (International Energy Agency), World Energy Outlook 2007.
IMF (2010), World Economic Outlook. Rebalancing Growth, October.
JARREAU, J., S. PONCET (2009), “Export Sophistication and Economic Performance: Evidence from Chinese Provinces”, CEPII Working Paper, 2009-34, December.
KOOPMAN, R. & Z. WANG (2008), “How Much Chinese Exports is Really Made in China? Assessing Domestic Value-Added When Processing Trade is Pervasive”, NBER Working Paper, n° 14109, http.www.nber.org/papers/w14109 .
KWAN, CHI Hung (2009), “Growth in Chinese Economy Moving from East to West –‘Domestic flying geese’ pattern starting to show effects”, http://www.rieti.go.jp/en/china/09060501.html .
KUIJS, L. (2009), “Policies drive Chinese savings”, China Economic Quarterly, December.
LAFAY G. (1994), “The Measurement of Revealed Comparative Advantages”, in M.G. Dagenais & P. A. Muet, International Trade Modelling, London, Chapman & Hall.
LEMOINE, F., D.ÜNAL-KESENCI (2004), “Assembly Trade and Technology Transfer: The Case of China”, World Development, 32(5).
LINDEN G., K. L. KRAMER, J. DEDRIK (2007), “Who Capture Value in a Global Innovation Systme? The case of Apples’s iPod”, PCIC, June.
LINDER, S.B. (1961), An Essay on Trade and Transformation, New York, John Wiley and Sons.
MA, Guonan, Wang YI (2010), “China’s high saving rate: myth and reality”, BIS Working Papers, n° 312, June.
MA, Alyson C., A. VAN ASSCHE (2010), ‘The Role of Trade Costs in Global Production Networks. Evidence from China’s Processing Trade Regime’, Mimeo.
MCKAY , H., L. SONG (2010), “China as a Global Manufacturing Powerhouse: Strategic Considerations and Structural Adjustment”, China & World Economy, vol. 18, n° 1, pp. 1-32.
OECD (2010), OECD Economic Survey-China, Vol. 2010/6, February, OECD, Paris.

CEPII, WP No 2011-03 China’s foreign trade in the perspective of a more balanced economic growth
37
OECD (2005), OECD Economic Survey-China, OECD, Paris
OKAMOTO, N., S. INOMATA (2009), “To What Extent Will the Shock Be Alleviated? The Evaluation of China’s Counter-crisis Fiscal Expansion”, in Asia beyond the Crisis. Visions from International Input-Output Anaysis. Edited by S.Inomata and Y. Uchida; Institute of Developing Economies-JETRO.
PBOC (People’s Bank of China) (2010), China Monetary Policy Report, Quarter Two, August.
PISANI-FERRY, J. (2010), “China and the world economy: a European perspective”, Brueghel Policy Contribution, Issue 2010/3, March 2010.
STANDARD CHARTERED (2010), Global Focus, 08 April.
THE ECONOMIST (2010), ‘The world turned upside down. A special report on innovation in emerging markets’, April 27.
UPWARD, R., Zheng WANG, Jinghai ZHENG (2010), “Weighting China’s Export Basket: An Account of the Chinese Export Boom, 2000-2007”, University of Nottingham Research Paper, 2010/14.
WIEMER, C. (2009), “The big savers: households and government”, China Economic Quarterly, vol. 3, n°4, pp.25-30, December.
WING, TYE WOO (2009), “China’s Short-term and Long-term Economic Goals and Prospects”, http://www.brookings.edu/testimony/2009/0217_chinas_economy_woo.aspx .
WORLD BANK (2010), Quarterly Update 2010, World Bank Beijing Office, November.
YAO Zhizhong, LIU Shiguo (2007), “Ownership-based Trade-A New Assessment of the Trade Balance”, http://iwep.org.cn/ January.
YANG Yao (2010), “The Lewisian turning point has not yet arrived”, http://en.ccer.edu.cn/readNews.asp?NewsID=6848, 2010-7-21.
YU Yongding (2010), “A different road forward: Painful adjustment needed to sustain advancement in the face of anaemic innovation, slow tech upgrade and social tensions”, China Daily, December 23.
CEPII, WP No 2011-03 China’s foreign trade in the perspective of a more balanced economic growth
38
APPENDICES
A. CHINA 'S CUSTOMS STATISTICS
Data description
China’s customs statistics were available for ten years, from 1997 to 2007. They provided data disaggregated at the 6 digit level of HS classification, by types of firms (8), by trade regimes (18), by provinces (31), by partners (200). We aggregated the original data into different product classifications (see Appendices C, D, E, F), into four categories of firms (State-owned, other Chinese firms, Joint-ventures, Fully-foreign firms), three custom regimes (ordinary trade, processing trade others), two Chinese regions (coastal and inland provinces), four geographic categories of trade partners (Advanced Asia, Developing Asia, Europe, NAFTA, Rest of the world, see Appendix B).
When China imports… from China
China customs statistics report large and increasing flows of merchandise coming from… China.
Discussions with customs officials indicate that those shipments are domestic trade. Indeed some companies import duty-free goods for processing and re-export, but actually, the goods are shipped to another Chinese province through a transit country. This flow is reported as an export. The custom office in the province where the good is shipped to may know the true origin of the shipment and reports it as coming from China. Customs administration considers that the majority of these flows transit through ted to Hong-Kong
As we are only interested in international trade we would like to eliminate those flows. For that, it would be necessary to drop imports not only imports from China to China but also their counterparties in export flows (false re-exports).
Simply removing China-China imports from exports to Hong-Kong is not warranted. Indeed there are numerous cases where the former is bigger than the latter.
In 2007 total imports from China to China are 50% of total exports to Hong-Kong (72% for Shanghai) but as soon as you want to “correct” disaggregated flows you encounter many difficulties.
CEPII, WP No 2011-03 China’s foreign trade in the perspective of a more balanced economic growth
39
At the most detailed level (province, product, regime (processing, etc.), type of firm (foreign, etc.) the matching is very poor. For half the elementary China-China imports flows there is no elementary export to Hong-Kong. Still there seem to be a relationship between the two types de flows: controlling for the product category, when an import from China increases by 10% the export to HK (with the same characteristics: province, transport mode, etc.) increases by 3 to 4%. When we match only the year and the product (8 digits) the relationship between the two types of flow is much tighter: exports to HK are higher than imports from China in at least 73% of all cases (80% of the total value of exports to HK and imports from China). Controlling for products and years as before we find that 10% more imports are associated to around 9% more exports.
But we still face the problem of a large number of cases where imports cannot be subtracted from exports.
The correction explored above being not practicable, another less sensible but convenient option is to consider imports from China as imports from HK. We then overstate international trade but get rid of China-China trade flows without altering the trade balance.
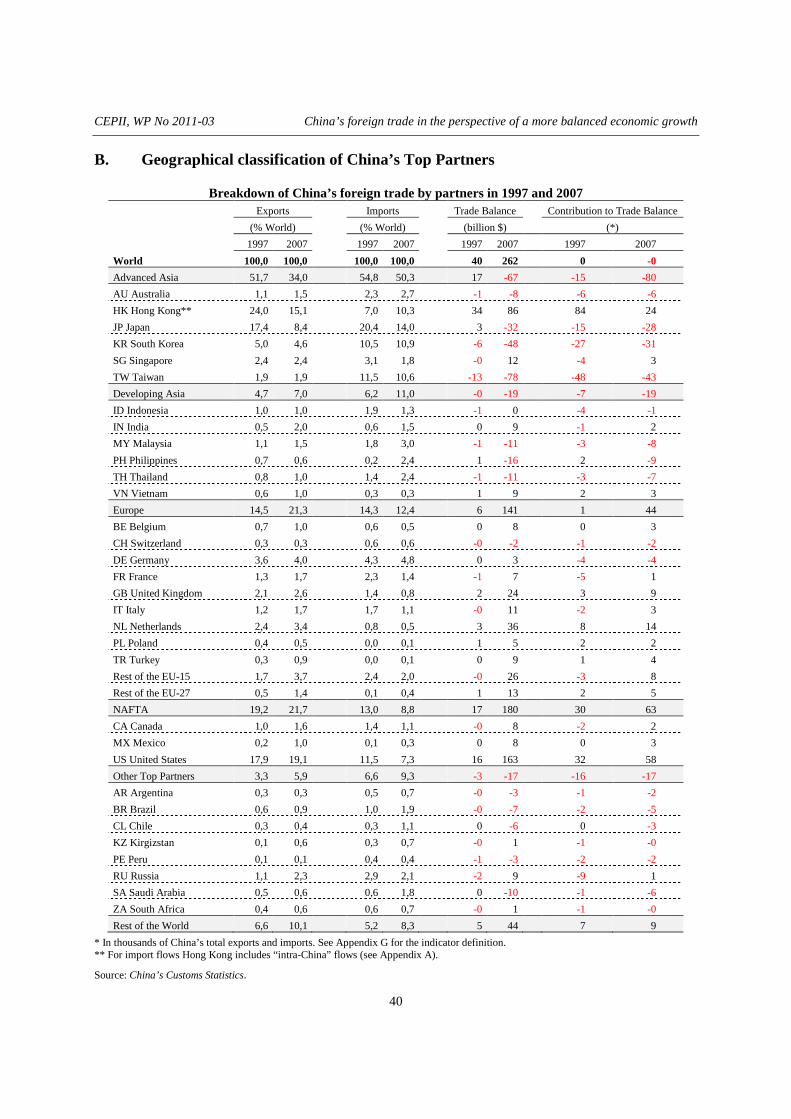
CEPII, WP No 2011-03 China’s foreign trade in the perspective of a more balanced economic growth
40
B. Geographical classification of China’s Top Partners
Breakdown of China’s foreign trade by partners in 1997 and 2007 Exports Imports Trade Balance Contribution to Trade Balance
(% World) (% World) (billion $) (*)
1997 2007 1997 2007 1997 2007 1997 2007
World 100,0 100,0 100,0 100,0 40 262 0 -0
Advanced Asia 51,7 34,0 54,8 50,3 17 -67 -15 -80
AU Australia 1,1 1,5 2,3 2,7 -1 -8 -6 -6
HK Hong Kong** 24,0 15,1 7,0 10,3 34 86 84 24
JP Japan 17,4 8,4 20,4 14,0 3 -32 -15 -28
KR South Korea 5,0 4,6 10,5 10,9 -6 -48 -27 -31
SG Singapore 2,4 2,4 3,1 1,8 -0 12 -4 3
TW Taiwan 1,9 1,9 11,5 10,6 -13 -78 -48 -43
Developing Asia 4,7 7,0 6,2 11,0 -0 -19 -7 -19
ID Indonesia 1,0 1,0 1,9 1,3 -1 0 -4 -1
IN India 0,5 2,0 0,6 1,5 0 9 -1 2
MY Malaysia 1,1 1,5 1,8 3,0 -1 -11 -3 -8
PH Philippines 0,7 0,6 0,2 2,4 1 -16 2 -9
TH Thailand 0,8 1,0 1,4 2,4 -1 -11 -3 -7
VN Vietnam 0,6 1,0 0,3 0,3 1 9 2 3
Europe 14,5 21,3 14,3 12,4 6 141 1 44
BE Belgium 0,7 1,0 0,6 0,5 0 8 0 3
CH Switzerland 0,3 0,3 0,6 0,6 -0 -2 -1 -2
DE Germany 3,6 4,0 4,3 4,8 0 3 -4 -4
FR France 1,3 1,7 2,3 1,4 -1 7 -5 1
GB United Kingdom 2,1 2,6 1,4 0,8 2 24 3 9
IT Italy 1,2 1,7 1,7 1,1 -0 11 -2 3
NL Netherlands 2,4 3,4 0,8 0,5 3 36 8 14
PL Poland 0,4 0,5 0,0 0,1 1 5 2 2
TR Turkey 0,3 0,9 0,0 0,1 0 9 1 4
Rest of the EU-15 1,7 3,7 2,4 2,0 -0 26 -3 8
Rest of the EU-27 0,5 1,4 0,1 0,4 1 13 2 5
NAFTA 19,2 21,7 13,0 8,8 17 180 30 63
CA Canada 1,0 1,6 1,4 1,1 -0 8 -2 2
MX Mexico 0,2 1,0 0,1 0,3 0 8 0 3
US United States 17,9 19,1 11,5 7,3 16 163 32 58
Other Top Partners 3,3 5,9 6,6 9,3 -3 -17 -16 -17
AR Argentina 0,3 0,3 0,5 0,7 -0 -3 -1 -2
BR Brazil 0,6 0,9 1,0 1,9 -0 -7 -2 -5
CL Chile 0,3 0,4 0,3 1,1 0 -6 0 -3
KZ Kirgizstan 0,1 0,6 0,3 0,7 -0 1 -1 -0
PE Peru 0,1 0,1 0,4 0,4 -1 -3 -2 -2
RU Russia 1,1 2,3 2,9 2,1 -2 9 -9 1
SA Saudi Arabia 0,5 0,6 0,6 1,8 0 -10 -1 -6
ZA South Africa 0,4 0,6 0,6 0,7 -0 1 -1 -0
Rest of the World 6,6 10,1 5,2 8,3 5 44 7 9
* In thousands of China’s total exports and imports. See Appendix G for the indicator definition. ** For import flows Hong Kong includes “intra-China” flows (see Appendix A).
Source: China’s Customs Statistics.

CEPII, WP No 2011-03 China’s foreign trade in the perspective of a more balanced economic growth
41
C. Classification by industry groups and ISIC branches
China’s foreign trade with ALL PARTNERS by industry groups and ISIC branches in 1997 and 2007 Industry group ISIC Branch
Exports
(% total)
Imports
(% total)
Trade Balance (TB)
(billion USD)
Contribution to TB
(*) 1997 2007 1997 2007 1997 2007 1997 2007
Total 100 100 100 100 40 262 0 0 Energy 4 2 7 11 -3 -84 -17 -45
10 Mining of coal & lignite 1 0 0 0 1 1 3 0 11 Extrac. of crude petroleum & natural gas 2 1 4 10 -2 -85 -11 -45 12 Mining of uranium & thorium ores 0 0 0 0 -0 -0 -0 -0 23 Coke, refined petroleum & nuclear fuel 1 0 3 0 -2 0 -10 -0 40 Electricity, gas, steam & hot water supply 0 0 0 0 0 1 1 0
Agriculture & Food 8 3 8 5 3 -14 1 -11 01 Agriculture, hunting 2 1 3 2 -0 -15 -4 -9 02 Forestry, logging 0 0 1 1 -1 -5 -2 -3 05 Fishing, fish farming 0 0 0 0 1 1 1 0 15 Food products & beverages 5 2 4 2 3 5 4 0 16 Tobacco products 0 0 0 0 0 0 1 0
Textiles 32 17 11 2 43 187 104 73 17 Textiles 11 7 8 2 8 69 13 26 18 Wearing apparel 14 7 1 0 25 85 67 34 19 Leather 7 3 2 1 10 33 24 13
Wood Paper 10 7 5 2 11 67 25 25 20 Wood products 1 1 1 0 1 9 1 3 21 Pulp, paper & paper products 0 0 3 1 -4 -8 -13 -5 22 Publishing, printing & recorded media 0 0 0 0 0 2 0 1 36 Furniture; manufacturing n.e.c. 8 6 1 1 14 64 36 25
Chemicals 11 10 18 14 -5 -19 -33 -23 14 Other mining & quarrying 1 0 0 1 1 -3 1 -2 2410 Basic chemical products 3 3 11 9 -9 -46 -36 -28 2423 Pharmaceutical products 1 1 0 1 2 4 4 1 24xx Other chemical products 1 2 4 2 -3 -3 -13 -4 25 Rubber & plastic 3 3 2 2 2 14 5 4 26 Non-metallic mineral products 2 2 1 1 3 16 7 6
Metallurgy 4 6 9 13 -6 -54 -26 -36 13 Mining of metal ores 0 0 2 7 -3 -65 -11 -33 27 Basic metals 4 6 7 6 -3 11 -16 -2
Machinery 8 12 16 9 -8 54 -40 12 28 Metal products 3 4 2 1 4 36 8 13 29 Machinery 4 8 14 8 -12 19 -48 -1
Electrical machinery 5 6 5 5 2 25 -1 5 31 Electrical machinery 5 6 5 5 2 25 -1 5
Electronics 15 33 16 33 5 82 -3 -2 30 Office machinery & computers 5 12 3 5 5 103 9 37 32 Radio, TV & communication equipment 7 17 10 21 -0 9 -11 -19 33 Medical, precision & optical instruments 3 3 3 7 1 -30 -1 -20
Transport equipment 3 5 4 4 -1 17 -8 3 34 Motor vehicles, trailers & semi-trailers 1 3 2 3 -0 8 -2 0 35 Other transport equipment 2 2 3 2 -1 10 -5 2
Non elsewhere classified 1 0 1 0 -0 1 -2 -0 74 Other business activities 0 0 0 0 -0 0 -1 0 92 Recreational, cultural & sporting activities 0 0 0 0 0 0 0 0 93 Other service activities 0 0 0 0 1 1 1 0 99 Extra-territorial organisations & bodies 0 0 1 0 -1 -0 -2 -0
* In thousands of China’s total exports and imports. See Appendix G for the indicator definition.
Source: China’s Customs Statistics.

CEPII, WP No 2011-03 China’s foreign trade in the perspective of a more balanced economic growth
42
D. Distribution of China’s Statistical Yearbook sectors by industry groups
Industry Group China’s Statistical Yearbook Sector Energy Extraction of Petroleum and Natural Gas Mining and Washing of Coal Mining of Other Ores Processing of Petroleum, Coking, Processing of Nuclear Fuel Production and Supply of Electric Power and Heat Power Production and Supply of Gas Production and Supply of Water Agriculture& Food Manufacture of Foods Manufacture of Beverages Manufacture of Tobacco Processing of Foods from Agricultural Products
Textiles Manufacture of Leather, Fur, Feather and Related Products Manufacture of Textile Manufacture of Textile Wearing Apparel, Footware and Caps Wood &Paper Manufacture of Articles For Culture, Education and Sport Activities Manufacture of Artwork and Other Manufacturing Manufacture of Furniture Manufacture of Paper and Paper Products Printing, Reproduction of Recording Media Processing of Timber, Manufacture of Wood, Bamboo, Rattan, Palm and Straw Products Recycling and Disposal of Waste Chemicals Manufacture of Chemical Fibers Manufacture of Medicines Manufacture of Non-metallic Mineral Products Manufacture of Plastics Manufacture of Raw Chemical Materials and Chemical Products Manufacture of Rubber Mining and Processing of Non metal Ores Metallurgy Mining and Processing of Ferrous Metal Ores Mining and Processing of Non-Ferrous Metal Ores Smelting and Pressing of Ferrous Metals Smelting and Pressing of Non-ferrous Metals Machinery Manufacture of General Purpose Machinery Manufacture of Metal Products Manufacture of Special Purpose Machinery Electrical machinery Manufacture of Electrical Machinery and Equipment
Electronics Manufacture of Communication Equipment, Computers and Other Electronic Equipment Manufacture of Measuring Instruments and Machinery for Cultural Activity and Office Work Transport Equipment Manufacture of Transport Equipment
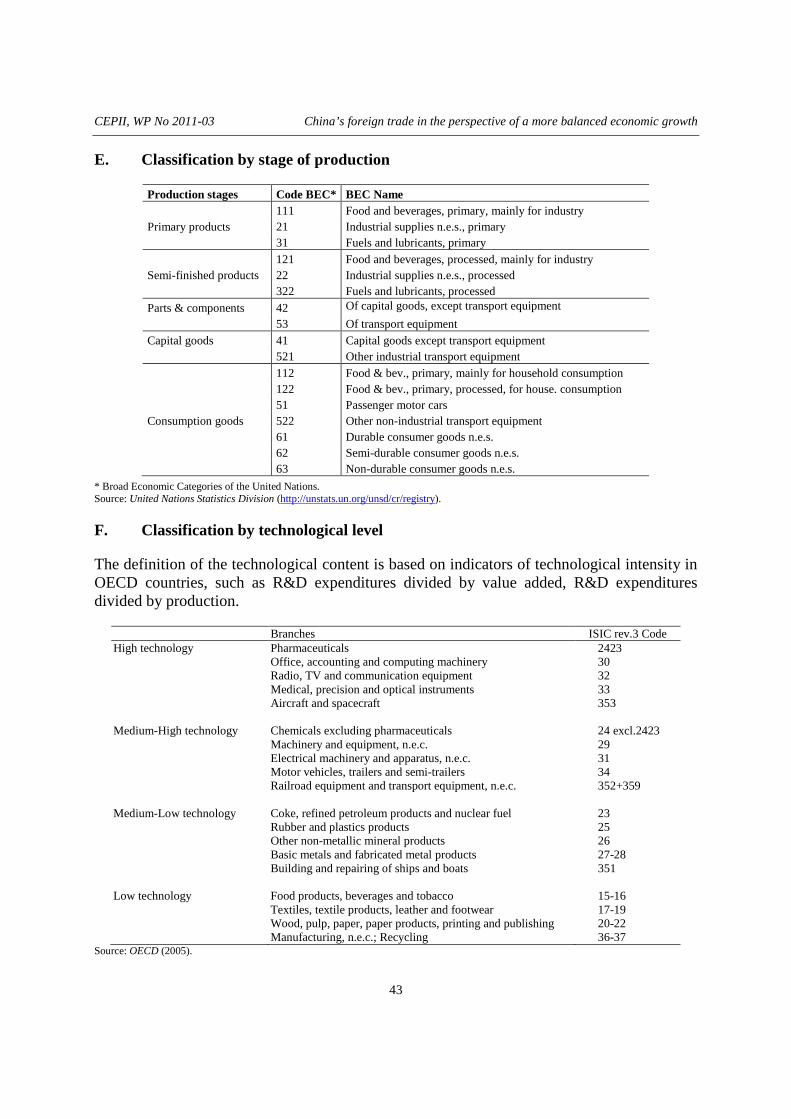
CEPII, WP No 2011-03 China’s foreign trade in the perspective of a more balanced economic growth
43
E. Classification by stage of production
Production stages Code BEC* BEC Name 111 Food and beverages, primary, mainly for industry Primary products 21 Industrial supplies n.e.s., primary 31 Fuels and lubricants, primary 121 Food and beverages, processed, mainly for industry Semi-finished products 22 Industrial supplies n.e.s., processed 322 Fuels and lubricants, processed
Parts & components 42 Of capital goods, except transport equipment
53 Of transport equipment Capital goods 41 Capital goods except transport equipment 521 Other industrial transport equipment 112 Food & bev., primary, mainly for household consumption 122 Food & bev., primary, processed, for house. consumption 51 Passenger motor cars Consumption goods 522 Other non-industrial transport equipment 61 Durable consumer goods n.e.s. 62 Semi-durable consumer goods n.e.s. 63 Non-durable consumer goods n.e.s.
* Broad Economic Categories of the United Nations. Source: United Nations Statistics Division (http://unstats.un.org/unsd/cr/registry).
F. Classification by technological level
The definition of the technological content is based on indicators of technological intensity in OECD countries, such as R&D expenditures divided by value added, R&D expenditures divided by production.
Branches ISIC rev.3 Code High technology Pharmaceuticals 2423 Office, accounting and computing machinery 30 Radio, TV and communication equipment 32 Medical, precision and optical instruments 33 Aircraft and spacecraft 353 Medium-High technology Chemicals excluding pharmaceuticals 24 excl.2423 Machinery and equipment, n.e.c. 29 Electrical machinery and apparatus, n.e.c. 31 Motor vehicles, trailers and semi-trailers 34 Railroad equipment and transport equipment, n.e.c. 352+359 Medium-Low technology Coke, refined petroleum products and nuclear fuel 23 Rubber and plastics products 25 Other non-metallic mineral products 26 Basic metals and fabricated metal products 27-28 Building and repairing of ships and boats 351 Low technology Food products, beverages and tobacco 15-16 Textiles, textile products, leather and footwear 17-19 Wood, pulp, paper, paper products, printing and publishing 20-22 Manufacturing, n.e.c.; Recycling 36-37
Source: OECD (2005).

CEPII, WP No 2011-03 China’s foreign trade in the perspective of a more balanced economic growth
44
On the basis of this definition, two types of classification of high-technology products can be made:
- at a broad category level: the indicators of technology content are calculated at the branch level and all the products within a high-tech branch are considered as “high-tech” products;
- at a detailed product level within a broad category.
The first methodology is the most widely used. Manufacturing branches ISIC rev.3, at 2 or 3 digit level are classified into 4 technological levels: high-technology, medium-high-technology; medium-low-technology; and low-technology.
In this classification high-technology industries include all products belonging to the high-tech branch. It has to be noted that this methodology introduces a serious selection bias, since not all products in a “high-technology industry” necessarily have a high-technology content. Likewise, some products in industries with low-technology intensity may well incorporate a high degree of technological sophistication.
The second methodology first defines large high-tech branches (as described above) and then selects, within this high-tech branches and a detailed level, the products having a high content in R&D. The definition of high-tech products used in CEPII studies refers to this second way [Fontagné et alii, 1999]. The nine high-tech industries that were selected in the first step were the following:
- aerospace; - computers, office machinery; - electronics-communications; - pharmaceuticals; - scientific instruments; - electrical machinery; - chemicals; - other transport equipment; - non-electrical machinery; - weapons.
In the second step, within these broad categories, a list of 252 products (at the 6 digit level of the Harmonised System) was identified as high-tech [Fontagné et alii, 1999]. It has to be noted that this methodology introduces another selection bias, since it identifies the high-technology products only in the branches that are considered as high-technology: the high-technology products belonging to non technological branches are thus implicitly excluded.
The present study makes use of the second methodology.

CEPII, WP No 2011-03 China’s foreign trade in the perspective of a more balanced economic growth
45
G. The indicator of contribution to the trade balance
A country’s international specialisation and its comparative advantages and disadvantages are measured here by the indicator of contribution to the trade balance [Lafay, 1994]. This indicator, measured in thousandths of total trade flows (exports plus imports), compares a country’s trade balance for a given product and partner with a theoretical balance corresponding to an absence of specialisation. The latter is computed by spreading the overall balance across the various products and partners according to their respective shares in the country’s total trade. The indicator is additive, and by construction the sum over all products and partners is equal to zero. Thus, the indictor also enables to observe specialisation patterns under the theoretical condition of a balanced trade. A positive (negative) value for the indicator shows that the country has a comparative advantage (disadvantage) for the product in question. For a given country, the indicator of revealed comparative advantage (RCA) may be expressed as:
( ) ( )
++−−−
+=
..
..
..
...
..
.
1000ii
ijk
ijkiiij
kijkii MX
MXMXMX
MXRCA
Where i is the country (here, China), j is the partner, k is the product, X is exports, M is imports and “.” is the sum operator.
H. The indicator of similarity of trade flows
The similarity of trade flows’ composition by products is measured here by the Finger-Kreinin Export Similarity Index [FK Index, 1979]. FK Index is usually used to compare the export (or import) composition by products of different countries. In this study, we don’t compare the China’s trade composition to other countries’ ones, but compare China’s export (import) composition by products between its different trade regimes (ordinary or processing trade, etc.) or between different types of firm (Chinese or foreign, etc).
The similarity Index (S) is calculated as follows:
×=∑∑∑
k
bpk
bpk
k
apk
apk
k X
X
X
XpabS ,min100),(
Where:
X = value of trade, exports or imports
k = disaggregated commodity (at 6 digit level of HS classification)
a, b = two trade regimes or types of firm
p = China’s trade partner country (or zone)

CEPII, WP No 2011-03 China’s foreign trade in the perspective of a more balanced economic growth
46
The first ratio in the min operator is the share of product k in China a’s total exports with its partner country (zone) p and the second ratio is the share of commodity k in China’s b’s total exports with the same partner p. If those shares are equal, then the ratio in the formula would sum to 100, indicating perfect similarity. On the other hand, if they are totally different, the formula would be zero. Thus the index can range from 0 to 100. This index is sensitive to the degree of disaggregation. A priori the greater is the degree of disaggregation, the smaller is the similarity index.
I. Chinese provinces’ exports and growth
Chinese provinces: Export-orientation and GDP growth (%)
Sources: China Statistical Yearbook, 2008, and China Customs Statistics, authors’ calculations.
Chinese provinces: Exports and industrial growth
TOTAL EXPORTS ORDINARY EXPORTS
Sources: China Statistical Yearbook, 2008 and China Customs Statistics, authors’ calculations.
GuangdongShanghai
JiangsuTianjinZhejiang
Fujian
LiaoningBeijingXinjiang
Shandong
ShanxiInner Mongolia
0
10
20
30
40
50
60
70
80
90
100
0 2 4 6 8 10 12 14 16 18
Exp
ort s
hare
in
GD
P in
200
7 (%
)
2008/09 GDP growth (%)
Tibet
GuangdongShangai
Beijing
Fujian
Jiangsu TianjinXinjiang
Zhenjiang
HeilongjiangLiaoning
HainanAnhui
ShanxiInner Mongolia
0
10
20
30
40
50
60
70
0 5 10 15 20 25 30
Tota
l exp
orts
(lo
catio
n of
exp
orte
r) s
hare
in
GV
IO in
200
7 (%
)
Industrial VA growth in 2009 (%)
Zhejiang
Shanghai
Fujian
TibetGuangdong
JiangsuBeijingTianjinHainan
Heilongjiang Ningxia ChongqingXinjiang Anhui
ShanxiInner MongoliaJilin
0
5
10
15
20
25
0 5 10 15 20 25 30
Ord
inar
y ex
ports
(lo
catio
n of
exp
orte
r) s
hare
in
GV
IO in
200
7 (%
)
Industrial VA growth in 2009 (%)
CEPII, WP No 2011-03 China’s foreign trade in the perspective of a more balanced economic growth
47
L IST OF WORKING PAPERS RELEASED BY CEPII
An Exhaustive list is available on the website: www.cepii.fr.
No Tittle Authors
2011.02 The Interactions Between the Credit Default Swap and the Bond Markets in Financial Turmoil
V. Coudert & M. Gex
2011.01 Comparative Advantage and Within-Industry Firms Performance
M. Crozet & F. Trionfetti
2010-33 Export Performance and Credit Constraints in China J. Jarreau & S. Poncet
2010-32 Export Performance of China’s Domestic Firms: the Role of Foreign Export Spillovers
F. Mayneris & S. Poncet
2010-31 Wholesalers in International Trade M. Crozet, G. Lalanne & S. Poncet
2010-30 TVA et taux de marge: une analyse empirique sur données d’entreprises
P. Andra, M. Carré & A. Bénassy-Quéré
2010-29 Economic and cultural assimilation and integration of immigrants in europe
M. Aleksynska & Y. Algan
2010-28 Les firmes françaises dans le commerce de service G. Gaulier, E. Milet & D. Mirza
2010-27 The world Economy in 2050: a Tentative Picture J. Fouré, A. Bénassy-Quéré
& L. Fontagné
2010-26 Determinants and Pervasiveness of the Evasion of Customs Duties
S. Jean & C. Mitaritonna
2010-25 On the Link between Credit Procyclicality and Bank Competition
V. Bouvatier, A. Lopez-Villavicencio
& V. Mignon
2010-24 Are Derivatives Dangerous? A Literature Survey G. Capelle-Blancard

CEPII, WP No 2011-03 China’s foreign trade in the perspective of a more balanced economic growth
48
No Tittle Authors
2010-23 BACI: International Trade Database at the Product-Level – The 1994-2007 Version
G. Gaulier & S. Zignago
2010-22 Indirect Exporters F. McCann
2010-21 Réformes des retraites en France : évaluation de la mise en place d’un système par comptes notionnels
X. Chojnicki & R. Magnani
2010-20 The Art of Exceptions: Sensitive Products in the Doha Negotiations
C. Gouel, C. Mitaritonna & M.P. Ramo
2010-19 Measuring Intangible Capital Investment: an Application to the “French Data
V. Delbecque & L. Nayman
2010-18 Clustering the Winners: The French Policy of Competitiveness Clusters
L. Fontagné, P. Koenig, F. Mayneris & S. Poncet
2010-17 The Credit Default Swap Market and the Settlement of Large Defauts
V. Coudert & M. Gex
2010-16 The Impact of the 2007-10 Crisis on the Geography of Finance
G. Capelle-Blancard & Y. Tadjeddine
2010-15 Socially Responsible Investing: It Takes more than Words
G. Capelle-Blancard & S. Monjon
2010-14 A Case for Intermediate Exchange-Rate Regimes V. Salins & A. Bénassy-Quéré
2010-13 Gold and Financial Assets: Are they any Safe Havens in Bear Markets?
V. Coudert & H. Raymond
2010-12 European Export Performance A. Cheptea, L. Fontagné & S. Zignago
2010-11 The Effects of the Subprime Crisis on the Latin American Financial Markets: An Empirical Assessment
G. Dufrénot, V. Mignon & A. Péguin-Feissolle
2010-10 Foreign Bank Presence and its Effect on Firm Entry and Exit in Transition Economies
O. Havrylchyk
CEPII, WP No 2011-03 China’s foreign trade in the perspective of a more balanced economic growth
49
No Tittle Authors
2010-09 The Distorted Effect of Financial Development on International Trade Flows
A. Berthou
2010-08 Exchange Rate Flexibility across Financial Crises V. Coudert, C. Couharde & V. Mignon
2010-07 Crises and the Collapse of World Trade: the Shift to Lower Quality
A. Berthou & C. Emlinger
2010-06 The heterogeneous effect of international outsourcing on firm productivity
F. McCann
2010-05 Fiscal Expectations on the Stability and Growth Pact: Evidence from Survey Data
M. Poplawski-Ribeiro & J.C. Rüle
2010-04 Terrorism Networks and Trade: Does the Neighbor Hurt J. de Sousa, D. Mirza & T. Verdier
2010-03 Wage Bargaining and the Boundaries of the Multinational Firm
M. Bas & J. Carluccio
2010-02 Estimation of Consistent Multi-Country FEERs B. Carton & K. Hervé
2010-01 The Elusive Impact of Investing Abroad for Japanese Parent Firms: Can Disaggregation According to FDI Motives Help
L. Hering, T. Inui & S. Poncet
Organisme public d’étude et de recherche en économie internationale, le CEPII est placé auprès du Centre d’Analyse Stratégique. Son programme de travail est fixé par un conseil composé de responsables de l’administration et de personnalités issues des entreprises, des organisations syndicales et de l’Université.
Les documents de travail du CEPII mettent à disposition du public professionnel des travaux effectués au CEPII, dans leur phase d’élaboration et de discussion avant publication définitive. Les documents de travail sont publiés sous la responsabilité de la direction du CEPII et n’engagent ni le conseil du Centre, ni le Centre d’Analyse Stratégique. Les opinions qui y sont exprimées sont celles des auteurs.
Les documents de travail du CEPII sont disponibles sur le site : http//www.cepii.fr