chinese aid and health at the country and local level · 2020-06-10 · working paper 97 may 2020...
TRANSCRIPT
WORKING PAPER 97
May 2020
Chinese Aid and Health at the Country and Local Level
John CruzattiAlfred-Weber-Institute for Economics, Heidelberg UniversityFaculty of Social Sciences and Humanities, ESPOL
Axel DreherAlfred-Weber-Institute for Economics, Heidelberg UniversityKOF Swiss Economic Institute CEPRGeorg-August University GoettingenCESifo
Johannes MatzatFaculty of Business and Economics, Georg-August University GoettingenAlfred-Weber-Institute for Economics, Heidelberg University
AIDDATAA Research Lab at William & Mary
The most recent version of this paper can be found at http://www.axel-dreher.de/Cruzatti_Dreher_Matzat_2020.pdf
Abstract We investigate whether and to what extent Chinese development finance affects infant mortality, combining 92 demographic and health surveys (DHS) for a maximum of 53 countries and almost 55,000 sub-national locations over the 2002-2014 period. We address causality by instrumenting aid with a set of interacted variables. Variation over time results from indicators that measure the availability of funding in a given year. Cross-sectional variation results from a sub-national region’s “probability to receive aid.” Controlled for this probability in tandem with fixed effects for country-years and provinces, the interactions of these variables form powerful and excludable instruments. Our results show that Chinese aid increases infant mortality at sub-national scales, but decreases mortality at the country-level. In several tests, we show that this stark contrast likely results from aid being fungible within recipient countries.
JEL codes: I15, F35
Keywords: Health Aid, Fungibility, Infant Mortality
Author Information
John Cruzatti Alfred-Weber-Institute for Economics, Heidelberg University Faculty of Social Sciences and Humanities, ESPOL [email protected]
Axel Dreher Alfred-Weber-Institute for Economics, Heidelberg University KOF Swiss Economic Institute CEPR Georg-August University Goettingen CESifo [email protected]
Johannes Matzat Faculty of Business and Economics, Georg-August University Goettingen Alfred-Weber-Institute for Economics, Heidelberg University [email protected]
The views expressed in AidData Working Papers are those of the authors and should not be attributed to AidData or funders of AidData’s work, nor do they necessarily reflect the views of any of the many institutions or individuals acknowledged here.
Acknowledgements The authors thank Roland Hodler and Paul Raschky for generously sharing their birth region data for this project, Lennart Kaplan and Lukas Wellner for helpful comments, Tobias Hellmundt and Riyoko Shibe for excellent research assistance, and Harrison Bardwell for proof-reading.
1

1 Introduction
Much has been written about foreign aid. According to its critics, donors allocate aid toensure privileged access to the recipients’ natural resources, create export markets for theirgoods, and reward strategic allies (Alesina and Dollar 2000, Dreher et al. 2009). Whether andto what extent aid increases recipient countries’ economic growth is highly debated (Galianiet al. 2016, Doucouliagos 2019). Economic growth depends however on a large numberof factors that are in turn affected by aid in different directions. The lack of robust evidenceis then perhaps unsurprising. What is more, in many countries the aid is geographicallyhighly concentrated. Even if aid affects outcomes in the regions it is given to, the effectsmight be insufficiently substantial to be measurable at the country-level. This observationhas led recent studies to focus on sub-national regions, investigating the effects of aid ondevelopment at the province or district level, or even finer sub-national scales (Dreher andLohmann 2015, Bitzer and Goeren 2018, Isaksson and Kotsadam 2018, Gehring et al. 2019,Maseland and Minasyan 2019). However, subnational regressions can be misleading if aiddisplaces other funds across space which is likely within but not across countries.
In this study, we focus on health-related outcomes, which are more tangible than overallmeasures of development, such as economic growth. We combine the advantages of sub-national data with those of country-level analysis, comparing results at different levels ofaggregation.1 Such comparison allows us to to uncover indirect benefits from aid to areasnot directly targeted by it. Specifically, we explore the effects of Chinese developmentfinance on the probability that a newborn baby will die before it reaches the age of one—the so-called infant mortality rate.2 China is the only bilateral provider of developmentfinance for which geocoded data are available for a large number of recipient countries.Consequently, other bilateral donors or lenders cannot be included in this study. We howevercompare the effect of Chinese aid to those of the World Bank, for which geocoded data areequally available. This allows comparing two donors that the literature considers to affectdevelopment very differently—one perceived as being rather selfish and thus potentiallyharmful for recipient-country development, the other being a multilateral organization withmuch-appraised standards for allocating its aid (e.g., Gehring et al. 2019). We expect China’s
1We are the first to investigate the causal effect of aid on health at the sub-national level for a large number ofcountries spreading across different continents. Sub-national studies we are aware of focus on infant mortality inNigeria (Kotsadam et al. 2018) and Côte d’Ivoire (Wayoro and Ndikumana 2019), health outcomes and perceivedhealthcare quality in Malawi (De and Becker 2015, Marty et al. 2017), and the disease burden and severity inUganda (Odokonyero et al. 2018). Most closely related to this paper is Martorano et al. (2020) who investigatethe effect of Chinese aid on household welfare, focusing on 13 countries in Sub-Sahara Africa, and report positivecorrelations between Chinese aid and lower infant mortality in a difference-in-differences framework. Greßer andStadelmann (2019) provide conditional correlations between the sub-national presence of World Bank projectsand health-related outcomes in a sample of almost 40 countries. They find a positive correlation between projectsand health quality. A large number of papers investigates the correlation between aid and health at the country-level, with mixed results (e.g., Williamson 2008, Chauvet et al. 2009, Sonntag 2010, Dietrich 2011, Nunnenkampand Öhler 2011, Wilson 2011, Doucouliagos et al. 2019, and Kaplan et al. 2019).
2We use the terms “development finance” and “aid” for Official Development Assistance (ODA) and OtherOfficial Finance (OOF) alike. During the time of our study, ODA was defined as financial flows that mainly aim atpromoting the welfare and development of the recipients and have a grant element of at least 25 percent. OOFare official transactions that do not meet at least one of these criteria.
2

non-interference and “on-demand” policy to make its aid particularly fungible: To the extentthat China responds to recipients’ requests for aid without any policies in place that wouldensure the aid is additional, recipient governments can easily use it to finance projects itwould have funded anyway. The World Bank, to the contrary, has policies in place that aimto ensure the additionality of its aid, carefully monitoring the use of its funds (Dreher et al.2020).
According to Dijkstra and White (2003, p. 468), fungibility is “the idea that aid pays not forthe items which it is accounted for but for the marginal expenditure it makes possible."3
Chinese aid might replace government expenditures or other donors’ aid in two ways.4
First, Chinese aid might finance the exact same project that the recipient would have builtabsent the aid. The recipient could use the funds that are now available in its budget either tofinance something entirely different, such as military expenditures, or—to the extent that theaid creates leeway in budgets related to health expenditures only—rather a similar project,in the same geographic region or elsewhere. Second, China might fund a project similarto but different from what the recipient government or other donors would have financedwithout China’s support. The recipient government might then prefer to not implement arelated project at all, or implement it in a different geographic area. This would prevent thefinancing of two similar projects, in one location, at the same time. The project with a focusdifferent from those of the government is likely less effective in achieving the recipient’sgoals and would thus make the aid appear less effective than the identical project at regionalscales. This is because outcomes would be more likely to improve in regions that do notreceive Chinese aid compared to those that do. At the aggregate, country-level, effects of thegovernment-financed project would however register. Aid can therefore appear less effectiveat the subnational than at the country level.
As we explain in Section 2, our sub-national analyses test the effect of aid on infant mortalityreported by surveyed households in the area within a radius of 0.5◦, which amounts toroughly 55 km at the equator. To this end, we merge health indicators from 92 demographicand health (DHS) surveys on 53 developing countries over the 2002-2014 period andcombine them with a geocoded dataset on Chinese development finance. Our firstregressions follow the method of Isaksson and Kotsadam (2018), comparing the effect ofprojects that have disbursed aid (“active” projects for short) to those that have not (“inactive”projects). Comparing observations that have been selected as project-sites at a certainpoint in time to others that have been selected as well (but are as yet inactive) reduces theomitted-variables bias compared to a simple cross-sectional specification. We thus comparethe effect of active projects on outcomes relative to no-aid projects, to the effect of inactiveprojects on outcomes relative to no-aid projects in a region.
We refine our basic regressions to address causality further using an instrumental variable3As cited in Leiderer (2012, p. 4).4Hernandez (2017) shows that the World Bank competes with China by reducing the number of conditions
in its aid programs when China is also present in a country. Zeitz (2020) also shows that the World Bank isresponsive to Chinese competition.
3

(IV) approach, at the local and country levels. Our instruments for aid follow Dreher et al.(2019b, 2020) and Bluhm et al. (2020), who suggest yearly production volumes of physicalinputs into (tied) Chinese aid projects and the availability of foreign currency reserves asproxies for the availability of aid at any point in time. As they explain in some detail, Chinaproduces substantially more steel, cement and other production materials than it can usedomestically. It then uses them as inputs in its foreign aid projects. When production is high,the supply of aid becomes cheaper and should thus increase. Along similar lines, China usesits aid projects to earn interest on its foreign currency reserves. At times when the reservesare higher, the supply of aid should also be higher. We interact these indicators of supply withthe probability that a country or region receives smaller or larger shares of the year-to-yearfluctuations in aid. China could be expected to expand its aid program beyond its traditionalclients in years with abundant supply. Alternatively, regions that have received China’s aidin the past might receive more of it when supply is high. The latter effect has been shownto prevail in Dreher et al. (2019b, 2020), as seems to be the case for bilateral donors morebroadly (Nunn and Qian 2014, Dreher and Langlotz 2020).
The intuition of our IV regressions follows those of a difference-in-differences approach.We exploit the differential effect of China’s production volumes of physical inputs into aidprojects and the availability of foreign reserves on Chinese health projects in regions witha high probability of receiving aid compared to those with a low probability of receiving aid.The identifying assumption is that health outcomes in sub-national regions with differingprobabilities of receiving aid will not be affected differently by changes in the supply of theinputs into aid projects and reserves, other than via the impact of aid, controlled for theprobability to receive aid, country-year-fixed effects, province fixed effects (or country- andyear-fixed effects in the country-year setting), and the other variables in the model. In otherwords, as in any difference-in-differences setting, we rely on a treatment that is (conditionally)exogenous and the absence of different pre-trends across groups. Controlling for a set offixed effects that capture the direct effects of these variables, currency reserves and physicalinputs cannot be correlated with the error term and are indeed (conditionally) exogenousto aid. For different pre-trends to bias our coefficients, patterns across regions with a highcompared to a low probability of receiving aid would have to vary in tandem with year-to-yearchanges in these supply factors. We test this possibility below and find no evidence of such athreat to our identification strategy.
We report our main results in Section 3. They show that Chinese health aid increases infantmortality at the local level, but decreases mortality when focusing on countries instead. Weargue that these differences can best be explained by fungibility, and test this channel in anumber of ways. First, we show that the availability of clinics in the vicinity of Chinese aidprojects is not affected by aid, potentially indicating that recipient governments channel theaid to build facilities they would have financed themselves or with aid from other donorsabsent of Chinese support. Second, we find that the number of deliveries in health clinicsis reduced by aid. This can explain how fungibility renders the effect of aid at the sub-national level negative rather than just null. Aid-financed facilities specialize in areas that are
4
less effective in reducing infant mortality than the facilities replaced by aid, or alternatively,poach skilled staff from an existing health clinic. Service provision thus decreases both interms of quantity and quality (also see Deserranno et al. 2020). Third, and in line with thisinterpretation, we show that the number of births attended by skilled health staff is reducedby aid, while more births are attended by traditional health staff in turn. Fourth, the turnoverof health staff at existing clinics seems to increase, and average (educational) quality todecline as a consequence of aid. It thus seems that aid-financed projects poach staff fromexisting clinics. Fifth, the effect of aid on mortality is larger when governments are alreadyallocating relatively high levels of domestic public expenditures to the health sector prior tothe receipt of aid and when more aid has been received from Western donors. This is inline with the interpretation that fungibility should play a larger role when alternative sourcesof funding are available. More directly, at the local level, we also find that World Bank aidfor health is reduced as a consequence of Chinese support to the same localities. Sixth,we test whether results in a sector of particular interest to China—but not necessarily tothe recipients of its aid—improve as a consequence of aid, which would be the case if totalfunds focus more strongly on these sectors as a consequence of China’s interventions. In linewith this expectation, we find that Chinese health aid increases the probability that womentook anti-malaria pills during pregnancy (with the fight against malaria being a major goal ofChinese operations).5
We compare our results for China to those of World Bank aid (in Section 4) and test apotential alternative explanation for our results as well as their robustness (in Section 5).Given that the World Bank carefully chooses which projects to fund and monitors its projectsthroughout the implementation period, fungibility should be lower when compared to China.6
In line with this expectation, we do not find evidence in support of the hypothesis that theWorld Bank’s health-related aid is fungible. Just like Greßer and Stadelmann (2019) we evenfind that World Bank projects reduce infant mortality at local scales. Regarding an alternativeinterpretation of our results for China, a skeptical reader might think that the composition ofwomen giving birth is affected by aid. To the extent that aid differentially affects the numberof mothers from vulnerable populations who give birth, increases in mortality could be theconsequence of compositional differences. Our results indeed show that aid affects fertilityand mortality differentially for different age groups and ethnicity of the mothers. However,when we hold these differences constant, our key results remain unchanged.
On balance, our results thus seem to indicate that fungibility makes Chinese aid appear tobe negative at sub-national scales, while the overall effect of aid is positive. This observation
5The three-year plan resulting from the Forum on China-Africa Cooperation in 2009, for instance, statesin one out of the three points addressing public health: “The two sides noted with pleasure the deepeninghealth cooperation between the two sides. In particular, the hospitals and anti-malaria centers that Chinahas undertaken to build will play a positive role in improving the health care level and protecting people’shealth in African countries.” The ongoing Chinese anti-malaria campaigns have also not gone unnoticed in themedia. Reuters for example headlined in 2009 “China adopts “Malaria diplomacy” as part of Africa push” (seehttps://www.focac.org/eng/zywx_1/zywj/t626387.htm, https://www.reuters.com/article/idUSSP503140, accessedApril 17, 2020).
6Also see Van de Walle and Mu (2007).
5

bears important implications for policy-makers and research alike (which we discuss inthe concluding Section 6). To the extent that donors of aid are interested in outcomes in aparticular locality, the incentives of recipient governments to re-direct their own funds or aidfrom other donors to alternative sectors or areas would also need to be considered. Whilefungibility is a problem many donors seem duly aware of, it is usually understood in a wayless subtle than the mechanisms uncovered here. For example, Langlotz and Potrafke (2019)show that aid increases recipients’ military expenditures, implying that part of the aid is usedfor entirely different purposes. In this paper, we show that fungibility can be important, evenif aid is spent in the same sector but in different geographic areas, or in the same area in arelated sub-sector. Our study has implications for the recent trend in aid effectiveness-studiesthat focuses on small sub-national areas rather than broader regions or countries. While thesub-national analysis of data bears important advantages—in terms of a greater number ofobservations and more rigorous identification—the effects of aid reflected at this level mightturn out inconsequential or negative even if the aggregate effect is positive.
2 Data and Methods
The literature on the effectiveness of foreign aid below the country-level is scarce, mainlydue to a lack of geo-coded data on aid, relevant outcomes, and important control variables.In this study, we rely on data for more than 2,000 Chinese aid project locations in the years2000-2014 that have been geo-coded in Bluhm et al. (2020).7 For comparison, we also usedata on geo-coded World Bank projects that have been approved in the health sector overthe same period.8 Though not free from geopolitical interference of its donors (Dreher et al.2009, Dreher, Lang, and Richert 2019), the World Bank has rigorous standards for the exante evaluation of potential projects. In contrast, China gives substantial leeway to recipientcountries on where to spend its aid (Dreher et al. 2018, 2019a). These two donors are thusvery different in terms of how they exercise control over the recipients’ use of aid, allowing usto compare the effects of aid for a donor that is particularly lenient to one that is particularlystringent among the set of all official donors of aid (Gehring et al. 2019).9
We combine the data on aid with health indicators from 92 demographic and health surveysin a maximum of 53 countries over the 2002-2014 period. There are two main types ofDHS—Standard and Interim. Standard surveys cover between 5,000-38,000 households
7The number of projects made available by Dreher et al. (2020) is substantially larger (3,485 projects). Thisis because Bluhm et al. (2020) geo-code only those projects that were completed or in implementation duringthe period their sample covers, and due to the lack of sufficiently precise geographic information for some of theprojects.
8AidData (2017) provides these data in collaboration with the World Bank. We only include projects where theproject geo-coordinates (i) correspond to an exact location, or (ii) are within 25 km of an exact location (AidDataprecision codes 1-2). While data are available as of 1995, we restrict the sample to the 2000-2014 period toensure comparability.
9It is important to note, however, that China only grants a small share of its aid as budget aid and does notsimply finance any type of project proposed by recipient countries. Obviously, recipient governments couldotherwise simply ask China to support its military aid budget rather than asking it to finance a health-relatedproject, and use the additional budgetary leeway in support of the recipient’s preferred spending.
6

per country and are typically conducted every five years. Interim surveys include fewerindicators and smaller populations. Both DHS types are however nationally and regionallyrepresentative.10 Data are available for census enumeration areas, which can be villagesin rural regions or blocks of a city in urban spaces. On average, these enumeration areascover 0.38 (0.34) km2 for urban (rural) clusters and survey 25-30 households. The center ofeach enumeration area (“DHS cluster”) is geo-referenced but slightly displaced to protect theanonymity of the observed units (see ICF 2013 for details).
One key advantage of the DHS is the inclusion of information about children born prior to asurvey. This allows us to extract information about the health status of children also in yearswithout a DHS so that we can exploit the full range of years for which we have informationon aid flows. The resulting dataset includes yearly information on infant mortality for 103,008children per year, on average, over the 2002-2014 period, defined as the number of childrenthat died before they were 12 months old in 1,000 children born alive. The total number ofchildren included in our sample is around 1.3 million, and the average infant mortality rate is55. We make use of 54,946 different DHS clusters, with an average of 3.7 children coveredper cluster and year. 390,869 (344,934) births were registered in areas with active (inactive)Chinese projects. There are 2,161 Chinese aid project locations in our sample; 1,507 ofthese locations are within a radius of 55 km of at least one DHS cluster, and 217 of these arehealth-related projects.
For further tests, we also extract information on whether or not a birth was attended byskilled health personnel for 46,913 children per year, on average. Skilled health personnelis defined as a doctor, nurse, or midwife. We contrast the use of modern health services byexamining reliance on informal and local health services. To this end, we use data on thenumber of births attended by traditional birth attendants. To examine whether changes in thefrequency that skilled staff assists births are driven by developments in the private or publicsector, we look at the place of delivery. In particular, we examine the number of deliveriesthat took place at private and public health facilities respectively, per 1,000 deliveries. In thenext step, we examine whether health aid reduces the number of women that did not deliverat a hospital because the distance is too far. To broaden our analyses of the health sectorand capture potential interdependencies between different areas within the health sector,we examine whether the number of pregnant women (out of 1,000) who took antimalarialpills is affected by aid (the fight against Malaria is a major part of Chinese health-related aidinterventions). We also evaluate if the supply of hospitals is altered relying on a geocodeddataset covering almost 100,000 health facilities in Sub-Sahara Africa provided by Mainaet al. (2019).11 To test whether aid affects the composition of staff, we leverage surveys ofstaff in some of these facilities (from the Service Provision Assessments which are part of
10Our sample includes 90 Standard surveys, and two Interim surveys (Rwanda in 2008 and Egypt 2003), out ofthe available 296 Standard and 6 Interim surveys. We do not use the full sample either for the lack of sufficientlyprecise geo-referenced information on aid projects or the lack of geo-referenced information in DHS.
11The dataset is based on national lists which are compiled by the respective Ministry of Health and aresupposed to be a complete and authoritative listing of health facilities. They are most comprehensive for facilitiesmanaged by the government, non-governmental organizations, or faith-based organizations. To our knowledge itis the most comprehensive dataset covering geocoded health facilities in Sub-Sahara Africa available.
7

the DHS program). We make use of nine surveys covering seven countries, 8,514 healthfacilities and 260,616 workers.12 Specifically, we assess whether more or fewer people (outof those interviewed) were hired in a given year and whether they are more or less educatedthan other interviewed workers that were already employed in the previous year.
Absent any fungibility of aid, one would expect the effect of aid to be most visible when wefocus on small areas in the vicinity of aid disbursements. Aid is often highly concentratedon certain regions inside a country (Dreher and Lohmann 2015). Even if the aid is effectivethere, improved development outcomes might not visibly materialize at the country level. Weexpect the opposite to be true if aid is fully fungible. The scenario under which fungibilitywould make the local effect of aid appear most harmful is one in which the aid is fungiblebetween geographic areas, or over time within the same sector. For instance, assume thata recipient government intends to use its own funds to reduce infant mortality if no externaldonor is available.13 Assuming that the government would instead finance that project ata later point in time, or elsewhere, under a scenario where China finances an anti-malariaproject, the effect of Chinese aid on infant mortality would appear negative, given that anyregion is more likely to reduce infant mortality at a time they do not receive aid from Chinacompared to when they receive it.
We test the local effect of aid by focusing on small geographic areas within a radius of 0.5◦
around the center of each DHS cluster.
We estimate our basic regressions as follows:
Healthi,t = β1activei,t + β2inactivei,t + β3Xl,t + β4ηj ,t + β5γk + εi,t, (1)
where Healthi,t is the infant mortality rate in recipient cluster i in year t. Our sample coversall 54,946 sub-national clusters within a radius of 55 km for which we have geocoded dataon Chinese projects in the 2002-2014 period.14 Variation in the availability of aid withinDHS clusters over time is insufficient to allow the inclusion of cluster-fixed effects. Wehowever include fixed effects for country-years ηj ,t and ADM2 regions (such as districts andmunicipalities) γk. We cluster standard errors at the ADM2-year level (εi,t in equation (1)represents the error term). All regressions use cluster-weights as recommended by DHS.
Rather than comparing clusters that received aid to those that did not, we follow the approachin Isaksson and Kotsadam (2018) and compare health outcomes in clusters with projects thathave started disbursing aid (activei,t) before the birth year of the child to outcomes in clusters
12The seven countries are Bangladesh, Haiti, Kenya, Malawi, Namibia, Senegal and Tanzania.13Figure A.1 in the Appendix illustrates this graphically.14Focusing on the sub-national level addresses a further important problem of the aid effectiveness literature.
According to Ioannidis et al. (2017), only about one percent of the 1,779 estimates in the aid and growth literaturesurveyed have adequate statistical power (see also Doucouliagos 2019). Given the small number of observationsavailable at the country-year level, there is nothing that researchers can do to increase power. Focusing on thesub-national level—and the substantially larger number of observations available there—thus is an important stepforward in this literature.
8

that also received projects during the sample period, but that have not started to disbursebefore the child was born (inactivei,t).15 In our sample, 25 percent of the observations referto enumeration areas that are located within 55 km of an active Chinese project, while 21percent refers to projects where the implementation period has not yet started. Rather thancomparing cluster regions that have been selected as project-sites to others that have not,we thus exclusively compare health outcomes in regions that have been selected as projectsites, but at different points in time. We expect this to reduce the importance of omittedvariables bias to a considerable extent.
In order to estimate the effect of aid, we test whether β1 is significantly different from β2 inequation (1) above, in addition to testing whether any of the two is significantly different fromzero. In order to code a cluster as active or inactive, we rely on the first aid project in eachcluster in our sample. This ignores the potential effect of earlier projects (on which we haveno data). Regions with active aid projects earlier in the sample period might be more likely tohave received projects in the recent past compared to regions that receive a project at a laterpoint in time. The effect of active projects that we measure is thus not necessarily the effectof the specific projects in our sample, but might to some extent reflect the effects of earlierprojects as well.16
To further reduce the importance of omitted variables bias, we control for a number ofvariables at the cluster level, included in the vector Xl,t. We include variables that we expectto be correlated with health outcomes and the probability to receive an aid project in aparticular year, mostly taken from the DHS geospatial covariates dataset (Mayala et al. 2018):an index variable ranging from zero to one (with one referring to extremely urban, and zeroto extremely rural), indicating the proportion of built-up infrastructure nearby; a categoricalvariable of the predominant mode of settlement in the region (“SMOD population”), whichdistinguishes between rural, urban, or urban center; an indicator of a region’s averageslope (measured in degrees, where one degree roughly equals 111 km); rainfall (in metersper location and year); travel time to the next larger settlement of 50,000 people or more(measured in days); a vegetation index measuring the density of green leaves (between zeroand one with larger values indicating denser vegetation); and the logarithm of the numberof people living within the 2 km (urban) or 10 km (rural) buffer surrounding the DHS surveycluster location.17 We control for distance to (i) the nearest water body, (ii) the nearest areaprotected by the United Nations if any, and (iii) the border of the nearest neighboring country
15Isaksson and Kotsadam (2018) make use of this approach to show that Chinese aid in Africa fuelscorruption. Kotsadam and Tolonen (2016) use the same approach to investigate the effect of natural resourceson gender inequality in Africa. We also tried to make use of data for children born to the same mothers, but hadinsufficient data on projects nearby to allow us controlling for mother fixed effects.
16Just like Isaksson and Kotsadam (2018) we test robustness along several dimensions. First, we estimateproject-fixed effects regressions for the reduced sample that we have information for health outcomes before andafter a project started to be implemented. Second, we control for the duration of active projects and the time untilan inactive project becomes active (expecting the former to have a positive effect on outcomes, and the latter tobe insignificant). We also test whether the results remain robust when we code projects as inactive once they arecompleted, and when we focus on projects that have been active in the five years prior to an interview.
17The data were generated by the Center for International Earth Science Information Network of ColumbiaUniversity in 2016. They have a 1 km by 1 km spatial resolution for the years 2000, 2005, 2010, and 2015; welinearly interpolate the years in between.
9

(all measured in kilometers).18 All time-varying variables are lagged by one year.19
Our second set of sub-national regressions focuses on the number of projects a clusterregion receives rather than the binary indicator.20 The second stage of our 2SLS regressionsis:
Healthi,t = β1Aidi,t−2 + β2pi + β3Popl,t−1 + β4ηj ,t + β5γk + εi,t. (2)
The aid effectiveness literature typically uses disbursements of aid rather than commitments,given that aid can only register impacts if it has been disbursed. Such data are howeverunavailable for China, so we rely on projects committed.21 In our main specifications, welag aid by two years following previous work (e.g., Dreher et al. 2020). One might expectaid to take longer to potentially affect outcomes, given that commitments need some timeto disburse. However, while this might hold true for Western donors, Chinese aid typicallydisburses quickly, so that we do not add further lags in our main specifications (e.g., Dreheret al. 2019a,b). Given that the appropriateness of these lags is largely an empirical question,we however test different timings in further specifications.22 In addition to focusing on healthaid, we also investigate the totality of aid projects. Such aid might be less likely to affecthealth outcomes. On the other hand, to the extent that aid is fungible initial labels might notmatter much. What is more, aid given to areas other than health might easily affect healthoutcomes as well.23
Of course, aid is likely to be endogenous to health outcomes. One likely source ofendogeneity is reverse causation in which recipient economic features influence theallocation of aid. On the one hand, China might provide more aid to poorer regions. On the
18A number of these variables—the urban areas indicator, travel time, and all distance data—do not vary overtime. Others are not available for every year. Data for population count, mean temperature and the vegetationindex therefore refer to the year 2000; data for slope are from 1996. Precipitation, aridity, and mean temperaturerefers to the year of the respective DHS. Note that we do not include data derived from the household level,such as education or wealth, as these are likely to be affected by aid as well (Martorano et al. 2020). AppendixB reports the exact definitions of all variables and their sources. Appendix C shows descriptive statistics.
19In tests for robustness, we also control for luminosity as an indicator of development and a binary indicatorthat is one when the head of government was born in grid-cell i. Controlling for development is crucial andproblematic at the same time. According to Bruederle and Hodler (2018), nightlight and health indicators arecorrelated at the local level. Omitting nightlight, our coefficient for aid in the OLS regressions might just capturean effect of aid on development more broadly. On the other hand, luminosity might be a transmission channel bywhich aid affects health. Hodler and Raschky (2014) show that leaders favor their birth regions, leading to betterdevelopment. Dreher et al. (2019a) show that one channel for such favoritism can be Chinese foreign aid. Wetherefore do not include these variables in the main regressions. When we include their lagged values our resultsare however robust.
20Note however that in most cases sub-national regions receive just one health-related project at any point intime. Using a binary variable that indicates whether or not a new project has been committed in a year instead ofproject numbers does not change our results.
21One might think of using commitment amounts rather than project numbers. However, 43 percent of thehealth projects in our sample have no data on the amount of aid. Therefore, we prefer to focus on projectnumbers but report results using amounts in tests for robustness below.
22In line with Dreher and Lohmann (2015) and Galiani et al. (2016), we below also average aid projects overthree years to test robustness.
23This also comes with the advantage of a much-increased number of aid locations that we can exploit in theanalyses.
10

other, donors might prefer to channel more aid to wealthy regions if these recipients providemore attractive commercial opportunities (Frey and Schneider 1986, Dreher et al. 2019a)or might want to avoid difficult geographic regions.24 It should also be noted that a largenumber of variables that are excluded from our models are potentially correlated with aid aswell as with our health indicators, introducing omitted variables bias. To address the potentialendogeneity of aid, we employ an instrumental-variables strategy.
Our proxy for the availability of Chinese aid in a year follows Dreher et al. (2019b), Bluhmet al. (2020) and Dreher et al. (2020). Dreher et al. (2019b) introduce (logged) annualChinese steel production as part of an instrument for Chinese aid. They argue that Chineseofficials are rewarded for producing as much steel as possible, resulting in production that isin excess of domestic needs. Parts of the excess supply is then shipped abroad as exports,foreign direct investment, or aid. The larger the volume of steel available in a year, thecheaper are additional Chinese aid projects using this material, consequently increasingthe supply of aid. Countries with established aid relationships are then expected to receivea larger chunk of this aid, all else equal. Since Dreher et al. (2019b) have first introducedthis instrument in 2016, a number of follow-up studies have used it, including Brazys andVadlamannati (2018), Gehring et al. (2019), Humphrey and Michaelowa (2019), and Zeitz(2020). The instrument was further refined in Bluhm et al. (2020). Rather than just usingChina’s production of steel, they suggest focusing on several additional factors that areimportant inputs for Chinese aid projects: timber, glass, aluminum, and cement. Given thatthe production of these materials trends over time, Bluhm et al. (2020) de-trend them ratherthan only relying on country-year fixed effects to absorb the trend. They then extract the firstprincipal factor of the five de-trended (logged) input factors and interact it with the number ofyears each region has received positive amounts of Chinese aid over the sample period. Theresulting product is our first instrument for Chinese aid.
Our second instrument is introduced in Dreher et al. (2020). As they point out, a key reasonfor China to grant non-concessional, dollar-denominated loans is the possibility to earninterest rates above what would be possible domestically. At the same time, concessionalprojects should become more easily available as well. This is because the income effect ofcheaper aid provision should make the availability of both types of aid more likely (thougha substitution effect would work in favor of non-concessional projects).25 In years in whichChina’s reserves of foreign currency are high, Dreher et al. (2020) therefore expect (andshow) the supply of aid to increase. Their instrument is then the interaction of changes inChina’s net currency reserves and the location-specific probability to receive Chinese aid.In this study, the instruments are the interactions of the two indicators for Chinese aid whichvary over time but not between sub-national regions or countries (Inputt−1, Reservest−1),
24Empirical research on Chinese aid allocation demonstrates a strong, negative correlation between ChineseODA and the per-capita income of recipient countries (Dreher and Fuchs 2015, Dreher et al. 2019a). However,Chinese OOF (in Africa) tends to favor creditworthy countries (with higher loan repayment capacity) and countriesthat import more from China (Dreher et al. 2019a). Cervellati et al. (2020) show that Chinese (infrastructure)projects are less likely to be implemented in areas with higher risks of malaria.
25To the extent that part of the materials used in a project are purchased in international markets, theavailability of reserves makes such inputs appear cheaper as well.
11
and the probability of receiving aid from China, pi, which varies across recipient locations butnot over time. We calculate the probability of receiving aid as the share of years in the 2000-2014 period a region has received positive amounts of aid.26 More precisely, we define theprobability of receiving aid from China as pi = 1
15
∑15(y=1)
p(i,t), where pi,t is a binary variablethat equals one when recipient location i received a (health) project from China in year t. Thefirst-stage regression is:
Aidi,t−2 = β1Inputt−3 ∗ pi + β2Reservest−3 ∗ pi + β3pi + β4Popl,t−1 + β5ηjt + β6γk + µi,t. (3)
In our IV regressions we control for (log) population, Popl,t−1, in a cluster l but omit the othercontrol variables. While their inclusion would increase the efficiency of the estimator, theyare also potentially correlated with aid and health and therefore introduce endogeneity to theestimates. Given that our identification strategy does not require their inclusion, we estimateour main regressions without them (but test robustness to their inclusion below). Also notethat we control for the cluster-specific probability pi to receive health projects in the first andsecond stages of the regressions.27 As before, we cluster standard errors at the ADM2-yearlevel and include country-year- and ADM2-fixed effects. Our regressions at the country-levelare in analogy, with the probability to receive aid and the other variables measured at thecountry-level, and fixed effects for years and countries instead. Given that the probabilityof receiving aid does not vary for a country over time, it is captured by the fixed effects. Wecluster standard errors at the country-level there.
One might think that the Local Average Treatment Effect (LATE) we estimate with physicalinputs into aid projects would not well predict projects in the health sector. However, almostall of the larger health projects in our sample involve the construction of hospitals and otherhealth facilities. These projects rely heavily on Chinese raw materials (and workers).28 Whatis more, the abundance of physical aid inputs arguably also increases the supply of aidprojects that are unrelated to such inputs. This is the case if the income effect of cheaper aidprovision exceeds the substitution effect away from the (relatively more expensive) projectsthat do not require physical inputs in years in which such inputs are more easily available(Dreher et al. 2020). Given that China’s aid responds to recipient requests for aid projects,and recipients have no reason to alter the composition of their requests in response toChinese production of raw materials, we consider it likely that all types of aid projects aremore easily available in years the provision of aid becomes cheaper. We also have no reasonto assume that projects financed due to the easy availability of reserves differ fundamentallyfrom projects financed independently of reserve availability. While we use both instrumentsjointly in our main regressions, we test robustness to including them individually.29
26This directly follows the analyses in Nunn and Qian (2014), Bluhm et al. (2020), Dreher and Langlotz (2020),and Dreher et al. (2019b, 2020). Also see Werker et al. (2009).
27This variable is however omitted from the OLS regressions that we also show below.28For details, see Dreher et al. (2020).29We also tested an alternative instrument that includes China’s aid budget as part of the interacted IV (Temple
12

One might also be concerned that our instruments violate the exclusion restriction becausethe probability of receiving aid may directly affect population health. However, our second-stage regressions control for the probability of receiving aid itself. China’s aid inputs arecaptured through the inclusion of country-year-fixed effects (or country- and year-fixed effectsin the country-level setting). Controlling for country-year-fixed effects, these variables cannotbe correlated with the error term and are thus (conditionally) exogenous to aid. Given that wecontrol for the probability of receiving aid, its interaction with an exogenous variable results inan exogenous instrument under the assumption of parallel trends before the intervention (Bunand Harrison 2018, Nizalova and Murtazashvili 2016).30 The intuition of this approach is thatof a difference-in-differences regression, where we investigate a differential effect of the easeof access to aid projects in regions with a high compared to a low probability of receiving aid.The identifying assumption is that health outcomes in regions with differing probabilities ofreceiving aid will not be affected differently by changes in China’s production of aid inputsand the availability of reserves, other than via the impact of aid, controlling for the probabilityto receive aid and the country-year-fixed effects. In other words, as in any difference-in-differences setting, we rely on an (conditionally) exogenous treatment and the absence ofdifferent pre-trends across groups. In order for different pre-trends to bias our estimates,trends across regions with a high probability compared to a low probability of receiving aidwould have to vary in tandem with the year-to-year changes in China’s production of rawmaterials and reserve availability.
Following Christian and Barrett (2017), we plot the variation in Chinese aid inputs andcurrency reserves in concert with the variation in the average number of new aid projectsworld-wide and the infant mortality rate for two different groups that are defined accordingto the median of the probability to receive aid (given that any aid was received). Figure 1plots this graph. The results give little reason to believe that the parallel trends assumptionis violated in our case. More precisely, the probability-specific trends in infant mortality seemrather parallel across the regular recipients (those with a probability of receiving aid that isabove the median) and the irregular recipients (those with a probability of receiving aid that isbelow the median). There is also no obvious non-linear trend in regular recipients comparedto irregular recipients that are similar in aid and mortality.
The excludability of our interacted instrument would be violated if changes in China’s physicalinputs into aid projects or reserves availability would affect sub-national health outcomesdifferentially in regions with a high probability of receiving aid compared to regions with alow probability of receiving aid for reasons unrelated to aid. Reserves and input productionare arguably correlated with a large number of other variables, and some of them mightdifferentially affect health in regions that are frequent or infrequent recipients of aid. Most
and Van de Sijpe 2017, Dreher et al. 2020). However, first-stage statistics are very low in the country-levelanalyses, so we do not report these results.
30Also see Goldsmith-Pinkham et al. (2020). As Bluhm et al. (2018) point out, identification in our setting canbe purely based on exogenous variation in the time-series shocks, as shown by Borusyak et al. (2018), to theextent that the covariance between the time-varying components of the instruments and a weighted average ofthe within location variation over time in unobserved factors that also affect the dependent variables approacheszero in large samples.
13

plausibly, the availability of reserves could be correlated with the worldwide business cycle.Potentially, frequent recipients of Chinese aid are also more severely affected by recessions.This could imply that any differential effects of aid on health that we observe result fromthe world’s business cycle rather than aid. Chinese aid inputs could also be correlated withChina’s exports and foreign direct investment, and the probability of receiving aid might becorrelated with the probability to trade or receive investments. To address these concerns, wecontrol for yearly worldwide GDP growth as well as Chinese FDI or exports to a country—allinteracted with the probability to receive aid—in robustness tests below.
3 Results
Table 1 shows the main results of how Chinese (health) aid affects infant mortality. Accordingto the difference-in-differences results of column 1, infant mortality is lower in regions withactive Chinese health projects, on average, though with an insignificant coefficient. However,infant mortality is also lower in regions with inactive projects, pointing to selection bias withrespect to regions that are not selected to receive projects at all. Regions with an activehealth aid project experience lower infant mortality compared to regions without projects—the same, however, holds for regions with inactive projects. As can be seen at the bottomof the table, while the coefficient is larger for inactive projects compared to active ones, thedifference between the two is not statistically significant at conventional levels.
In column 2, we turn to the (lagged) number of Chinese health projects committed ratherthan the binary indicators. The OLS results in Panel A show that the (conditional) correlationbetween health aid and infant mortality is positive and significant. Panel B turns to ourinstrumental variables results. As can be seen, the coefficient of aid stays positive andsignificant. The coefficient implies that an additional health project increases the infantmortality rate in regions receiving it by more than nine children in 1,000 children born alive,at the five-percent level of significance. The first-stage F-statistic (shown at the bottom of thetable) indicates the power of our instruments.31
Columns 3 and 4 turn to the country-level for comparison, including all projects that can beattributed to a sub-national location to facilitate comparability. Focusing on all countries withavailable data, the results of column 3 show that Chinese health aid reduces infant mortalityat the country-level, at the one-percent level, and with a coefficient that exceeds that obtainedat local scales by more than 50 percent in magnitude. To rule out that these contrastingresults arise from differences in the countries and projects included in the local and country-level samples, we replicate the analysis focusing on those countries and projects that areincluded in the sub-national analysis of column 2. Results remain similar (see column 4).Specifically, we find that an additional aid project from China reduces infant mortality by about
31These results stand to some extent in contrast to those of Martorano et al. (2020), who find that Chinese aidimproves household health, wealth and education levels. They focus on only 13 countries in Sub-Sahara Africaand do not employ an instrumental variable though, limiting comparability.
14

10 children for every 1,000 live births.32
In columns 5 to 8, we replicate the analyses focusing on all aid from China rather than justhealth aid. To the extent that better infrastructure makes hospitals more accessible or bettereducation improves the quality of health staff, aid broadly is the better measure to capturethe effects of aid on health. When aid is fungible not just within but also between sectors,focusing on all aid is preferable to investigating the effects of specific types of aid, as thelabels given to aid would then be irrelevant. If fungibility is limited, to the contrary, focusingon all aid rather than health aid could be expected to decrease the magnitude and precisionof our estimates. The results are overall similar, the exception being an insignificant (butpositive) coefficient in the sub-national 2SLS regression of column 6. All three coefficientsare smaller in magnitude, in line with an environment of limited fungibility across sectors.
The stark differences in results we obtain at the local- compared to the country-level canpotentially be explained with aid being fungible within the health sector. The previousliterature is mixed in this regard. For example, Van de Sijpe (2013) finds that health aid isfungible to a limited degree, while Dykstra et al. (2019) find fungibility to be substantial. Inthe context of our paper, fungibility has a number of observable implications. Some refer tohealth outcomes, others to inputs. In the following tables, we test several such implications,focusing on health aid to reduce clutter. However, we would like to stress from the outset thatthe results we obtain are overall similar for all aid from China.33
Table 2 tests potential transmission channels, focusing on our local-level 2SLS estimates.We investigate the effect of aid on the number of births that are attended by (i) skilled or (ii)traditional health staff. To the extent that aid-financed projects focus on areas less directlyrelated to infant mortality and recipient governments or other donors provide fewer services inreturn to Chinese largesse, fewer births should be attended by skilled health staff. We wouldthen expect births to be attended by traditional birth attendants instead (which are less likelyto be poached or replaced by Chinese aid projects). We further investigate how deliveriesdevelop due to aid at public hospitals compared to private hospitals. Again we would expectfungibility to reduce the number of deliveries in public hospitals, but not necessarily in privateones. This is because private hospitals, on average, pay higher wages compared to publicones (McCoy et al. 2008). What is more, they are arguably less likely to withdraw theirservices from a certain area as a consequence of foreign aid, given that the aid is grantedon the governments’ request and thus in those areas the governments would likely haveprioritized their own spending too. We further explore whether fewer births might have beendelivered in hospitals because respondents to the DHS surveys in our sample consider themtoo far.34 In concert, these tests of availability and uptake thus provide evidence on whetherthe availability of hospitals is affected by aid, or rather that aid affects the uptake of servicesfor a given supply of hospitals, which would suggest that donor-financed hospitals substitute
32Note that while the first-stage F-statistic is substantially lower compared to the sub-national analysis, the testhas sufficient power in the smaller, more comparable, sample.
33Detailed results are available on request.34The exact question we rely on is “Q: Why didn’t you deliver in a health facility? R: TOO FAR.”
15
government-financed ones, potentially specializing on the provision of different services.We also test this suggestion more closely by investigating whether aid improves outcomesrelated to malaria, which is a focus area of Chinese health-related aid.35 Finally, we focuson the number of new hires at existing hospitals, as well as the staff’s level of education. Tothe extent that poaching is relevant for our results, staff turnover should increase, while thequality of staff at existing hospitals should decline, with the most qualified staff being poachedfirst.
Column 1 of Table 2 shows that an additional Chinese health project reduces the numberof births attended by skilled health staff by almost 70 in 1,000 live births delivered, at theone-percent level of significance. In column 2 we focus on the number of births attendedby traditional health workers. As can be seen, the coefficient is positive and substantial(indicating that an additional project increases the number of births attended by almost 133in 1,000 live births delivered).
Columns 3 and 4 test how China’s health aid affects the availability of public and privatehealth clinics, using a sub-set of the data that allows testing whether private and publichealth facilities settle close to Chinese aid projects. Columns 5 and 6 focus on the numberof deliveries at public and private clinics; column 7 tests whether having a Chinese projectnearby affects survey respondents’ perception of how distant they are to a health facility(i.e., whether they respond they did not deliver at a hospital because they consider it toofar). According to the results, the availability of clinics is not affected by aid. On the contrary,Chinese aid reduces the number of deliveries at public health clinics, at the one-percent levelof significance. While it also reduces the number of deliveries at private health clinics, thecoefficient is less than one-third of those for public clinics (and the difference is statisticallysignificant, with a p-value of 0.006). Taking these results at face value, they are in line withthe suggestion that the services provided in aid-financed clinics differ from government-financed ones: Total availability of hospitals does neither increase nor decrease as aconsequence of aid, while uptake for delivery declines and hospitals are perceived to bemore distant. We test the potential shift in focus within the health sector as a consequence ofaid more specifically in column 8, where we find that aid increases the probability that womentook anti-malaria pills during pregnancy, at the one-percent level of significance. Though theincreased use of anti-malaria pills should reduce rather than increase infant-mortality, thispositive effect seems to be dominated by shifts in other services provided by hospitals.36
We conclude this table investigating staff turnover and educational quality. Columns 9and 10 focus on staff in health facilities close to Chinese health-aid projects. Accordingto the results, health facilities hired significantly more workers after health aid projects
35Appendix D shows that malaria-related interventions are the bulk of Chinese health projects among projectswith a specified purpose. Also see Anshan (2011).
36As can be seen in Appendix D, the fight against Malaria stands first among China’s health projects targetedat specific diseases, with the second-largest share—the fight against HIV/AIDS, Ebola and Tuberculosiscombined—receiving less than three percent of the projects. Unsurprisingly, we consequently do not find asignificant effect of China’s projects on the number of people ever tested for HIV/AIDS (specific results availableon request).
16

were committed nearby. This could either indicate that the aid was used to expand existingfacilities that, in turn, require more workers or that existing workers are replaced, potentiallyas a consequence of poaching. According to column 10, the average years of educationof interviewed staff already employed in the facility declines by 1.1 years due to staff withfewer years of education being hired as a consequence of aid committed two years earlier.In concert, these results thus suggest that new staff is hired as a result of aid, replacing staffpoached by aid-financed projects.37
In summary—while not providing bullet-proof evidence—the results of Table 2 are in line withthe fungibility-hypothesis. In Table 3 we investigate channels that we expect to facilitate thefungibility of aid. First, we expect fungibility to be more substantial if government expenditureson health are larger when aid is given. Larger expenditures give governments more leeway toreallocate resources, either from the health budget to other areas of government spendingor to alternative health projects in different areas of the country. In column 1 we thereforeinteract the number of Chinese health projects with the recipient government’s healthspending (relative to all government expenditures) a year before the aid project was received.While the level of health expenditures itself is captured by country-year fixed effects, we canstill test whether and to what extent larger health budgets make foreign aid less effectivein increasing the number of skilled health staff.38 As can be seen, the coefficient of theinteraction is negative and significant at the one-percent level. In tandem with the positivecoefficient of aid projects, its magnitude implies that the number of deliveries attended byskilled health staff increases with aid to a larger extent when health expenditure shares aresmaller.
Along similar lines, we would expect Chinese aid to be more fungible when recipientcountries receive more aid from all of its donors combined. Absent of Chinese funding, thevery same project might have received funding from another donor, with potentially differentialeffectiveness. We would ideally like to test whether Chinese aid projects crowd out aid fromother donors at the local level. Given that we do not have geocoded data for most otherdonors, we instead interact the number of Chinese health projects committed to a specificarea with the total health-related aid received from other donors in the previous year (relativeto GNI). Given that we have geocoded data for the World Bank we also directly test whetherChinese aid crowds out World Bank aid at the local level.39
The results show that the (negative) effect of Chinese health projects on the number of birthsassisted by skilled staff gets stronger at times a recipient country received more aid from
37While this result is in line with fungibility, the alternative explanation that the aid is effective in increasing thesupply of hospital services so that more staff with fewer years of education are hired cannot be ruled out based onthese regressions alone. The previous regressions show however no evidence for this.
38We instrument aid and the interaction of aid and health expenditures with our previous instrument, as wellas the interaction of this instrument with health expenditures. We follow Nunn and Qian (2014) and include theinteraction of health expenditures interacted with the probability of receiving aid as an additional instrument.Results in the regression reported here are robust to excluding the interaction.
39The analysis thus also contributes to the literature investigating the extent to which donors engage incompetition to aid from China or others (see Mascarenhas and Sandler 2006, Humphrey and Michaelowa 2019,Asmus et al. 2020, Fuchs et al. 2020, and Zeitz 2020).
17

other donors (column 2). This is in line with the idea that Chinese aid is more likely to havereplaced a project from another donor if such aid was given in abundance, and the projectthat has been replaced by China was targeted at assisted births to a larger extent.40
Column 3 shows that there is no significant effect of Chinese health aid on World Bank healthaid two years after commitment. However, the coefficient is negative and significant at thefive-percent level one year after aid from China is committed (see column 4). It thus seemsthat the World Bank commits less aid to areas that received Chinese aid. To the extentthat World Bank projects are more effective in reducing infant mortality than Chinese aid (aquestion to which we turn to below), such fungibility can explain our key results in Table 1above.
4 Comparison to the World Bank
This section replicates the main analyses focusing on the World Bank. Our data consist of2,065 geo-coded World Bank health-related projects spreading over 51 recipient countriesthat have been approved over the 2002-2014 period.
Our instruments are similar to those for China. We proxy available liquidity with two separateindicators for the World Bank’s International Development Association (IDA) and theInternational Bank for Reconstruction and Development (IBRD). We proxy the availabilityof IDA aid in a specific location with the interaction of an indicator for the resources that theIDA has available for its lending and the regional probability to receive IDA aid. We obtainthe IDA’s “funding position” from Dreher et al. (2020), defined by the World Bank as “theextent to which IDA can commit to new financing of loans, grants and guarantees given itsfinancial position at any point in time and whether there are sufficient resources to meetundisbursed commitments of loans and grants” (IDA 2015: 24).41 This indicator is disclosedin the World Bank’s annual financial statements since 2008; we rely on Dreher et al.’s (2020)calculations for earlier years in our sample. In order to measure the availability of IBRDresources, Dreher et al. (2020) use its equity-to-loans ratio, which is reported in the IBRD’sannual financial statements. The equity-to-loans ratio is a measure of the IBRD’s “ability toissue loans without calling its callable capital” (Bulow 2002, p. 245). Our second instrumentfor World Bank projects is the interaction of IBRD liquidity with a region’s probability to receiveaid.
Note that it is not a priori obvious whether increases in liquidity increase World Bank lendingat the intensive or extensive margin. While previous work has shown that an increase in
40We use the interaction of Chinese aid projects and aid from other donors as a second instrument. We againfollow Nunn and Qian (2014) and include the interaction of aid from other donors interacted with the probability ofreceiving aid as an additional instrument. Results in the regression reported here are not robust to excluding theinteraction as an instrument however and should thus be taken with caution.
41The approach of Dreher et al. (2020) follows Lang (2020), who suggests the IMF’s liquidity ratio interactedwith the probability of a country to be under an IMF program as an instrument for IMF loans.
18
resources leads to larger aid volumes for existing recipients of bilateral aid (Dreher andLanglotz 2020), Lang (2020) finds that the International Monetary Fund uses the availabilityof additional resources to extend its lending beyond its traditional recipients. This also holdstrue for the World Bank in Dreher et al. (2020).42
We replicate our main regressions for the World Bank in Table 4, focusing on the numberof committed health projects in a particular cluster or country and year. As can be seen,results stand in some contrast to those obtained for China above. Column 1 shows that WorldBank aid reduces rather than increases infant mortality at the local level, with a first-stageF-statistic above 17 indicating the power of the instruments.43 When we turn to the country-level in column 2, the power of the instruments is considerably lower. While the coefficient ofaid is positive and marginally significant in the full sample of countries with data available, thefirst-stage F-statistic is below two. When we restrict the sample to those countries includedin the sub-national analysis, the coefficient of aid turns insignificant (though with a positivecoefficient, see column 3). In column 4 we make use of the additional years that geocodeddata are available for the World Bank—extending the sample to the 1997-2014 period—whichleads to a considerably higher first-stage F-statistic. The coefficient switches its sign and isclose in magnitude to those at sub-national scales, but imprecisely estimated. Either way, thenegative coefficient at the local level in concert with a positive or insignificant coefficient at thecountry-level does not provide evidence in line with the fungibility-hypothesis.
The further columns of Table 4 replicate the regressions of Table 2 for World Bank healthprojects. The results show that there is no significant effect of aid on the number of birthsattended by skilled staff. In contrast, the number of births attended by traditional health staffdecreases rather than increases as a consequence of aid. The availability of health facilitiesis not significantly affected by aid; however, uptake of public (but not private) hospitalsincreases with aid. There is no significant effect on women responding that they did notdeliver children in a health clinic because it is too far, and World Bank health aid reducesrather than increases the probability that women took anti-malaria pills during pregnancy.There is no significant effect of aid on the number of hires at health clinics, though—in linewith the result for China—average years of education of staff that has already been employedbefore the aid was committed declines. On balance, few of these results are as one wouldexpect in support of the fungibility hypothesis.
5 Alternative Explanation and Tests for Robustness
In Table 5 we return to Chinese health projects and investigate an alternative explanationfor our results. As one possibility, Chinese health projects might affect the composition of
42For approaches that mirror ours in instrumenting World Bank aid, see Gehring et al. (2019) and Jensen et al.(2019). See Figure A.2 in the Appendix for a graphical depiction of (potentially spurious) trends.
43Note however, that this result is less robust than the comparable result for China above. For example, whenwe lag aid by three rather than two years, the coefficient turns insignificant. The same holds when we focus onthe extended sample starting in 1995, for aid lagged by two as well as by three years.
19
mothers in our sample. To the extent that aid increases the probability that families with anex ante higher risk of infant mortality have more children, infant mortality would increase, onaverage. Columns 1-7 of Table 5 therefore test whether health projects affect the fertility ofmothers differentially according to their education, age, and (minority or majority) ethnicity.We find that Chinese health aid does not significantly affect the fertility of either educatedor uneducated mothers (defined as their highest educational level being above/below thelocation-specific median). On the contrary, we find that the age-composition of mothers isaffected by aid: While fertility of young and older women (those below 20 years and above29 years, respectively) remain unchanged, fertility by women aged between 20–29 yearssignificantly increases. We also find that aid increases the fertility of women belonging toan ethnic minority while it decreases those of women belonging to their location’s majorethnicity.44 While aid thus seems to change the composition of mothers, potentially affectinginfant mortality, on average, such changes in composition do not affect our results. Ascolumns 8 and 9 show, results are hardly changed when we control for the number of children(multiplied by 1,000) born to mothers belonging to the ethnic minority or to mothers aged 20–29, respectively. We can thus rule out that changes in the composition of mothers in terms ofeducation, age, or ethnicity are key drivers of our results.
We next test the timing after which aid commitments affect outcomes in some detail. Wefocus on the key regressions reported in columns 2–4 of Table 1, testing how aid affectsinfant mortality sub-nationally, at the country-level in the full sample, and at the country-levelin the sample restricted to those countries that are also included in the sub-national analysis(“DHS countries"). To reduce clutter, we only report the coefficient and standard errors of thevariable of interest, in concert with the number of countries and observations as well as first-stage F-statistics.
While the previous analysis considered the effect of aid two years after commitment, shorteror longer delays with which aid affects health-outcomes are well possible. Unfortunately,while we are confident that the exclusion restriction for our instrument holds with respectto variables unrelated to aid, the same does not hold for aid given from the same donorin different years. To some extent, aid is concentrated on the same regions for prolongedperiods of time. Given that our instruments are also correlated over time (for example, thecorrelation of our instruments with their values one year earlier exceeds 0.8 for both of them),the effect of aid in any year that we detect with our instrumental variables strategy can partlyalso reflect the effect of aid in earlier or future years. To rule this out, we ran regressionsthat included up to four lags and—as placebo variables—two leads of the aid variable,instrumented with the respective lags of our instruments. Unfortunately, the power of theinstruments is very low in these regressions, so we do not report them here.
Table 6 instead shows results of individual regressions, where we include one lag of aid at atime and instrument aid with our instrumental variables (lagged by one additional year). As
44A location’s major ethnicity is defined as the modal ethnicity of a DHS-cluster. On the political economy ofhealth aid allocation on sub-national scales see Widmer and Zurlinden (2019).
20
can be seen, our previous results hold in the year of commitment already. The magnitudeof the coefficients declines after the second year—corresponding to the lag structure in themain analyses of this paper. At sub-national scales, the effect of Chinese health aid turnsinsignificant commencing with the third lag. At the country-level, aid remains significant untilthe fourth lag in the smaller sample, and is significant for all lags in the larger sample. Giventhat aid projects and the instruments are correlated over time, and the lack of power in thefirst-stage does not allow us to include more than one aid variable at the same time, it ishowever not possible to differentiate the effects of different lags in a bullet-proof way. Forwhat it is worth, the final rows of Table 6 report results for the (instrumented) second lag,where we include different leads and lags of aid without instrumenting for them. Our resultsare again highly similar.
We conclude this section by testing the robustness of our key results along variousdimensions. First, we measure Chinese health aid as either (logged) commitment amountsor a binary project indicator rather than project numbers.45 Second, we report results usingour two instruments separately rather than jointly. Third, we average our data over three-year periods. Fourth, we focus on sub-national clusters within a 111 km-radius rather than55 km. Fifth, we control for all variables that we did also include in the basic regressions incolumn 1 of Table 1 above, but omitted from the instrumental variables regressions. Sixth,we examine—in three individual regressions for each test of robustness—whether our resultshold when we control for one of three variables, each interacted with the probability to receiveaid: world GDP growth, Chinese exports to a specific recipient country, and Chinese ForeignDirect Investment (FDI) to each recipient country. To the extent that our instruments arecorrelated with the world business cycle, Chinese exports or Chinese FDI, and at the sametime regions that receive more aid are more likely to be affected by shocks related to thebusiness cycle, trade, or FDI, our aid variable might reflect in part the effect of these variablesrather than aid itself. Controlling for these variables tests this possibility. We also aggregateall data at the ADM2-level, testing whether aid given to ADM2 regions—which are geographicunits of sizes in between the local and country areas we have so far focused on—affectsinfant mortality there. And finally, we test the effect of ODA and OOF (health-related) projectsseparately rather than including them in one variable.
Table 7 shows the results, again focusing on our three key specifications. As can be seen,our results are overall robust to these tests. Though some coefficients turn insignificant insome of the regressions (as one would expect when running a large number of them), allcombinations of regressions are in line with fungibility. That is, in cases the local effect of aidis significant in increasing infant mortality, effects at the country-level are either negative andsignificant or insignificant. At the same time, when we do not find a consistent effect of aidat local scales, aid is effective in reducing mortality at the country-level. Most importantly, wefind that the effect of aid on mortality persists when we control for other variables potentiallycorrelated with parts of our instruments—the world business cycle, or Chinese exportsand FDI. While this does not rule out that other omitted variables correlated with the input
45Note that we have added a value of one before taking logs in order to avoid losing values with zero aid.
21
factors into aid projects or changes in China’s foreign currency reserves differentially affecthealth outcomes in regions with different probabilities to receive aid, we do not expect suchvariables to be consequential for our results given that controlling for the most obviouscandidates has little impact.
Interestingly, the effect of aid at the ADM2 level is insignificant, thus being in between theresults we obtain at local and country levels. Finally, it seems that our results are driven byODA—i.e., aid in the strict sense—rather than OOF. Note however that the bulk of projects inthe health sector are coded as ODA so that the estimates for OOF rely on a small number ofobservations.46
6 Conclusions
Recent work in the aid effectiveness literature shifts the unit of analysis from the countryto sub-national areas such as provinces or districts or even small grids within these areas.Although this has the advantage of greater statistical power and could facilitate the detectionof local effects that are insufficiently strong to be recorded when countries are the unit ofanalysis, it can also make the aid seem less effective than it is. To the extent that aid isfungible within sectors, and donors finance projects that are less effective compared togovernment-funded projects they replace, aid can appear harmful at the local level.
In this paper, we have compared the effects of Chinese health aid at the local level withthose at the country level. According to our results, China’s projects increase infant mortalitylocally but reduce mortality at the level of countries. We explain this stark contrast with aidbeing fungible. In particular, we find that aid reduces the number of births attended by skilledstaff, while it increases the number of births attended by traditional staff. Though the numberof hospitals available is not affected by aid, aid reduces the number of deliveries in publichospitals by more than it does reduce them in private ones. At the same time, mothers aremore likely to perceive hospitals as too distant to deliver there as a consequence of aid. Wefind staff turnover at hospitals to increase and average years of education of pre-existingstaff to decline with aid. These findings are consistent with a setting where scarce domestichuman capital is poached from existing providers of these services, which are more effectivethan those replacing them (Deserranno et al. 2020). We also find evidence in line with shiftingpriorities resulting from aid, documented by increases in the probability that women took anti-malaria pills during pregnancy as a consequence of aid (with the fight against malaria being amajor goal of Chinese health operations).
These results bear important implications. First, we find that Chinese health aid, and its aidmore broadly, reduce infant mortality overall. In line with several earlier papers (e.g., Dreheret al. 2020) this adds further evidence against the claim that Chinese aid is unequivocally
46When we replicate these results for all OOF projects rather than just health-related ones the country-levelresults are significant at least at the ten-percent level, with negative coefficients.
22
harmful for its recipients (“Rogue Aid," for a discussion see, e.g., Isaksson and Kotsadam2018). Second, our results show that China’s aid does not bring its positive effects atthose localities it was delivered to. Quite the contrary, Chinese aid seems to increaseinfant mortality in the vicinity of aid projects. To the extent that China aims to add to localdevelopment in the areas it nominally supports it needs to rethink its non-interference policy,changing its aid allocation process in a way that is more similar to those of the World Bank(for which we did not find evidence in line with the fungibility hypothesis here). And finally,our results should remind researchers that the benefits of sub-national analysis have to beweighed carefully against their drawbacks. Ideally, questions of aid effectiveness should thusbe investigated at different levels of analysis, allowing for the possibility that fungibility at sub-national scales makes the aid appear more negative than it actually is.
23

References
AidData (2017). World Bank Geocoded Research Release Level1 v1.4.2 Geocoded Dataset.Williamsburg, VA and Washington, DC: AidData.
Alesina, A. and D. Dollar (2000). Who Gives Foreign Aid to Whom and Why? Journal of EconomicGrowth 5(1), 33–63.
Anshan, L. (2011). Chinese Medical Cooperation in Africa: With Special Emphasis on the MedicalTeams and Anti-Malaria Campaign. Discussion Paper 52, Nordiska Afrikainstitutet, Uppsala.
Asmus, G., V. Z. Eichenauer, A. Fuchs, and B. Parks (2020). China-India Aid Competition? AnAnalysis of Chinese and Indian Development Projects. Mimeo.
Bitzer, J. and E. Goeren (2018). Foreign Aid and Subnational Development: A Grid Cell Analysis.Working Papers V-407-18, University of Oldenburg, Department of Economics.
Bluhm, R., A. Dreher, A. Fuchs, B. C. Parks, A. Strange, and M. J. Tierney (2020). ConnectiveFinancing: Chinese Infrastructure Projects and the Diffusion of Economic Activity in DevelopingCountries. CEPR Discussion Paper, Centre for Economic Policy Research, London. Forthcoming.
Bluhm, R., M. Gassebner, S. Langlotz, and P. Schaudt (2018). Fueling Conflict? (De)Escalation andBilateral Aid. HiCN Working Paper 265, Institute of Development Studies, University of Sussex.
Borusyak, K., P. Hull, and X. Jaravel (2018). Quasi-experimental Shift-Share Research Designs.Working Paper 24997, National Bureau of Economic Research.
Brazys, S. R. and K. C. Vadlamannati (2018). Aid Curse with Chinese Characteristics? ChineseDevelopment Flows and Economic Reforms. GLOBUS Research Paper 5/2018, ARENA Centrefor European Studies, University of Oslo.
Bruederle, A. and R. Hodler (2018). Nighttime Lights as a Proxy for Human Development at the LocalLevel. PLOS ONE 13(9), e0202231.
Bulow, J. (2002). First World Governments and Third World Debt. Brookings Papers on EconomicActivity 2002(1), 229–255.
Bun, M. J. G. and T. D. Harrison (2018). OLS and IV Estimation of Regression Models IncludingEndogenous Interaction Terms. Econometric Reviews 38(7), 814–827.
Center for International Earth Science Information Network at Columbia University (2016). GriddedPopulation of the World, Version 4 (GPWv4): Population Count Adjusted to Match 2015 Revision ofUN WPP Country Totals. Accessed August 21, 2017. http://dx.doi.org/10.7927/H4SF2T42.
Cervellati, M., E. Esposito, U. Sunde, and S. Yuan (2020). Malaria and Chinese Economic Activities inAfrica. Mimeo.
Chauvet, L., F. Gubert, and S. Mesplé-Somps (2009). Are Remittances More Effective Than Aid toImprove Child Health? An Empirical Assessment Using Inter and Intra-Country Data. Document deTravail DT/2009-11, IRD DIAL, Paris.
Christian, P. J. and C. B. Barrett (2017). Revisiting the Effect of Food Aid on Conflict: A MethodologicalCaution. Policy Research Working Paper Series 8171, The World Bank.
Climate Hazards Group (2017). Climate Hazards Group InfraRed Precipitation with Station data 2.0.Accessed August 21, 2017. http://chg.geog.ucsb.edu/data/chirps/index.html.
De, R. and C. Becker (2015). The Foreign Aid Effectiveness Debate: Evidence from Malawi. AidDataWorking Paper 6, AidData at William & Mary, Williamsburg, VA.
Department of State’s Office of the Geographer (2014). Department of State Large-Scale International Boundary (LSIB). Via ESRI. Accessed August 21, 2017.http://www.arcgis.com/home/item.html?id=3e650cfe52b84bffacb86d028f1f0514.
Deserranno, E., A. Nansamba, and N. Qian (2020). Aid Crowd-Out: The Effect of NGOs onGovernment-Provided Public Services. NBER Working Paper 26928, National Bureau of EconomicResearch.
Didan, K. (2016). NASA MEaSUREs Vegetation Index and Phenology (VIP)Phenology EVI2 Yearly Global 0.05Deg CMG. Accessed August 21, 2017.https://doi.org/10.5067/measures/vip/vipphen_evi2.004.
Dietrich, S. (2011). The Politics of Public Health Aid: Why Corrupt Governments Have Incentives toImplement Aid Effectively. World Development 39(1), 55–63.
Dijkstra, G. and H. White (2003). Programme Aid and Development: Beyond Conditionality. London:Routledge.
Doucouliagos, H. (2019). The Politics of International Aid. In R. D. Congleton, B. Grofman, and
24

S. Voigt (Eds.), The Oxford Handbook of Public Choice, Volume 2, pp. 696–724. Oxford UniversityPress.
Doucouliagos, H., J. Hennessy, and D. Mallick (2019). Health Aid, Governance and Infant Mortality.IZA Discussion Papers 12166, Institute of Labor Economics (IZA).
Dreher, A. and A. Fuchs (2015). Rogue Aid? An Empirical Analysis of China’s Aid Allocation.Canadian Journal of Economics 48(3), 988–1023.
Dreher, A., A. Fuchs, R. Hodler, B. C. Parks, P. A. Raschky, and M. J. Tierney (2019a). AfricanLeaders and the Geography of China’s Foreign Assistance. Journal of DevelopmentEconomics 140, 44–71.
Dreher, A., A. Fuchs, R. Hodler, B. C. Parks, P. A. Raschky, and M. J. Tierney (2019b). Is Favoritisma Threat to Chinese Aid Effectiveness? A Subnational Analysis of Chinese Development Projects.AidData Working Paper 83, AidData at William & Mary, Williamsburg, VA.
Dreher, A., A. Fuchs, B. C. Parks, A. Strange, and M. J. Tierney (2020). Aid, China, and Growth:Evidence from a New Global Development Finance Dataset.
Dreher, A., V. Lang, B. P. Rosendorff, and J. R. Vreeland (2018). Buying Votes and InternationalOrganizations: The Dirty Work-Hypothesis. CEPR Discussion Paper 13290, Centre for EconomicPolicy Research, London.
Dreher, A., V. F. Lang, and K. Richert (2019). The Political Economy of International FinanceCorporation Lending. Journal of Development Economics 140, 242–254.
Dreher, A. and S. Langlotz (2020). Aid and Growth. New Evidence Using an Excludable Instrument.Canadian Journal of Economics, forthcoming.
Dreher, A. and S. Lohmann (2015). Aid and Growth at the Regional Level. Oxford Review of EconomicPolicy 31(3-4), 420–446.
Dreher, A., J.-E. Sturm, and J. R. Vreeland (2009). Development Aid and International Politics: DoesMembership on the UN Security Council Influence World Bank Decisions? Journal of DevelopmentEconomics 88(1), 1–18.
Dykstra, S., A. Glassman, C. Kenny, and J. Sandefur (2019). Regression Discontinuity Analysis ofGAVI’s Impact on Vaccination Rates. Journal of Development Economics 140, 12–25.
Earth Resources Observation and Science Center (1996). Global 30 arc-second elevation (gtopo30).Accessed August 21, 2017. https://lta.cr.usgs.gov/GTOPO30.
Frey, B. S. and F. Schneider (1986). Competing Models of International Lending Activity. Journal ofDevelopment Economics 20(2), 225–245.
Fuchs, A., S. Y. Kim, and A. M. Strange (2020). Competing for Aid Recipients? Donor Responses toChinese Development Finance. Mimeo.
Galiani, S., S. Knack, L. C. Xu, and B. Zou (2016). The Effect of Aid on Growth: Evidence from aQuasi-Experiment. Journal of Economic Growth 22(1), 1–33.
Gehring, K., L. C. Kaplan, and M. H. Wong (2019). China and the World Bank: How ContrastingDevelopment Approaches Affect the Stability of African States. AidData Working Paper 87, AidDataat William & Mary, Williamsburg, VA.
Goldsmith-Pinkham, P., I. Sorkin, and H. Swift (2020). Bartik Instruments: What, When, Why, andHow. American Economic Review (forthcoming).
Greßer, C. and D. Stadelmann (2019). Evaluating Water- and Health Related Development Projects:A Cross-Project and Micro-Based Approach. CREMA Working Paper Series 2019-06, Center forResearch in Economics, Management and the Arts (CREMA).
Hernandez, D. (2017). Are “New” Donors Challenging World Bank Conditionality? WorldDevelopment 96, 529–549.
Hodler, R. and P. A. Raschky (2014). Regional Favoritism. The Quarterly Journal ofEconomics 129(2), 995–1033.
Humphrey, C. and K. Michaelowa (2019). China in Africa: Competition for Traditional DevelopmentFinance Institutions? World Development 120, 15–28.
ICF (2004-2017). Demographic and Health Surveys (various) [Datasets]. Funded by USAID. Rockville,Maryland: ICF [Distributor].
ICF (2013). Incorporating Geographic Information into Demographic and Health Surveys: A FieldGuide to GPS Data Collection. Calverton, MD: ICF International.
Ioannidis, J. P. A., T. D. Stanley, and H. Doucouliagos (2017). The Power of Bias in EconomicsResearch. The Economic Journal 127 (605), F236–F265.
25
Isaksson, A.-S. and A. Kotsadam (2018). Chinese Aid and Local Corruption. Journal of PublicEconomics 159, 146–159.
Jensen, N. M., N. P. Johnston, C. Lee, and H. Sahin (2019). Crisis and Contract Breach: TheDomestic and International Determinants of Expropriation. Review of International Organizations,forthcoming.
Kaplan, L. C., J. Kuhnt, K. Richert, and S. Vollmer (2019). What Explains the Uptake of DevelopmentInterventions? Considering the Theory of Planned Behaviour. Discussion Paper 261, Georg-August-Universität Göttingen, Courant Research Centre—Poverty, Equity and Growth (CRC-PEG).
Kotsadam, A., G. Østby, S. A. Rustad, A. F. Tollefsen, and H. Urdal (2018). Development Aid andInfant Mortality. Micro-Level Evidence from Nigeria. World Development 105, 59–69.
Kotsadam, A. and A. Tolonen (2016). African Mining, Gender, and Local Employment. WorldDevelopment 83, 325–339.
Lang, V. F. (2020). The Economics of the Democratic Deficit: The Effect of IMF Programs onInequality. Mimeo, University of Zurich.
Langlotz, S. and N. Potrafke (2019). Does Development Aid Increase Military Expenditure? Journal ofComparative Economics 47 (3), 735–757.
Leiderer, S. (2012). Fungibility and the Choice of Aid Modalities: The Red Herring Revisited. WorkingPaper 2012/68, UNU-WIDER.
Maina, J., P. O. Ouma, P. M. Macharia, V. A. Alegana, B. Mitto, I. S. Fall, A. M. Noor, R. W. Snow, andE. A. Okiro (2019). A Spatial Database of Health Facilities Managed by the Public Health Sector inSub Saharan Africa. Scientific Data 6(1).
Martorano, B., L. Metzger, and M. Sanfilippo (2020). Chinese Development Assistance and HouseholdWelfare in Sub-Saharan Africa. World Development , forthcoming.
Marty, R., C. B. Dolan, M. Leu, and D. Runfola (2017). Taking the Health Aid Debate to theSubnational Level: The Impact and Allocation of Foreign Health Aid in Malawi. BMJ GlobalHealth 2(1), e000129.
Mascarenhas, R. and T. Sandler (2006). Do Donors Cooperatively Fund Foreign Aid? Review ofInternational Organizations 1(4), 337–357.
Maseland, R. and A. Minasyan (2019). Does Chinese Aid Undermine Good Governance? Universityof Groningen, mimeo.
Mayala, B., T. D. Fish, D. Eitelberg, and T. Dontamsetti (2018). The DHS Program GeospatialCovariate Datasets Manual (Second Edition). Rockville, MD: ICF International.
McCoy, D., S. Bennett, S. Witter, B. Pond, B. Baker, J. Gow, S. Chand, T. Ensor, and B. McPake(2008). Salaries and Incomes of Health Workers in Sub-Saharan Africa. The Lancet 371(9613),675–681.
National Bureau of Statistics of China (NBSC) (2019). Accessed October 12, 2019.http://www.stats.gov.cn/english/statisticaldata/yearlydata/YB1999e/m12e.htm.
National Centers for Environmental Information (2015). 2015 VIIRSNighttime Lights Annual Composite. Accessed August 21, 2017.https://ngdc.noaa.gov/eog/viirs/download_dnb_composites.html.
Nelson, A. (2008). Estimated Travel Time to the Nearest City of 50,000 or More People in year 2000.Accessed August 21, 2017. http://forobs.jrc.ec.europa.eu/products/gam/.
Nizalova, O. Y. and I. Murtazashvili (2016). Exogenous Treatment and Endogenous Factors: Vanishingof Omitted Variable Bias on the Interaction Term. Journal of Econometric Methods 5(1).
Nunn, N. and N. Qian (2014). US Food Aid and Civil Conflict. American Economic Review 104(6),1630–1666.
Nunnenkamp, P. and H. Öhler (2011). Throwing Foreign Aid at HIV/AIDS in Developing Countries:Missing the Target? World Development 39(10), 1704–1723.
Odokonyero, T., R. Marty, T. Muhumuza, A. T. Ijjo, and G. O. Moses (2018). The Impact of Aid onHealth Outcomes in Uganda. Health Economics 27 (4), 733–745.
OECD (2017). Creditor Reporting System. Accessed March 15, 2017.https://stats.oecd.org/DownloadFiles.aspx?DatasetCode=CRS1.
Pesaresi, M., D. Ehrlich, A. Florczyk, S. Freire, A. Julea, T. Kemper, P. Soille, and V. Syrris (2015).GHS built-up grid, derived from Landsat, multitemporal (1975, 1990, 2000, 2014). Accessed August21, 2017. http://data.europa.eu/89h/jrc-ghsl-ghs_built_ldsmt_globe_r2015b.
Pesaresi, M. and S. Freire (2016). GHS Settlement grid following the REGIO model 2014 in
26
application to GHSL Landsat and CIESIN GPW v4-multitemporal (1975-1990- 2000-2015).Accessed August 21, 2017. http://data.europa.eu/89h/jrc-ghslghs_smod_pop_globe_r2016a.
Sonntag, D. (2010). AIDS and Aid: A Public Good Approach. Springer Science Business Media.Temple, J. and N. Van de Sijpe (2017). Foreign Aid and Domestic Absorption. Journal of International
Economics 108, 431–443.UNEP-WCMC and IUCN (2017). Protected Planet: The World Database on Protected Areas (WDPA).
Accessed August 21, 2017. www.protectedplanet.net.United Nations Conference on Trade and Development (UNCTAD) (2017). World Investment Report
2017: Investment and the Digital Economy. United Nations, Geneva.United States Geological Survey (USGS) (2019). Aluminum statistics and information. Accessed
October 12, 2019. https://www.usgs.gov/centers/nmic/aluminum-statistics-and-information.Van de Sijpe, N. (2013). The Fungibility of Health Aid Reconsidered. Journal of Development
Studies 49(12), 1746–1754.Van de Walle, D. and R. Mu (2007). Fungibility and the Flypaper Effect of Project Aid: Micro-Evidence
for Vietnam. Journal of Development Economics 84(2), 667–685.Wayoro, D. and L. Ndikumana (2019). Impact of Development Aid on Infant Mortality: Micro-Level
Evidence from Cote d’Ivoire. UMASS Amherst Economics Working Papers 2019-07, University ofMassachusetts Amherst, Department of Economics.
Werker, E., F. Z. Ahmed, and C. Cohen (2009). How Is Foreign Aid Spent? Evidence from a NaturalExperiment. American Economic Journal: Macroeconomics 1(2), 225–244.
Wessel, P. and W. Smith (2017). A Global Self-consistent, Hierarchical, High-resolution GeographyDatabase Version 2.3.7. Accessed August 21, 2017. http://www.soest.hawaii.edu/pwessel/gshhg/.
Wessel, P. and W. H. F. Smith (1996). A global, self-consistent, hierarchical, high-resolution shorelinedatabase. Journal of Geophysical Research 101, 8741–8743.
Widmer, P. and N. Zurlinden (2019). Born in the Right Place? Health Ministers, Foreign Aid and InfantMortality. Economics Working Paper Series 1911, University of St. Gallen.
Williamson, C. R. (2008). Foreign Aid and Human Development: The Impact of Foreign Aid to theHealth Sector. Southern Economic Journal 75(1), 188–207.
Wilson, S. E. (2011). Chasing Success: Health Sector Aid and Mortality. World Development 39(11),2032–2043.
World Bank (2020). World development indicators. Accessed February 15, 2020.https://datacatalog.worldbank.org/dataset/world-development-indicators.
Zeitz, A. (2020). Emulation or Differentiation? China’s Development Finance and Traditional Donor Aidin Developing Countries. Review of International Organizations, forthcoming.
27
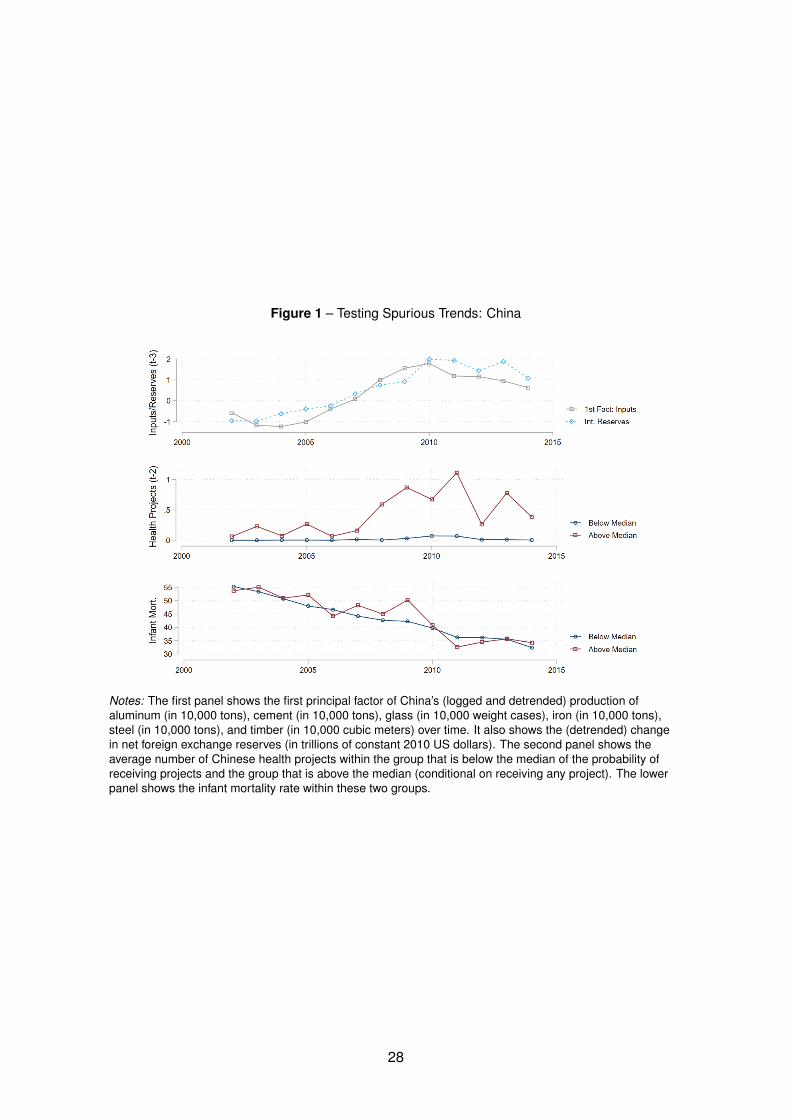
Figure 1 – Testing Spurious Trends: China
Notes: The first panel shows the first principal factor of China’s (logged and detrended) production ofaluminum (in 10,000 tons), cement (in 10,000 tons), glass (in 10,000 weight cases), iron (in 10,000 tons),steel (in 10,000 tons), and timber (in 10,000 cubic meters) over time. It also shows the (detrended) changein net foreign exchange reserves (in trillions of constant 2010 US dollars). The second panel shows theaverage number of Chinese health projects within the group that is below the median of the probability ofreceiving projects and the group that is above the median (conditional on receiving any project). The lowerpanel shows the infant mortality rate within these two groups.
28
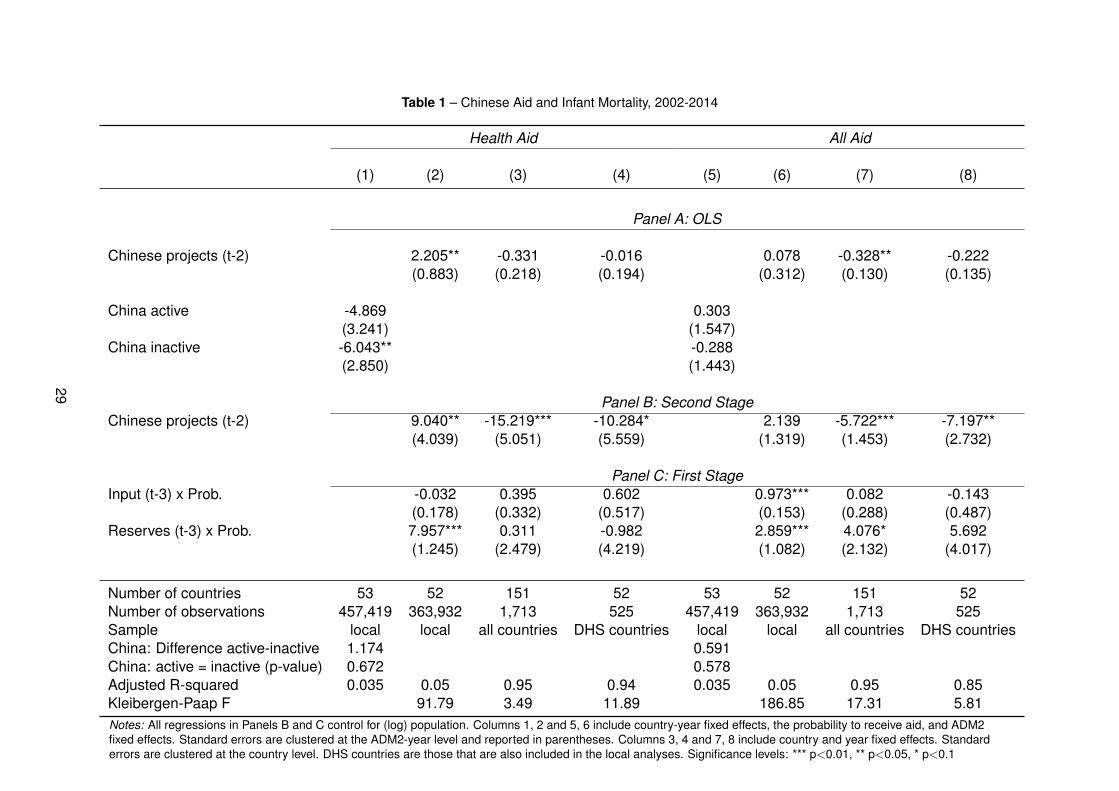
Table 1 – Chinese Aid and Infant Mortality, 2002-2014
Health Aid All Aid
(1) (2) (3) (4) (5) (6) (7) (8)
Panel A: OLS
Chinese projects (t-2) 2.205** -0.331 -0.016 0.078 -0.328** -0.222(0.883) (0.218) (0.194) (0.312) (0.130) (0.135)
China active -4.869 0.303(3.241) (1.547)
China inactive -6.043** -0.288(2.850) (1.443)
Panel B: Second StageChinese projects (t-2) 9.040** -15.219*** -10.284* 2.139 -5.722*** -7.197**
(4.039) (5.051) (5.559) (1.319) (1.453) (2.732)
Panel C: First StageInput (t-3) x Prob. -0.032 0.395 0.602 0.973*** 0.082 -0.143
(0.178) (0.332) (0.517) (0.153) (0.288) (0.487)Reserves (t-3) x Prob. 7.957*** 0.311 -0.982 2.859*** 4.076* 5.692
(1.245) (2.479) (4.219) (1.082) (2.132) (4.017)
Number of countries 53 52 151 52 53 52 151 52Number of observations 457,419 363,932 1,713 525 457,419 363,932 1,713 525Sample local local all countries DHS countries local local all countries DHS countriesChina: Difference active-inactive 1.174 0.591China: active = inactive (p-value) 0.672 0.578Adjusted R-squared 0.035 0.05 0.95 0.94 0.035 0.05 0.95 0.85Kleibergen-Paap F 91.79 3.49 11.89 186.85 17.31 5.81Notes: All regressions in Panels B and C control for (log) population. Columns 1, 2 and 5, 6 include country-year fixed effects, the probability to receive aid, and ADM2fixed effects. Standard errors are clustered at the ADM2-year level and reported in parentheses. Columns 3, 4 and 7, 8 include country and year fixed effects. Standarderrors are clustered at the country level. DHS countries are those that are also included in the local analyses. Significance levels: *** p<0.01, ** p<0.05, * p<0.1
29

Table 2 – Transmission Channels at the Local Level
(1) (2) (3) (4) (5) (6) (7) (8) (9) (10)Assisted births Assisted births Public facility Private facility Public hospital Private hospital Hospital Antimalarial Staff Staff
skilled traditional availability availability uptake uptake too far medication hires education
Panel A: OLSChinese projects (t-2) 4.362 0.442 18.433** 1.374* 2.286 -2.159 -0.008 2.920*** 0.034 -0.133***
(3.351) (2.654) (8.794) (0.759) (3.291) (2.373) (0.012) (0.950) (0.024) (0.037)
Panel B: Second StageChinese projects (t-2) -69.416*** 132.852*** 58.448 2.193 -72.770*** -22.855*** 0.064* 10.557*** 0.372*** -1.115***
(11.236) (16.699) (56.973) (1.975) (13.769) (8.778) (0.038) (3.191) (0.093) (0.210)
Panel C: First StageFactor (t-3) x Prob. -0.031 0.943*** 4.251*** 4.251*** -0.054 -0.054 2.196*** -0.099 -0.059 0.045
(0.294) (0.155) (1.000) (1.000) (0.282) (0.282) (0.425) (0.183) (0.118) (0.142)Reserves (t-3) x Prob. 9.450*** 1.059** 7.488 7.489 9.473*** 9.473*** -18.643*** 8.003*** 3.808*** 3.027***
(1.908) (0.440) (6.325) (6.325) (1.839) (1.839) (3.065) (1.304) (0.859) (1.032)
Number of countries 51 51 27 27 51 51 25 33 7 7Number of observations 190,223 199,594 9,798 9,798 206,346 206,346 34,634 232,653 100,770 70,369Adjusted R-squared 0.56 0.46 0.96 0.85 0.43 0.36 0.38 0.38 0.22 0.99Kleibergen-Paap F 74.46 56.54 9.53 9.53 76.14 76.14 19.39 80.37 83.64 49.65
Notes: All columns include (log) population, the probability to receive aid, country-year fixed effects, and ADM2 fixed effects. Standard errors are clustered at the ADM2-year level and reported in parentheses. Significance levels: *** p<0.01, ** p<0.05, * p<0.1
30

Table 3 – Chinese Health Aid and Other Resources
(1) (2) (3) (4)Assisted births skilled Assisted births skilled World Bank projects World Bank projects
Chinese projects (t-2) -23.436 -40.446*** -0.170(19.585) (13.824) (0.127)
Health exp./Gov. exp. x Chinese projects -5.878***(2.151)
Other aid/GNI x Chinese projects -928.447*(484.971)
Chinese projects (t-1) -0.419**(0.171)
Number of countries 49 51 52 52Number of observations 172,053 190,223 363,930 406,678Adjusted R-squared 0.57 0.55 0.62 0.55Kleibergen-Paap F 21.89 24.68 69.23 70.23
Notes: All columns include (log) population, the probability to receive aid, country-year fixed effects, and ADM2 fixedeffects. Standard errors are clustered at the ADM2-year level and reported in parentheses. Significance levels: *** p<0.01,** p<0.05, * p<0.1
31
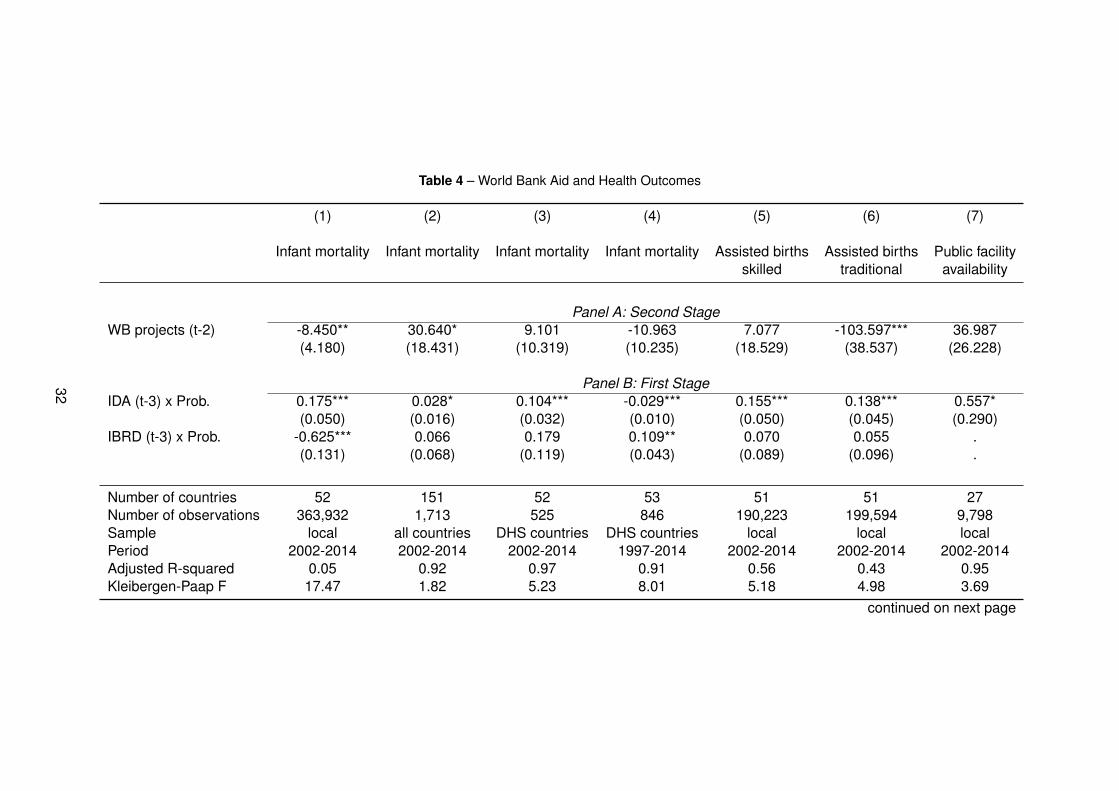
Table 4 – World Bank Aid and Health Outcomes
(1) (2) (3) (4) (5) (6) (7)
Infant mortality Infant mortality Infant mortality Infant mortality Assisted births Assisted births Public facilityskilled traditional availability
Panel A: Second StageWB projects (t-2) -8.450** 30.640* 9.101 -10.963 7.077 -103.597*** 36.987
(4.180) (18.431) (10.319) (10.235) (18.529) (38.537) (26.228)
Panel B: First StageIDA (t-3) x Prob. 0.175*** 0.028* 0.104*** -0.029*** 0.155*** 0.138*** 0.557*
(0.050) (0.016) (0.032) (0.010) (0.050) (0.045) (0.290)IBRD (t-3) x Prob. -0.625*** 0.066 0.179 0.109** 0.070 0.055 .
(0.131) (0.068) (0.119) (0.043) (0.089) (0.096) .
Number of countries 52 151 52 53 51 51 27Number of observations 363,932 1,713 525 846 190,223 199,594 9,798Sample local all countries DHS countries DHS countries local local localPeriod 2002-2014 2002-2014 2002-2014 1997-2014 2002-2014 2002-2014 2002-2014Adjusted R-squared 0.05 0.92 0.97 0.91 0.56 0.43 0.95Kleibergen-Paap F 17.47 1.82 5.23 8.01 5.18 4.98 3.69
continued on next page
32
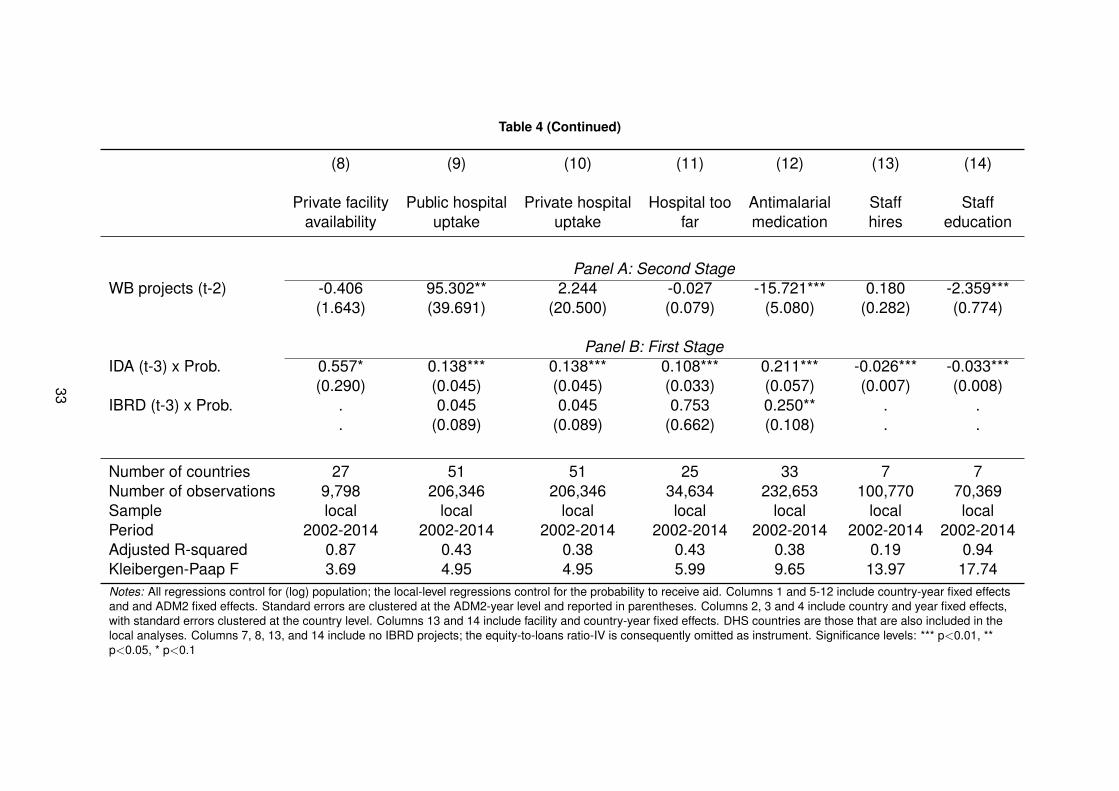
Table 4 (Continued)
(8) (9) (10) (11) (12) (13) (14)
Private facility Public hospital Private hospital Hospital too Antimalarial Staff Staffavailability uptake uptake far medication hires education
Panel A: Second StageWB projects (t-2) -0.406 95.302** 2.244 -0.027 -15.721*** 0.180 -2.359***
(1.643) (39.691) (20.500) (0.079) (5.080) (0.282) (0.774)
Panel B: First StageIDA (t-3) x Prob. 0.557* 0.138*** 0.138*** 0.108*** 0.211*** -0.026*** -0.033***
(0.290) (0.045) (0.045) (0.033) (0.057) (0.007) (0.008)IBRD (t-3) x Prob. . 0.045 0.045 0.753 0.250** . .
. (0.089) (0.089) (0.662) (0.108) . .
Number of countries 27 51 51 25 33 7 7Number of observations 9,798 206,346 206,346 34,634 232,653 100,770 70,369Sample local local local local local local localPeriod 2002-2014 2002-2014 2002-2014 2002-2014 2002-2014 2002-2014 2002-2014Adjusted R-squared 0.87 0.43 0.38 0.43 0.38 0.19 0.94Kleibergen-Paap F 3.69 4.95 4.95 5.99 9.65 13.97 17.74Notes: All regressions control for (log) population; the local-level regressions control for the probability to receive aid. Columns 1 and 5-12 include country-year fixed effectsand and ADM2 fixed effects. Standard errors are clustered at the ADM2-year level and reported in parentheses. Columns 2, 3 and 4 include country and year fixed effects,with standard errors clustered at the country level. Columns 13 and 14 include facility and country-year fixed effects. DHS countries are those that are also included in thelocal analyses. Columns 7, 8, 13, and 14 include no IBRD projects; the equity-to-loans ratio-IV is consequently omitted as instrument. Significance levels: *** p<0.01, **p<0.05, * p<0.1
33

Table 5 – Composition of Mothers
(1) (2) (3) (4) (5) (6) (7) (8) (9)
Fertility Fertility Fertility Fertility Fertility Fertility Fertility Infant Infantuneducated educated young middle older ethnic minority ethnic majority mortality mortality
Chinese projects (t-2) -0.002 0.006 -22.758 89.584* -25.991 282.296*** -286.823*** 8.619** 9.678*(0.020) (0.064) (21.568) (46.246) (33.239) (54.653) (91.934) (4.115) (5.157)
Children middle-aged mothers 0.005***(0.000)
Children ethnic minority mothers 0.001***(0.000)
Number of countries 52 52 52 52 52 29 29 52 29Number of observations 361,750 361,750 361,750 361,750 361,750 206,424 206,424 361,750 206,424Adjusted R-squared 0.17 0.44 0.22 0.28 0.27 0.33 0.44 0.05 0.04Kleibergen-Paap F 86.93 86.93 86.93 86.93 86.93 46.91 46.91 86.94 46.93Notes: All regressions control for (log) population and include country-year fixed effects, the probability to receive aid, and ADM2 fixed effects. Standard errors areclustered at the ADM2-year level and reported in parentheses. DHS countries are those that are also included in the local analyses. Significance levels: *** p<0.01, **p<0.05, * p<0.1
34
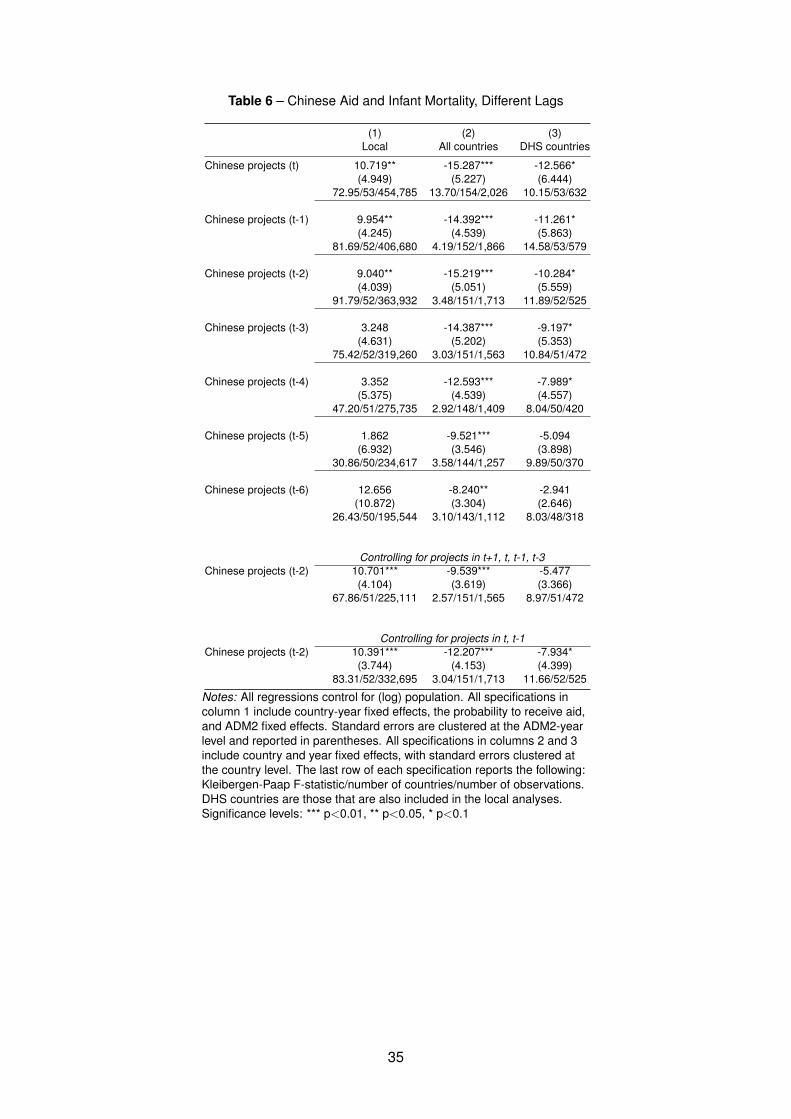
Table 6 – Chinese Aid and Infant Mortality, Different Lags
(1) (2) (3)Local All countries DHS countries
Chinese projects (t) 10.719** -15.287*** -12.566*(4.949) (5.227) (6.444)
72.95/53/454,785 13.70/154/2,026 10.15/53/632
Chinese projects (t-1) 9.954** -14.392*** -11.261*(4.245) (4.539) (5.863)
81.69/52/406,680 4.19/152/1,866 14.58/53/579
Chinese projects (t-2) 9.040** -15.219*** -10.284*(4.039) (5.051) (5.559)
91.79/52/363,932 3.48/151/1,713 11.89/52/525
Chinese projects (t-3) 3.248 -14.387*** -9.197*(4.631) (5.202) (5.353)
75.42/52/319,260 3.03/151/1,563 10.84/51/472
Chinese projects (t-4) 3.352 -12.593*** -7.989*(5.375) (4.539) (4.557)
47.20/51/275,735 2.92/148/1,409 8.04/50/420
Chinese projects (t-5) 1.862 -9.521*** -5.094(6.932) (3.546) (3.898)
30.86/50/234,617 3.58/144/1,257 9.89/50/370
Chinese projects (t-6) 12.656 -8.240** -2.941(10.872) (3.304) (2.646)
26.43/50/195,544 3.10/143/1,112 8.03/48/318
Controlling for projects in t+1, t, t-1, t-3Chinese projects (t-2) 10.701*** -9.539*** -5.477
(4.104) (3.619) (3.366)67.86/51/225,111 2.57/151/1,565 8.97/51/472
Controlling for projects in t, t-1Chinese projects (t-2) 10.391*** -12.207*** -7.934*
(3.744) (4.153) (4.399)83.31/52/332,695 3.04/151/1,713 11.66/52/525
Notes: All regressions control for (log) population. All specifications incolumn 1 include country-year fixed effects, the probability to receive aid,and ADM2 fixed effects. Standard errors are clustered at the ADM2-yearlevel and reported in parentheses. All specifications in columns 2 and 3include country and year fixed effects, with standard errors clustered atthe country level. The last row of each specification reports the following:Kleibergen-Paap F-statistic/number of countries/number of observations.DHS countries are those that are also included in the local analyses.Significance levels: *** p<0.01, ** p<0.05, * p<0.1
35

Table 7 – Tests for Robustness
(1) (2) (3)Local All countries DHS countries
(log) Commitment amounts 1.486* -0.612*** -0.4089(0.795) (0.232) (0.315)
76.44/52/363,932 6.42/151/1,713 9.02/52/525Health Aid (binary) 15.218** -17.302*** -12.389*
(7.269) (4.989) (6.463)129.37/52/363,932 5.65/151/1,713 8.65/52/525
Input interaction IV 6.159 -14.949*** -10.674*(4.693) (4.864) (6.076)
156.34/52/363,932 6.48/151/1,713 19.98/52/525Reserves interaction IV 8.968** -17.646** -12.238
(4.044) (7.365) (8.851)183.37/52/363,932 4.54/151/1,713 6.86/52/525
Averages, three years 8.761 -12.279*** -8.416*(6.837) (3.974) (4.941)
108.25/50/189,557 4.43/148/1,408 11.09/50/420111 km 8.668**
(3.380)174.51/52/363,932
Full set of controls 8.989**(4.126)
87.79/52/357,054World GDP growth (t-3) x Prob. 10.990*** -15.772*** -10.852*
(3.167) (5.414) (6.026)92.99/52/363,932 3.40/151/1,713 11.27/52/525
Chinese exports (t-3) x Prob. 23.874* -6.302*** -7.852**(13.851) (2.220) (3.697)
7.67/52/363,932 3.16/151/1,713 7.59/52/525Chinese FDI (t-3) x Prob. 13.181** -9.127*** -8.049**
(6.309) (2.842) (3.890)28.94/52/363,932 3.86/151/1,713 4.58/52/525
ADM2 19.528(15.144)
14.96/52/61,592ODA projects 9.537** -15.749*** -9.935*
(4.564) (5.749) (5.821)73.13/52/363,932 2.86/151/1,713 7.36/52/525
OOF projects -28.436 3.750 2.594(25.901) (2.484) (1.835)
8.73/52/363,932 6.67/151/1,713 5.81/52/525
Notes: All regressions control for (log) population. All specifications in column 1 includecountry-year fixed effects, the probability to receive aid, and ADM2 fixed effects.Standard errors are clustered at the ADM2-year level and reported in parentheses. Allspecifications in columns 2 and 3 include country and year fixed effects, with standarderrors clustered at the country level. The last row of each specification reports thefollowing: Kleibergen-Paap F-statistic/number of countries/number of observations.DHS countries are those that are also included in the local analyses. Significancelevels: *** p<0.01, ** p<0.05, * p<0.1
36

Appendix
A Additional Figures
Figure A.1 – The Local Effect of Aid on Infant Mortality with Fungibility
Notes: The figure illustrates fungibility. The figure on the left shows what would have happened withoutthe Chinese health project. The figure on the right shows what happens with China implementing a healthproject. As can be seen in the figure, the government shifts its resources to another location in order tonot spend resources on similar projects in the same location in response to the Chinese health project.Thus, the exemplary location receives a Chinese-funded project instead of a government-financed one.However, since China focuses more on Malaria treatment, the focus of the health project shifted from generalto Malaria which can render the effect on infant mortality negative compared to the counterfactual.
37
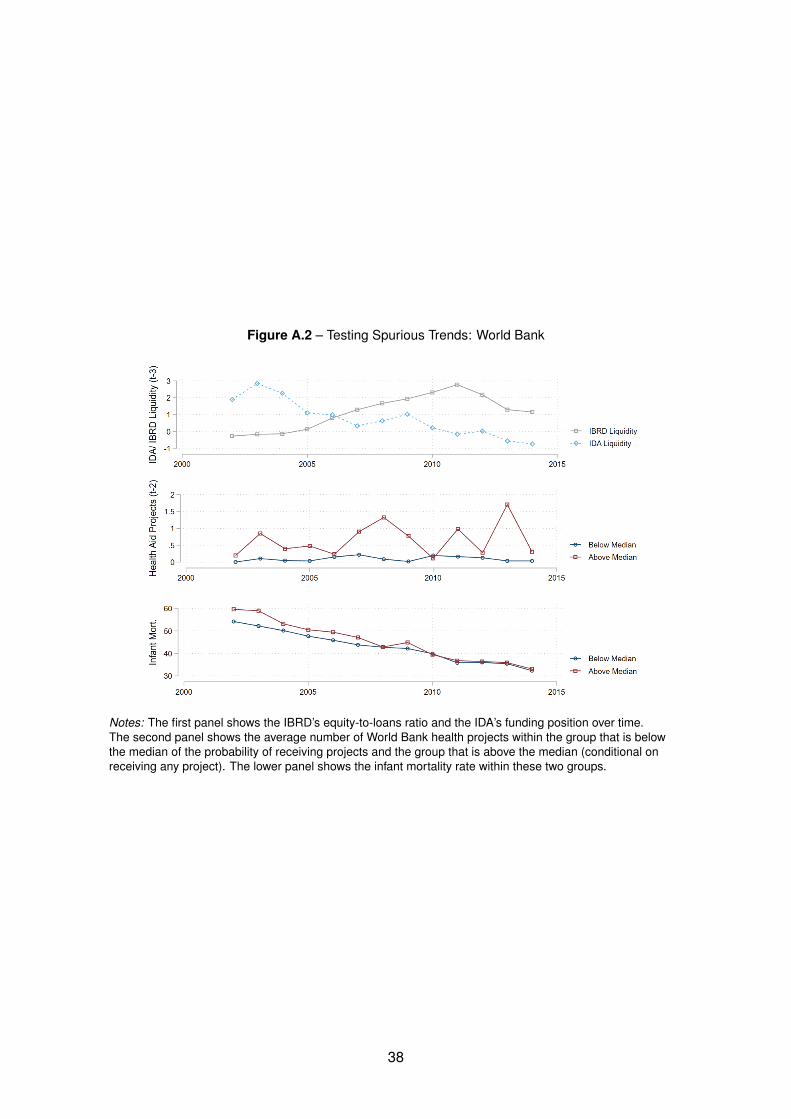
Figure A.2 – Testing Spurious Trends: World Bank
Notes: The first panel shows the IBRD’s equity-to-loans ratio and the IDA’s funding position over time.The second panel shows the average number of World Bank health projects within the group that is belowthe median of the probability of receiving projects and the group that is above the median (conditional onreceiving any project). The lower panel shows the infant mortality rate within these two groups.
38
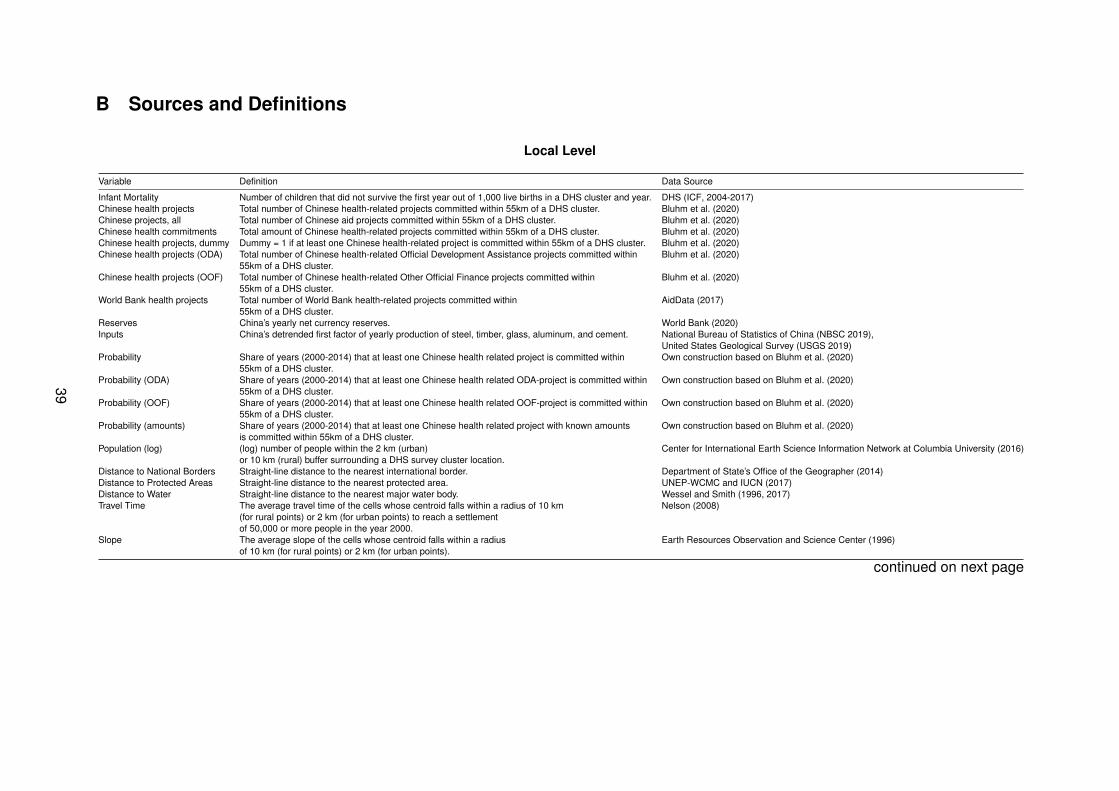
B Sources and Definitions
Local Level
Variable Definition Data Source
Infant Mortality Number of children that did not survive the first year out of 1,000 live births in a DHS cluster and year. DHS (ICF, 2004-2017)Chinese health projects Total number of Chinese health-related projects committed within 55km of a DHS cluster. Bluhm et al. (2020)Chinese projects, all Total number of Chinese aid projects committed within 55km of a DHS cluster. Bluhm et al. (2020)Chinese health commitments Total amount of Chinese health-related projects committed within 55km of a DHS cluster. Bluhm et al. (2020)Chinese health projects, dummy Dummy = 1 if at least one Chinese health-related project is committed within 55km of a DHS cluster. Bluhm et al. (2020)Chinese health projects (ODA) Total number of Chinese health-related Official Development Assistance projects committed within Bluhm et al. (2020)
55km of a DHS cluster.Chinese health projects (OOF) Total number of Chinese health-related Other Official Finance projects committed within Bluhm et al. (2020)
55km of a DHS cluster.World Bank health projects Total number of World Bank health-related projects committed within AidData (2017)
55km of a DHS cluster.Reserves China’s yearly net currency reserves. World Bank (2020)Inputs China’s detrended first factor of yearly production of steel, timber, glass, aluminum, and cement. National Bureau of Statistics of China (NBSC 2019),
United States Geological Survey (USGS 2019)Probability Share of years (2000-2014) that at least one Chinese health related project is committed within Own construction based on Bluhm et al. (2020)
55km of a DHS cluster.Probability (ODA) Share of years (2000-2014) that at least one Chinese health related ODA-project is committed within Own construction based on Bluhm et al. (2020)
55km of a DHS cluster.Probability (OOF) Share of years (2000-2014) that at least one Chinese health related OOF-project is committed within Own construction based on Bluhm et al. (2020)
55km of a DHS cluster.Probability (amounts) Share of years (2000-2014) that at least one Chinese health related project with known amounts Own construction based on Bluhm et al. (2020)
is committed within 55km of a DHS cluster.Population (log) (log) number of people within the 2 km (urban) Center for International Earth Science Information Network at Columbia University (2016)
or 10 km (rural) buffer surrounding a DHS survey cluster location.Distance to National Borders Straight-line distance to the nearest international border. Department of State’s Office of the Geographer (2014)Distance to Protected Areas Straight-line distance to the nearest protected area. UNEP-WCMC and IUCN (2017)Distance to Water Straight-line distance to the nearest major water body. Wessel and Smith (1996, 2017)Travel Time The average travel time of the cells whose centroid falls within a radius of 10 km Nelson (2008)
(for rural points) or 2 km (for urban points) to reach a settlementof 50,000 or more people in the year 2000.
Slope The average slope of the cells whose centroid falls within a radius Earth Resources Observation and Science Center (1996)of 10 km (for rural points) or 2 km (for urban points).
continued on next page
39
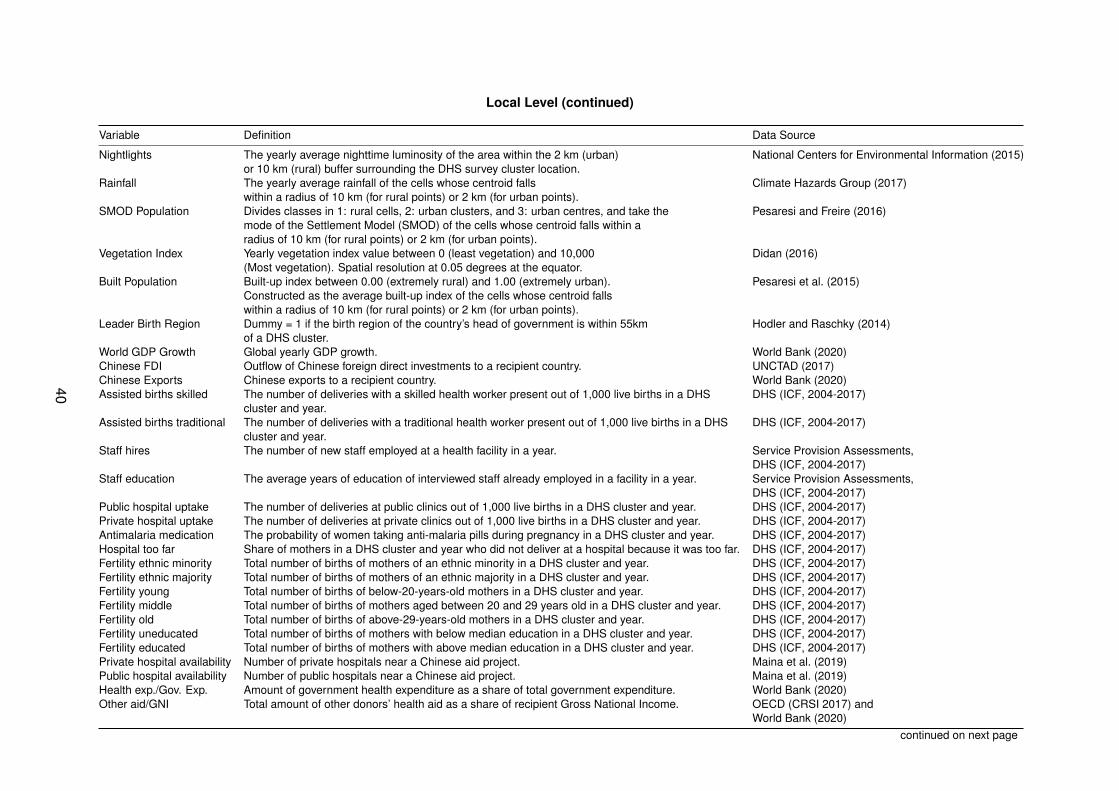
Local Level (continued)
Variable Definition Data Source
Nightlights The yearly average nighttime luminosity of the area within the 2 km (urban) National Centers for Environmental Information (2015)or 10 km (rural) buffer surrounding the DHS survey cluster location.
Rainfall The yearly average rainfall of the cells whose centroid falls Climate Hazards Group (2017)within a radius of 10 km (for rural points) or 2 km (for urban points).
SMOD Population Divides classes in 1: rural cells, 2: urban clusters, and 3: urban centres, and take the Pesaresi and Freire (2016)mode of the Settlement Model (SMOD) of the cells whose centroid falls within aradius of 10 km (for rural points) or 2 km (for urban points).
Vegetation Index Yearly vegetation index value between 0 (least vegetation) and 10,000 Didan (2016)(Most vegetation). Spatial resolution at 0.05 degrees at the equator.
Built Population Built-up index between 0.00 (extremely rural) and 1.00 (extremely urban). Pesaresi et al. (2015)Constructed as the average built-up index of the cells whose centroid fallswithin a radius of 10 km (for rural points) or 2 km (for urban points).
Leader Birth Region Dummy = 1 if the birth region of the country’s head of government is within 55km Hodler and Raschky (2014)of a DHS cluster.
World GDP Growth Global yearly GDP growth. World Bank (2020)Chinese FDI Outflow of Chinese foreign direct investments to a recipient country. UNCTAD (2017)Chinese Exports Chinese exports to a recipient country. World Bank (2020)Assisted births skilled The number of deliveries with a skilled health worker present out of 1,000 live births in a DHS DHS (ICF, 2004-2017)
cluster and year.Assisted births traditional The number of deliveries with a traditional health worker present out of 1,000 live births in a DHS DHS (ICF, 2004-2017)
cluster and year.Staff hires The number of new staff employed at a health facility in a year. Service Provision Assessments,
DHS (ICF, 2004-2017)Staff education The average years of education of interviewed staff already employed in a facility in a year. Service Provision Assessments,
DHS (ICF, 2004-2017)Public hospital uptake The number of deliveries at public clinics out of 1,000 live births in a DHS cluster and year. DHS (ICF, 2004-2017)Private hospital uptake The number of deliveries at private clinics out of 1,000 live births in a DHS cluster and year. DHS (ICF, 2004-2017)Antimalaria medication The probability of women taking anti-malaria pills during pregnancy in a DHS cluster and year. DHS (ICF, 2004-2017)Hospital too far Share of mothers in a DHS cluster and year who did not deliver at a hospital because it was too far. DHS (ICF, 2004-2017)Fertility ethnic minority Total number of births of mothers of an ethnic minority in a DHS cluster and year. DHS (ICF, 2004-2017)Fertility ethnic majority Total number of births of mothers of an ethnic majority in a DHS cluster and year. DHS (ICF, 2004-2017)Fertility young Total number of births of below-20-years-old mothers in a DHS cluster and year. DHS (ICF, 2004-2017)Fertility middle Total number of births of mothers aged between 20 and 29 years old in a DHS cluster and year. DHS (ICF, 2004-2017)Fertility old Total number of births of above-29-years-old mothers in a DHS cluster and year. DHS (ICF, 2004-2017)Fertility uneducated Total number of births of mothers with below median education in a DHS cluster and year. DHS (ICF, 2004-2017)Fertility educated Total number of births of mothers with above median education in a DHS cluster and year. DHS (ICF, 2004-2017)Private hospital availability Number of private hospitals near a Chinese aid project. Maina et al. (2019)Public hospital availability Number of public hospitals near a Chinese aid project. Maina et al. (2019)Health exp./Gov. Exp. Amount of government health expenditure as a share of total government expenditure. World Bank (2020)Other aid/GNI Total amount of other donors’ health aid as a share of recipient Gross National Income. OECD (CRSI 2017) and
World Bank (2020)continued on next page
40

Country Level
Variable Definition Data Source
Infant Mortality Number of children that did not survive the first year out of 1,000 live births per country and year. DHS (ICF, 2004-2017)Chinese health projects Total number of Chinese health-related projects committed within a country/year. Bluhm et al. (2020)Chinese projects, all Total number of Chinese projects committed within a country/year. Bluhm et al. (2020)Chinese health commitments Total amount of Chinese health-related project commitments within a country/year. Bluhm et al. (2020)Chinese health projects, dummy Dummy = 1 if at least one Chinese health-related project is committed within country/year. Bluhm et al. (2020)Chinese health projects (ODA) Total number of Chinese health-related Official Development Assistance projects committed within a country/year. Bluhm et al. (2020)Chinese health projects (OOF) Total number of Chinese health-related Other Official Finance projects committed within a country/year. Bluhm et al. (2020)World Bank health projects Total number of World Bank health-related projects committed within a country/year. AidData (2017)Reserves China’s yearly net currency reserves. World Bank (2020)Inputs China’s detrended first factor of yearly production of steel, timber, glass, aluminum, and cement. National Bureau of Statistics of China (NBSC 2019),
United States Geological Survey (USGS 2019)Probability Share of years (2000-2014) that at least one Chinese health related-project is committed in a country. Bluhm et al. (2020)Probability (all aid) Share of years (2000-2014) that at least one Chinese project is committed in a country. Bluhm et al. (2020)Probability (ODA) Share of years (2000-2014) that at least one Chinese health-related ODA-project is committed in a country. Bluhm et al. (2020)Probability (OOF) Share of years (2000-2014) that at least one Chinese health-related OOF-project is committed in a country. Bluhm et al. (2020)Probability (amounts) Share of years (2000-2014) that at least one Chinese health-related project with known amounts is committed in a country. Bluhm et al. (2020)Population (log) The logarithm of population size. World Bank (2020)World GDP Growth Global yearly GDP growth. World Bank (2020)Chinese FDI Outflow of Chinese foreign direct investments in a recipient country. World Investment Report (2017)Chinese Exports Chinese exports to a recipient country. World Bank (2020)
41
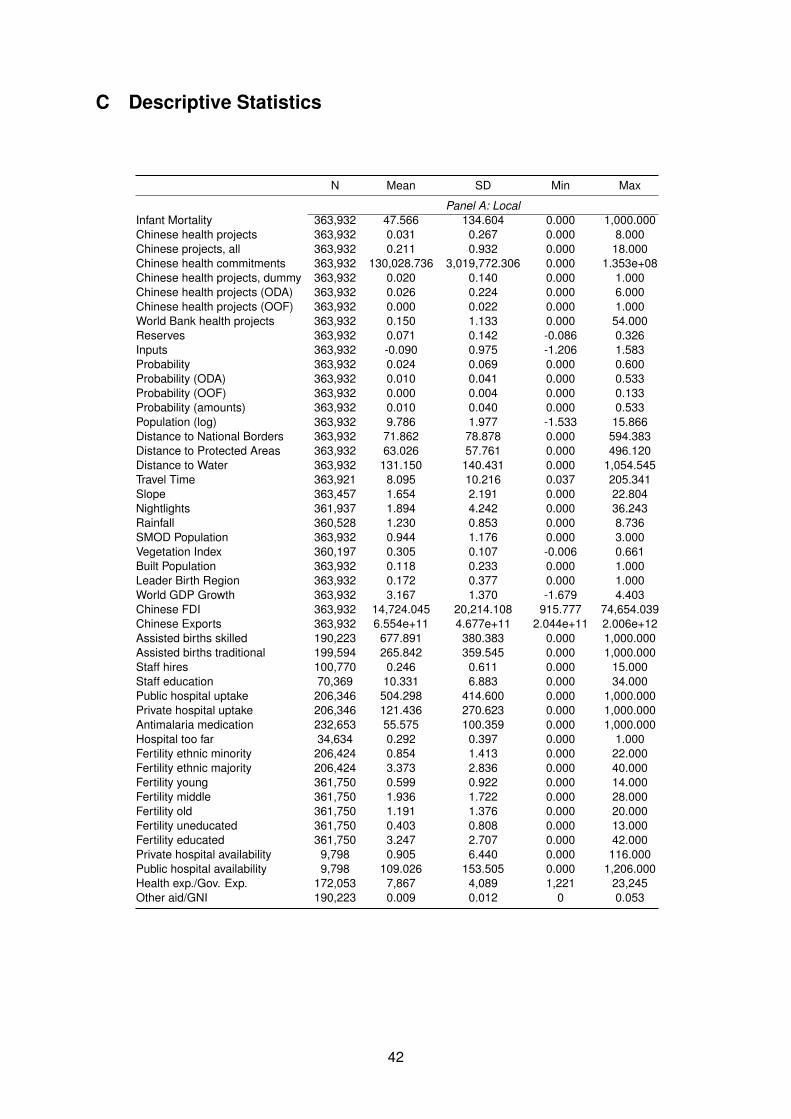
C Descriptive Statistics
N Mean SD Min Max
Panel A: LocalInfant Mortality 363,932 47.566 134.604 0.000 1,000.000Chinese health projects 363,932 0.031 0.267 0.000 8.000Chinese projects, all 363,932 0.211 0.932 0.000 18.000Chinese health commitments 363,932 130,028.736 3,019,772.306 0.000 1.353e+08Chinese health projects, dummy 363,932 0.020 0.140 0.000 1.000Chinese health projects (ODA) 363,932 0.026 0.224 0.000 6.000Chinese health projects (OOF) 363,932 0.000 0.022 0.000 1.000World Bank health projects 363,932 0.150 1.133 0.000 54.000Reserves 363,932 0.071 0.142 -0.086 0.326Inputs 363,932 -0.090 0.975 -1.206 1.583Probability 363,932 0.024 0.069 0.000 0.600Probability (ODA) 363,932 0.010 0.041 0.000 0.533Probability (OOF) 363,932 0.000 0.004 0.000 0.133Probability (amounts) 363,932 0.010 0.040 0.000 0.533Population (log) 363,932 9.786 1.977 -1.533 15.866Distance to National Borders 363,932 71.862 78.878 0.000 594.383Distance to Protected Areas 363,932 63.026 57.761 0.000 496.120Distance to Water 363,932 131.150 140.431 0.000 1,054.545Travel Time 363,921 8.095 10.216 0.037 205.341Slope 363,457 1.654 2.191 0.000 22.804Nightlights 361,937 1.894 4.242 0.000 36.243Rainfall 360,528 1.230 0.853 0.000 8.736SMOD Population 363,932 0.944 1.176 0.000 3.000Vegetation Index 360,197 0.305 0.107 -0.006 0.661Built Population 363,932 0.118 0.233 0.000 1.000Leader Birth Region 363,932 0.172 0.377 0.000 1.000World GDP Growth 363,932 3.167 1.370 -1.679 4.403Chinese FDI 363,932 14,724.045 20,214.108 915.777 74,654.039Chinese Exports 363,932 6.554e+11 4.677e+11 2.044e+11 2.006e+12Assisted births skilled 190,223 677.891 380.383 0.000 1,000.000Assisted births traditional 199,594 265.842 359.545 0.000 1,000.000Staff hires 100,770 0.246 0.611 0.000 15.000Staff education 70,369 10.331 6.883 0.000 34.000Public hospital uptake 206,346 504.298 414.600 0.000 1,000.000Private hospital uptake 206,346 121.436 270.623 0.000 1,000.000Antimalaria medication 232,653 55.575 100.359 0.000 1,000.000Hospital too far 34,634 0.292 0.397 0.000 1.000Fertility ethnic minority 206,424 0.854 1.413 0.000 22.000Fertility ethnic majority 206,424 3.373 2.836 0.000 40.000Fertility young 361,750 0.599 0.922 0.000 14.000Fertility middle 361,750 1.936 1.722 0.000 28.000Fertility old 361,750 1.191 1.376 0.000 20.000Fertility uneducated 361,750 0.403 0.808 0.000 13.000Fertility educated 361,750 3.247 2.707 0.000 42.000Private hospital availability 9,798 0.905 6.440 0.000 116.000Public hospital availability 9,798 109.026 153.505 0.000 1,206.000Health exp./Gov. Exp. 172,053 7,867 4,089 1,221 23,245Other aid/GNI 190,223 0.009 0.012 0 0.053
42
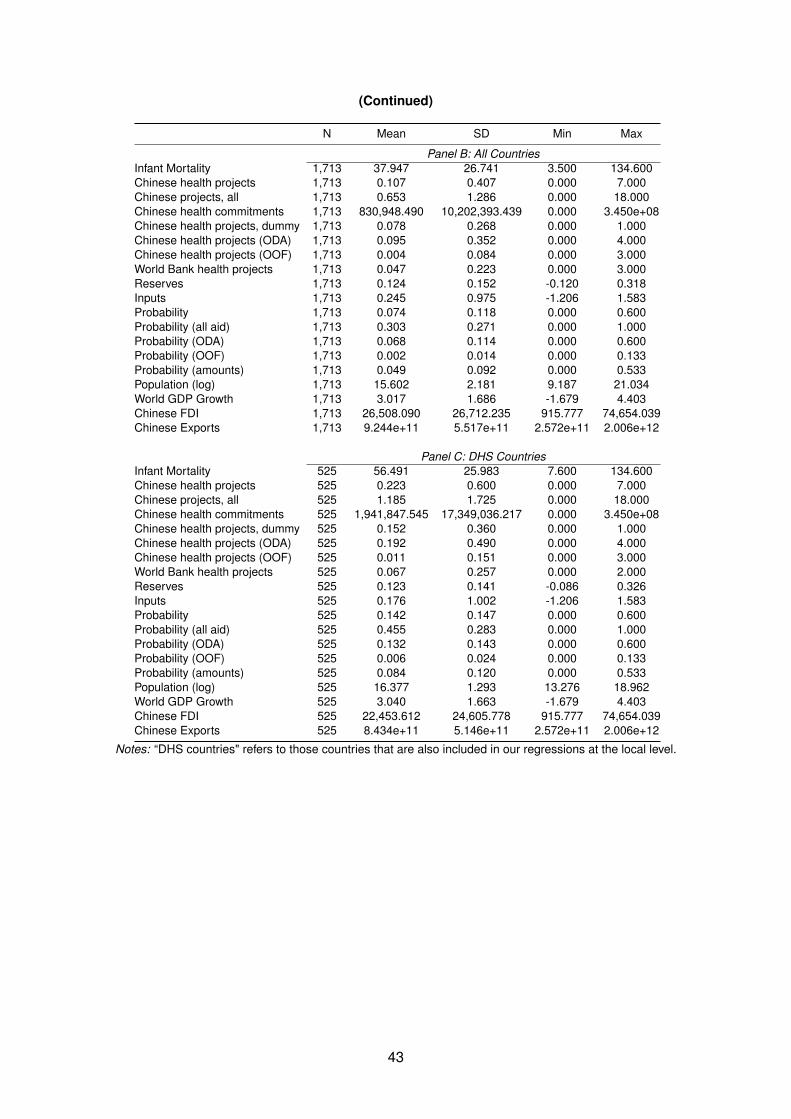
(Continued)
N Mean SD Min Max
Panel B: All CountriesInfant Mortality 1,713 37.947 26.741 3.500 134.600Chinese health projects 1,713 0.107 0.407 0.000 7.000Chinese projects, all 1,713 0.653 1.286 0.000 18.000Chinese health commitments 1,713 830,948.490 10,202,393.439 0.000 3.450e+08Chinese health projects, dummy 1,713 0.078 0.268 0.000 1.000Chinese health projects (ODA) 1,713 0.095 0.352 0.000 4.000Chinese health projects (OOF) 1,713 0.004 0.084 0.000 3.000World Bank health projects 1,713 0.047 0.223 0.000 3.000Reserves 1,713 0.124 0.152 -0.120 0.318Inputs 1,713 0.245 0.975 -1.206 1.583Probability 1,713 0.074 0.118 0.000 0.600Probability (all aid) 1,713 0.303 0.271 0.000 1.000Probability (ODA) 1,713 0.068 0.114 0.000 0.600Probability (OOF) 1,713 0.002 0.014 0.000 0.133Probability (amounts) 1,713 0.049 0.092 0.000 0.533Population (log) 1,713 15.602 2.181 9.187 21.034World GDP Growth 1,713 3.017 1.686 -1.679 4.403Chinese FDI 1,713 26,508.090 26,712.235 915.777 74,654.039Chinese Exports 1,713 9.244e+11 5.517e+11 2.572e+11 2.006e+12
Panel C: DHS CountriesInfant Mortality 525 56.491 25.983 7.600 134.600Chinese health projects 525 0.223 0.600 0.000 7.000Chinese projects, all 525 1.185 1.725 0.000 18.000Chinese health commitments 525 1,941,847.545 17,349,036.217 0.000 3.450e+08Chinese health projects, dummy 525 0.152 0.360 0.000 1.000Chinese health projects (ODA) 525 0.192 0.490 0.000 4.000Chinese health projects (OOF) 525 0.011 0.151 0.000 3.000World Bank health projects 525 0.067 0.257 0.000 2.000Reserves 525 0.123 0.141 -0.086 0.326Inputs 525 0.176 1.002 -1.206 1.583Probability 525 0.142 0.147 0.000 0.600Probability (all aid) 525 0.455 0.283 0.000 1.000Probability (ODA) 525 0.132 0.143 0.000 0.600Probability (OOF) 525 0.006 0.024 0.000 0.133Probability (amounts) 525 0.084 0.120 0.000 0.533Population (log) 525 16.377 1.293 13.276 18.962World GDP Growth 525 3.040 1.663 -1.679 4.403Chinese FDI 525 22,453.612 24,605.778 915.777 74,654.039Chinese Exports 525 8.434e+11 5.146e+11 2.572e+11 2.006e+12
Notes: “DHS countries" refers to those countries that are also included in our regressions at the local level.
43
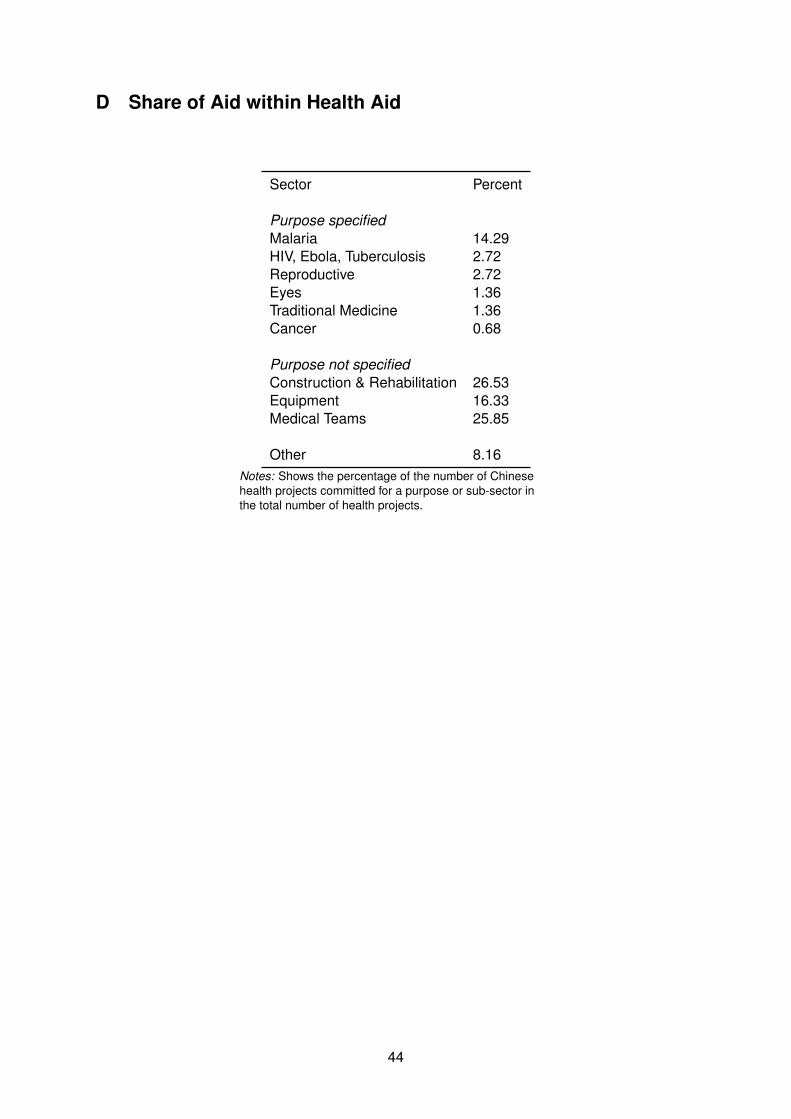
D Share of Aid within Health Aid
Sector Percent
Purpose specifiedMalaria 14.29HIV, Ebola, Tuberculosis 2.72Reproductive 2.72Eyes 1.36Traditional Medicine 1.36Cancer 0.68
Purpose not specifiedConstruction & Rehabilitation 26.53Equipment 16.33Medical Teams 25.85
Other 8.16Notes: Shows the percentage of the number of Chinesehealth projects committed for a purpose or sub-sector inthe total number of health projects.
44