chip on the shoulder? the hunchback heuristic predicts the ... · the hunchback heuristic predicts...
TRANSCRIPT
Page 1 of 26
SOCIAL PSYCHOLOGY | RESEARCH ARTICLE
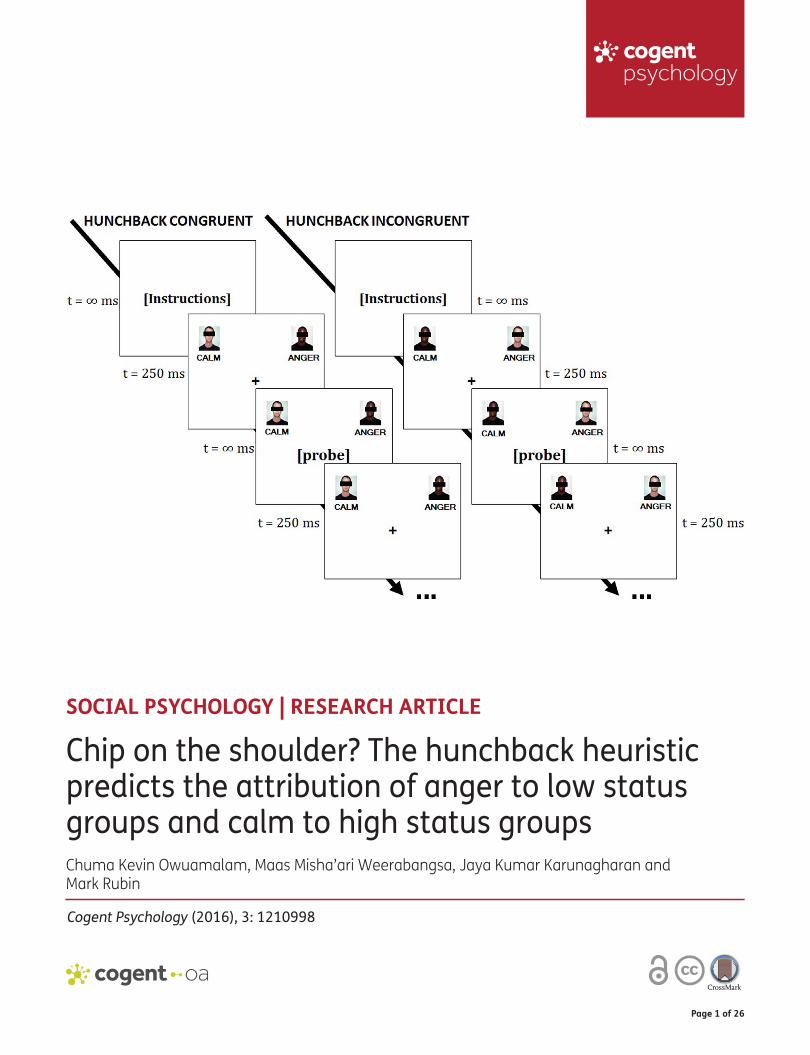
Chip on the shoulder? The hunchback heuristic predicts the attribution of anger to low status groups and calm to high status groupsChuma Kevin Owuamalam, Maas Misha’ari Weerabangsa, Jaya Kumar Karunagharan and Mark Rubin
Cogent Psychology (2016), 3: 1210998

Owuamalam et al., Cogent Psychology (2016), 3: 1210998http://dx.doi.org/10.1080/23311908.2016.1210998
SOCIAL PSYCHOLOGY | RESEARCH ARTICLE
Chip on the shoulder? The hunchback heuristic predicts the attribution of anger to low status groups and calm to high status groupsChuma Kevin Owuamalam1*, Maas Misha’ari Weerabangsa1, Jaya Kumar Karunagharan1 and Mark Rubin2
Abstract: Across societies, there is a tendency to associate members of low status groups with anger, and to associate members of high status groups with calm (i.e. the hunchback heuristic), but there is no empirical documentation for this phenomenon. Thus, in a pilot study (N = 30) we validated the stimuli that we generated to test the existence of a hunchback stereotype by distinguishing two interstatus contexts of skin-shade and race in terms of social status: Dark-skinned Indians (and Blacks) were per-ceived as lower in social status compared to light-skinned Indians (and Whites). Using a multi-method approach comprising an IAT-like protocol and explicit self-reports, Study 2 (N = 80) revealed that perceivers associated dark-skinned Indians with anger, and light-skinned Indians with calm: An effect that was explained by perceived social status. Study 3 (N = 114) corroborated the evidence from Study 2, but in the intersta-tus contexts of Blacks vs. Whites, and large men vs. slim men. Blacks (and large men) were associated with anger, and Whites (and slim men) were associated with calm. Additionally, Study 3 ruled out “racial prejudice” as an explanation for these trends. We conclude with an outline of the theoretical and practical implications of these findings.
*Corresponding author: Chuma Kevin Owuamalam, School of Psychology, University of Nottingham (Malaysia Campus), Jalan Broga, Semenyih 43500, Selangor, Malaysia E-mails: [email protected], [email protected]
Reviewing editor:Traci Craig, University of Idaho, USA
Additional information is available at the end of the article
ABOUT THE AUTHORSChuma Kevin Owuamalam is an assistant professor of social psychology at the University of Nottingham (Malaysia campus). His work centres on cognitions, emotions and behaviours associated with people’s awareness of their own (and others’) social status.
Maas Misha’ari Weerabangsa is a PhD student at the University of Nottingham. Her work centres on the lay hunchback heuristic of emotional attributions and she investigates this topic with Chuma Owuamalam.
Jaya Kumar Karunagharan holds an MSc in genetics and is currently a PhD student at the University of Nottingham. Jaya is interested in social anxieties within the classroom and examines this issue with Chuma Owuamalam. Jaya maintains an active interest in emotional regulation.
Mark Rubin is a senior lecturer in social psychology at the University of Newcastle, Australia. He is best known for his work on social identity and intergroup relations, including research on in-group identification, intergroup contact, perceived group variability and stereotyping.
PUBLIC INTEREST STATEMENTIn 2015, German Youtubers “Dit Is Normaal” disguised a copy of the Bible as the Qur’an and read some of its extreme contents to ordinary citizens at locations in Germany. They found that people were repulsed and viewed the excerpts they heard as extremely violent and barbaric, but softened their views when they learnt the verses were in fact from the Bible. Unbeknownst to these pranksters, their experiment unearthed what appears to be a fundamental heuristic that people use in their social judgements—the tendency to associate anger and violent conduct with low social status, and calm with high status. We refer to this phenomenon as the hunchback stereotype and provide the first rigorous test of its existence in a culture where the licence to display anger is presumed to be reserved for those in elevated positions. We further show that racial prejudice isn’t necessarily responsible for this phenomenon.
Received: 12 April 2016Accepted: 06 July 2016First Published: 10 July 2016
© 2016 The Author(s). This open access article is distributed under a Creative Commons Attribution (CC-BY) 4.0 license.
Page 2 of 26
Page 3 of 26
Owuamalam et al., Cogent Psychology (2016), 3: 1210998http://dx.doi.org/10.1080/23311908.2016.1210998
Subjects: Behavioral Sciences; Politics & International Relations; Social Sciences
Keywords: hunchback stereotypes; Malaysia; identity; prejudice; social status
1. IntroductionPeople with this “chip on the shoulder” syndrome may react quietly with a “hurt feelings” attitude or maybe in a violent burst of emotion.
• Jim Lord (2016, our emphasis).
A “chip on the shoulder” is the expression often used to describe individuals with a sense of con-tinuing frustration over mistreatment from others and, as the opening quote illustrates, people who feel this way are expected to vent their frustration via anger. Evidence abound regarding the wide-spread use of this assumption across societies, both in the West (e.g. the French’s avoir une crotte sur le cœur) and also in the East (e.g. the Chinese 愤恨不平 [fèn fèn bù ping]; and the Indo-Malay idiom sakit hati; cf. Rees & Silove, 2011). Although these expressions are ostensibly used for people who are aggrieved in some way, there are indications that the link they make between frustration and proneness to anger is more often directed towards groups that occupy low social status or are dehumanised in some way. In the United Kingdom, for instance, youths from lower social class back-grounds are perceived as chavs—a term with connotations of disadvantage, frustration and violent conduct (Jones, 2012; Loughnan, Haslam, Sutton, & Spencer, 2014). Similarly, folk beliefs in parts of Western Africa assume that people with a hunchback (a dehumanised demographic; Akosah-Sarpong, 2008) are so afflicted due to cumulated frustration in a previous life, which predisposes them to outbursts of anger (Owuamalam, Weerabangsa, Mamdouh, Karunagharan, & Rubin, 2014). Even a Google search for “angry” with a wildcard returns several hits that more directly associate members of undervalued or stereotyped groups in society with anger: e.g. “the angry black woman”, “the angry black man”, “the angry feminist”, “the angry wife”, “angry nerd” and so on.
Inspired by the Western African lay beliefs about the hunched back, we use the term hunchback stereotype to describe the tendency for people to associate anger with low social status based on the presumption that members of such groups are likely to encounter more frustrating situations and are therefore more likely to vent this frustration. Extending this reasoning, then, people from privileged backgrounds may be associated with calm even in the face of adversity, because being calm is a demeanour thought to be necessary to achieve goals, and those in elevated positions should act in this way in order for their perceived competence to manifest (Tablante, Durante, & Fiske, in press).
Surprisingly, despite the anecdotal pointers to the existence of a hunchback stereotype as a fun-damental heuristic in the judgements of the anger and calm of people with a low or high status, not a single empirical study has documented the reality of its existence. It is important to establish whether people use a hunchback heuristic in their inferences about which people are or aren’t nor-mally expressive of anger, because (a) anger is a threat inducing emotion, (b) people who feel threatened generally engage a defensive “fight” response and (c) a “fight” response can often have detrimental consequences for the intended targets of this behaviour, as seen in recent fatal shoot-ings of young Black men in North America by law enforcement officers (CNN News Report, 2014; Lowery, 2016; McLaughlin, 2015).
1.1. Is there a basis for the hunchback stereotype?Several theories exist on the basis of which one can infer the existence of a hunchback stereotype. According to the stereotype content model (SCM; Fiske, Cuddy, Glick, & Xu, 2002), lay perceivers of-ten assign the “incompetence” label to members of low status groups due to a presumed inability to overcome difficulties and, by extension, those who are frustrated can be expected to vent this emo-tion: a conclusion that even the lay frustration-aggression theories put forward by Berkowitz (1989) and by Carlsmith, Wilson, and Gilbert (2008) agree with. Likewise, individuals who occupy a high
Page 4 of 26
Owuamalam et al., Cogent Psychology (2016), 3: 1210998http://dx.doi.org/10.1080/23311908.2016.1210998
social status are expected to be competent, even when faced with difficult situations and being calm (or cold) is thought to be a state necessary for the competence expected of them to shine through (cf. Tablante et al., in press). In short the SCM predicts the hunchback stereotype in relation to anger and calm attributions to low and high status groups, respectively.
Other theoretical formulations of status-based emotional expressivity, such as those proposed by Keltner, Gruenfeld, and Anderson (2003), also concur with the SCM, in that they explicitly associate negative emotions (e.g. anger) with low social status, and positive emotions (e.g. calm) with high social status. The reason for these associations is also traceable to the broad premise underlying the hunchback stereotype: members of low status groups encounter frustration more, while their higher status counterparts feel satisfied and content with the privileges bestowed by their elevated posi-tion. A proposition that resonates with the well-documented halo effect (Nisbett & Wilson, 1977): the tendency for people to associate undesirable traits to less attractive people (or those who are low in status) compared to their more attractive counterparts (or those who are high in status). Only that we extend this logic to the context of emotional attributions.
1.2. Are there reasons for these propositions?The extant literature on anger attributions has focused largely on the racial context involving the re-lationship between Blacks (undervalued group) and Whites (advantaged group). Findings from these investigations show that people expect Blacks to be angrier than Whites (Hutchings & Haddock, 2008); are quicker to associate Blacks with threat compared to Whites (Correll, Urland, & Ito, 2006), even when these Black targets are merely children (Goff, Jackson, Di Leone, Culotta, & DiTomasso, 2014). Perceivers are also unable to distinguish angry and happy Black targets, despite a clear differentiation between happy and angry faces when the object of evaluation is White (Shapiro et al., 2009). Although these previous contributions are notable, they often allude to prejudice against Blacks as the primary (even sole) explanation for the association of the threat-inducing emotion of anger to Blacks relative to Whites despite the mixed evidence in the literature. For example, studies have shown that implicit racial biases predict the association of anger to Blacks (Ackerman et al., 2006)—and other racially threatening out-groups (e.g. Middle-Eastern Arabs) even at the neural level (Fleming, Bandy, & Kimble, 2010). However, a large-scale study comparing racial bias in fatal shootings across counties in the United States found that indicators of racial prejudice (e.g. racist norms, and racial assaults) were not reliable predictors of the differences in the greater threat appraisals (and consequent shooting) of ethnic minorities relative to Whites. Interestingly, Ross (2015) found that proxies of social status (such as the median income) were consistent and reliable predictors of racial bias in police shootings.
Notably, these previous studies fail to directly test the complementary assumption that higher status groups are associated with calm: assuming that calm is necessarily the opposite of anger, and that a positive effect on anger would always mean a negative effect on calm. Also, participants in majority of the studies within the “Black threat” paradigm conducted in the West (typically the US) are often Whites. Such a paradigm makes it likely that the effects observed in those studies could have resulted from the tendency to favour one’s own group on evaluative judgements by excusing one’s in-group from the image-tainting bestial (negative) emotions of anger (Tajfel, Billig, Bundy, & Flament, 1971). After all, evidence shows that bestial non-uniquely human emotions (like anger) are generally reserved for out-groups, not the in-group (Leyens et al., 2000).
To address these issues, we treated calm as a separate emotional dimension relevant to the hunchback stereotype because people can be angry, but could also chose to either restrain an ex-pression of this emotion (i.e. calm) or to display it (i.e. rage) as the opening quote suggests. Specifically, we propose that the association of anger to low status is not restricted to the racial context of Blacks vs. Whites and, that lay perceivers would attribute anger to targets that signal a low status position and calm to targets that signal high status. Unlike the previous studies that have largely been conducted in the West, we situate our research in a different (collectivistic) cul-tural context in South-East Asia (Malaysia), testing the predictions derived from the hunchback stereotype in a third-party group that is unconnected to the interstatus context being evaluated.
Page 5 of 26
Owuamalam et al., Cogent Psychology (2016), 3: 1210998http://dx.doi.org/10.1080/23311908.2016.1210998
The cultural dimension is important in the light of recent suggestions of a collectivistic cultural creed permitting only those with power and authority to display anger (Park et al., 2013). Thus, demonstrating that the hunchback heuristic is applicable even in a collectivistic culture would pro-vide conclusive evidence of its existence rather than a biased test of it.
2. Study 1This study was designed to generate stimuli that are fit for a rigorous test of the hunchback stereo-type in the light of the methodological difficulties in previous research. For example, research on status-based emotional attributions has largely relied on an “imagination” paradigm in which par-ticipants are required to evaluate ‘unseen’ exemplars of high and low status group members based on a short written biography (e.g. Tiedens, Ellsworth, & Mesquita, 2000). Although this approach has the potential to produce strong “stereotype effects” due to the limited information on which perceiv-ers are required to make their judgements, it nonetheless increases the possibility that judgements are based on category prototypes that may not adequately capture intra-category diversity. This makes it uncertain whether stereotypes that are tied to category prototypes also have a wider ap-plication to other members that do not neatly fit the “typical” member. Similarly, other approaches that have utilised a facial stimulus approach, using single images that are then manipulated to represent one group or the other (e.g. Fleming et al., 2010), do not address the diversity issue. Here, we adopt a multiple facial stimuli approach by generating a series of images for each category within the two interstatus contexts (skin-shade and race) to be sure that judgements are closer to the intended phenomenon in the real world.
Given the widespread preference for light skin compared to dark skin in South Asia and South-East Asia (Leong, 2006; Nadeem, 2014), we reasoned that people would accord high social status to those with a light skin than to those with a dark skin. This distinction is most prominent amongst the Indian ethnic group in Malaysia and we capitalised on this existing difference within the same racial group to control for possible differences due to inter-racial variability. We also selected a further in-terstatus context, concerning the historical relations between Blacks and Whites, in which the for-mer social category is often perceived as undervalued relative to the latter one (Kluegel, 1990). Assuming our assumption that the social categories within these two interstatus contexts signal low and high status is correct, then light-skinned Indians should be seen as higher in status compared to dark-skinned Indians, and also Whites should be perceived as higher in status compared to Blacks. Given the present focus on facial images, we further reasoned that participants’ status rankings would likely be based on the extent to which they consider the images to be attractive. Consequently, we anticipated that status judgements would be positively related to the degree to which they con-sider images within each category to be attractive.
2.1. Method
2.1.1. EthicsThe programme of research reported in this paper received ethics approval from the Science and Engineering Research Ethics Committee (SEREC) at the University of Nottingham’s Malaysia campus. We adhered strictly to the ethical protocol enshrined in the British Psychological Society’s directive for the conduct of research involving human subjects. All participants provided informed consent digitally via Qualtrics’ online survey suite.
2.1.2. ParticipantsThirty Malaysian students at the University of Nottingham’s Malaysia campus who responded to an email advert that was sent via the students’ mailing list took part in this study (10 were men and 20 were women, Mage = 21.13, SDage = 2.45). Participants were compensated with RM5 (approximately US$1.5) for their time.
Page 6 of 26
Owuamalam et al., Cogent Psychology (2016), 3: 1210998http://dx.doi.org/10.1080/23311908.2016.1210998
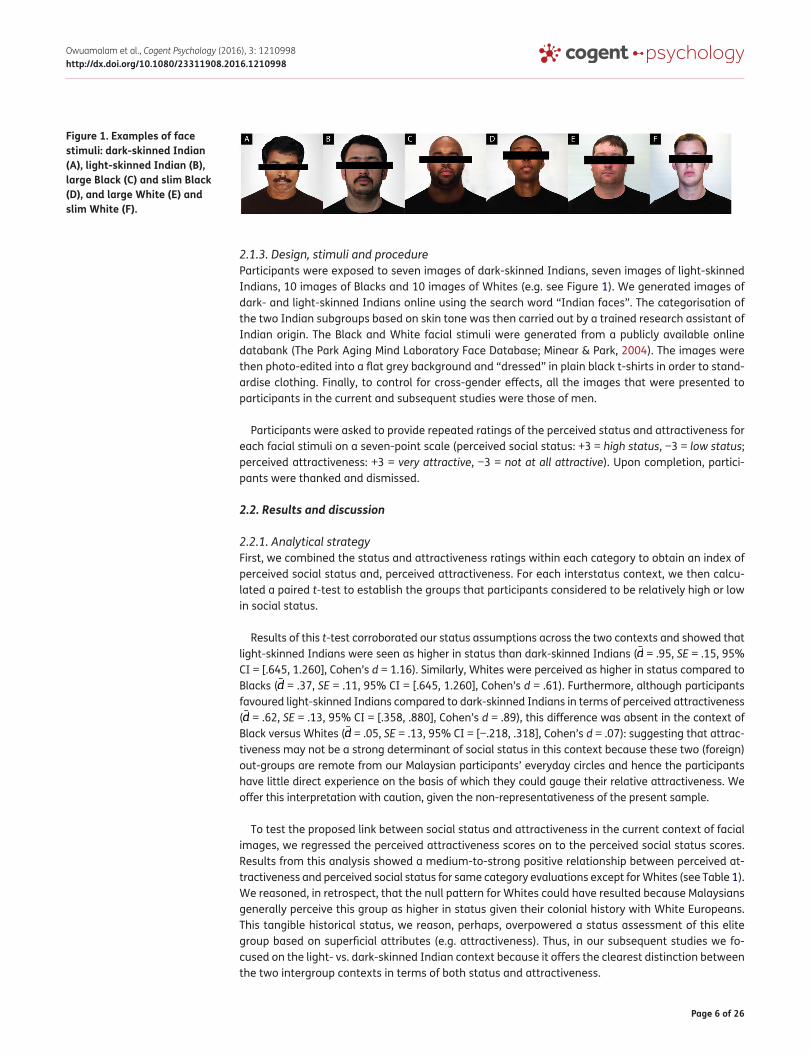
2.1.3. Design, stimuli and procedureParticipants were exposed to seven images of dark-skinned Indians, seven images of light-skinned Indians, 10 images of Blacks and 10 images of Whites (e.g. see Figure 1). We generated images of dark- and light-skinned Indians online using the search word “Indian faces”. The categorisation of the two Indian subgroups based on skin tone was then carried out by a trained research assistant of Indian origin. The Black and White facial stimuli were generated from a publicly available online databank (The Park Aging Mind Laboratory Face Database; Minear & Park, 2004). The images were then photo-edited into a flat grey background and “dressed” in plain black t-shirts in order to stand-ardise clothing. Finally, to control for cross-gender effects, all the images that were presented to participants in the current and subsequent studies were those of men.
Participants were asked to provide repeated ratings of the perceived status and attractiveness for each facial stimuli on a seven-point scale (perceived social status: +3 = high status, −3 = low status; perceived attractiveness: +3 = very attractive, −3 = not at all attractive). Upon completion, partici-pants were thanked and dismissed.
2.2. Results and discussion
2.2.1. Analytical strategyFirst, we combined the status and attractiveness ratings within each category to obtain an index of perceived social status and, perceived attractiveness. For each interstatus context, we then calcu-lated a paired t-test to establish the groups that participants considered to be relatively high or low in social status.
Results of this t-test corroborated our status assumptions across the two contexts and showed that light-skinned Indians were seen as higher in status than dark-skinned Indians (d̄ = .95, SE = .15, 95% CI = [.645, 1.260], Cohen’s d = 1.16). Similarly, Whites were perceived as higher in status compared to Blacks (d̄ = .37, SE = .11, 95% CI = [.645, 1.260], Cohen’s d = .61). Furthermore, although participants favoured light-skinned Indians compared to dark-skinned Indians in terms of perceived attractiveness (d̄ = .62, SE = .13, 95% CI = [.358, .880], Cohen’s d = .89), this difference was absent in the context of Black versus Whites (d̄ = .05, SE = .13, 95% CI = [−.218, .318], Cohen’s d = .07): suggesting that attrac-tiveness may not be a strong determinant of social status in this context because these two (foreign) out-groups are remote from our Malaysian participants’ everyday circles and hence the participants have little direct experience on the basis of which they could gauge their relative attractiveness. We offer this interpretation with caution, given the non-representativeness of the present sample.
To test the proposed link between social status and attractiveness in the current context of facial images, we regressed the perceived attractiveness scores on to the perceived social status scores. Results from this analysis showed a medium-to-strong positive relationship between perceived at-tractiveness and perceived social status for same category evaluations except for Whites (see Table 1). We reasoned, in retrospect, that the null pattern for Whites could have resulted because Malaysians generally perceive this group as higher in status given their colonial history with White Europeans. This tangible historical status, we reason, perhaps, overpowered a status assessment of this elite group based on superficial attributes (e.g. attractiveness). Thus, in our subsequent studies we fo-cused on the light- vs. dark-skinned Indian context because it offers the clearest distinction between the two intergroup contexts in terms of both status and attractiveness.
Figure 1. Examples of face stimuli: dark-skinned Indian (A), light-skinned Indian (B), large Black (C) and slim Black (D), and large White (E) and slim White (F).
Page 7 of 26
Owuamalam et al., Cogent Psychology (2016), 3: 1210998http://dx.doi.org/10.1080/23311908.2016.1210998
3. Study 2In this study, we aimed to demonstrate that a flimsy status signal such as skin shade elicits greater attributions of anger to darker-skinned Indians and calm to lighter skinned Indians. Previous inves-tigations have often focused on the emotional perceptions of members of groups that are involved in the interstatus context being evaluated (e.g. White participants making judgements of the emo-tional states of Whites vs. Blacks) with the potential for inter-category biases favouring one’s own group relative to the out-group (Tajfel et al., 1971). This is important in the light of the literature on infrahumanisation showing a tendency for people to attribute bestial (often negative) emotions to out-groups while reserving uniquely human (often secondary positive emotions such as calm) to the in-group (Leyens et al., 2000). Therefore, in the current study we focused on the emotional attribu-tions of a third-party group (Chinese Malaysians) who are unconnected to the social category (light- and dark-skinned Indians) that would constitute the subject of their anger and calm attributions.
Furthermore, to circumvent the issue of methodological consistency, especially given the mixed evidence often obtained in studies adopting a cognitive approach (e.g. the Implicit Association Task [IAT]-Greenwald, McGhee, & Schwartz, 1998) to those adopting a self-report approach, we combined both implicit and explicit measurements to be sure of the robustness of the predicted patterns. After all, different methods of accessing the same underlying psychological phenomenon should produce similar effects on the intended outcome (Jost et al., 2012). If the hunchback stereotype exists, then it should take people less time to respond to a category/emotion pairing that is congruent to (or agrees with) the hunchback stereotype than to a category/emotion pairing that isn’t, because cogni-tive processing tends to be quicker when information pairs are consistent than when they are not (MacLeod, 1991). Thus, to find evidence for the existence of a hunchback stereotype at the implicit (unconscious) level, people should be quicker in responding to a hunchback congruent pairing in which a dark-skinned Indian is paired with the emotion word ANGER and a light-skinned Indian is paired with CALM, compared to a hunchback inconsistent pairing in which a dark-skinned Indian is paired with CALM and a light-skinned Indian is paired with ANGER. We expected this effect to occur because perceivers should take less time to verify representations that conform to established ste-reotypes relative to those that do not (see Carreiras, Garnham, Oakhill, & Cain, 1996).
On the explicit measures, we expected greater anger attributions to dark-skinned versus light-skinned Indians and, greater calm attributions to light-skinned versus dark-skinned Indians. Given the focus on facial images, combined with the positive link between status and attractiveness that we established in Study 1, we further anticipated a link between anger/calm attributions and per-ceived attractiveness: those images that elicit strong attractiveness should be associated with less anger and greater calm.
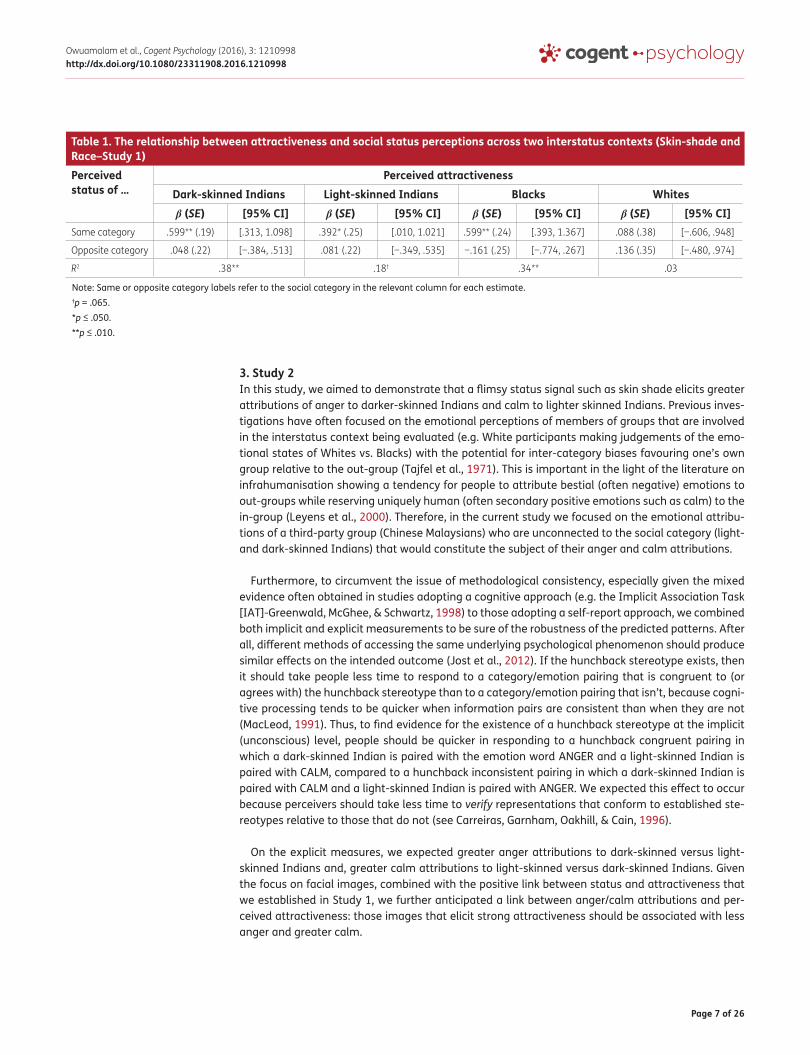
Table 1. The relationship between attractiveness and social status perceptions across two interstatus contexts (Skin-shade and Race–Study 1)
Note: Same or opposite category labels refer to the social category in the relevant column for each estimate.†p = .065.*p ≤ .050.**p ≤ .010.
Perceived status of …
Perceived attractivenessDark-skinned Indians Light-skinned Indians Blacks Whitesβ (SE) [95% CI] β (SE) [95% CI] β (SE) [95% CI] β (SE) [95% CI]
Same category .599** (.19) [.313, 1.098] .392* (.25) [.010, 1.021] .599** (.24) [.393, 1.367] .088 (.38) [−.606, .948]
Opposite category .048 (.22) [−.384, .513] .081 (.22) [−.349, .535] −.161 (.25) [−.774, .267] .136 (.35) [−.480, .974]
R2 .38** .18† .34** .03
Page 8 of 26
Owuamalam et al., Cogent Psychology (2016), 3: 1210998http://dx.doi.org/10.1080/23311908.2016.1210998
3.1. Method
3.1.1. ParticipantsEighty Chinese Malaysian participants at the University of Nottingham’s Malaysia campus were re-cruited opportunistically to take part in the study (41 men and 39 women; Mage = 20.89, SD = 1.58). They were offered candies as compensation for their time.
3.1.2. Design and procedureThe experiment was comprised of two parts: a cognition probe task (CPT) that is similar to the tradi-tional IAT set-up, and an explicit self-report component in which participants completed repeated measurements of anger and calm for a series of light- and dark-skinned Indian faces.
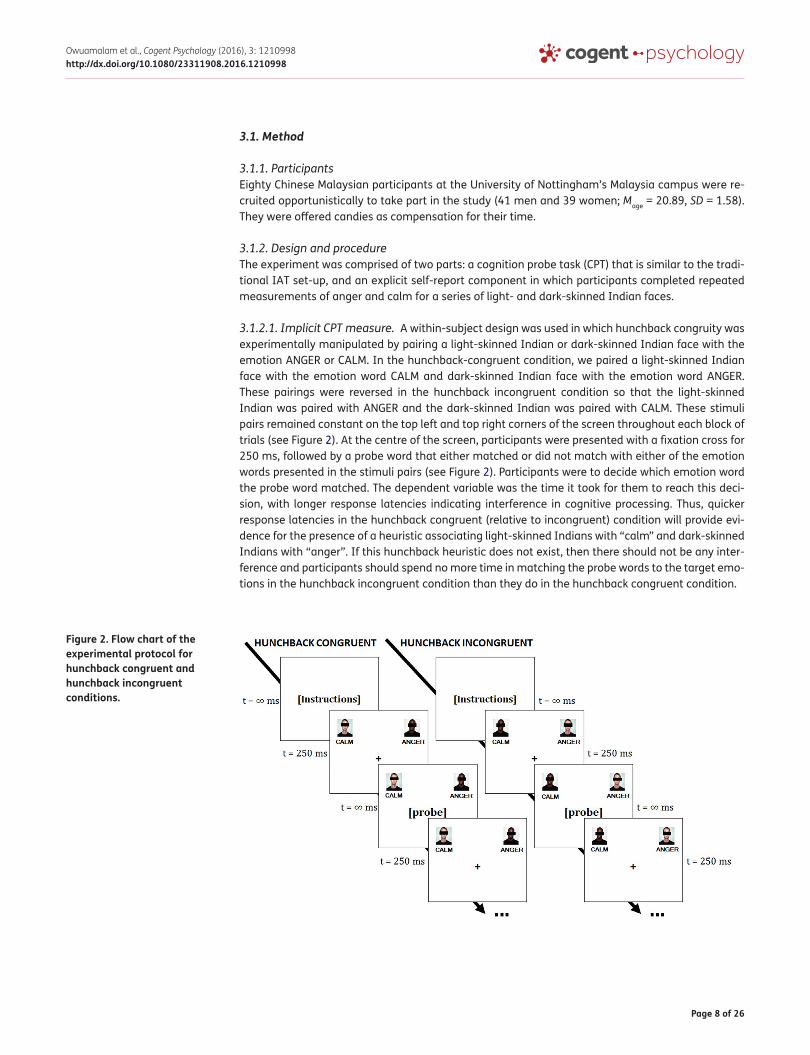
3.1.2.1. Implicit CPT measure. A within-subject design was used in which hunchback congruity was experimentally manipulated by pairing a light-skinned Indian or dark-skinned Indian face with the emotion ANGER or CALM. In the hunchback-congruent condition, we paired a light-skinned Indian face with the emotion word CALM and dark-skinned Indian face with the emotion word ANGER. These pairings were reversed in the hunchback incongruent condition so that the light-skinned Indian was paired with ANGER and the dark-skinned Indian was paired with CALM. These stimuli pairs remained constant on the top left and top right corners of the screen throughout each block of trials (see Figure 2). At the centre of the screen, participants were presented with a fixation cross for 250 ms, followed by a probe word that either matched or did not match with either of the emotion words presented in the stimuli pairs (see Figure 2). Participants were to decide which emotion word the probe word matched. The dependent variable was the time it took for them to reach this deci-sion, with longer response latencies indicating interference in cognitive processing. Thus, quicker response latencies in the hunchback congruent (relative to incongruent) condition will provide evi-dence for the presence of a heuristic associating light-skinned Indians with “calm” and dark-skinned Indians with “anger”. If this hunchback heuristic does not exist, then there should not be any inter-ference and participants should spend no more time in matching the probe words to the target emo-tions in the hunchback incongruent condition than they do in the hunchback congruent condition.
Figure 2. Flow chart of the experimental protocol for hunchback congruent and hunchback incongruent conditions.
Page 9 of 26
Owuamalam et al., Cogent Psychology (2016), 3: 1210998http://dx.doi.org/10.1080/23311908.2016.1210998
3.1.2.2. Explicit (self-report) measures. We used a within-subjects design in which participants pro-vided repeated anger and calm ratings in relation to light-skinned and dark-skinned Indian faces. The dependent variable was participants’ responses to scale items for each light-skinned and dark-skinned Indian, which asked them how angry- and calm-looking each face was. Responses were provided on a seven-point scale (−3 = not at all angry-looking, +3 = very angry-looking; −3 = not at all calm-looking, +3 = very calm-looking). Participants also provided their judgements of the attractive-ness of each target (−3 = not at all attractive-looking, +3 = very attractive-looking), assuming that more attractive faces signal higher social status (see Owuamalam, Wong, & Rubin, 2016 for a similar use of attractiveness as an index of social status in a face stimuli paradigm).
3.1.3. Stimuli and apparatusWe used the same 7 “light-skinned” and 7 “darker-skinned” Indian faces that we generated in Study 1, which were then photo-edited into a flat grey background and “dressed” in plain black t-shirts. One light-skinned and 1 dark-skinned Indian faces were used in the CPT protocol; the other six were used in the explicit self-report measurements. We used 20 probe-word stimuli (10 were anger-asso-ciated, and the other 10 were calm-associated, see Appendix A; Nelson, McEvoy, & Schreiber, 2004). The CPT protocol was presented using Psychopy 1.70 (Peirce, 2007), while the explicit self-report ratings were presented via Qualtrics—an online survey suite.
3.2. Results and discussion
3.2.1. Status awareness checkTo establish that participants perceived light-skinned Indians in the current study as high in status (in terms of physical attractiveness), we ran a paired t-test in which the difference between per-ceived attractiveness for the two groups was calculated. Results corroborated the evidence in Study 1 and showed that light-skinned Indians were perceived to be higher in status (more attractive) than dark-skinned Indians, t (77) = −8.84, p < .0001, (d̄ = .68, SE = .08, 95% CI = [.526, .833], Cohen’s d = 1.00).
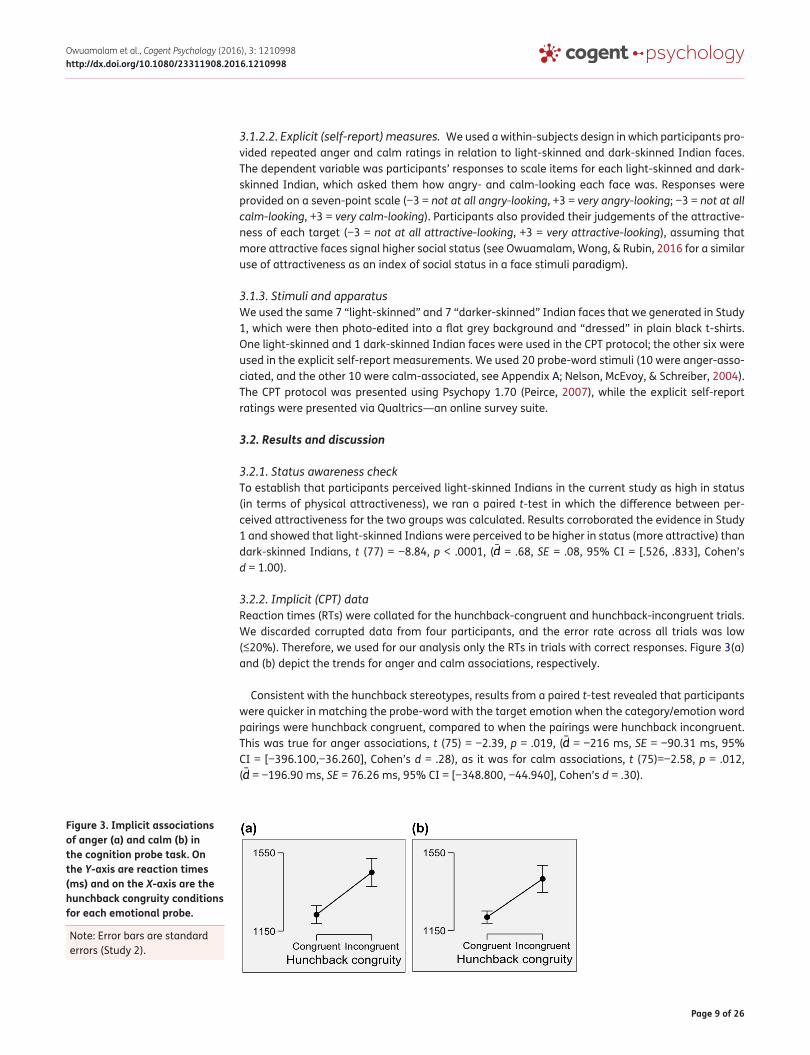
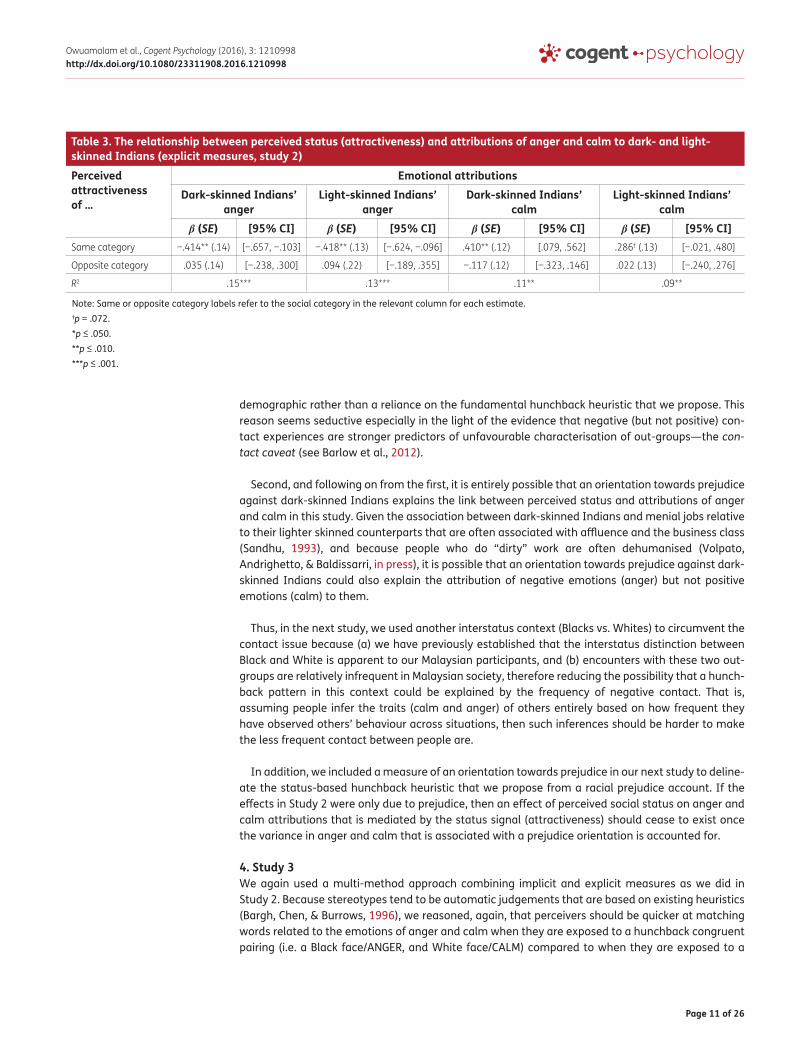
3.2.2. Implicit (CPT) dataReaction times (RTs) were collated for the hunchback-congruent and hunchback-incongruent trials. We discarded corrupted data from four participants, and the error rate across all trials was low (≤20%). Therefore, we used for our analysis only the RTs in trials with correct responses. Figure 3(a) and (b) depict the trends for anger and calm associations, respectively.
Consistent with the hunchback stereotypes, results from a paired t-test revealed that participants were quicker in matching the probe-word with the target emotion when the category/emotion word pairings were hunchback congruent, compared to when the pairings were hunchback incongruent. This was true for anger associations, t (75) = −2.39, p = .019, (d̄ = −216 ms, SE = −90.31 ms, 95% CI = [−396.100,−36.260], Cohen’s d = .28), as it was for calm associations, t (75)=−2.58, p = .012, (d̄ = −196.90 ms, SE = 76.26 ms, 95% CI = [−348.800, −44.940], Cohen’s d = .30).
Figure 3. Implicit associations of anger (a) and calm (b) in the cognition probe task. On the Y-axis are reaction times (ms) and on the X-axis are the hunchback congruity conditions for each emotional probe.
Note: Error bars are standard errors (Study 2).
Page 10 of 26
Owuamalam et al., Cogent Psychology (2016), 3: 1210998http://dx.doi.org/10.1080/23311908.2016.1210998
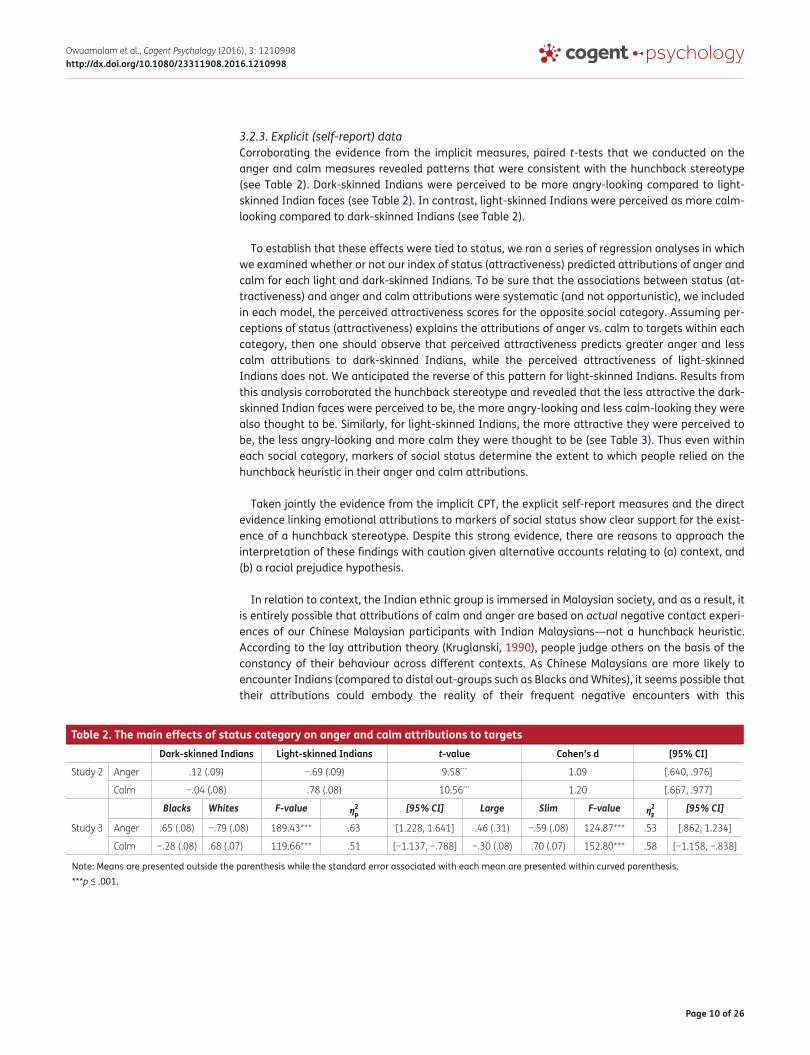
3.2.3. Explicit (self-report) dataCorroborating the evidence from the implicit measures, paired t-tests that we conducted on the anger and calm measures revealed patterns that were consistent with the hunchback stereotype (see Table 2). Dark-skinned Indians were perceived to be more angry-looking compared to light-skinned Indian faces (see Table 2). In contrast, light-skinned Indians were perceived as more calm-looking compared to dark-skinned Indians (see Table 2).
To establish that these effects were tied to status, we ran a series of regression analyses in which we examined whether or not our index of status (attractiveness) predicted attributions of anger and calm for each light and dark-skinned Indians. To be sure that the associations between status (at-tractiveness) and anger and calm attributions were systematic (and not opportunistic), we included in each model, the perceived attractiveness scores for the opposite social category. Assuming per-ceptions of status (attractiveness) explains the attributions of anger vs. calm to targets within each category, then one should observe that perceived attractiveness predicts greater anger and less calm attributions to dark-skinned Indians, while the perceived attractiveness of light-skinned Indians does not. We anticipated the reverse of this pattern for light-skinned Indians. Results from this analysis corroborated the hunchback stereotype and revealed that the less attractive the dark-skinned Indian faces were perceived to be, the more angry-looking and less calm-looking they were also thought to be. Similarly, for light-skinned Indians, the more attractive they were perceived to be, the less angry-looking and more calm they were thought to be (see Table 3). Thus even within each social category, markers of social status determine the extent to which people relied on the hunchback heuristic in their anger and calm attributions.
Taken jointly the evidence from the implicit CPT, the explicit self-report measures and the direct evidence linking emotional attributions to markers of social status show clear support for the exist-ence of a hunchback stereotype. Despite this strong evidence, there are reasons to approach the interpretation of these findings with caution given alternative accounts relating to (a) context, and (b) a racial prejudice hypothesis.
In relation to context, the Indian ethnic group is immersed in Malaysian society, and as a result, it is entirely possible that attributions of calm and anger are based on actual negative contact experi-ences of our Chinese Malaysian participants with Indian Malaysians—not a hunchback heuristic. According to the lay attribution theory (Kruglanski, 1990), people judge others on the basis of the constancy of their behaviour across different contexts. As Chinese Malaysians are more likely to encounter Indians (compared to distal out-groups such as Blacks and Whites), it seems possible that their attributions could embody the reality of their frequent negative encounters with this
Table 2. The main effects of status category on anger and calm attributions to targets
Note: Means are presented outside the parenthesis while the standard error associated with each mean are presented within curved parenthesis.***p ≤ .001.
Dark-skinned Indians Light-skinned Indians t-value Cohen’s d [95% CI]
Study 2 Anger .12 (.09) −.69 (.09) 9.58*** 1.09 [.640, .976]
Calm −.04 (.08) .78 (.08) 10.56*** 1.20 [.667, .977]
Blacks Whites F-value �2p
[95% CI] Large Slim F-value �2p
[95% CI]
Study 3 Anger .65 (.08) −.79 (.08) 189.43*** .63 [1.228, 1.641] .46 (.31) −.59 (.08) 124.87*** .53 [.862, 1.234]
Calm −.28 (.08) .68 (.07) 119.66*** .51 [−1.137, −.788] −.30 (.08) .70 (.07) 152.80*** .58 [−1.158, −.838]
Page 11 of 26
Owuamalam et al., Cogent Psychology (2016), 3: 1210998http://dx.doi.org/10.1080/23311908.2016.1210998
demographic rather than a reliance on the fundamental hunchback heuristic that we propose. This reason seems seductive especially in the light of the evidence that negative (but not positive) con-tact experiences are stronger predictors of unfavourable characterisation of out-groups—the con-tact caveat (see Barlow et al., 2012).
Second, and following on from the first, it is entirely possible that an orientation towards prejudice against dark-skinned Indians explains the link between perceived status and attributions of anger and calm in this study. Given the association between dark-skinned Indians and menial jobs relative to their lighter skinned counterparts that are often associated with affluence and the business class (Sandhu, 1993), and because people who do “dirty” work are often dehumanised (Volpato, Andrighetto, & Baldissarri, in press), it is possible that an orientation towards prejudice against dark-skinned Indians could also explain the attribution of negative emotions (anger) but not positive emotions (calm) to them.
Thus, in the next study, we used another interstatus context (Blacks vs. Whites) to circumvent the contact issue because (a) we have previously established that the interstatus distinction between Black and White is apparent to our Malaysian participants, and (b) encounters with these two out-groups are relatively infrequent in Malaysian society, therefore reducing the possibility that a hunch-back pattern in this context could be explained by the frequency of negative contact. That is, assuming people infer the traits (calm and anger) of others entirely based on how frequent they have observed others’ behaviour across situations, then such inferences should be harder to make the less frequent contact between people are.
In addition, we included a measure of an orientation towards prejudice in our next study to deline-ate the status-based hunchback heuristic that we propose from a racial prejudice account. If the effects in Study 2 were only due to prejudice, then an effect of perceived social status on anger and calm attributions that is mediated by the status signal (attractiveness) should cease to exist once the variance in anger and calm that is associated with a prejudice orientation is accounted for.
4. Study 3We again used a multi-method approach combining implicit and explicit measures as we did in Study 2. Because stereotypes tend to be automatic judgements that are based on existing heuristics (Bargh, Chen, & Burrows, 1996), we reasoned, again, that perceivers should be quicker at matching words related to the emotions of anger and calm when they are exposed to a hunchback congruent pairing (i.e. a Black face/ANGER, and White face/CALM) compared to when they are exposed to a
Table 3. The relationship between perceived status (attractiveness) and attributions of anger and calm to dark- and light-skinned Indians (explicit measures, study 2)
Note: Same or opposite category labels refer to the social category in the relevant column for each estimate.†p = .072.*p ≤ .050.**p ≤ .010.***p ≤ .001.
Perceived attractiveness of …
Emotional attributionsDark-skinned Indians’
angerLight-skinned Indians’
angerDark-skinned Indians’
calmLight-skinned Indians’
calmβ (SE) [95% CI] β (SE) [95% CI] β (SE) [95% CI] β (SE) [95% CI]
Same category −.414** (.14) [−.657, −.103] −.418** (.13) [−.624, −.096] .410** (.12) [.079, .562] .286† (.13) [−.021, .480]
Opposite category .035 (.14) [−.238, .300] .094 (.22) [−.189, .355] −.117 (.12) [−.323, .146] .022 (.13) [−.240, .276]
R2 .15*** .13*** .11** .09**
Page 12 of 26
Owuamalam et al., Cogent Psychology (2016), 3: 1210998http://dx.doi.org/10.1080/23311908.2016.1210998
hunchback incongruent pairing (i.e. a White face/ANGER, and Black face/CALM). We expected the same patterns that we observed on the explicit measures in Study 2 to also manifest here.
Additionally, we embedded another social category within the images of Blacks and Whites which related to the perceived physical sizes of the targets in terms of whether they are large or slim. Previous research has demonstrated that large people are perceived to be lower in social status compared to thin people (Crandall & Schiffhauer, 1998; Durante, Fasolo, Mari, & Mazzola, 2014; Owuamalam, Wong, & Rubin, 2016). If the hunchback pattern is robust then its predictions should also apply to a status category based on physical size: larger targets should be seen as angrier look-ing than slim targets and, slim targets should be seen as calmer looking compared to large targets.
4.1. Method
4.1.1. ParticipantsOne-hundred and fourteen Malaysians at the University of Nottingham’s Malaysia campus took part in this study (36 were men and 78 were women; Mage = 19.40, SD = 1.39). They were recruited via an email advert that was sent using the students’ mailing list at this university. Participants received either course credit or a payment of RM5 (approximately US$1.50) as compensation for their time.
4.1.2. Design and procedureAs in Study 2, the current experiment consisted of two parts: a cognition probe task (CPT) and an explicit self-reported rating of various outcomes including: anger and calm, and two correlates of anger, aggressiveness and dangerousness. The CPT was conducted before the explicit self-report task in order to reduce the salience of anger/calm associations, which might otherwise confound the CPT results.
4.1.2.1. Implicit (CPT) measure. We used an identical protocol to the one described in Study 2. Hunchback congruity was manipulated so that in the hunchback congruent condition, category/emotion-word pairings were White/CALM, Black/ANGER. In the incongruent condition, the pairings were reversed to White/ANGER, Black/CALM. The dependent measure, again, was the time (in ms) that it took participants to match a probe-word to the target emotion of ANGER and CALM while exposed to the hunchback congruent versus incongruent trials.
4.1.2.2. Explicit (self-report) measures. We used a 2 (racial status: Black versus White) × 2 (physical size: large versus slim) repeated measures design in which participants rated the emotions of the faces of Black and White large and slim men. The dependent variables were participants’ responses to scale items that were displayed in random order on screen and that measured the perceived calm and anger of the target faces (for anger: −3 = not at all angry-looking, +3 = very angry-looking; and for calm: −3 = not at all calm-looking,+3 = very calm-looking). Participants then completed a per-ceived status measure on which they made judgements of the social standing of each target within a social category (−3 = lowest status, +3 = highest status). They also gave their judgements of the attractiveness of each target within each social category (−3 = not at all attractive-looking, +3 = very attractive-looking).
4.1.2.2.1. Orientation towards prejudice. Theorists have proposed that the tendency to support social hierarchies and/or to hold ideologies that accept the dominance of certain groups over others causes racial prejudice (Sidanius & Pratto, 2001). For this reason, we measured an orientation to-wards prejudice using an eight-item hierarchy version of the social dominance orientation (SDO) scale, which examines people’s preference for unequal relations between groups. The more people subscribe to this ideology, then, the more likely this orientation towards prejudice should explain the association of anger to low status and calm to high status. An example of items on the SDO scale included “Some groups of people are just more worthy than others”. The reliability of this scale was good, α = .82, 95% CI = [.759, .862].

Page 13 of 26
Owuamalam et al., Cogent Psychology (2016), 3: 1210998http://dx.doi.org/10.1080/23311908.2016.1210998
On an exploratory basis, we also examined whether or not high status formal clothing (versus casual and hoodies) would soften the angry/aggressive perceptions of Black targets (Hayes, Lawless, & Baitinger, 2014). For this reason, some of the targets were photo-edited into formal suits (high status), and others into neutral clothing (plain t-shirt) or hoodies (low status). A hoodie was chosen as a low status clothing item given the association of this sort of clothing to gang subculture and violence (McLean, 2005).
4.1.3. Stimuli and apparatusParticipants were presented with eight emotionally neutral expression male face stimuli that we used in Study 1: four of these were images of Black men (2 large and 2 slim—see examples in Figure 1) and the other four were those of White men (2 large and 2 slim—see examples in Figure 1).
We used the same 20 probe-word stimuli that we used in Study 2 as synonyms of anger (10) and calm (10) in the current study. Although these probe-words produced the hunchback effects, there are still questions about whether the effects only relate to anger/calm associated probe-words, or whether the effects would emerge also on control probe-words that were unconnected to anger and calm. For this reason, we included 10 filler items (e.g. “define”, “maximum”, and “theory”) that we used as controls, reasoning that the hunchback interference should be most visible when the probe-words were associated with the hunchback relevant emotions of anger and calm (see Appendix A for a fuller list of filler items). These additional filler items also allowed us to disguise the experimental hypothesis. As in Study 2, stimuli relating to the cognition probe task were presented via Psychopy 1.70 (Peirce, 2007) while the explicit self-report measures were presented via Qualtrics.
4.2. Results and discussion
4.2.1. Status awareness checkWe computed the difference in perceived social status between race and size groups. As expected, a repeated t-test showed that our Malaysian participants perceived White targets to be higher in social status compared to Black targets (t = 6.18, d̄ = .60, SE = .10, p < .0001, 95% CI = [.408, 793], Cohen’s d = .58). They also perceived slim targets to be higher in status than larger targets (t = 9.75, d̄ = .84, SE = .09, p < .0001, 95% CI = [.671, 1.013], Cohen’s d = .91). However, further analysis re-vealed that the attire manipulation did not neatly differentiate the three attire groups in terms of status and this variable was dropped from a subsequent analysis as a result.
4.2.2. Implicit (CPT) dataWe collated participants’ reaction times in milliseconds for the congruent trials by computing the mean reaction times relating to anger/probe-word associations (anger-congruent) and calm/probe-word associations (calm-congruent). The same procedure was repeated for the incongruent trials, resulting in anger-associated and calm-associated incongruent reaction times.
In a small number of trials (<20% on average), the probe-word was not accurately matched to anger or calm. This error rate was equally distributed between the congruent and incongruent trials for anger (d̄ = 6.03, SE = 4.80, p = .218) and calm (d̄ = 7.35, SE = 4.32, p = .098). Therefore, for each participant, we discarded inaccurate trials, assuming that participants were not paying attention. Hence, we used only reaction times that were related to correct responses.
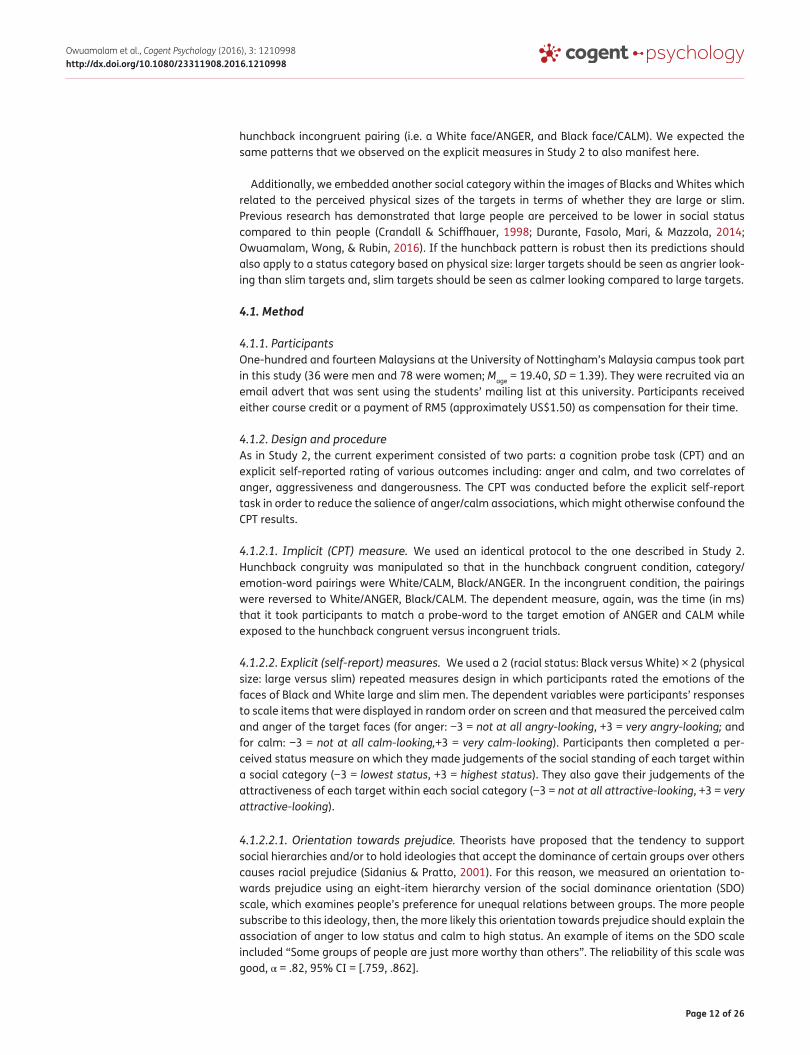
Figure 4(a) and (b) depicts the reaction latencies in the hunchback congruent vs. incongruent conditions for anger and calm. Consistent with the hunchback hypothesis and refuting a criticism based on the contact caveat (Barlow et al., 2012), results from a paired t-test revealed that partici-pants were quicker in their anger associations in the hunchback congruent condition compared to the incongruent condition (t = −5.76, d̄ = −191.68 ms, SE = 33.30 ms, p < .0001, 95% CI = [−257.700, −125.706], Cohen’s d = .54). We also investigated the calm associations and found that participants were also quicker in the congruent trials compared to the incongruent trials (t = −2.12, d̄ = −107.63 ms, SE = 50.67 ms, p = .036, 95% CI = [−208.000, -7.235], Cohen’s d = .20). We did not find any significant differences between the hunchback congruent and incongruent conditions for the filler control
Page 14 of 26
Owuamalam et al., Cogent Psychology (2016), 3: 1210998http://dx.doi.org/10.1080/23311908.2016.1210998
items (t = −.85, d̄ = −41.55 ms, SE = 49.17 ms, p = .400, 95% CI = [-139.000, 55.861], Cohen’s d = .08). Hence, the predicted effects emerged only when people made attributions that were related to the hunchback emotions of calm and anger.
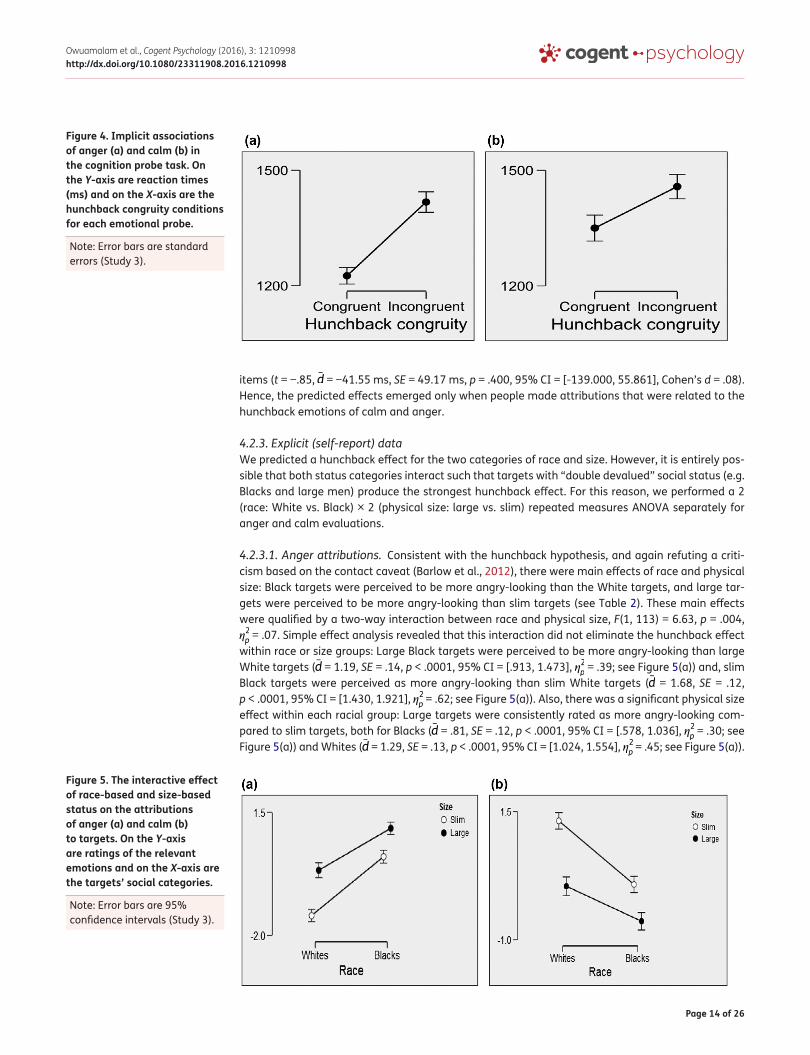
4.2.3. Explicit (self-report) dataWe predicted a hunchback effect for the two categories of race and size. However, it is entirely pos-sible that both status categories interact such that targets with “double devalued” social status (e.g. Blacks and large men) produce the strongest hunchback effect. For this reason, we performed a 2 (race: White vs. Black) × 2 (physical size: large vs. slim) repeated measures ANOVA separately for anger and calm evaluations.
4.2.3.1. Anger attributions. Consistent with the hunchback hypothesis, and again refuting a criti-cism based on the contact caveat (Barlow et al., 2012), there were main effects of race and physical size: Black targets were perceived to be more angry-looking than the White targets, and large tar-gets were perceived to be more angry-looking than slim targets (see Table 2). These main effects were qualified by a two-way interaction between race and physical size, F(1, 113) = 6.63, p = .004, �2
p = .07. Simple effect analysis revealed that this interaction did not eliminate the hunchback effect within race or size groups: Large Black targets were perceived to be more angry-looking than large White targets (d̄ = 1.19, SE = .14, p < .0001, 95% CI = [.913, 1.473], �2p = .39; see Figure 5(a)) and, slim Black targets were perceived as more angry-looking than slim White targets (d̄ = 1.68, SE = .12, p < .0001, 95% CI = [1.430, 1.921], �2p = .62; see Figure 5(a)). Also, there was a significant physical size effect within each racial group: Large targets were consistently rated as more angry-looking com-pared to slim targets, both for Blacks (d̄ = .81, SE = .12, p < .0001, 95% CI = [.578, 1.036], �2p = .30; see Figure 5(a)) and Whites (d̄ = 1.29, SE = .13, p < .0001, 95% CI = [1.024, 1.554], �2p = .45; see Figure 5(a)).
Figure 4. Implicit associations of anger (a) and calm (b) in the cognition probe task. On the Y-axis are reaction times (ms) and on the X-axis are the hunchback congruity conditions for each emotional probe.
Note: Error bars are standard errors (Study 3).
Figure 5. The interactive effect of race-based and size-based status on the attributions of anger (a) and calm (b) to targets. On the Y-axis are ratings of the relevant emotions and on the X-axis are the targets’ social categories.
Note: Error bars are 95% confidence intervals (Study 3).
Page 15 of 26
Owuamalam et al., Cogent Psychology (2016), 3: 1210998http://dx.doi.org/10.1080/23311908.2016.1210998
4.2.3.2. Calm attributions. Consistent with the hunchback hypothesis and contrary to a criticism based on the contact caveat (Barlow et al., 2012), there was a main effect of race in which White faces were perceived as more calm-looking than Black targets (see Table 2). There was also a main effect of size: Slim faces were perceived to be more calm-looking than large faces (see Table 2). Again, a race by physical size interaction emerged, F(1, 113) = 10.32, p = .002, �2p = .08: Slim Whites were perceived as more calm-looking than slim Blacks (d̄ = 1.24, SE = .12, p < .0001, 95% CI = [1.014, 1.469], �2
p = .51; see Figure 5(b)), and large White men were seen as more calm-looking than large Black men
(d̄ = .68, SE = .13, p < .0001, 95% CI = [.423, .945], �2p = .19; see Figure 5(b)). When we investigated the simple effects of size within each racial group, we also found, consistent with the hunchback stereo-type that, slim men were consistently viewed as more calm-looking than their larger counterparts and, this was true for Blacks (d̄ = .72, SE = .11, p < .0001, 95% CI = [.494, .945], �2p = .26; see Figure 5(b)) as it was for Whites (d̄ = 1.28, SE = .12, p < .0001, 95% CI = [1.033, 1.520], �2p = .49; see Figure 5(b)).
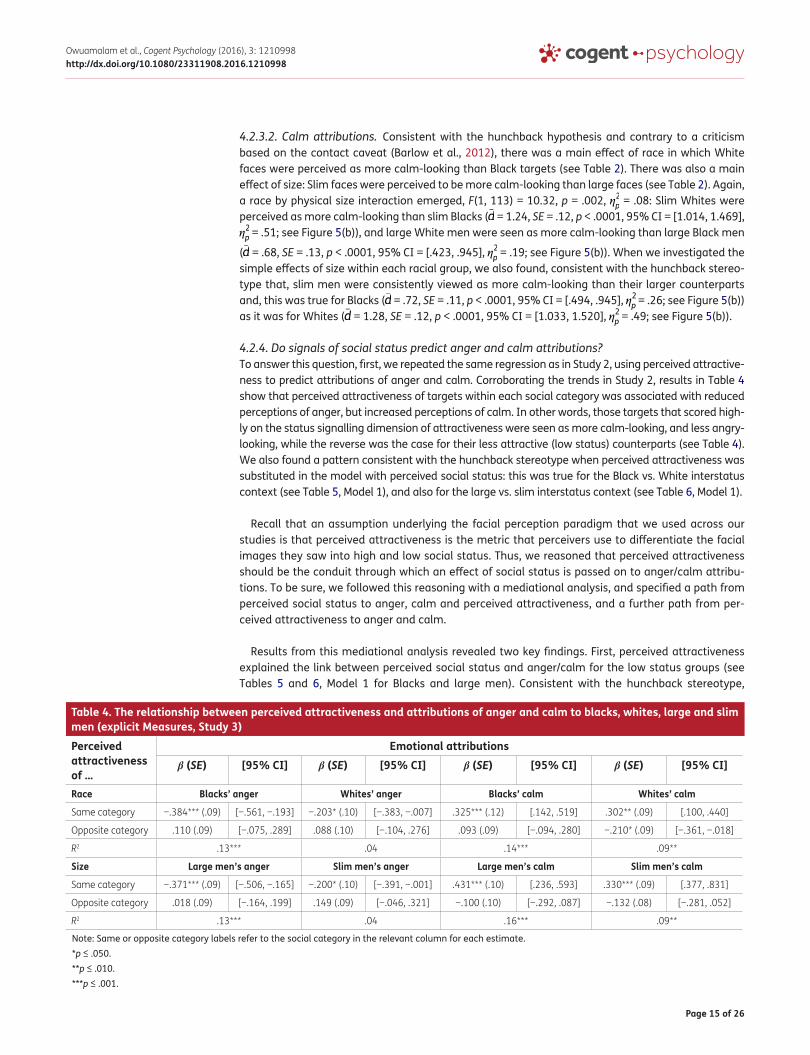
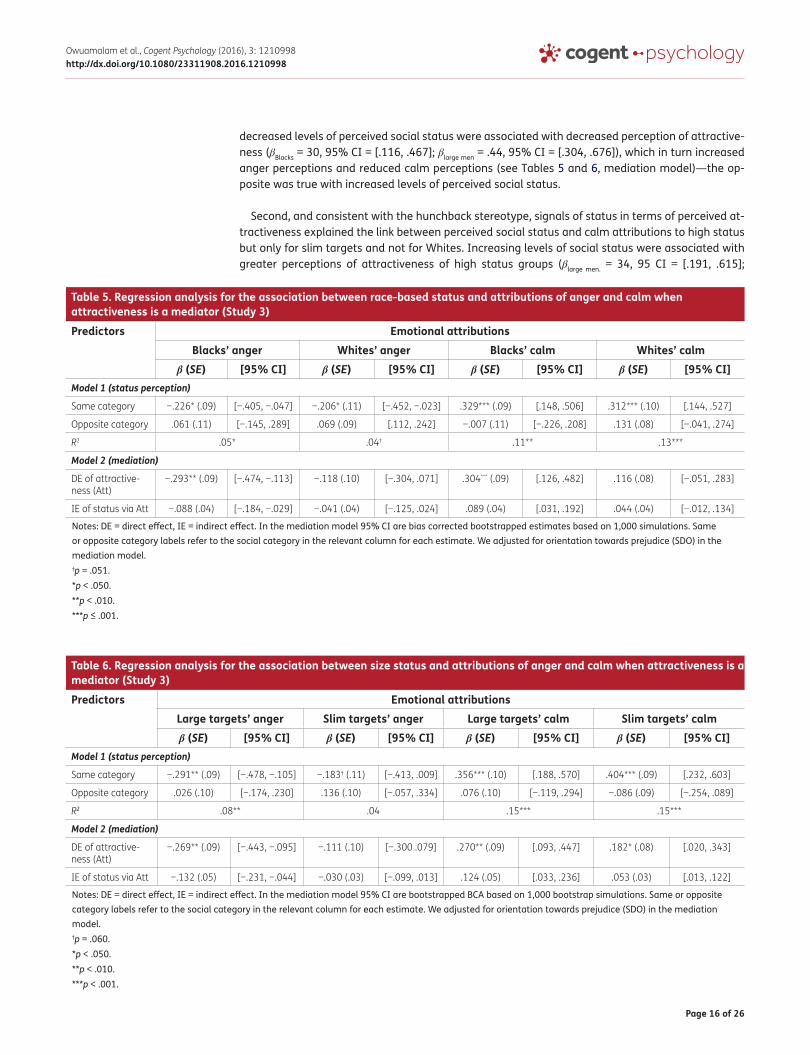
4.2.4. Do signals of social status predict anger and calm attributions?To answer this question, first, we repeated the same regression as in Study 2, using perceived attractive-ness to predict attributions of anger and calm. Corroborating the trends in Study 2, results in Table 4 show that perceived attractiveness of targets within each social category was associated with reduced perceptions of anger, but increased perceptions of calm. In other words, those targets that scored high-ly on the status signalling dimension of attractiveness were seen as more calm-looking, and less angry-looking, while the reverse was the case for their less attractive (low status) counterparts (see Table 4). We also found a pattern consistent with the hunchback stereotype when perceived attractiveness was substituted in the model with perceived social status: this was true for the Black vs. White interstatus context (see Table 5, Model 1), and also for the large vs. slim interstatus context (see Table 6, Model 1).
Recall that an assumption underlying the facial perception paradigm that we used across our studies is that perceived attractiveness is the metric that perceivers use to differentiate the facial images they saw into high and low social status. Thus, we reasoned that perceived attractiveness should be the conduit through which an effect of social status is passed on to anger/calm attribu-tions. To be sure, we followed this reasoning with a mediational analysis, and specified a path from perceived social status to anger, calm and perceived attractiveness, and a further path from per-ceived attractiveness to anger and calm.
Results from this mediational analysis revealed two key findings. First, perceived attractiveness explained the link between perceived social status and anger/calm for the low status groups (see Tables 5 and 6, Model 1 for Blacks and large men). Consistent with the hunchback stereotype,
Table 4. The relationship between perceived attractiveness and attributions of anger and calm to blacks, whites, large and slim men (explicit Measures, Study 3)
Note: Same or opposite category labels refer to the social category in the relevant column for each estimate.*p ≤ .050.**p ≤ .010.***p ≤ .001.
Perceived attractiveness of …
Emotional attributionsβ (SE) [95% CI] β (SE) [95% CI] β (SE) [95% CI] β (SE) [95% CI]
Race Blacks’ anger Whites’ anger Blacks’ calm Whites’ calm
Same category −.384*** (.09) [−.561, −.193] −.203* (.10) [−.383, −.007] .325*** (.12) [.142, .519] .302** (.09) [.100, .440]
Opposite category .110 (.09) [−.075, .289] .088 (.10) [−.104, .276] .093 (.09) [−.094, .280] −.210* (.09) [−.361, −.018]
R2 .13*** .04 .14*** .09**
Size Large men’s anger Slim men’s anger Large men’s calm Slim men’s calm
Same category −.371*** (.09) [−.506, −.165] −.200* (.10) [−.391, −.001] .431*** (.10) [.236, .593] .330*** (.09) [.377, .831]
Opposite category .018 (.09) [−.164, .199] .149 (.09) [−.046, .321] −.100 (.10) [−.292, .087] −.132 (.08) [−.281, .052]
R2 .13*** .04 .16*** .09**
Page 16 of 26
Owuamalam et al., Cogent Psychology (2016), 3: 1210998http://dx.doi.org/10.1080/23311908.2016.1210998
decreased levels of perceived social status were associated with decreased perception of attractive-ness (βBlacks = 30, 95% CI = [.116, .467]; βlarge men = .44, 95% CI = [.304, .676]), which in turn increased anger perceptions and reduced calm perceptions (see Tables 5 and 6, mediation model)—the op-posite was true with increased levels of perceived social status.
Second, and consistent with the hunchback stereotype, signals of status in terms of perceived at-tractiveness explained the link between perceived social status and calm attributions to high status but only for slim targets and not for Whites. Increasing levels of social status were associated with greater perceptions of attractiveness of high status groups (βlarge men. = 34, 95 CI = [.191, .615];
Table 5. Regression analysis for the association between race-based status and attributions of anger and calm when attractiveness is a mediator (Study 3)
Notes: DE = direct effect, IE = indirect effect. In the mediation model 95% CI are bias corrected bootstrapped estimates based on 1,000 simulations. Same or opposite category labels refer to the social category in the relevant column for each estimate. We adjusted for orientation towards prejudice (SDO) in the mediation model.†p = .051.*p < .050.**p < .010.***p ≤ .001.
Predictors Emotional attributionsBlacks’ anger Whites’ anger Blacks’ calm Whites’ calm
β (SE) [95% CI] β (SE) [95% CI] β (SE) [95% CI] β (SE) [95% CI]Model 1 (status perception)
Same category −.226* (.09) [−.405, −.047] −.206* (.11) [−.452, −.023] .329*** (.09) [.148, .506] .312*** (.10) [.144, .527]
Opposite category .061 (.11) [−.145, .289] .069 (.09) [.112, .242] −.007 (.11) [−.226, .208] .131 (.08) [−.041, .274]
R2 .05* .04† .11** .13***
Model 2 (mediation)
DE of attractive-ness (Att)
−.293** (.09) [−.474, −.113] −.118 (.10) [−.304, .071] .304*** (.09) [.126, .482] .116 (.08) [−.051, .283]
IE of status via Att −.088 (.04) [−.184, −.029] −.041 (.04) [−.125, .024] .089 (.04) [.031, .192] .044 (.04) [−.012, .134]
Table 6. Regression analysis for the association between size status and attributions of anger and calm when attractiveness is a mediator (Study 3)
Notes: DE = direct effect, IE = indirect effect. In the mediation model 95% CI are bootstrapped BCA based on 1,000 bootstrap simulations. Same or opposite category labels refer to the social category in the relevant column for each estimate. We adjusted for orientation towards prejudice (SDO) in the mediation model.†p = .060.*p < .050.**p < .010.***p < .001.
Predictors Emotional attributionsLarge targets’ anger Slim targets’ anger Large targets’ calm Slim targets’ calmβ (SE) [95% CI] β (SE) [95% CI] β (SE) [95% CI] β (SE) [95% CI]
Model 1 (status perception)
Same category −.291** (.09) [−.478, −.105] −.183† (.11) [−.413, .009] .356*** (.10) [.188, .570] .404*** (.09) [.232, .603]
Opposite category .026 (.10) [−.174, .230] .136 (.10) [−.057, .334] .076 (.10) [−.119, .294] −.086 (.09) [−.254, .089]
R2 .08** .04 .15*** .15***
Model 2 (mediation)
DE of attractive-ness (Att)
−.269** (.09) [−.443, −.095] −.111 (.10) [−.300 .079] .270** (.09) [.093, .447] .182* (.08) [.020, .343]
IE of status via Att −.132 (.05) [−.231, −.044] −.030 (.03) [−.099, .013] .124 (.05) [.033, .236] .053 (.03) [.013, .122]
Page 17 of 26
Owuamalam et al., Cogent Psychology (2016), 3: 1210998http://dx.doi.org/10.1080/23311908.2016.1210998
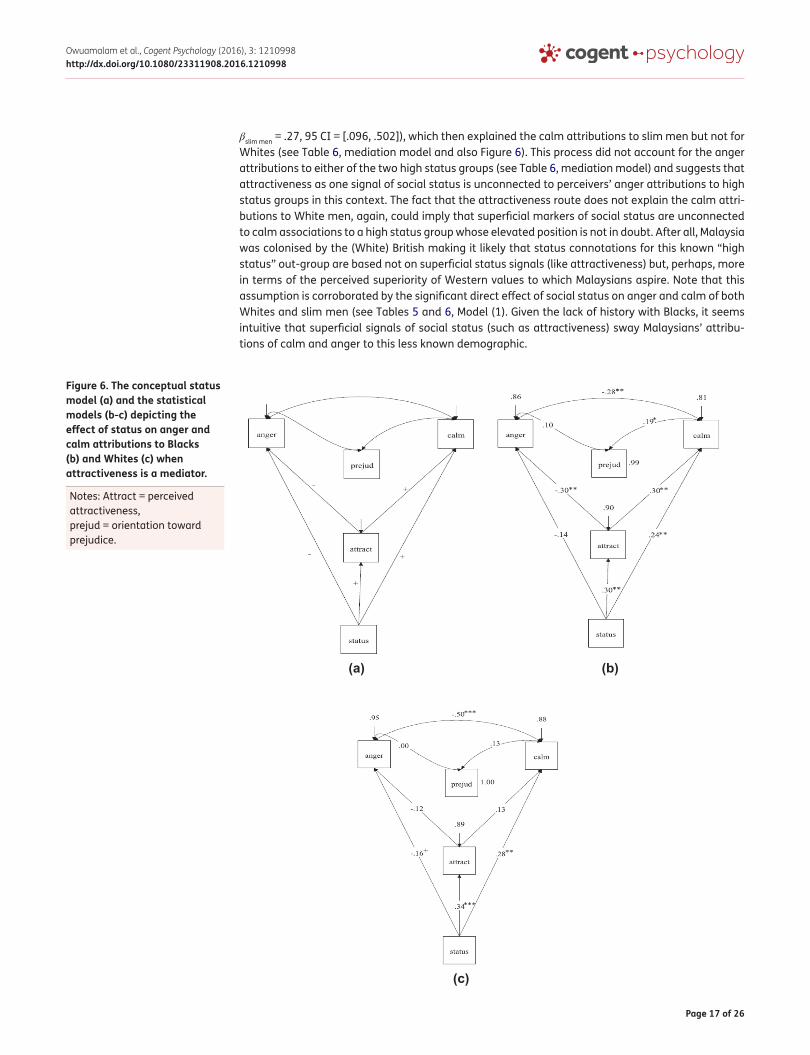
βslim men = .27, 95 CI = [.096, .502]), which then explained the calm attributions to slim men but not for Whites (see Table 6, mediation model and also Figure 6). This process did not account for the anger attributions to either of the two high status groups (see Table 6, mediation model) and suggests that attractiveness as one signal of social status is unconnected to perceivers’ anger attributions to high status groups in this context. The fact that the attractiveness route does not explain the calm attri-butions to White men, again, could imply that superficial markers of social status are unconnected to calm associations to a high status group whose elevated position is not in doubt. After all, Malaysia was colonised by the (White) British making it likely that status connotations for this known “high status” out-group are based not on superficial status signals (like attractiveness) but, perhaps, more in terms of the perceived superiority of Western values to which Malaysians aspire. Note that this assumption is corroborated by the significant direct effect of social status on anger and calm of both Whites and slim men (see Tables 5 and 6, Model (1). Given the lack of history with Blacks, it seems intuitive that superficial signals of social status (such as attractiveness) sway Malaysians’ attribu-tions of calm and anger to this less known demographic.
Figure 6. The conceptual status model (a) and the statistical models (b-c) depicting the effect of status on anger and calm attributions to Blacks (b) and Whites (c) when attractiveness is a mediator.
Notes: Attract = perceived attractiveness, prejud = orientation toward prejudice.
(a)
(c)
(b)
Page 18 of 26
Owuamalam et al., Cogent Psychology (2016), 3: 1210998http://dx.doi.org/10.1080/23311908.2016.1210998
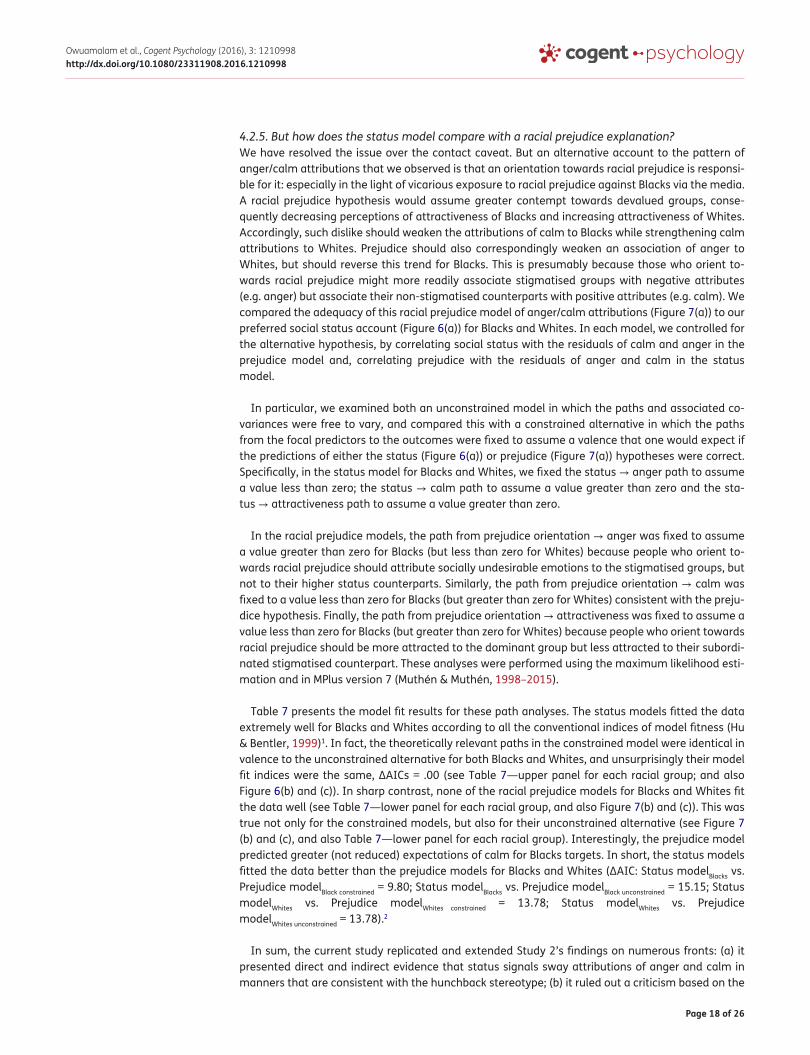
4.2.5. But how does the status model compare with a racial prejudice explanation?We have resolved the issue over the contact caveat. But an alternative account to the pattern of anger/calm attributions that we observed is that an orientation towards racial prejudice is responsi-ble for it: especially in the light of vicarious exposure to racial prejudice against Blacks via the media. A racial prejudice hypothesis would assume greater contempt towards devalued groups, conse-quently decreasing perceptions of attractiveness of Blacks and increasing attractiveness of Whites. Accordingly, such dislike should weaken the attributions of calm to Blacks while strengthening calm attributions to Whites. Prejudice should also correspondingly weaken an association of anger to Whites, but should reverse this trend for Blacks. This is presumably because those who orient to-wards racial prejudice might more readily associate stigmatised groups with negative attributes (e.g. anger) but associate their non-stigmatised counterparts with positive attributes (e.g. calm). We compared the adequacy of this racial prejudice model of anger/calm attributions (Figure 7(a)) to our preferred social status account (Figure 6(a)) for Blacks and Whites. In each model, we controlled for the alternative hypothesis, by correlating social status with the residuals of calm and anger in the prejudice model and, correlating prejudice with the residuals of anger and calm in the status model.
In particular, we examined both an unconstrained model in which the paths and associated co-variances were free to vary, and compared this with a constrained alternative in which the paths from the focal predictors to the outcomes were fixed to assume a valence that one would expect if the predictions of either the status (Figure 6(a)) or prejudice (Figure 7(a)) hypotheses were correct. Specifically, in the status model for Blacks and Whites, we fixed the status → anger path to assume a value less than zero; the status → calm path to assume a value greater than zero and the sta-tus → attractiveness path to assume a value greater than zero.
In the racial prejudice models, the path from prejudice orientation → anger was fixed to assume a value greater than zero for Blacks (but less than zero for Whites) because people who orient to-wards racial prejudice should attribute socially undesirable emotions to the stigmatised groups, but not to their higher status counterparts. Similarly, the path from prejudice orientation → calm was fixed to a value less than zero for Blacks (but greater than zero for Whites) consistent with the preju-dice hypothesis. Finally, the path from prejudice orientation → attractiveness was fixed to assume a value less than zero for Blacks (but greater than zero for Whites) because people who orient towards racial prejudice should be more attracted to the dominant group but less attracted to their subordi-nated stigmatised counterpart. These analyses were performed using the maximum likelihood esti-mation and in MPlus version 7 (Muthén & Muthén, 1998–2015).
Table 7 presents the model fit results for these path analyses. The status models fitted the data extremely well for Blacks and Whites according to all the conventional indices of model fitness (Hu & Bentler, 1999)1. In fact, the theoretically relevant paths in the constrained model were identical in valence to the unconstrained alternative for both Blacks and Whites, and unsurprisingly their model fit indices were the same, ∆AICs = .00 (see Table 7—upper panel for each racial group; and also Figure 6(b) and (c)). In sharp contrast, none of the racial prejudice models for Blacks and Whites fit the data well (see Table 7—lower panel for each racial group, and also Figure 7(b) and (c)). This was true not only for the constrained models, but also for their unconstrained alternative (see Figure 7 (b) and (c), and also Table 7—lower panel for each racial group). Interestingly, the prejudice model predicted greater (not reduced) expectations of calm for Blacks targets. In short, the status models fitted the data better than the prejudice models for Blacks and Whites (∆AIC: Status modelBlacks vs. Prejudice modelBlack constrained = 9.80; Status modelBlacks vs. Prejudice modelBlack unconstrained = 15.15; Status modelWhites vs. Prejudice modelWhites constrained = 13.78; Status modelWhites vs. Prejudice modelWhites unconstrained = 13.78).2
In sum, the current study replicated and extended Study 2’s findings on numerous fronts: (a) it presented direct and indirect evidence that status signals sway attributions of anger and calm in manners that are consistent with the hunchback stereotype; (b) it ruled out a criticism based on the

Page 19 of 26
Owuamalam et al., Cogent Psychology (2016), 3: 1210998http://dx.doi.org/10.1080/23311908.2016.1210998
contact caveat that the differential attributions of calm and anger could have been due to the fre-quency of actual negative encounters, insofar as identical results were obtained even for a low sta-tus group that our Malaysian participants were less experienced with (Blacks); (c) it ruled out an orientation towards racial prejudice as a plausible explanation for the trends in relation to the racial context of Blacks vs. Whites, (d) it showed that in the relatively mundane contexts of physical size or attractiveness, that use of the hunchback heuristic persists and finally (e) it showed that even within groups that are devalued, that signals of status (e.g. attractiveness) were sufficient to also prompt the use of the hunchback heuristic.
Figure 7. The conceptual prejudice model (a) and the statistical models (b–c) depicting the effect of orientation towards prejudice on anger and calm attributions to Blacks (b) and Whites (c) when attractiveness is a mediator. In Figure 7(a) the valence of paths from prejudice to anger and calm that are enclosed in parenthesis relates to Whites, while those outside parenthesis relates to Blacks.
Notes: Attract = perceived attractiveness, prejud = orientation towards prejudice.
(c)
(b)(a)

Page 20 of 26
Owuamalam et al., Cogent Psychology (2016), 3: 1210998http://dx.doi.org/10.1080/23311908.2016.1210998
5. General discussionThe common wisdom is that threat perception and/or anger attributions to undervalued groups (particularly Blacks) are due to prejudice: individuals who orient towards prejudice generally per-ceive undervalued groups as being prone to the threat eliciting emotion of anger (see also Ross, 2015 for a similar discussion). Here we considered a more parsimonious status-based account: that a hunchback heuristic exists, which leads people to associate anger with low social status and calm with high social status. We reasoned that the hunchback stereotype would predict the expectations of anger and calm, respectively, from low and high status groups and found support for this proposi-tion in a multi-method protocol comprising self-reports and a rigorous IAT-like implicit measure that taps unconscious cognitive associations. Our findings present a number of theoretical and practical opportunities.
5.1. Theoretical opportunitiesWhile the predictions of the hunchback stereotype could be inferred from other theoretical accounts, it is important to distinguish between our approach and existing models of stereotyping. First, al-though the stereotype content model (SCM: Fiske et al., 2002) agrees with the hunchback stereotype in predicting the association of anger to low status and calm to high status, it is important to clarify that the SCM views these associations as being tied to trait incompentence, rather than a situation-related phenomenon that is tied to perceived frustration. That is, under the SCM framework people expect members of low status groups to be angry due to “trait” incompetence, and that this incom-petence then frustrates the accomplishment of desired goals—making individual members of low status groups more likely to vent the frustration arising from their incompetence. The hunchback stereotype, by contrast, does not make any assumptions about traits. Rather, it supposes a generic tendency to associate people with low status with anger, because by definition, they are more likely to encounter frustration than their counterparts from privileged backgrounds. Creating conditions under which frustration is only attributable to internal (trait) versus external (situational) causes might be one fruitful way to differentiate as well as to integrate the SCM and the hunchback heuristic.
Second, the infrahumanisation theory (Leyens et al., 2000) with its emphasis on the attributions of uniquely human (often positive) emotions to one’s in-group and bestial (often negative) emotions to out-groups seem similar to the hunchback stereotype—to the extent that people perceive their own groups as superior to out-groups. However, the problem with this reason is that people do not al-ways see themselves as superior to out-groups. People may find it difficult, at times, to find an objec-tive basis on which to claim superiority over a clearly higher status out-group—e.g. the context
Table 7. Fit indices of theoretically relevant models in Study 3
Notes: χ2 = chi-square difference, df = degrees of freedom, CFI = comparative fit index, SRMR = squared root mean residual, RMSEA = root mean square error approximation, AIC = akaike information criterion. ΔAIC values for each contrast that is ≥ 10 are considered meaningful (Burnham & Anderson, 2004).**p ≤ .001.
Model χ² (df) CFI SRMR RMSEA [90% CI] AIC ΔAICBlacks Unconstrained status .609 (2) 1.00 .018 < .001 [.000, .130] 1,247.950 .00
Constrained status .609 (2) 1.00 .018 < .001 [.000, .130] 1,247.950
Unconstrained prejudice 10.520** (2) .868 .074 .193 [.090, .315] 1,257.750 5.347
Constrained prejudice 15.867** (2) .786 .087 .247 [.144, .366] 1,263.097
Whites Unconstrained status .945 (2) 1.00 .025 < .001 [.000, .149] 1,251.227 .00
Constrained status .945 (2) 1.00 .025 < .001 [.000, .149] 1,251.227
Unconstrained prejudice 14.095** (2) .804 .082 .230 [.127, .350] 1,265.002 .00
Constrained prejudice 14.095** (2) .804 .082 .230 [.127, .350] 1,265.002

Page 21 of 26
Owuamalam et al., Cogent Psychology (2016), 3: 1210998http://dx.doi.org/10.1080/23311908.2016.1210998
between Malaysia and the USA (Spears, Jetten, & Doosje, 2001). As the infrahumanisation approach is more suited to in-group vs. out-group dyads, its predictions therefore do not neatly extend to an interstatus dyad and presents opportunities for an extension of the hunchback framework to an in-tergroup context.
Specifically, future research could aim to establish whether members of low status groups also use the hunchback heuristic in their attributions of anger and calm to the in-group vs. an out-group. As has been suggested by others (e.g. Spears et al., 2001), there often is an identity-based conflict within members of low status groups, between the need to service group interests, and a social real-ity that sets the boundaries for a group interested behaviour to manifest. While group interests might engender a tendency to resist an association of negative attributes to the in-group (such as the socially undesirable emotion of anger), it is entirely possible, on the other hand, that social real-ity could constrain the extent to which members of low status groups could claim positive attributes for their in-group (e.g. calm) relative to their higher status counterparts (see Spears et al., 2001; cf. Owuamalam, Rubin, & Issmer, 2016). Resolving this paradox warrants carefully unpacking the con-ditions under which the use of a group interested attribution strategy vs. an attribution strategy that yields to reality constraints is likely.
Third, there is also the outstanding issue of the cultural moderation hypothesis of status-based emotional expression put forward by Park et al. (2013). According to this perspective, a cultural creed exists in collectivistic cultures that permit only those in elevated positions of authority (i.e. high status groups) to express anger. Accordingly, people in collectivistic cultures expect members of high status groups to display anger because they are the ones to whom a licence is given to ex-press this emotion. By extension, people in collectivistic cultures expect members of low status groups to be calm because their lack of authority denies them the licence to display anger. The problem with this proposition is that even in the collectivistic Malaysian culture, we found an asso-ciation between low social status and anger, and between high social status and calm.
That said, the culture moderation hypothesis and the hunchback heuristic are not necessarily in-compatible because we interpret the hunchback heuristic as a fundamental heuristic that people use in their social judgements, while the culture moderation hypothesis is ostensibly concerned with norms that may or may not proscribe reliance on the more fundamental heuristic. Thus, it is possible that in situations where such cultural norms are less salient (such as the mundane interstatus con-texts that we used across our studies) that people may rely on the hunchback heuristic, while relying on norms in situations where the cultural norms prescribing the display of anger to those in elevated positions are more salient (e.g. managers vs. subordinates within an organisational context). This might help to explain the seemingly diverging evidence by Tiedens et al. (2000) to those reported by Park et al. (2013), which shows a similar tendency for people to expect anger from high status groups but within an individualistic culture and, in the cultural context of an organisation.
Finally, the gender paradox. Would the hunchback heuristic be applicable to the gender context where there are known norms that associate men with anger and aggression and women with calm and submission? We think the hunchback heuristic is potentially applicable even to the gender con-text, particularly in the light of the foregoing distinction between norms and fundamental heuristics. Accordingly, we reason that people with traditional beliefs about gender roles and norms may be more susceptible to adhering to societal norms that prescribe anger for men, and calm for women. Because we conceive the hunchback stereotype as a fundamental heuristic, we reasoned that those individuals who do not subscribe to traditional gender roles/norms may be more likely to resist nor-mative associations of anger to men and calm to women, and might instead rely on the more hunchback heuristic. Not a single research has explored these novel propositions that are derivable via the lens of a hunchback heuristic, and we think it is a fruitful avenue for future research. Indeed, such a research programme, particularly in the gender context could help to understand the com-plexities of the glass-ceiling/cliff phenomenon (Baretto, Ryan & Schmitt, 2009). It is plausible that women do not get ahead not only because people at the upper echelons of an organisation
Page 22 of 26
Owuamalam et al., Cogent Psychology (2016), 3: 1210998http://dx.doi.org/10.1080/23311908.2016.1210998
subscribe to rigid gender role norms that prescribe calm and submissiveness for women, but be-cause people who do not subscribe to these norms may be driven by the fundamental hunchback heuristic: expecting women to be emotionally leaky and therefore making them “unfit” for elevated positions requiring calm. Nonetheless, we offer these speculations with caution because they have yet to be documented.
5.2. Practical opportunitiesThe current findings have far-reaching applied implications. Firstly, in the aftermath of police shoot-ings of Blacks in the US, debates hovered around the issue of racial prejudice against ethnic minori-ties as a possible (even sole) explanation for the fatalities. While we acknowledge that racial (implicit) prejudice may play a role in explaining some of these incidence (see Welch, 2007), our analysis concurs with Ross (2015) and suggests that an orientation towards racial prejudice may not be the only (even primary) factor in the anger (threat) attributions to low status groups (such as ethnic minorities). Here, we uncover a more fundamental hunchback heuristic that people use to infer the anger of (and therefore possible threat posed by) those who occupy a low status position, which is largely unrelated to an orientation towards racial prejudice. That these associations persist even at the unconscious level that are less susceptible to control, suggests that a fundamental process is at work: the hunchback heuristic. Our novel status-based account becomes even more appealing, par-ticularly when a closer look at scenes of some of these shootings also reveals the involvement of minority police officers. In particular, the finding that people rely on status signals such as physical size (cf., the case of Michael Brown in the 2014 Ferguson shooting) and markers of social stigma (cf., the socially undesirable hoodie worn by Tamir Rice in the Cleaveland police shooting in 2014) in their attributions of anger underscores the complexity of threat perception. It further shows, consistent with our theorising, that perceived social status dictates who might (or might not) be a likely target of a threat-induced victimisation.
Second, the current findings have the potential to help understand the discourse around terrorism and law enforcement more broadly. Observers may perceive greater malice and violent intent from aggressive behaviour of members of low status groups compared to their counterparts from privi-leged higher status backgrounds. For example, the United States Federal Bureau of Intelligence (FBI) described the fatal shooting of African-Americans at a Church in Charleston South Carolina in 2015 that was perpetrated by Dylann Roof (who had ties to American white supremacists) as a “hate crime”: A term that ostensibly carries less severe connotations compared to the ‘terrorist’ label that intensifies a perception of wanton violence (Berman, Izadi, & Lowery, 2015). Meanwhile, ethnic per-petrators of the San Bernardino, California shootings in 2015 faced terrorism-related charges by the FBI (Sarlin, 2015). Indeed, the motivations for both atrocities seemed political, but with starkly dif-ferent outcomes for the perpetrators. Note that this trend is also compatible with a recent social experiment in which the German pranksters “Dit Is Normaal” demonstrated that extreme verses from the Bible were perceived to be obscene and violent when people were told that those verses were from the Qur’an. In this sense, the hunchback stereotype has implications for the judiciary: behaviours that may be excused by jurors when it comes from individuals with a high status back-ground, may be attributed violent and therefore criminal intent if it came from people with a low status background. It is important for law enforcement officers and conflict arbiters to be familiar with the hunchback heuristic, and to put a check on it.
5.3. LimitationsDespite the overwhelming evidence for a hunchback heuristic in this investigation, sceptics might nonetheless argue that vicarious exposure to the “angry and aggressive Black stereotype” via media depictions of Black people in violent/aggressive roles is responsible for the attributions of anger, in particular, to Blacks. Even if cherry-picking evidence in this manner is tenable, such an explanation is unsatisfying because (a) the majority of actors in Western media depicting violence and aggres-sion are Whites by virtue of their numeric dominance of the Western movie industry (Smith, Choueiti, & Pieper, 2014), (b) such tendency should be more apparent amongst people who orient towards racial prejudice—but evidence in Study 3 show that this isn’t the case, that in fact such individuals
Page 23 of 26
Owuamalam et al., Cogent Psychology (2016), 3: 1210998http://dx.doi.org/10.1080/23311908.2016.1210998
expect Blacks to be calm and (c) the regularity of the hunchback pattern across the other interstatus contexts leads to the overwhelming conclusion that emotional attributions were tied to status than anything else.
Nonetheless, we acknowledge that we have used only a proxy of racial prejudice in the shape of an orientation towards acting in this way, and a specific operationalisation of an orientation towards prejudice that isn’t exhaustive. Thus, it is entirely possible that a different operationalisation of an orientation towards racial prejudice could yield a prejudice effect. That being said, different theoreti-cal operationalisations of a construct should yield empirically similar outcomes (see Jost et al., 2012 for a similar argument) and the fact that we find no evidence for a racial prejudice hypothesis using an explicit measure raises important questions which future investigations on this topic could aim to resolve. Similarly, it might be fruitful to investigate the patterns we show across these studies in a Western context where proximal contact with Blacks (and Whites) is more frequent.
6. ConclusionWe examined the existence of a hunchback stereotype—the idea that lay perceivers associate an-ger with low social status and calm with high social status. Using a multi-method approach, we found evidence of a hunchback stereotype across numerous interstatus contexts including: skin-shade, race, physical size and attractiveness. We found these associations in a collectivistic culture where there are suggestions of a cultural creed permitting only high status individuals to express anger, strengthening our view that the hunchback stereotype is a fundamental heuristic. Our analy-ses ruled out the possibility that frequent encounters with the demographies studied here could have explained our results. In particular, we ruled out a racial prejudice account and showed that the associations of anger to Blacks and calm to Whites are unlikely to result primarily from an orien-tation towards prejudice, but from a “chip on the shoulder-like” heuristic that we call the hunchback stereotype.
AcknowledgementsWe are grateful to the European Association of Social Psychology for a Seedcorn grant to the first author. We would also like to thank Soumya Ramakrishna Bhat for her assistance in data collection and stimuli preparation. The views expressed in this paper are those of the authors alone and those not necessarily mean that the European Association of Social Psychology endorse them.
FundingThis work was funded by the European Association of Social Psychology.
Competing InterestsThe authors declare no competing interests.
Author detailsChuma Kevin Owuamalam1
E-mail: [email protected], [email protected] ID: http://orcid.org/0000-0001-8219-7975Maas Misha’ari Weerabangsa1
E-mails: [email protected], [email protected] Kumar Karunagharan1
E-mail: [email protected] Rubin2
E-mail: [email protected] School of Psychology, University of Nottingham (Malaysia
Campus), Jalan Broga, Semenyih 43500, Selangor, Malaysia.2 Psychology, The University of Newcastle, Canberra, Australia.
Citation informationCite this article as: Chip on the shoulder? The hunchback heuristic predicts the attribution of anger to low status
groups and calm to high status groups, Chuma Kevin Owuamalam, Maas Misha’ari Weerabangsa, Jaya Kumar Karunagharan & Mark Rubin, Cogent Psychology (2016), 3: 1210998.
Notes1. According to Hu and Bentler (1999), good fitting models
should have a comparative fit index (CFI) value close to .95; root mean square error of approximation (RMSEA) value close to .06; standardised root mean square residual (SRMR) value close to .08 and a non-significant chi-square value.
2. Because the hypothesised and alternative models are not nested, we used change in Akaike information criterion (∆AIC) for model comparison. A lower AIC signals a better fit, and ΔAIC values ≥ 10 are regarded as meaningful (Burnham & Anderson, 2004).
Cover imageSource: Author.
ReferencesAckerman, J. M., Shapiro, J. R., Neuberg, S. L., Kenrick, D. T.,
Becker, D. V., Griskevicius, V., ... Schaller, M. (2006). They all look the same to me (unless they're angry): From out-group homogeneity to out-group heterogeneity. Psychological Science, 17, 836–840. http://dx.doi.org/10.1111/j.1467-9280.2006.01790.x
Akosah-Sarpong, K. (2008). Essay/Ghana: The evil of the Bibiani Hunchback Ritual. Modern Ghana. Retrieved 24th June 2016 from http://www.modernghana.com/news/179468/1/essayghana-the-evil-of-the-bibiani-hunchback-ritua.html
Bargh, J. A., Chen, M., & Burrows, L. (1996). Automaticity of social behavior: Direct effects of trait construct
Page 24 of 26
Owuamalam et al., Cogent Psychology (2016), 3: 1210998http://dx.doi.org/10.1080/23311908.2016.1210998
and stereotype activation on action. Journal of Personality and Social Psychology, 71, 230. doi:10.1037/0022-3514.71.2.230
Barlow, F. K., Paolini, S., Pedersen, A., Hornsey, M. J., Radke, H. R., Harwood, J., ... Sibley, C. G. (2012). The contact caveat: negative contact predicts increased prejudice more than positive contact predicts reduced prejudice. Personality and Social Psychology Bulletin, 38, 1629–1643. doi:10.1177/0146167212457953
Barreto, M. E., Ryan, M. K., & Schmitt, M. T. (2009). The glass ceiling in the 21st century: Understanding barriers to gender equality. Washington DC: American Psychological Association. http://dx.doi.org/10.1037/11863-000
Berkowitz, L. (1989). Frustration^aggression hypothesis: Examination and reformulation. Psychological Bulletin, 106, 59. doi:10.1037/0033-2909.106.1.59
Berman, M., Izadi, E., & Lowery, W. (2015). At least 14 people killed, 17 injured in mass shooting in San Bernardino, Calif.; two suspects killed in shootout with police. Retrieved August 3, 2016, from https://www.washingtonpost.com/news/post-nation/wp/2015/12/02/police-in-san-bernadino-calif-responding-report-of-shooting/?utm_term=.cd8af822b859
Burnham, K. P., & Anderson, D. R. (2004). Multimodel inference: Understanding AIC and BIC in model selection. Sociological Methods Research, 33, 261–304. http://dx.doi.org/10.1177/0049124104268644
Carlsmith, K. M., Wilson, T. D., & Gilbert, D. T. (2008). The paradoxical consequences of revenge. Journal of Personality and Social Psychology, 95, 1316–1324. doi:10.1037/a0012165
Carreiras, M., Garnham, A., Oakhill, J., & Cain, K. (1996). The use of stereotypical gender information in constructing a mental model: Evidence from English and Spanish. The Quarterly Journal of Experimental Psychology Section A, 49, 639–663. http://dx.doi.org/10.1080/713755647
CNN News Report. (August, 2014). Missouri governor imposes curfew in Ferguson, declares emergency. Retrieved 17th August 2014 from http://edition.cnn.com/2014/08/16/us/missouri-teen-shooting/index.html
Correll, J., Urland, G. R., & Ito, T. A. (2006). Event-related potentials and the decision to shoot: The role of threat perception and cognitive control. Journal of Experimental Social Psychology, 42, 120–128.
Crandall, C. S., & Schiffhauer, K. L. (1998). Anti-Fat prejudice: Beliefs, values, and American culture. Obesity Research, 6, 458–460. doi:10.1002/j.1550-8528.1998.tb00378.x
Durante, F., Fasolo, M., Mari, S., & Mazzola, A. F. (2014). Children’s attitudes and stereotype content toward thin, average-weight, and overweight peers. SAGE Open, 4, 2158244014534697. doi:10.1177/2158244014534697
Fiske, S. T., Cuddy, A. J., Glick, P., & Xu, J. (2002). A model of (often mixed) stereotype content: Competence and warmth respectively follow from perceived status and competition. Journal of Personality and Social Psychology, 82, 878–902. doi:10.1037/0022-3514.82.6.878
Fleming, K. K., Bandy, C. L., & Kimble, M. O. (2010). Decisions to shoot in a weapon identification task: The influence of cultural stereotypes and perceived threat on false positive errors. Social Neuroscience, 5, 201–220. doi:10.1080/17470910903268931
Goff, P. A., Jackson, M. C., Di Leone, B. A. L., Culotta, C. M., & DiTomasso, N. A. (2014). The essence of innocence: Consequences of dehumanizing black children. Journal of Personality and Social Psychology, 106, 526. doi:10.1037/a0035663.
Greenwald, A. G., McGhee, D. E., & Schwartz, J. L. (1998). Measuring individual differences in implicit cognition: The implicit association test. Journal of Personality and Social Psychology, 74, 1464. doi:10.1037/0022-3514.74.6.1464
Hayes, D., Lawless, J. L., & Baitinger, G. (2014). Who cares what they wear? Media, gender, and the influence of candidate appearance. Social Science Quarterly, 95, 1194–1212. doi:10.1111/ssqu.12113
Hu, L., & Bentler, P. M. (1999). Cutoff criteria for fit indexes in covariance structure analysis: Conventional criteria versus new alternatives. Structural Equation Modeling: A Multidisciplinary Journal, 6, 1–55. http://dx.doi.org/10.1080/10705519909540118
Hutchings, P. B., & Haddock, G. (2008). Look black in anger: The role of implicit prejudice in the categorization and perceived emotional intensity of racially ambiguous faces. Journal of Experimental Social Psychology, 44, 1418–1420. doi:10.1016/j.jesp.2008.05.002
Jones, O. (2012). Chavs: The demonization of the working class (2nd ed.). London: Verso Books.
Jost, J. T., Chaikalis-Petritsis, V., Abrams, D., Sidanius, J., van der Toorn, J., & Bratt, C. (2012). Why Men (and Women) do and don't rebel: Effects of system justification on willingness to protest. Personality and Social Psychology Bulletin, 38, 197–208. doi:10.1177/0146167211422544
Keltner, D., Gruenfeld, D. H., & Anderson, C. (2003). Power, approach, and inhibition. Psychological Review, 110, 265. doi:10.1037/0033-295X.110.2.265
Kluegel, J. R. (1990). Trends in Whites' explanations of the Black-White gap in socioeconomic status, 1977-1989. American Sociological Review, 55, 512–525. http://dx.doi.org/10.2307/2095804
Kruglanski, A. W. (1990). Lay epistemic theory in social-cognitive psychology. Psychological Inquiry, 1, 181–197. doi:10.1207/s15327965pli0103_1
Leong, S. (2006). Who’s the fairest of them all? Television ads for skin-whitening cosmetics in Hong Kong. Asian Ethnicity, 7, 167–181. doi:10.1080/14631360600736215
Leyens, J. P., Paladino, P. M., Rodriguez-Torres, R., Vaes, J., Demoulin, S., Rodriguez-Perez, A., & Gaunt, R. (2000). The emotional side of prejudice: The attribution of secondary emotions to ingroups and outgroups. Personality and Social Psychology Review, 4, 186–197. doi:10.1207/S15327957PSPR0402_06
Lord, J. (2016). Life Lesson #45: Get the chip off your shoulder. Retrieved June 18, 2016 from http://thecharacternetwork.org/life-lesson-45-get-the-chip-off-your-shoulder/
Loughnan, S., Haslam, N., Sutton, R. M., & Spencer, B. (2014). Dehumanization and social class. Social Psychology, 45, 54–61. doi:10.1027/1864-9335/a000159
Lowery, W. (2016). Study finds police fatally shoot unarmed black men at disproportionate rates. Retrieved June 15, 2016, from https://www.washingtonpost.com/national/study-finds-police-fatally-shoot-unarmed-black-men-at-disproportionate-rates/2016/04/06/e494563e-fa74-11e5-80e4-c381214de1a3_story.html
MacLeod, C. M. (1991). Half a century of research on the Stroop effect: An integrative review. Psychological Bulletin, 109, 163. doi:10.1037/0033-2909.109.2.163
McLaughlin, E. C. (2015). There aren’t more police shootings, just more coverage. Retrieved June 15, 2016, from http://edition.cnn.com/2015/04/20/us/police-brutality-video-social-media-attitudes/
McLean, G. (2005). In the hood. The Guardian. Retrieved from http://www.theguardian.com/politics/2005/may/13/fashion.fashionandstyle
Minear, M., & Park, D. C. (2004). A lifespan database of adult facial stimuli. Behaviour research methods, instruments, & computers, 36, 630–633. Retrieved from http://agingmind.utdallas.edu/facedb/view/neutral-faces. doi:10.3758/BF03206543
Muthén, L. K., & Muthén, B. O. (1998–2015). Mplus User’s Guide. (7th ed.). Los Angeles, CA: Muthén & Muthén.
Nadeem, S. (2014). Fair and anxious: on mimicry and skin-lightening in India. Social Identities, 20, 224–238. doi:10.1080/13504630.2014.881282

Page 25 of 26
Owuamalam et al., Cogent Psychology (2016), 3: 1210998http://dx.doi.org/10.1080/23311908.2016.1210998
Nelson, D. L., McEvoy, C. L., & Schreiber, T. A. (2004). The University of South Florida free association, rhyme, and word fragment norms. Behaviour Research Methods, Instruments, & Computers, 36, 402–407. doi:10.3758/BF03195588
Nisbett, R. E., & Wilson, T. D. (1977). The halo effect: Evidence for unconscious alteration of judgments. Journal of Personality and Social Psychology, 35, 250–256. doi:10.1037/0022-3514.35.4.250
Owuamalam, C., Weerabangsa, M., Mamdouh, M., Karunagharan, J. K., & Rubin, M. (2014). A mixed-method investigation of the hunchback hypothesis of emotional expressivity among members of low status groups. figshare. https://dx.doi.org/10.6084/m9.figshare.1149979.v3
Owuamalam, C. K., Rubin, M., & Issmer, C. (2016). Reactions to group devaluation and social inequality: A comparison of social identity and system justification predictions. Cogent Psychology, 3, doi:10.1080/23311908.2016.1188442
Owuamalam, C., Wong, K. X., & Rubin, M. (2016). Chubby but cheerful? Investigating the compensatory judgments of high, medium, and low status weight groups in Malaysia. Cogent Psychology, 3, doi:10.1080/23311908.2016.1188441
Park, J., Kitayama, S., Markus, H. R., Coe, C. L., Miyamoto, Y., Karasawa, M., ... Ryff, C. D. (2013). Social status and anger expression: The cultural moderation hypothesis. Emotion, 13, 1122. doi:10.1037/a0034273
Peirce, J. W. (2007). PsychoPy—Psychophysics software in Python. Journal of Neuroscience Methods, 162, 8–13. doi:10.1016/j.jneumeth.2006.11.017
Rees, S., & Silove, D. (2011). Sakit hati: A state of chronic mental distress related to resentment and anger amongst West Papuan refugees exposed to persecution. Social Science & Medicine, 73, 103–110. doi:10.1016/j.socscimed.2011.05.004
Ross, C. T. (2015). A multi-level Bayesian analysis of racial bias in police shootings at the county-level in the United States, 2011–2014. PLOS ONE, 10, e0141854. doi:10.1371/journal.pone.0141854
Sandhu, K. S. (1993). The coming of Indians to Malaysia. In K. S. Sandhu & A. Mani (Eds.), Indian Communities in Southeast Asia (First Reprint 2006, pp. 151–189). Singapore: Institute of Southeast Asian Studies.
Sarlin, B. (2015). Nine dead in Charleston church massacre. Retrieved August 03, 2016, from http://www.msnbc.com/msnbc/charleston-police-church-shooting
Shapiro, J. R., Ackerman, J. M., Neuberg, S. L., Maner, J. K., Becker, D. V., & Kenrick, D. T. (2009). Following in the wake of anger: When not discriminating is discriminating. Personality and Social Psychology Bulletin, 35, 1356–1367. doi:10.1177/0146167209339627
Sidanius, J., & Pratto, F. (2001). Social dominance: An intergroup theory of social hierarchy and oppression. Cambridge: Cambridge University Press.
Smith, S., Choueiti, M., & Pieper, K. (2014). Race/ethnicity in 600 popular films: Examining on screen portrayals and behind the camera diversity. Media, Diversity, & Social Change Initiative. Retrieved 25th January 2016 from http://annenberg.usc.edu/pages/~/media/MDSCI/Racial%20Inequality%20in%20Film%202007-2013%20Final.ashx
Spears, R., Jetten, J., & Doosje, B. (2001). The (Il) legitimacy of ingroup bias-From social reality to social resistance. In J. T Jost & B. Major (Eds.), The psychology of legitimacy: Emerging perspectives on ideology, justice, and intergroup relations (pp. 332–362). New York, NY: Cambridge University Press.
Tablante, C. B., Durante, F., & Fiske, S. T. (in press). Poor but warm, rich but cold (and competent): Social classes in the stereotype content model. Journal of Social Issues (forthcoming issue).
Tajfel, H., Billig, M. G., Bundy, R. P., & Flament, C. (1971). Social categorization and intergroup behaviour. European Journal of Social Psychology, 1, 149–178. http://dx.doi.org/10.1002/(ISSN)1099-0992
Tiedens, L. Z., Ellsworth, P. C., & Mesquita, B. (2000). Sentimental stereotypes: Emotional expectations for high-and low-status group members. Personality and Social Psychology Bulletin, 26, 560–575. doi:10.1177/0146167200267004
Volpato, C., Andrighetto, L., & Baldissarri, C. (in press). Perceptions of low-status workers and the maintenance of the social-class status quo. Journal of Social Issues (forthcoming issue).
Welch, K. (2007). Black criminal stereotypes and racial profiling. Journal of Contemporary Criminal Justice, 23, 276–288. doi:10.1177/1043986207306870
Appendix AList of word stimuli used in Studies 2 and 3.
Table A1. Emotion-associated probes in Studies 2 and 3Calm-associated Anger-associated Non-associated (filler)Passive Fierce Activity
Relax Vent Junior
Tame Violent Quarter
Still Revenge Zipper
Peace Irritate Define
Peaceful Tantrum Maximum
Patience Jealousy Theory
Subtle Aggravate Genuine
Patient Mean Nitrogen
Soothe Frustrate Wonderful
Note: Calm and anger columns in Studies 2 and 3, and non-associated column in Study 3.

Page 26 of 26
Owuamalam et al., Cogent Psychology (2016), 3: 1210998http://dx.doi.org/10.1080/23311908.2016.1210998
© 2016 The Author(s). This open access article is distributed under a Creative Commons Attribution (CC-BY) 4.0 license.You are free to: Share — copy and redistribute the material in any medium or format Adapt — remix, transform, and build upon the material for any purpose, even commercially.The licensor cannot revoke these freedoms as long as you follow the license terms.
Under the following terms:Attribution — You must give appropriate credit, provide a link to the license, and indicate if changes were made. You may do so in any reasonable manner, but not in any way that suggests the licensor endorses you or your use. No additional restrictions You may not apply legal terms or technological measures that legally restrict others from doing anything the license permits.
Cogent Psychology (ISSN: 2331-1908) is published by Cogent OA, part of Taylor & Francis Group. Publishing with Cogent OA ensures:• Immediate, universal access to your article on publication• High visibility and discoverability via the Cogent OA website as well as Taylor & Francis Online• Download and citation statistics for your article• Rapid online publication• Input from, and dialog with, expert editors and editorial boards• Retention of full copyright of your article• Guaranteed legacy preservation of your article• Discounts and waivers for authors in developing regionsSubmit your manuscript to a Cogent OA journal at www.CogentOA.com