chip-seq hands-on iros barozzi, campus ifom-ieo (milan) saverio minucci, gioacchino natoli labs
TRANSCRIPT

ChIP-seq hands-on
Iros Barozzi, Campus IFOM-IEO (Milan)Saverio Minucci, Gioacchino Natoli Labs

Main goals
Becoming familiar with essential tools and formats
Visualizing and contextualizing raw data
Understand biases at each step of the analysis If something went wrong, identify which experimental step could have risen the issue
FAQs

Overview
Quality control Alignment Raw data visualization Peak calling Experimental validation
At each step:- critical evaluation- understanding possible issues
Illumina website

Overview
Alignment
Raw data visualization
Peak calling

FASTQ format
@descriptionRead/Tag
+descriptionQscores

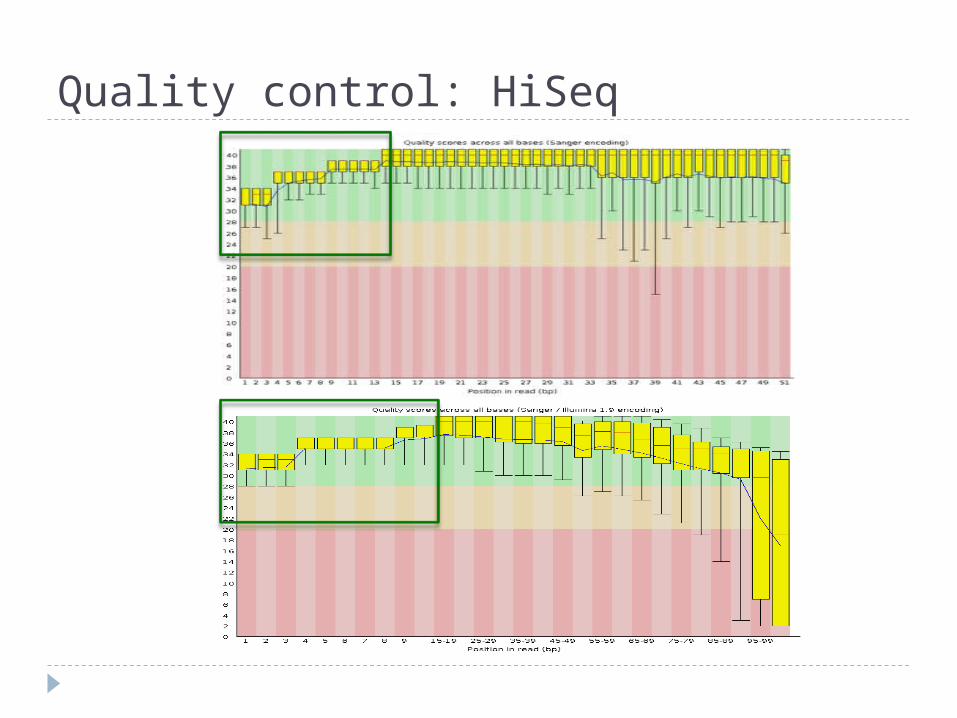
Quality control
http://www.bioinformatics.babraham.ac.uk/projects/fastqc/
critical evaluation of good/bad fastqc output what to really expect from a HiSeq lane:- trimming- contaminants evaluation
Before we start: don’t get scared, some biases can be intrinsic to the regions of the DNA you are IPing and not a technical problem

Quality control

Quality control: HiSeq
Quality control: HiSeq

Quality control: HiSeq

Quality control: HiSeq
Align only these substrings

Quality control

Quality control

Quality control
JunB, TF, 12M reads more than enough!

Quality control

Quality control

Quality control
NTGTTGATGACATGTATCCGGATGTTTGGAGTGGGACATGTATCCGGATGTGTTTTGTTGACATGTATCCGGATGTTNTTATGGTGGACATGTATCCGGATGTTGTGAATTGGACATGTATCCGGATGTCCTATAGTGGACATTATCCGGATGTNAGAGAATGTGGACATGTATCCGGATGTGTTGGCTTGACACATATCCGGATGTTCCACACAGGACAAGATCGGAAGGNTTATGCAGAAACGGACATGTATCCGGATGTGTCTTGTGTGACATGTATCCGGATGTCTGCAACGTCCGCTGAGCCANTTCATAGGTGCGGACATGTATCCGGATGTGTCGCAATGTGATATGATCCGGATGTCGAGGCTCTACATCCGGATACNTGATGTGGGGTGACATGTATCCGGATGGATTTGGGGACATGTATCCGGATGCATCCGGATACATGTCATGTCACAGNTAATGCTGGACATGTATCCGGATGTCTTTCTGTGGGGCAGCCACTGGCTCATCGAAAGATCGGAAGAGCTCGTATGNATGGTACGGACATGTATCCGGATGTCATCCGGATACATGTCCAGGACGACAGATCGGAAGAGCTCGTATGCCGTCTNTGGTGCTGGACATGTATCCGGATGTATGTTCTCGATAAAACATCCGGATACATGACAACACCAGAGATCGGAAGAGNTGGTGGTTGGGACATGTATCCGGATGTTTACAGTATCTGCAACGTCCGCTGAGCCAGTGGCTGCCCCACCAGTGTTNACATCATGGACATGTATCCGGATGAGATCGGAAGAGCTCGTATGCCGTCTTCTGCTTGAAAAAAAAAAAAAAAATA
Some primer contamination!

Alignment
I am a reference genome!
AAAGGGAT
GGAAAGGT
uniquemapping
multimapping
*

Alignment
uniqueness depends on which regions are enriched for the protein you are immuno-precipitating
H3K27ac:# reads processed: 39’897’199# reads with at least one reported alignment: 33’984’279 (85.18%)# reads that failed to align: 2’568’674 (6.44%)# reads with alignments suppressed due to -m: 3’344’246 (8.38%)
H3K9me3# reads processed: 82’402’674# reads with at least one reported alignment: 29’278’881 (35.53%)# reads that failed to align: 11’211’423 (13.61%)# reads with alignments suppressed due to -m: 41’912’370 (50.86%)

Alignment
I use Bowtie
no gaps no clipping
~35-40’ for 25 millions reads using 4 cores
REF: AGCTAGCATCGTGTCGCCCGTCTAGCATACGCATGAREAD: AAAGTGTCGCC-GACTAGCTCC

Alignment
Gaps Clipping
Bowtie no no
Bowtie2 yes yes
Bwa yes yes
Novoalign yes yes

Alignment
Hard trimming impossible
Bowtie Novoalign673,126 1,129,1461,076,966 2,167,620

Alignment
bowtie -t -v 2 -m 1 -S -p 8 --phred33-quals /db/bowtie/mm9/mm9 sample.fastq sample.SAM
-m 1 uniquely alignable reads only -v 2 up to two mismatches -S SAM output -p 8 uses 8 CPUs --phred33-quals quality scores /db/bowtie/mm9/mm9 the genomic index

SAM/BAM formats

SAM/BAM formats
HWI-ST880:111:D1101ACXX:5:1101:1145:2177_1:N:0:ATCACG
16
chr10
81521146
255
51M
*
0
0
ACTTCACTCATGAAGAATGGGCTTTGCTGGATTCTTCCCAGAAGAGTNTCT
DEFIFGEFCF@BFF9GFFBFBEAE@;FFBA>C9EFEEFDA4>F?B=4#@@?
XA:i:1
MD:Z:47C3
NM:i:1

SAM/BAM formats
HWI-ST880:111:D1101ACXX:5:1101:1145:2177_1:N:0:ATCACG
16
chr10
81521146
255
51M
*
0
0
ACTTCACTCATGAAGAATGGGCTTTGCTGGATTCTTCCCAGAAGAGTNTCT
DEFIFGEFCF@BFF9GFFBFBEAE@;FFBA>C9EFEEFDA4>F?B=4#@@?
XA:i:1
MD:Z:47C3
NM:i:1
http://picard.sourceforge.net/explain-flags.html

SAM/BAM formats
HWI-ST880:111:D1101ACXX:5:1101:1145:2177_1:N:0:ATCACG
16
chr10
81521146
255
51M
*
0
0
ACTTCACTCATGAAGAATGGGCTTTGCTGGATTCTTCCCAGAAGAGTNTCT
DEFIFGEFCF@BFF9GFFBFBEAE@;FFBA>C9EFEEFDA4>F?B=4#@@?
XA:i:1
MD:Z:47C3
NM:i:1
Example: 3S8M1D6M4S
3 soft, 8 match, 1 deletion, 6 match and 4 soft

PCR duplicates
These reads are likely to have been generated by a non-random amplification process (PCR) rather than random fragmentation
(unless you have a very low genomic coverage or a very highsequencing depth)
Consider just one (or a number estimated using a statistics)

Data visualization
UCSC genome browser: http://genome.ucsc.edu Very important to get acquainted with your data!
http://genome.ucsc.edu/cgi-bin/hgTracks?hgS_doOtherUser=submit&hgS_otherUserName=Irosbarozzi&hgS_otherUserSessionName=Epigen_20121031

Peak calling
I use MACS and RSEG
Adapted from PMID: 21934668

Peak calling
MACS is very good in:- finding SHARP signals in IP versus a control (e.g. TFs)- finding small but reproducible differences among IPs (e.g. changes in chromatin marks after challenging the cells with toxin or drugs that span down to less than 1 kbp, Nos2 example: chr11:78,683,143-78,694,401)
RSEG is very good at:- finding BROAD signals in IP versus a control (e.g. H3K9me3)- finding domain-level chromatin changes between different IPs

Peak calling: MACS
macs14 –t IP.SAM –c input.SAM --name=IP_vs_input --format=SAM --tsize=51 --gsize=2.72e9 --wig --single-wig --pvalue=1e-5 --format=SAM --space=10
P-value threshold: --pvalue=1e-5 --wig --single-wig --format=SAM
If you do not have any input/IgG: --nolambda

Peak calling: MACS

Peak calling: RSEG
IP versus random expectation (no control):rseg -c mouse-mm9-size.bed -o $PWD -i 20 -v -d deadzones-k36-mm9.bed H2AK5ac_UT.tags.bed
IP versus control:rseg-diff -c mouse-mm9-size.bed -o $PWD -i 20 -v -mode 2 -d deadzones-k36-mm9.bed H2AK5ac_UT.tags.bed input.tags.bed
IP versus IP:rseg-diff -c mouse-mm9-size.bed -o $PWD -i 20 -v –mode 3 -d deadzones-k36-mm9.bed H2AK5ac_LPS_2h.tags.bed H2AK5ac_UT.tags.bed

Peak calling: RSEG

Peak calling
PMID: 20628599

Peak calling
PMID: 20628599

Normalization
Can we compare datasets with a different sequencing depth?
How do we normalize on sequencing depth?

Assumption: linearity

Summary
Quality control Alignment to the reference genome Dealing with PCR duplicates Data visualization Peak calling

Summary
H3K27ac:# reads after quality filtering: 39’897’199# reads with a unique alignment on the genome: 33’984’279 (85.18%)# reads after PCR duplicates: 31’069’231 (77.87%)
H3K9me3# reads after quality filtering: 82’402’674# reads with a unique alignment on the genome: 29’278’881 (35.53%)# reads after PCR duplicates: 26’273’699 (31.88%)
H3K4me3 (with strong PCR bias)# reads after quality filtering: 28’681’583# reads with a unique alignment on the genome: 16’928’963 (59.02%)# reads after PCR duplicates: 2’715’994 (9.47%)

Experimental (qPCR) validationMost significant
Least significant
Negative controls

FAQs: how deep?
What is the efficiency of your antibody (SNR)? What is the fraction of the genome potentially covered by the protein of interest?
Saturation plots

FAQs: how deep?

FAQs: how deep?
PU.1 (TF) H3K4me1 H3K9me3
~50 Mbp ~140 Mbp ~150 Mbp(>250 Mbp)

FAQs: how deep?
You always have the opportunity to sequence your library again and increase the depth!
PU.1 (TF) H3K4me1 H3K9me3
100% ~ 19M(PCR bias < 15%)(30M raw reads)
100% ~ 20M(PCR bias < 15%)(30M raw reads)
100% ~ 30M(PCR bias < 15%)(60M raw reads)

FAQs: what about the control?
Which is the best control?Ideally the best control is the IP performed in the same cells in which the protein is not expressed. This is rarely feasible.Input of the IP and IgG are equally good control.
What if no experimental control is available?Don’t worry you can run your analysis without estimating local biases. In most cases artifacts are a small fraction on the total number of enriched regions and won’t dramatically affect the results.

Galaxy
https://main.g2.bx.psu.edu/

Fish the ChIPs
A Mac GUI for ChIP-seq analysis http://bio.ifom-ieo-campus.it/ftc/

UCSC session
UCSC session at:http://genome.ucsc.edu/cgi-bin/hgTracks?hgS_doOtherUser=submit&hgS_otherUserName=Irosbarozzi&hgS_otherUserSessionName=Epigen_20121031
Murine macrophages Untreated and LPS 4h Pu.1, H3K4me1, H3K4me3
Peaks coordinates in BED for Pu.1 UT can be downloaded from:http://www.zeroidee.org/iros/bws_rome/Pu.1_UT/

Supplementary: manipulating files
Samtoolshttp://samtools.sourceforge.net/samtools.shtml
Bedtoolshttp://code.google.com/p/bedtools/
Picardhttp://picard.sourceforge.net/

Supplementary: useful literature
Nature Methods 6, S22 - S32 (2009)Computation for ChIP-seq and RNA-seq studiesShirley Pepke, Barbara Wold & Ali Mortazavi
Nature Reviews Genetics 10, 669-680 (October 2009) ChIP–seq: advantages and challenges of a maturing technologyPark PJ
Nat Immunol. 2011 Sep 20;12(10):918-22. doi: 10.1038/ni.2117.ChIP-Seq: technical considerations for obtaining high-quality data.Kidder BL, Hu G, Zhao K.
PLoS One. 2010 Jul 8;5(7):e11471.Evaluation of algorithm performance in ChIP-seq peak detection.Wilbanks EG, Facciotti MT.

Supplementary: FASTQ format - replace the spaces
@descriptionRead/Tag
+descriptionQscores