chip tracker: a microarray laboratory information management system
TRANSCRIPT
Chip Tracker: a Microarray Laboratory Information Management System
Patricio Yankilevich
M.Sc Project Dissertation
for the Degree of Master Science in Informatics with specialism
in Bioinformatics
The University of Edinburgh
September 2003
-2-
Chip Tracker: a Microarray Laboratory Information Management System
Author: Patricio Yankilevich
School of Informatics, University of Edinburgh
Academic supervisor: J. Douglas Armstrong PhD
School of Informatics, University of Edinburgh
Industrial supervisors: Dr. Vitali Proutski - Dr. Ann Brown
Organon Research Unit, Organon Laboratories ltd.

-3-
Declaration
This project was carried out between May and September 2003. The work discussed
in this dissertation, unless otherwise stated, is my own; and the manuscript has been
composed myself.
Patricio Yankilevich
School of Informatics
The University of Edinburgh
September 2003
-4-
Abstract In this project a Microarray Laboratory Information Management System (Microarray
LIMS) was designed and developed to become part of the integrated bioinformatics
infrastructure for the Organon GeneChip microarray facility. The software complies
with microarray communication standards and uses an industry standard relational
database management system combined with a platform-independent web browser
interface for data entry and retrieval. Therefore it is portable and flexible and can also
be used as a stand alone tool to manage a microarray laboratory workflow.
The resulting system guides the users through the microarray laboratory workflow
steps facilitating the management and tracking of biological samples and microarray
chips via a user friendly interface. In addition to this, the application automates the
data collection process, tracks the chips that have been ordered and prompts pre
populated purchase orders of chips, controls the assignation of samples to chips for
hybridisation. It randomises chip usage and also logs hybridisation results and chip
faults as part of the QC procedures. Finally, a highly flexible reporting tool enables
the users and laboratory managers to search the database on the usage history of the
platform.
This project captures and systemises the real microarray laboratory workflow and thus
improves performance and minimises human errors added to the microarray
experiment.

-5-
Acknowledgements I would like to thanks my both families for all the love and support they have given
me. Thanks especially to wife Juliana, for providing me with a stable home
environment and to my parents Oscar and Ana for their financial support.
I would like to take this opportunity to thanks Douglas Armstrong my academic
supervisor for letting me take this challenging project at an industrial collaborator. I
would like to thanks my industrial supervisors Vitali Protski for his advice and Ann
Brown for her assistance and for providing me with a friendly work environment.
Finally, I would like to thanks Mark, Julie and David from the Chip team, Bridget
from System development, and Alistair and Donald from the Bioinformatics team for
helping me with the final corrections.

-6-
Table of contents
Abstract ......................................................................................................................4
Acknowledgements .................................................................................................5
Table of contents .....................................................................................................6
Chapter 1: Introduction .......................................................................................8 Organon Microarray Facility .........................................................................................8 Microarray LIMS ...........................................................................................................9 Objectives and Solution ...............................................................................................10
Chapter 2: The Microarray ..............................................................................11 The New Paradigm of Drug Discovery .......................................................................11 Introduction to Functional Genomics ..........................................................................11 Microarray Technology ...............................................................................................12 Microarray Experiment ................................................................................................16
Chapter 3: Laboratory Information Management Systems and Microarray LIMS .................................................................................................20 Laboratory Information Management Systems (LIMS) ..............................................20 Microarray LIMS .........................................................................................................21
Chapter 4: Chip Tracker and the Organon Microarray Experiment Process.......................................................................................................................24 The Organon Microarray Experiment Process ............................................................24 Microarray Laboratory Workflow and Chip Tracker Scope........................................28
Chapter 5: Chip Tracker Design and Architecture .................................31 Presentation Tier (Front End) ......................................................................................33 Middle Tier ..................................................................................................................36 Database Management Tier (Back end).......................................................................38 Integration with existing Systems................................................................................40
ExpAnD..............................................................................................................40 Rosetta Resource Tracker...................................................................................41 Rosetta Resolver .................................................................................................41
Chip Tracker Deployment............................................................................................42
Chapter 6: Chip Tracker XML Parser and the Microarray Experiment Standards ........................................................................................44 MIAME, MAGE and other Standards .........................................................................44 Chip Tracker XML Parser and the Gene Expression Markup Language (GEML) .....45
Chapter 7: Understanding Chip Tracker Features..................................49 Logging On and Off.....................................................................................................50 Chips in Stock ..............................................................................................................51

-7-
Samples in Stock..........................................................................................................54 Prompt of Purchase Orders ..........................................................................................57 Chips Arrival................................................................................................................58 Assignation of Chips to Samples .................................................................................59 Log of Hybridised Chips..............................................................................................63 Statistics and Custom Reports .....................................................................................64
Chapter 8: System Validation of Chip Tracker ........................................66 System Validation........................................................................................................66 Control Life Cycle of the project .................................................................................67 User Acceptance Test ..................................................................................................67
Chapter 9: Conclusion and Future Work....................................................69
Bibliography ...........................................................................................................71
Appendix A: GEML .xml example file ........................................................74
Appendix B: SQL commands .........................................................................75
Appendix C: User Acceptance Test ..............................................................77

-8-
Chapter 1
Introduction
The past decade has seen dramatic progress in the development of high throughput
life science technologies such as microarrays, which have become the technology of
choice for gene expression analysis. Microarray technology has enabled researchers
in the field of functional genomics to conduct new types of experiments that generate
immense amounts of data. The data created from these microarray experiments
necessitates the creation of tools that can manage both the biological and experimental
information used in a microarray experiment workflow more effectively and
efficiently. While many scientists are focusing on the analysis of the microarray data
other issues such as data management, quality, and standards remain to be addressed.
This project presents the “Chip Tracker”, a Microarray Laboratory Information
Management System (Microarray LIMS), designed to manage and track the
submissions of biological samples and microarray chips used in the microarray
laboratory. The project has been carried out with the aid of an industrial collaborator
Organon Laboratories Ltd., at the Organon Research facility in Newhouse, Scotland.
Organon have recently installed their first microarray facility, an Affymetrix DNA
Microarray platform.
Organon Microarray Facility
The Organon Microarray facility carries out microarray experiments on thousands of
biological samples sent to the facility each year. Systems have been developed to
capture the experimental annotation of RNA samples submitted to the microarray
laboratory (Expand), to deal with the day to day management and processing of the
RNA samples (Resource Tracker) and to migrate data from both Expand and the
Affymetrix platform to the Resolver data analysis software. These components
-9-
interact to produce a fully integrated data management infrastructure for the
microarray platform. None of them however deal with the actual Chips used by the
facility.
The users of the microarray facility request to have their RNA samples hybridised to
one or more of the thirteen different types of Affymetrix Chips. The experimental
results obtained from the hybridisation are very valuable but also expensive and time
consuming. It is therefore important to ensure correct assignment of samples to chips.
With each Chip costing in excess of £300 and up to 2,000 Chips being used each year
it is apparent that some type of tool is required to track the Chip usage by the facility,
from purchase to final quality control analysis. Before the implementation of this
project the chip information was stored in Excel spreadsheet and the purchase of chips
was based on direct communication with the microarray platform customers. These
methods soon however became unwieldy due to the large number and variety of Chips
being processed by the facility. By taking all of the above factors into account the
decision was taken to add Chip Tracker microarray LIMS component to the existing
infrastructure of the microarray facility.
Microarray LIMS
Laboratory Information Management Systems (LIMS) are used by many types of
laboratories for capturing data during the experimental process. Such LIMS can be
used in research and development, in-process testing, quality control and assurance.
There is a small number of integrated systems that deal with the management of the
microarray experiment process as BioArray Software Environment (BASE),
GeneTraffic and Affy LIMS. These systems are customisable bioinformatics
solutions, but none of them address completely the necessities of a microarray
laboratory workflow such as tracking and administration of the materials used in the
microarray lab. Capturing this data is essential for both good house keeping and the
analysis of the data produced by the experiments.

-10-
In the absence of a commercially available alternative it was decided to custom build
a Chip Tracker database and data entry tool to be integrated with the existing
bioinformatics infrastructure of the Organon microarray platform.
Objectives and Solution
The main objective of this project is the development a system to enable the
microarray laboratory workers to manage and track the submissions of biological
samples and microarray chips that are been used through the microarray laboratory
workflow. As a solution we present the Chip Tracker, a microarray LIMS that
automates some of the tasks carried out in the laboratory worker and guides him/her
along the steps of the laboratory workflow via a user friendly web interface.
The Chip Tracker application also tracks the chips that have been ordered and
prompts pre populated purchase orders of the necessary chips depending on the
samples arriving in the laboratory. Other laboratory procedures within the microarray
experiment workflow are also managed from the Chip Tracker application. Such
procedures include control of the assignation of samples to chips for hybridisation,
randomisation of chip usage, log of chip faults (part of the QC procedures) and
creation of statistical reports on platform usage.
The system developed in this project not only fully integrates with the existing
Organon microarray platform, but also can be used as a stand-alone microarray LIMS.
Finally, this project addresses the needs raised by the scientists working in the
microarray lab and captures the real microarray laboratory workflow.

-11-
Chapter 2
The Microarray
The New Paradigm of Drug Discovery
Biological and biomedical research is in the midst of a significant transition driven by
two primary factors: the massive amount of DNA sequence information and the
development of new genomics technologies to exploit it. Consequently, we find
ourselves at a time when new types of experiments are possible, and observations,
analysis and discoveries are being made on an unprecedented scale [McConnell et al.,
2002].
Genomics technologies and in particular DNA microarrays are rapidly increasing our
understanding of disease, drug targets, and, in the future, how drugs may be used in
the clinics. Such an understanding would potentially improve the traditional drug
discovery pipeline, enabling better decisions to be made earlier in the therapeutic
discovery and development process. Better decisions should ultimately result in better
drugs and therapies and allow safer drugs to reach the market sooner. Microarray
applications in drug discovery are expanding and included basic research and target
discovery, biomarker determination, pharmacology, toxicogenomics, target
selectivity, development of prognostic tests and disease-subclass determination
[Butte, 2002].
Introduction to Functional Genomics
As mentioned above, the constant advances in molecular biological, analytical and
computational technologies are enabling us to systematically investigate the complex
molecular processes underlying biological systems. Over the past few years, more
than 60 organisms have had their genomes completely sequenced, with another 170 or
so are in progress (see www.tigr.org). The sequence of human genome has been
-12-
deciphered, by both public and private efforts, and the complete sequence of mouse
and other animal and plant genomes are nearing completion. Unfortunately, the DNA
sequence does not tell us what the genes do, how cells work, how cells form
organisms, what goes wrong in disease, how we age or how to develop a drug or how
a phenotype is determined. Thus, functional genomics has become an increasingly
important scientific discipline [McConnell et al., 2002]. This rapid accumulation of
genome sequence data represents the beginning of a fundamentally new kind of
biological research ushering in the so called ‘post-genome era’.
Functional genomics is the study of gene function through the parallel expression
measurements of genomes, most commonly using the technologies of microarrays and
serial analysis of gene expression (SAGE). The successful use of these large-scale
functional genomics technologies depends on robust and efficient systems for tracking
and managing material and information flow.
Microarray Technology
In this new setting for biological research, DNA array technologies (microarrays) that
allow for the simultaneous recording of thousands of gene expression levels in a
single experiment have acquired a special role. This technology has opened new ways
of looking at organisms in a genome-wide manner. It is now possible to study
complete genome patterns of gene expression in prokaryotes or in simple eukaryotes
like yeast or C. elegans while in higher organisms, like humans, tens of thousands of
genes related to a given living system can be monitored [Dopazo, 2002].
Microarrays work by hybridisation (non-covalent chemical bonding) of fluorescently
labelled RNA or DNA in solution to DNA molecules (probes) that are attached to
specific locations on the chip surface. The hybridisation reactions take place in
parallel across the entire array at the same time. Thus, the hybridisation of a sample to
an array is, in effect, a highly parallel search by each molecule for a matching partner
on an ‘affinity matrix’. The eventual binding of labelled molecules to the surface-
bound probe is determined by the rules of molecular recognition. The process is
straightforward, highly parallel (all sequences are counted simultaneously), and, if
done correctly, quantitative [McConnell et al., 2002].

-13-
There are two dominant types of microarrays that have been extensively used for most
global gene expression measurements or experiments. The first, which is the one used
in the Organon microarray laboratory, are high-density arrays of oligonucleotides
(short strands of nucleic acids). The oligonucleotide strands are directly synthesised
on glass wafer surface using a process of light-directed combinational synthesis
known as photolithography [Lockhart et al., 1996]. A single oligonucleotide array can
contain more than 500,000 probes, typically of 25 bases long, in an area smaller than
half-inch square. The human U133A array, for example contains over 260,000
different probes that together measure the expression of 22,283 different transcripts
(or potential genes) at once. The process of hybridisation and scanning the chips
requires highly expensive equipment, increasing the need to maximise usage and
minimise failures or delays in the utilisation of the facility. This type of microarray is
known as one-channel arrays and is commercially available from Affymetrix under
the name of ‘GeneChip’.
The other main array type, cDNA array (also called spotted DNA array), consists of
solid support (usually nylon or glass) where cDNA or oligonucleotides are arrayed in
a fixed pattern. Fluorescent DNA derived from mRNA coming from the control and
test samples are competitively hybridised to the complementary DNA probes on the
array. The radioactive or fluorescence emissions of specifically bound probes are
detected using an appropriate scanner. These intensity values are proportional to the
amounts of specific RNA, originally present in the cell [Schena et al., 1995]. Two
different samples, the control and the treatment, are hybridised to a single cDNA
array. This is also called a two-channel array.
Before hybridisation, samples under study are often amplified and then labelled with
fluorescent dyes. The samples are then hybridised to the microarray, and they bind to
complementary probes affixed to the microarray surface. The arrays are then scanned,
producing a fluorescent image where the fluorescent intensity at any particular probe
location indicates the relative concentration of complimentary RNA sequence present
in the sample. This enables a quantitative estimate of each gene expression to be
calculated. Figures 1 and 2 (provided by Affymetrix) shown how the GeneChip
oligonucleotide array is built and how it works.

-14-
A.
B.
C.
Figure 1. Oligonucleotide array technology. A) Cartoon depicting a single feature on an Affymetrix GeneChip® microarray. B) Hybridisation of tagged probes. C) Scanning of tagged and un-tagged DNA [figures provided by Affymetrix, 1].
-15-
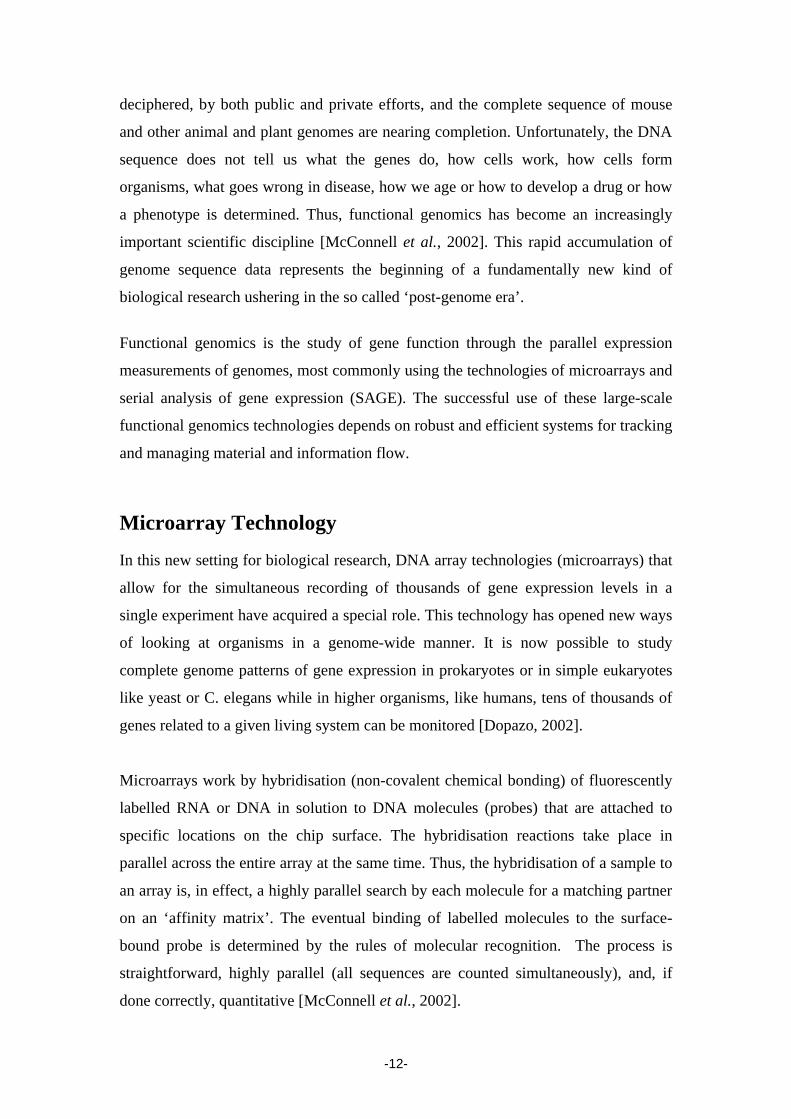
Figure 2. Overview of gene expression measurements with an Affymetrix platform. The process begins with mRNA samples from cells which are labelled with a fluorescent dye and hybridise to the microarray chip. Messenger RNA expression levels are determined using the quantitative fluorescent image. The process starts with the original RNA (oRNA) à copy DNA (cDNA) à labelled copy RNA (lcRNA) à fragmented labelled copy RNA (flcRNA) à Hybridisation à Wash and Stain à Scan [adapted from figures provided by Affymetrix, 2].
Current evidence implies that oligonucleotide-based arrays are more reliable for
global screening, as thus give a more accurate and comprehensive representation of
gene expression profile compared to long cDNA array. While direct synthesis of
oligonucleotides by the photolithographic process offers the advantage of abolishing
the need to hydrolyse the oligonucleotide from its synthetic support and re-attach it to
the microarray, this approach does not allow an independent confirmation of the
fidelity of synthesis. Because of this and because this approach does not allow
purification of oligonucleotides prior to attachment to the microarray, oligonucleotide
chip manufacturing can lead to internal errors. Batch-to-batch variance may also
contribute to data bias, as separate samples are hybridised to separate chips when
using oligonucleotide arrays [Li et. al., 2001]. In order to tackle this problem the
application developed in this project is endowed with a random assignation of chips to
samples process that will be explained later.

-16-
Organon acquired an Affymetrix GeneChip system to perform its microarray
experiments in 2002. This system is made of the following four components:
Probe Arrays or Chips: GeneChip probe arrays are available in human, rat, mouse
and other model organisms. A full range of custom formats is also available.
Hybridisation Oven: The GeneChip 640 Hybridisation Oven can process from 1 to
64 arrays per cycle. The oven delivers precise temperature control for consistent
performance across all probe array applications.
Fluids Station: The FS400 Fluidics Station automates staining and washing of up to
four arrays at once.
Scanner: After processing in the Fluidics Station, probe arrays should be stored as
recommended and transported to a centrally located scanner.
Figure 3. Affymetrix GeneChip Platform [adapted from a figure provided by Affymetrix, 3].
The Affymetrix GeneChip platform had become the industry-standard microarray
experiment solution for genomics research. Initially applied for target identification,
GeneChip RNA expression analysis is being used by innovative biotechnology and
pharmaceutical companies downstream in target validation, lead optimisation and
clinical trials.
Microarray Experiment
The goal of a microarray experiment is to measure and compare the relative
expression levels of thousands of genes in a sample simultaneously. Typically, these
samples compare different stages of the cell cycle, cell types, healthy and diseased
cells or different treatments. A higher level goal of genomic and gene expression
experiments is to identify new genes involved in a pathway, potential drug targets or
expression markers that can then be used in a predictive or diagnostic fashion.

-17-
A typical microarray experiment involves the following steps:
1. Experiment design
2. Biological experiment to isolated total RNA Sample from the biological specimens
3. The Sample is treated and labelled with fluorescent dye
4. Hybridisation of the labelled Sample to the Array Chip
5. Washing, staining, and scanning of the Array Chip
6. Analysis of the scanned image
7. Generation of gene expression profiles
Figure 4. Microarray experiment workflow. A typical microarray experiment workflow involves preparation of the biological samples (orange), array production (blue), in this case is supply by Affymetrix, and array hybridisation, scanning and image analysis (yellow). The actions taking place before and after the microarray laboratory workflow are in green [adapted from a figure provided by Amersham].
Figure 4 shows a detailed schema of the actions performed on a microarray
experiment. Note that the tasks involved in the design and manufacture of the array
itself are not performed at the Organon microarray laboratory. The arrays are provided

-18-
by Affymetrix as a part of an agreement between Organon and Affymetrix. The
GeneChip arrays most widely used by Organon are:
• Human Genome U133A and U133B
• Rat Genome U34A, U34B and U34C (and its new versions)
• Murine Genome U74A, U74B and U74C (and its new versions)
Figure 5. Microarray chip type availability provided by Affymetrix. Phylogenetic tree schematic illustrating GeneChip arrays available today [adapted from a figure provided by Affymetrix, 4].
Microarray technology is associated with handling great amounts of data generated at
different steps during the respective microarray experiment. This data must be
processed and stored appropriately for the evaluation of experimental results. Several
standardisation approaches have been developed for the description of microarray
experiments during recent years by various institutions and companies. The most
promising approach is the MIAME (Minimum Information About Microarray
Experiments) standard, an international initiative supported by EBI (European
Bioinformatics Institute) whose aim is to provide a standard defining the required
minimum information that has to be stored and transferred for a gene expression
microarray study. MIAME is not a formal specification, but a set of guidelines. An
explanation of MIAME and other standards is given on chapter 6.
-19-
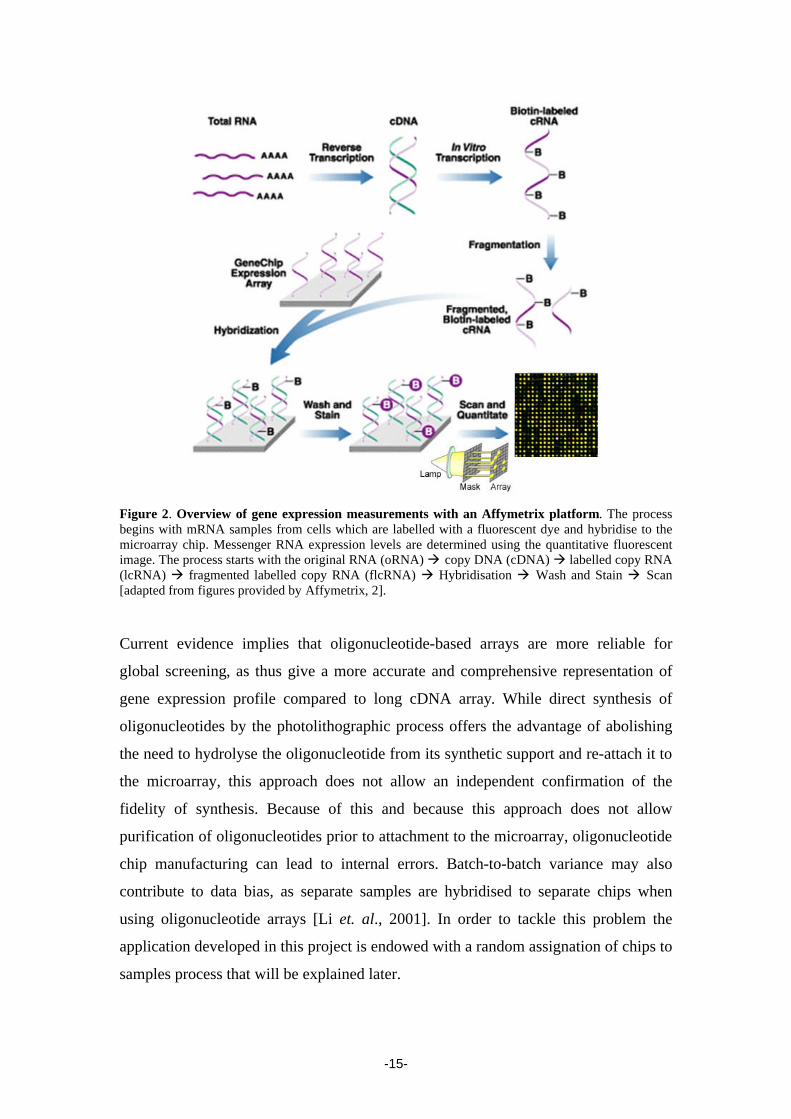
The use of standards to integrate genomic analysis throughout drug discovery and
development is important for transforming the drug discovery pipeline paradigm and
will allow researchers to meet the challenges ahead. Figure 6 illustrates some
examples of how the microarrays genomic experiments are used in the different stages
of the new process of drug discovery.
Figure 6. Modern pipeline of drug discovery. Some examples of genomic experiments involving the use of microarrays at different stages of the process are also presented [adapted from a figure provided by Affymetrix, 5].
“The ultimate challenge to the bioinformatics community is the intelligent integration
of data from many interrelated sources, which will be necessary to take greatest
advantage of the knowledge in the data” [Searls, 2000]. It is this integration that
enables scientists to turn data into knowledge for answering complex questions in
system biology and drug discovery.
A complete system for expression arrays requires the implementation and
development of different experimental protocols, databases and bioinformatics tools
for data collection and analysis. Because of the recent advances in computational and
statistical techniques, many scientists are focusing on the analysis of microarray data
and developing models from these data. At the same time, issues of data collection,
quality, and standards remain major bottlenecks to obtaining useful and applicable
results [Bobashev et al., 2002]. The aim of this project was focus on the development
of a Laboratory Information Management System (LIMS) that implements these
pending issues to avoid any possible bottlenecks while performing the microarray
experiments.

-20-
Chapter 3
Laboratory Information Management Systems
(LIMS) and Microarray LIMS
Laboratory Information Management Systems (LIMS)
The task of managing laboratory data is not a new one. Over the past two decades the
use of LIMS has revolutionised how laboratories manage their data. A LIMS is more
than software; it has become the workhorse of the laboratory encompassing laboratory
workflow combined with user input, data collection, instrument integration, data
analysis, user notification, delivery of information and reporting [Turner, 2001]. The
essential concept of a basic LIMS is that of a computer system which would automate
the clerical activities associated with the processing of the analytical results,
improving accuracy and turnaround times to an acceptable level. LIMS is a technique
independent of discipline and has applications in any industry where laboratory
analysis is important, from Healthcare to Food & Drink and Pharmaceutical
industries. A typical LIMS computer system bridges the gap between the analyser and
the company’s financial and administrative mainframes in all but the smallest labs.
Most LIMS require considerable customisation to meet the needs of a specific
laboratory. A customised LIMS will focus on the special aspects of their users needs.
Differences in research and development or production chain in the individual
organisations lead to an increase of the interest in customized systems [Bund et al.,
1998]. Usually, also for customized systems, the core software is commercially
available, although this is not the case for microarray LIMS, the applications on the
market are not flexible or simple enough to be easily adapted to the client laboratory
needs.

-21-
Many of the most popular commercial LIMS take advantage of open systems
architectures offering client-server capabilities and enterprise-wide access to lab
information with web-based front-end. The development of microarray technology
gives place to a new kind of laboratories and experiments that are now part of the new
process of drug discovery. Thus the requirements of research groups and laboratory
workers are changing. In the last few years microarray laboratories had been created
in most of the big R&D companies and with them the need of new LIMS, microarray
LIMS, is increasing.
A LIMS system can be understood from different viewpoints:
• To an analyst, LIMS is indeed the computer system which interfaces to his
analyser, computes, stores data, and prints results;
• To a laboratory manager, it is the system which lets him track samples, identifies
their current status, audits their turnaround times, and provides better data on
usage than he could ever have obtained from the best-organised of paper records;
• To a management information systems analyst, however, LIMS can and must be a
feeder system, passing resource management data to the corporate mainframe.
Microarray LIMS
A reasonable working definition of the role of analytical laboratory is that it must
deliver accurate, understandable results to the originator of the request for analysis,
within a suitable timescale. As mentioned earlier for a microarray laboratory such an
operation entails the sequence of receiving the biological samples and chips, ordering
of chips if needed, assigning corresponding chips to samples, processing samples,
hybridising, checking the results, (if necessary re-hybridise the sample), passing this
information to the bioinformatics team for analysis and issuing a report to the
requester. It is important to note that much of this cycle relates, not to analysis or
hybridisation, but to the clerical handling of elements and results of the
hybridisations. A microarray LIMS not only should guide the lab worker to perform
this tasks, but it is also an indispensable tool for the laboratory manager to track
resources, to complete statistical QC/QA routines, document and summarise resource
-22-
utilisation within the laboratory. Such factors are key when very high cost genomics
experiments are being completed.
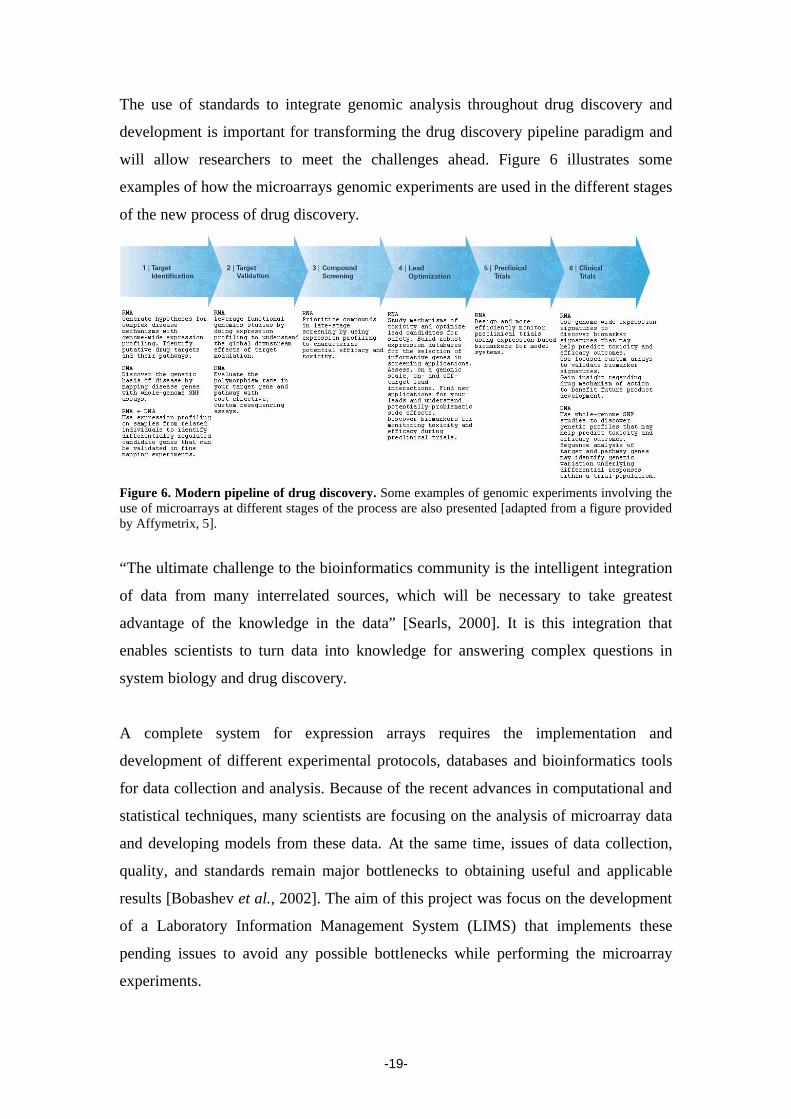
The following academic data management for microarrays systems were evaluated for
its suitability for Organon microarray laboratory requirements. MADGE [Kokocinski
et al., 2003], a data management software for cDNA microarrays. BioArray Software
Environment (BASE) [Lao et al., 2002], a more flexible platform for comprehensive
management and analysis of microarray data. And finally, QuickLIMS [McIndoe et
al., 2003], a LIMS system to manage data for the DNA-microarray fabrication.
Although this projects are LIMS participating on different stages of the microarray
process, none of them cover the microarray laboratory workflow data management
specifically as Chip Tracker does, making this project novel and necessary. Some of
these systems do not appear in the following table due to its recent release.
Figure 7. Mainstream Academic Microarray Software. The table show the lack of LIMS systems in the field [3rd Millennium].
The commercial options for microarray LIMS are also very few. There is a new
product by Amersham Biosciences, Scierra™ Microarray Laboratory Workflow
System, which is a complete management system for microarray experiments and
gene expression data which includes LIMS aspects. This software is probably the best
option and is not included in the following table due to its recent release into the
market.

-23-
Figure 8. Mainstream Commercial Microarray Software. As shown there is also a lack of LIMS systems in the market. The systems shown covering LIMS functionality are not designed for a microarray laboratory workflow but for a microarray experiment workflow [3rd Millennium].
The general lack of software in microarray LIMS is because this is a new and
emerging field. At the Scottish Bioinformatics Forum 2003 which took place in July
at the National e-Science Centre in Edinburgh, Professor David Gilbert, Director of
the Bioinformatics Research Centre at the University of Glasgow talked about the
present challenge for Bioinformatics to close the gap between computational (in-
silico) and wet-lab research, and the growing need of better LIMS to really contribute
to R&D in biomedical and life sciences.
-24-
Chapter 4
Chip Tracker and the Organon Microarray
Experiment Process
The Organon Microarray Experiment Process
The Organon Microarray Experiment Process utilises four computer systems,
ExpAnD, Chip Tracker (now been incorporated), developed in-house, plus Rosetta
Resource Tracker and Resolver that were developed by Rosetta Biosoftware. With the
integration of these four systems and the adherence to standard operating procedures
in the laboratories, the Organon Microarray Experiment Process is a MIAME
compliant platform for the storage, normalisation, presentation and publication of data
obtained from microarray experiments.
The microarray experiment process requires the input from a multidisciplinary team
of people. The laboratory researchers design their chip experiments with help of the
CSB (Chip Statistics and Bioinformatics team). They are responsible for defining the
experimental annotation and generating the RNA for the hybridisations. The
microarray lab workers, who are members of the Chip team, are responsible for
creating labelled, fragmented cRNA from the original RNA and hybridising it to the
chip. The CSB and Bioinformaticians are responsible for analysing the data. The
Bioinformaticians work with the Systems team to maintain the databases and
infrastructure of the platform.
Standard Operating Procedures documents that enable the users and Chip team to
carry out microarray experiments have been publish online on the intranet. The
procedure steps required for the process are the following (see figure 9):
1) Experiment Design
2) Sample collection, RNA extraction and QC

-25-
3) Data entry into ExpAnD, and shipment to the microarray laboratory
4) Chip team process (guided by Chip Tracker and Resource Tracker)
5) Data retrieval from Resolver and Data analysis
Figure 9. Organon Microarray Experiment Process dataflow and systems. The figure shows the systems that participate in the Organon Microarray Experiment Process and it interaction.
1. Experiment Design
Experiment design is a critical step carry out by the researchers and the Chip Statistics
and Bioinformatics team (CSB). The final success of the experiment it is strongly
connected with a well defined design.
2. Sample collection, RNA extraction and QC
After experiment design the samples should be collected from the organism under
study, RNA prepared and quality controlled at the researcher’s laboratory.
3. Data entry into ExpAnD and shipment
In order to describe chip experiment details the researcher have to use the Experiment
Annotation Database (ExpAnD) to record all the details about the RNA samples that
will be used to hybridise to the chips. The ExpAnD process ends with a shipment
function that creates a list of XML files (XML LIMS Queue) with all the detail
information of the samples that have been sent to the microarray laboratory.
-26-
4. Chip Team Process (guided by Chip Tracker and Resource Tracker)
The Chip Team at Newhouse receives submissions of samples from the remote and
local research laboratories; both the Chip Tracker and Resource Tracker systems
automatically parse the XML LIMS Queue with all the information of the arriving
samples. We have developed the Chip Tracker XML Parser component that scans a
server directory for new experimental samples data that are uploaded into the Chip
Tracker Database without requiring an operator’s assistance. This process runs every
hour although its regularity can be set to a different interval or be stopped and
manually executed. This component will be explained in greater detail on chapter 6.
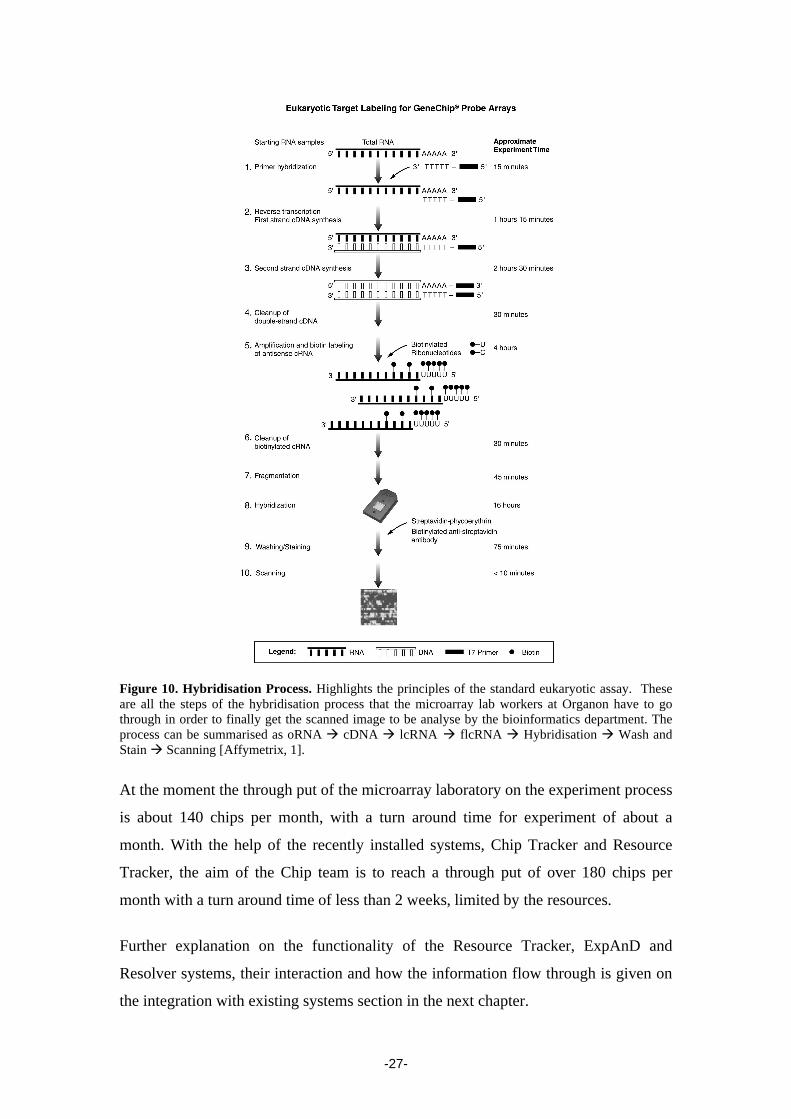
The Chip Team perform further QC on the samples and then use the total RNA to
perform: cDNA preparation, in vitro transcription, cRNA fragmentation, hybridisation
mix preparation, and finally hybridisation (unlike in two-channel cDNA arrays, a
single sample is hybridise on a GeneChip). After hybridisation and scanning, visual
chip QC and assessment of some QC parameters is performed, data that pass
requirements are transferred by FTP to the Rosetta Resolver server and automigrated
into the database. Figure 10 highlights the hybridisation tasks involved in the
hybridisation process that were previously enumerated in this paragraph. These are
the actions performed by the microarray lab worker with the guide of the Resource
Tracker system.
Note that in addition to the hybridisation tasks the microarray lab workers have to
perform management and tracking the biological samples and chips. These
management tasks (now performed by using Chip Tracker) together with the
hybridisation tasks conform the microarray laboratory workflow.
5. Data retrieval from Resolver and Data Analysis
Rosetta Resolver is Organon’s main chip data analysis software, and it is the
application that the users will first see their chip data on. The data analysis procedures
will largely depend on the design of the experiment and before actual data analysis to
identify genes of interest is started, some thought should be given to management of
the intensity hybridisations in the context of the experiment setup.
-27-
Figure 10. Hybridisation Process. Highlights the principles of the standard eukaryotic assay. These are all the steps of the hybridisation process that the microarray lab workers at Organon have to go through in order to finally get the scanned image to be analyse by the bioinformatics department. The process can be summarised as oRNA à cDNA à lcRNA à flcRNA à Hybridisation à Wash and Stain à Scanning [Affymetrix, 1].
At the moment the through put of the microarray laboratory on the experiment process
is about 140 chips per month, with a turn around time for experiment of about a
month. With the help of the recently installed systems, Chip Tracker and Resource
Tracker, the aim of the Chip team is to reach a through put of over 180 chips per
month with a turn around time of less than 2 weeks, limited by the resources.
Further explanation on the functionality of the Resource Tracker, ExpAnD and
Resolver systems, their interaction and how the information flow through is given on
the integration with existing systems section in the next chapter.

-28-
Microarray Laboratory Workflow and Chip Tracker Scope Chip Tracker forms part of an entire platform. This project is the latest to be added
and it completes the data management aspects of the microarray platform. Chip
Tracker was designed to follow the natural workflow of the microarray laboratory
worker. The main features of the Chip Tracker Microarray LIMS are:
• Manage and administrate the stock of samples and chips.
• Workflow management.
• Automated microarray experiment data collection and notifying the Chip team
of what chips are required for samples that are en route.
• Accurate tracking of chips and samples.
• Pre-populate and prompt purchase orders of the chips required to perform the
experiments for recently shipped samples.
• Load newly purchased chips into the system.
• Assign chips to samples for hybridisation.
• Log chips with the hybridisation results.
• Create custom reports and statistical analysis on the microarray facility usage.
Experimental information entered by the researcher is captured by the ExpAnD
system and is therefore not part of the microarray laboratory workflow and it is not in
the scope of the Chip Tracker system.
At the microarray laboratory most of the chip and sample tracking is now going to be
done by Chip Tracker, but the tracking of the extracts of the original RNA samples
while performing cDNA preparation, in vitro transcription, cRNA fragmentation,
hybridisation mix preparation, and the final hybridisation is done with the Resource
Tracker system. Although these tasks are part of the microarray laboratory workflow
it was not necessary to include them in the scope of this project. Resource Tracker is
an add-on component that fully integrates the Rosetta Resolver system, which as
mentioned earlier, was specifically developed by Rosetta for the Organon microarray
laboratory. Resource Tracker interacts with Resolver database and client interface
directly.

-29-
Figure 11 describes the Organon microarray laboratory workflow. Apart from the
RNA extractions during the hybridisation process, every step of the workflow is
guided by Chip Tracker. By looking at the figure you will be able to understand how
data flows through the Chip Tracker application.
Figure 11. Microarray laboratory workflow. This are the features cover by Chip Tracker to complete the Organon microarray laboratory workflow.
The following images (figures 12a and 12b) capture the scope of the Chip Tracker
project. Figure 12a was taken from the Chip Tracker Unified Modelling Language
(UML) model we developed in order to document and guide the project designing.
Figure 12a. Chip Tracker Use Case Diagram (taken from the Rational Rose Chip Tracker model).

-30-
Figure 12b illustrates how Chip Tracker interacts with the rest of the Organon
Bioinformatics infrastructure and what is the scope of activities of the application and
microarray laboratory.
Figure 12b. Chip Tracker Scope and Interaction. The image illustrates the interaction between the microarray platform systems and the activities perform at the microarray lab. Some of the main features of the Chip Tracker system are shown in orange arrows.
The retrieval of data from the scanned image and the posterior analysis of the
microarray data are perform by the Bioinformatics team. Organon had acquired
Rosetta Resolver, which is one of the best gene expression data analysis software
solutions in the market to help the bioinformaticians with these tasks.
As Chip Tracker is managing, tracking and administrating the chips and samples, and
Resource Tracker is tracking the RNA extracts along the different experimental steps,
all the functionality requirements of the Organon microarray laboratory workers are
completely fulfilled and systemised.
-31-
Chapter 5
Chip Tracker Design and Architecture The Chip Tracker microarray LIMS was designed to cover the management aspects of
the Organon microarray laboratory workflow and to be integrated with the existing
Bioinformatics infrastructure. Although the individual components of the system are
connected with specific laboratory environments, some general principles have guided
the project design. These include the compliance to the actual microarray software
communication standards and the use of an industry standard relational database
management system combined with platform-independent web browser interface for
data entry and retrieval. Chip Tracker is a web application that was designed using a
three-tier server model. A carefully designed user friendly web interface allows the
lab workers to gain password-protected access to the system remotely. The
functionality provided by Chip Tracker will help them to manage and perform the
steps in the microarray laboratory workflow.
The Chip Tracker has a three tier structure composed of a: Presentation tier, a Middle
(Application) tier and a Data Management tier. The Presentation tier, which is the
client side tier, is the Graphical User Interface (GUI) - an HTML based visual display
generated dynamically by Active Server Pages (ASP) that serves as the portal for the
lab worker to interact with the application. The Middle tier acts as an application
server, implementing the microarray experiment workflow logic in ASP and accesses
the Chip Tracker Database. A Visual Basic component to automate data collection of
the Samples being sent to the laboratory, called Chip Tracker XML Parser, is also
included in this tier. And finally, the Data Management tier running Oracle 8i
Relational Database Management System (RDBMS) where we have designed and
implemented the Chip Tracker Database, a simple database schema to model the
microarray laboratory workflow.
-32-
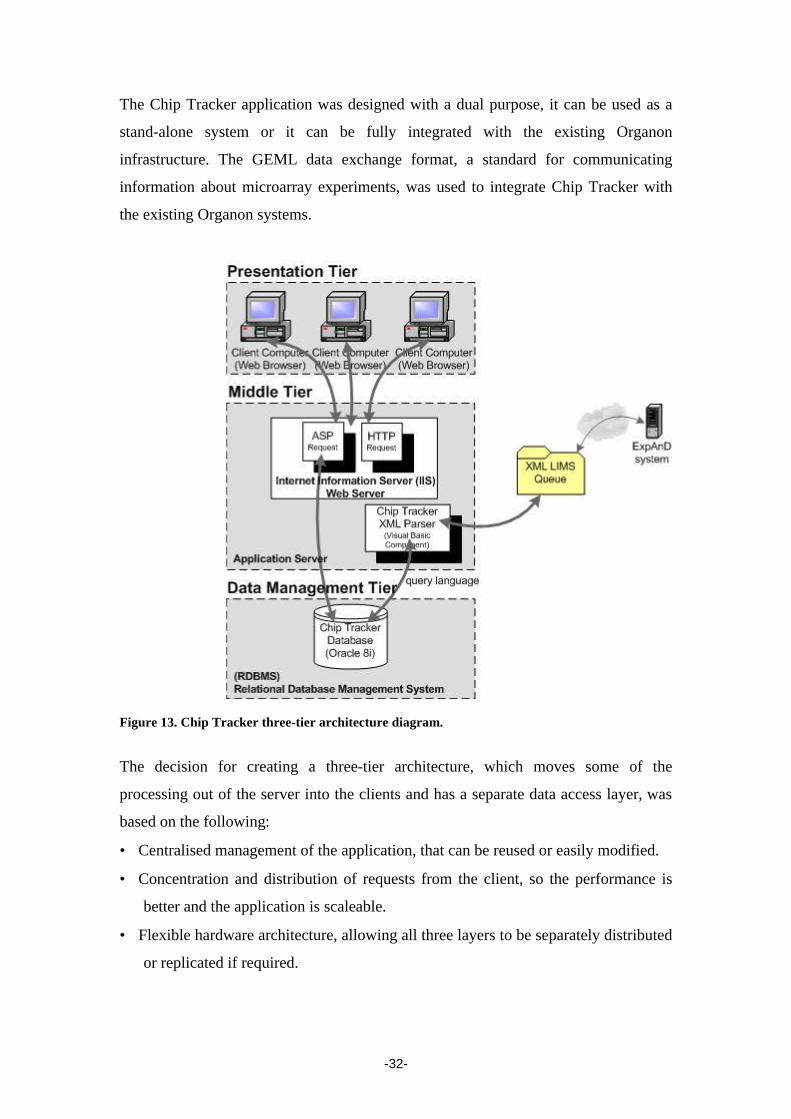
The Chip Tracker application was designed with a dual purpose, it can be used as a
stand-alone system or it can be fully integrated with the existing Organon
infrastructure. The GEML data exchange format, a standard for communicating
information about microarray experiments, was used to integrate Chip Tracker with
the existing Organon systems.
Figure 13. Chip Tracker three-tier architecture diagram.
The decision for creating a three-tier architecture, which moves some of the
processing out of the server into the clients and has a separate data access layer, was
based on the following:
• Centralised management of the application, that can be reused or easily modified.
• Concentration and distribution of requests from the client, so the performance is
better and the application is scaleable.
• Flexible hardware architecture, allowing all three layers to be separately distributed
or replicated if required.
-33-
• Integration of existing systems. The Chip Tracker XML Parser implemented in the
middle layer provides access to other microarray applications and hides
complexity.
• The middle layer offers a transparent access to underlying systems and contains
inter-system functionality.
• The middle layer also takes care of locating resources, accessing them and
gathering results.
This architecture would enable us to develop a better and more sophisticated
application with the only disadvantage that the resulting software can be more
complex and becomes more difficult to understand.
The choice of technologies used in this project is based on the Organon technical
standards and is a result of a common agreement between ourselves, Organon’s
Bioinformatics and Software Development teams. The Chip Tracker was the first
developmental project conducted in this way.
Presentation Tier (Front End) This layer represents the primary interface to the user. Special attention was made in
designing a user friendly Graphical User Interface (GUI), suitable for biologists
working at the microarray laboratory. The microarray laboratory workers had constant
input throughout the life cycle of the project to ensure that the system met their user
requirements.
Another advantage of the Chip Tracker three-tier architecture is the implementation of
what is known as Thin Client, which means that the clients implement only the
graphical user interface leaving the server side with the implementation of application
logic and the data management. A thin client makes the installation of the system
simpler because there is nothing to be installed on the client computer; a web browser
is all that is needed. This distribution allowed us to use the computing power at the
client for sophisticated presentation, which do most of the control on the application

-34-
server side and therefore increased the performance, control, maintenance and
integration.
The technology used to create the GUI includes:
• Hypertext Markup Language pages (HTML) which are generated dynamically by
ASP (Active Server Pages are dynamically processed by the web server before
being sent to the client),
• Hypertext Transfer Protocol GET and POST requests (HTTP),
• Uniform Resource Locator encoding (URL),
• JavaScript,
• Stylesheets.
The use of HTML forms is the most common way to communicate data from the
presentation to the middle tier. Arguments can be passed using the methods HTTP
GET, where the value of the form fields are encoded in the URL, which is not secure,
and HTTP POST, a more common method used to send form information in a hidden
way. The latter method, POST, is the one mostly used by Chip Tracker to send
information to the server or between pages.
JavaScript embedded inside the HTML pages it is used to add further functionality to
the presentation tier. This functionality includes the validation of form input fields and
browser control as the display of pop-up alert messages or control the characters
inserted into the system from the clients keyboard (i.e. allow only number keys while
entering a numeric filed). By utilising client-side JavaScript in this way the
communication between the client machine and the web/application server is
minimised and the database field data type constraints enforced. In order to give Chip
Tracker interface the Organon look and feel, especially for the fonts and colours, we
created a Cascading Style Sheet (CSS) with the definition of how to display the
system HTML documents.
Many technological innovations rely upon User Interface Design to elevate their
technical complexity to a usable product. Technology alone may not win user
acceptance and subsequent usability. The User Experience, or how the user
experiences the end product, is the key to acceptance. By following a Prototyping
-35-
approach and performing User Usability Testing throughout the design process we
were able to ensure a user optimised interface. This empirical testing permitted the
users to provide data about what does work as anticipated and what does not work.
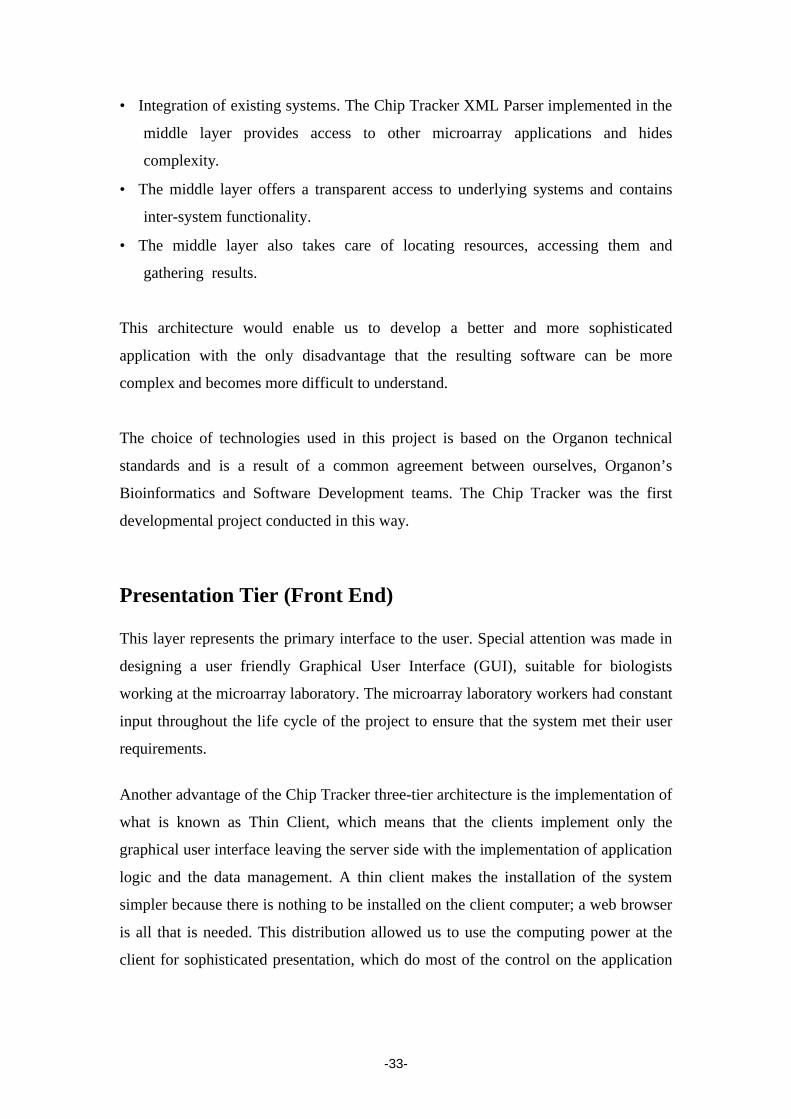
Figure 14. Interface features. The image illustrates some of the interface features and its explanation. These features had been specifically designed to make the Chip Tracker a microarray user friendly tool to guide the user along the microarray laboratory workflow.
A good User Interface Design can make a product easy to understand and use, which
results in greater user acceptance and facilitates the system usage and incorporation in
microarray laboratories. Form the User Acceptance Test (described in chapter 8) we
received a good feedback about the interface, to the point that the users claimed that
they had no need to use the help pages in order to understand how to use the system.
Data entry fields and validations behave automatically according the laboratory
workflow. Features implemented to guide the user along the different pages of the
system shown in figure 14 also include; inhibited field control, specific default values,
entry data control. Most of these features have been implemented in JavaScript code.
-36-
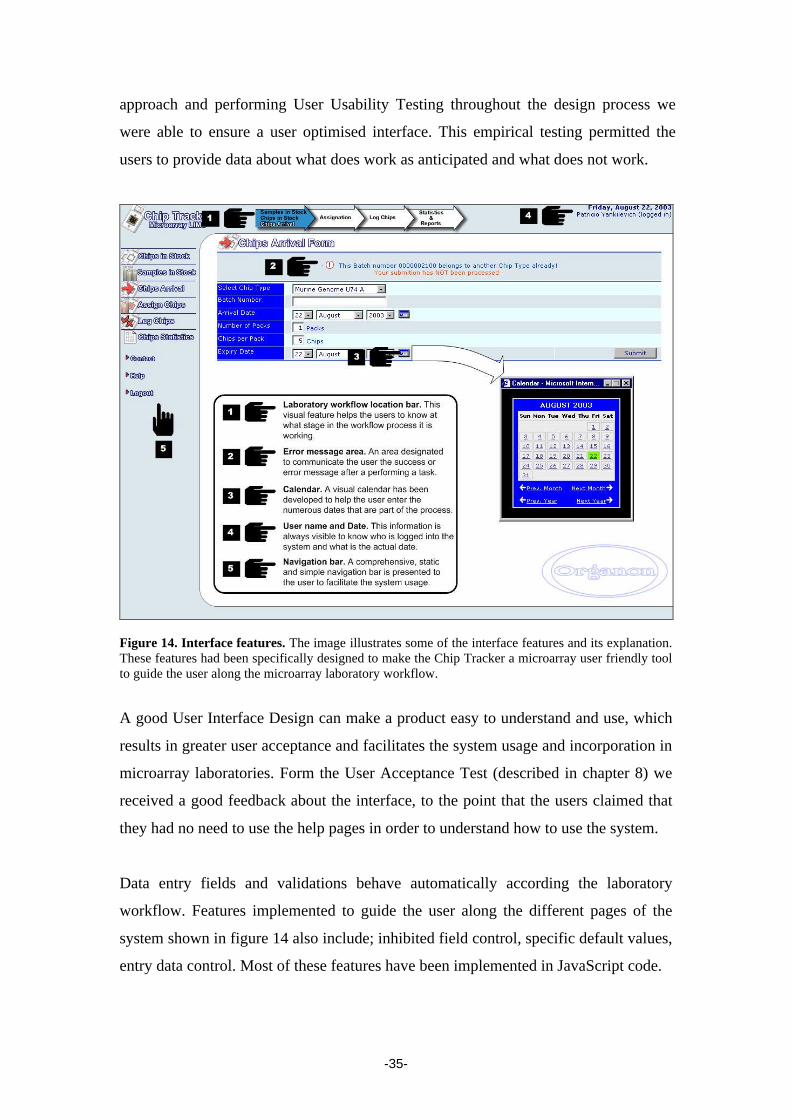
As mentioned earlier the presentation tier acts as a portal to allow the users to store,
retrieve and analyse the data in the Chip Tracker Database. The following image
represents the site map of the Chip Tracker interface.
Figure 15. Chip Tracker interface sitemap.
The functionality and information presented in the Chip Tracker interface is detailed
in chapter 7, where every page of the system is described in the framework of the
microarray laboratory workflow.
Middle Tier The main functionality of the Chip Tracker application is implemented in this tier,
which acts as an application server. This includes:
• Encoding of the microarray laboratory workflow logic in ASP being administered
by Internet Information Server (IIS web server).
• Connection to the Chip Tracker Oracle 8i database.
• Automatic sample data collection from ExpAnD system.
• Accept form input from the GUI in the presentation tier.
• Generation of output pages and reports for the presentation tier.
The Chip Tracker workflow logic is encoded in ASP pages. The ASP uses both
VBScript, which stands for Visual Basic Script, and JavaScript to provide application
logic on the server and client sides respectively. The VBScript scripting components
implement the server-side processing of the page (i.e. the page is dynamically
-37-
processed by the web server before being sent to the client). Where as JavaScript
implements the client-side processing. The ASP pages work in the following way,
first form data is posted via HTTP or via a URL from the client browser to an ASP
page on the application server. The ASP script is executed via ASP.DLL on the web
server and database access performed on the database server; finally a formatted
HTML page is sent back to client browser including the results of the script execution.
Connection to the Chip Tracker Database is carried out by using standard Structured
Query Language (SQL) commands that are passed to an Open Database Connectivity
(ODBC) driver. The ODBC driver is the standard protocol for accessing information
in SQL database servers developed by Microsoft Corporation. This database driver is
installed in the middle layer, between the application interface and the database. The
purpose of this is to translate the application’s data queries into commands that the
RDBMS understands. Both the application and the RDBMS must be ODBC-
compliant for this protocol to work.
The Chip Tracker system accesses its database by 2 different types of queries. Static
queries are used for standard queries such as checking chip availability or insert
arriving chips into the corresponding tables. Other queries are created on the fly
depending on the conditions selected by the user to build a custom report for example.
All the accesses to the database are carried out using SQL queries that are created or
embedded in the ASP pages.
The implementation of Chip Tracker uses Internet Information Server (IIS) as a web
server to administer the ASP and HTML pages. The use of IIS and ASP make it easy
to access data and put it on a web page. Chip Tracker use ASP to make decisions
about what to display on the interface web pages.
In order to collect the sample information stored in the ExpAnD system automatically
a small Visual Basic application named Chip Tracker XML Parser was developed and
installed in the application server. The XML Parser automatically scans a server
directory for new experimental samples data. If a new data file is found it is uploaded
into the Chip Tracker Database without requiring an operator’s assistance. This
component is discussed in greater detail in the next chapter.
-38-
Database Management Tier (Back end) The Chip Tracker Database was designed to track Chips and Samples objects. The
complete information about the microarray experiment is replicated in ExpAnD and
Rosetta databases, so only the necessary information to manage and track the samples
shipped it is imported by the XML Parser into the Chip Tracker Database. This, in
addition to the information of the chips in stock (available chips in the microarray lab)
and chips being ordered, is all that is necessary to track the state of the chips and
samples and manage the pairing of both. The resulting database schema is simple and
contains 6 tables that model the flow of data and change of states of the samples and
chips during the microarray laboratory workflow.
Organon uses Oracle as the RDBMS of choice. The Chip Tracker Database it has
been implemented in Oracle 8i, a powerful and robust relational database. However,
the system does not rely on any oracle specific functionality, so the schema can be
ported easily to a variety of SQL-compliant databases. This in addition to its
architecture and simplistic database structure makes Chip Tracker suitable to be used
as a stand alone application.
Oracle 8i is ODBC-compliant. Queries embedded in the ASP pages and queries
created on the fly, are passed through the ODBC driver into the Oracle RDBMS.
Once the query is resolved, the answer is passed backed as recordsets. The recordsets
of table rows are then processed in the ASP to perform some functionality or to be
presented as a report to the user.
-39-
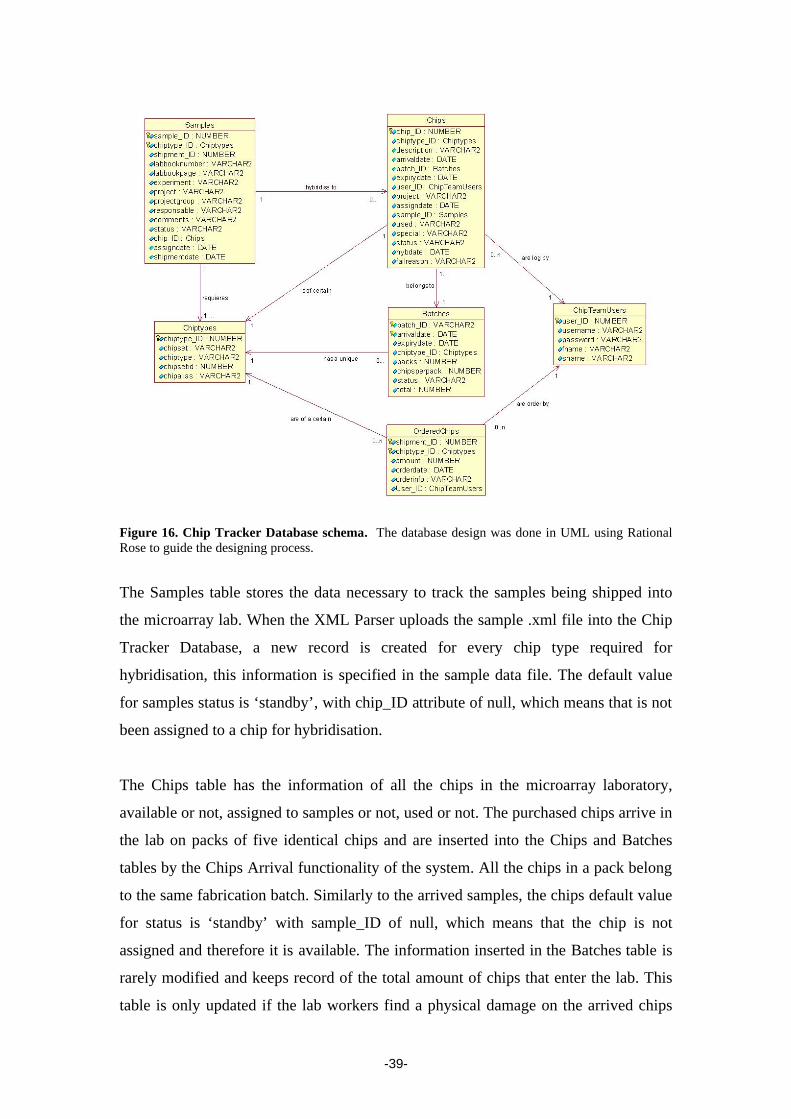
Figure 16. Chip Tracker Database schema. The database design was done in UML using Rational Rose to guide the designing process.
The Samples table stores the data necessary to track the samples being shipped into
the microarray lab. When the XML Parser uploads the sample .xml file into the Chip
Tracker Database, a new record is created for every chip type required for
hybridisation, this information is specified in the sample data file. The default value
for samples status is ‘standby’, with chip_ID attribute of null, which means that is not
been assigned to a chip for hybridisation.
The Chips table has the information of all the chips in the microarray laboratory,
available or not, assigned to samples or not, used or not. The purchased chips arrive in
the lab on packs of five identical chips and are inserted into the Chips and Batches
tables by the Chips Arrival functionality of the system. All the chips in a pack belong
to the same fabrication batch. Similarly to the arrived samples, the chips default value
for status is ‘standby’ with sample_ID of null, which means that the chip is not
assigned and therefore it is available. The information inserted in the Batches table is
rarely modified and keeps record of the total amount of chips that enter the lab. This
table is only updated if the lab workers find a physical damage on the arrived chips
-40-
and decide to delete those chips from the batch to send them back to the supplier.
Packs of chips with the same batch number can arrive in different shipments, what is
certain is that packs with the same batch number will be of the same chip type and
will have the same expiry date. To track the different batches delivered into the
laboratory the Batches table key consists of the batch_ID, which is the batch number,
and the arrival date.
The OrderedChips table keeps record of chips that have been purchased, but not
delivered to the lab yet, i.e. they are en route. This table holds a record for every chip
type with the amount of chips of the type expected to arrive, the date of the last order
made and the user_ID of the person who made the order. Every time a request for
Purchase Order of chips is emitted by the Chip Tracker system the information in the
OrderedChips table is updated. In the same way, every time a batch of chips is loaded
in the system a subtraction on the amount of chips ordered is performed on the
OrderedChips table.
The Chiptypes table is a lookup table with the information of the chip types available
from Affymetrix for researchers designing microarray experiments. This table is a
replica of the Chiptypes table in the ExpAnD system. If the new chip type appears in
the market a manual process run by the ExpAnD administrator will update both
tables. Because the chip type alias is encoded within the sample information being
exported into the system both tables must have exactly the same records.
Finally, the ChipTeamUsers table stores the usernames/passwords and other details of
the microarray lab users for authentication. The table also records some of tasks
performed by the lab users such as purchase of chips or log of the hybridised chips.
Every page of the system that is accessed is authenticated using the data available in
this table.
Integration with existing Systems
ExpAnD Expand is Organon’s Experimental Annotation Database. Expand was built to enable
scientists to enter their experimental annotation and sample processing instructions
into one centralised resource. The Experimental annotation captured in Expand
-41-
describes the majority of the information covered in the Experimental Description
section of MIAME.
Users of Expand ship the actual mRNA samples to the microarray laboratory at
Newhouse for processing. The Expand system contains a shipment section that deals
with this process. The Shipment process prompts users to enter the samples that they
wish to send to the Chip Team. On submitting the request a list of .xml files is
produced in Rosetta’s GEML2.2 dtd format corresponding to each of the samples and
ftped to the Chip Tracker and Resolver server creating an XML LIMS Queue which is
used to populate the respective databases.
Rosetta Resource Tracker
The Resource Tracking add-on to Rosetta Resolver allows the Chip Team users to
track a resource, such as a particular type of RNA extract. The user enters information
such as resource type, volume, concentration, and carrier. The add-on automatically
assigns a storage location for the resource and the user provides confirmation that the
resource is deposited in the specified location. The user indicates whether a quality
control check (QC) is to be performed on the resource and if so, the user enters data
pertaining to the QC results. In the Organon microarray laboratory workflow the Chip
Team does QC on every sample arriving into the lab.
Rosetta Resource Tracker, which is part of Resolver, collects the same biological
sample information entered in ExpAnd in the same way that Chip Tracker does by
parsing duplicate XML LIMS Queue. This in effect means that Resource Tracker and
Chip Tracker are pre-populated with the same basic data associated with the mRNA
samples arriving at Newhouse, thus saving the Chip Team from having to actually
enter this data. When the sample actually arrives the Chip Team is able to ‘Receive’
the sample, which is assigned a storage location by Resource Tracker.
Rosetta Resolver
The Rosetta Resolver® Analysis System is a commercial software created by Rosetta
Biosoftware. It provides a solution for analysing large quantities of expression data
generated by any of the major microarray technologies. Resolver combines advanced

-42-
analysis software, a high capacity database, and high-performance server hardware to
enable users to store, retrieve and analyse large volumes of gene expression data.
Chip Tracker Deployment
Although Chip Tracker can be used for multiple users simultaneously it has not been
developed with that purpose, and as a single user application its server requirements
are not demanding.
Figure 17. Chip Tracker and Organon bioinformatics infrastructure deployment.
Note that if Chip Tracker is used as a stand-alone application it is possible to install
the client and server components on the same server computer. The following is a list
of the minimum computer requirements to install Chip Tracker:
Minimum Client
Any windows operating system (95/98/ME/2000/NT/XP)
Internet Explorer 5.0 or higher
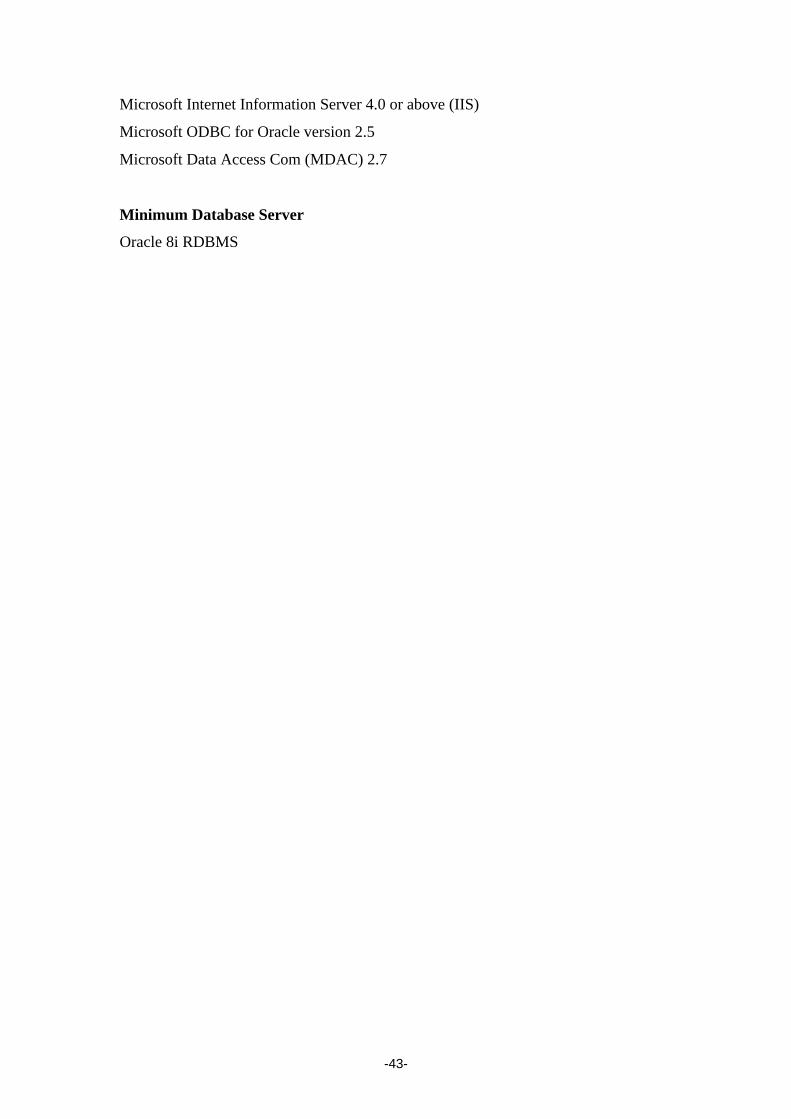
Minimum Application Server
Any windows Server operating system (2000/NT/XP)
-43-
Microsoft Internet Information Server 4.0 or above (IIS)
Microsoft ODBC for Oracle version 2.5
Microsoft Data Access Com (MDAC) 2.7
Minimum Database Server
Oracle 8i RDBMS
-44-
Chapter 6
Chip Tracker XML Parser and the Microarray
Experiment Standards
MIAME, MAGE and other Standards
With the proliferation of microarray databases, there is a growing appreciation for the
importance of analyses across experiments and the need for well-documented
repositories. The Microarray Gene Expression Database (MGED) group
(www.mged.org) is a grass-roots movement to promote the adoption of standards in
microarray experiments and data. MGED developed requirements for the Minimum
Information About a Microarray Experiment (MIAME) to ensure that microarray data
can be easily interpreted and the results derived from the analysis can be
independently verified [Brazma et al., 2001]. Microarray papers submitted to
scientific journals are now required to comply with MIAME standards and provide
supplementary information.
MIAME should also prompt microarray manufacturers and software producers to
develop adequate microarray laboratory information management systems (LIMS),
enabling the production and capture of MIAME-compatible primary data at the bench.
In many cases, it is expected that most of the MIAME information will be recorded
through local LIMS software before being uploaded into central archiving using a
standard format. As such, the development of such MIAME-friendly LIMS software
will be an important task.
The Microarray And Gene Expression Markup Language (MAGE-ML) is a data
exchange format to communicate information about microarray experiments between
local laboratories databases, central archives, stand-alone analysis packages and an
-45-
object model MAGE-OM have been developed for the MGED group. MAGE-ML is
based on XML and can be used to describe microarray designs, microarray
manufacturing information, microarray experiment setup and execution information,
gene expression data and data analysis results. Rosetta Biosoftware were involved in
the definition of these standards.
A predecessor of MAGE is the Gene Expression Markup Language (GEML) that was
submitted to the Object Management Group (OMG) by Rosetta as a proposed
standard for Gene Expression data in November 2000. Along with proposals from
EBI, which consisted of MGED’s Microarray Markup Language (MAML), and a
Corba-based proposal from NetGenics. The three submitters decided to work together
on a joint revised submittal that has become the basis for the Microarray and Gene
Expression Data (MAGE) UML model and DTD (Document Type Definition). As
such, MAGE is now the proposed standard being submitted by Rosetta and EBI (for
MGED) to the OMG. Rosetta Resolver still supports GEML but the current
standardisation effort is focused on MAGE.
GEML is the communication standard used by Chip Tracker in order to automatically
read the microarray experiment setup and execution information submitted on the
ExpAnD system.
The use of standards is essential to manage microarray data. The institution and
adoption of common standards will be of immediate benefit to researchers, scientific
journals and those developing data management systems and tools for data analysis,
and presents a major step toward making such discoveries a reality [Stoeckert et al.,
2002].
Chip Tracker XML Parser and the Gene Expression
Markup Language (GEML)
To explain the Chip Tracker XML Parser we should start describing what the XML
format is. XML stands for extensible markup language, which is a set of rules
whereby new vocabularies may themselves be defined. In some respects it is similar

-46-
to HTML, in that tags are used to encode information, but in HTML the information is
related to the formatting of a document, using a predefined set of tags. In XML, the
tags do not indicate how a document should be formatted, but instead provide
semantic context to the content of the document. XML vocabularies define their own
tags, and thus use XML to hold information in such way that information can be
understood. Because of this, and the wide support that XML has received since its
release as a W3C recommendation in 1998, both GEML and MAML chose XML for
encoding microarray data. Usually a XML document is not a stand-alone document,
but will refer to another document, called the document type definition, or DTD. The
DTD contains a set of rules, or declarations, that specify which tags can be used, and
what they contain. It is the DTD that it is specified in GEML and MAGE-ML. XML
documents created to use GEML will refer to this DTD [Spellman et al., 2002].
The Gene Expression Markup Language (GEML) is a free, public-domain, open-
standard XML DTD (Document Type Definition) for the common expression of
genetic information for storing DNA microarray and gene expression data. The
GEML enables data exchange between a variety of gene expression systems including
web-based genome databases. The GEML format has the following advantages: (1)
Independent of any particular database schema. (2) Keeps track of which data
collection methodology was used, enabling normalisation, integration, and
comparison of data across methodologies. (3) Extensible through the ability to specify
additional name/value pairs. (4) Is XML-based. GEML was created and is licensed in
order to define a single, distinct GEML format and avoid proliferation of incompatible
variations [Hoffman, 2000].
It was decided to develop an XML parser to load biological samples data from any
GEML compliant software into the Chip Tracker Database because the ExpAnD
system was already interacting with Rosetta Resolver version 3.0, which supports
GEML. The process begins with ExpAnD creating an .xml file per sample submitted
to the microarray lab. These files are then uploaded into a remote server directory via
ftp creating the XML LIMS Queue. Finally, the XML Parser component polls the
queue directory looking for files. Every .xml file (GEML22.dtd compliant) found in
this directory is automatically parsed and imported into the Chip Tracker Database.
The XML Parser is a Visual Basic executable developed by us which is launched by

-47-
the application server hourly. The system administrator can also run or stop the parser
manually on request.
Every .xml file encodes a single sample, its experiment details and one to many chip
types codes required for hybridisation. The file name corresponds with the sample
code (the same code printed on the biological sample tube) in the ExpAnD database
and subsequently in the Chip Tracker database. As mentioned earlier, the complete
information about the microarray experiment is replicated in ExpAnD and Rosetta
databases, therefore only the necessary information to manage and track the chips and
samples is imported by Chip Tracker. From the parsed information only the following
attributes are inserted as a new record in the Samples table: sample_id, chiptype_id,
shipment_id, labbooknumber, labbookpage, experiment, project, projectgroup,
responsible and shipmentdate. If the sample file that has been parsed requires (in its
specification) hybridisation to three different chip types, then three different sample
records (one per chiptype required) will be inserted. For example, the file 000702.xml
encodes the 000702 sample information of a particular rat studied at the lab. The
researchers want to investigate the expression of every gene at the moment the sample
was taken, so they require the sample to be hybridised to the whole Rat genome,
which at the moment compromise three GeneChip arrays (Rat Genome U34A, U34B
and U34C). The Chip Tracker XML Parser will parse the file and add three new
records on the Samples table with the corresponding sample_id-chiptype key.
After a file is parsed it is then moved to a Processed samples folder. This is done both
for backup and for error recovery reasons. If a sample has been deleted from the
system by mistake then it can always be loaded back by placing the corresponding
sample file back in the XML LIMS Queue directory. In this way the system is
independent and there is no need to resubmit the sample data from the ExpAnD
system. If an error occurs while parsing a file, the XML Parser creates an error log
text file describing the problems found. The log file will have the present date for a
name and it will be saved in the Processed samples folder to be read by the system
administrator.
The specific experiment information that is imported from ExpAnD is encoded under
the LIMS category in GEML version 2.2. The complete specification of the GEML
-48-
DTD is provided by Rosetta Biosoftware (http://www.rosettabio.com/tech/geml). An
example of an .xml file exported by ExpAnD, the GEML LIMS Category
specification tree and an SQL command showing the import can be found in
Appendix A.
AGAVE and BSML are other open XML data standards created to facilitate the
interchange of data from diverse technologies, but as mentioned on the previous
section the current standardisation effort is focused on MAGE. Rosetta announced
that the next version of Resolver, expected for 2004, will also be MAGE compliant.
The implemented microarray data exchange format standard that allows interaction
with any other system following the standard, in addition to the three tier architecture,
makes the Chip Tracker a flexible and versatile piece of software.

-49-
Chapter 7
Understanding Chip Tracker Features
The application includes many advanced features to help the user perform the
management and tracking of the biological samples and chips in the laboratory
workflow. The following are the Chip Tracker features described in this chapter:
• Secure Logging into the system
• Management and Tracking of Chips and Samples in Stock
• Pre populated prompt of Purchase Order of the necessary Chips
• Loading Chips on the Arrival to the laboratory
• Assignation of Chips to Samples
• Log results of Hybridised Chips
• Create custom Reports and Statistics
It is helpful to understand how the data flows and is modify through the application
from the moment that it is uploaded. The following microarray laboratory workflow
illustration is represented with the order and complete name of the Chip Tracker
features:
Figure 18. Order of the Chip Tracker features shown on the microarray laboratory workflow.
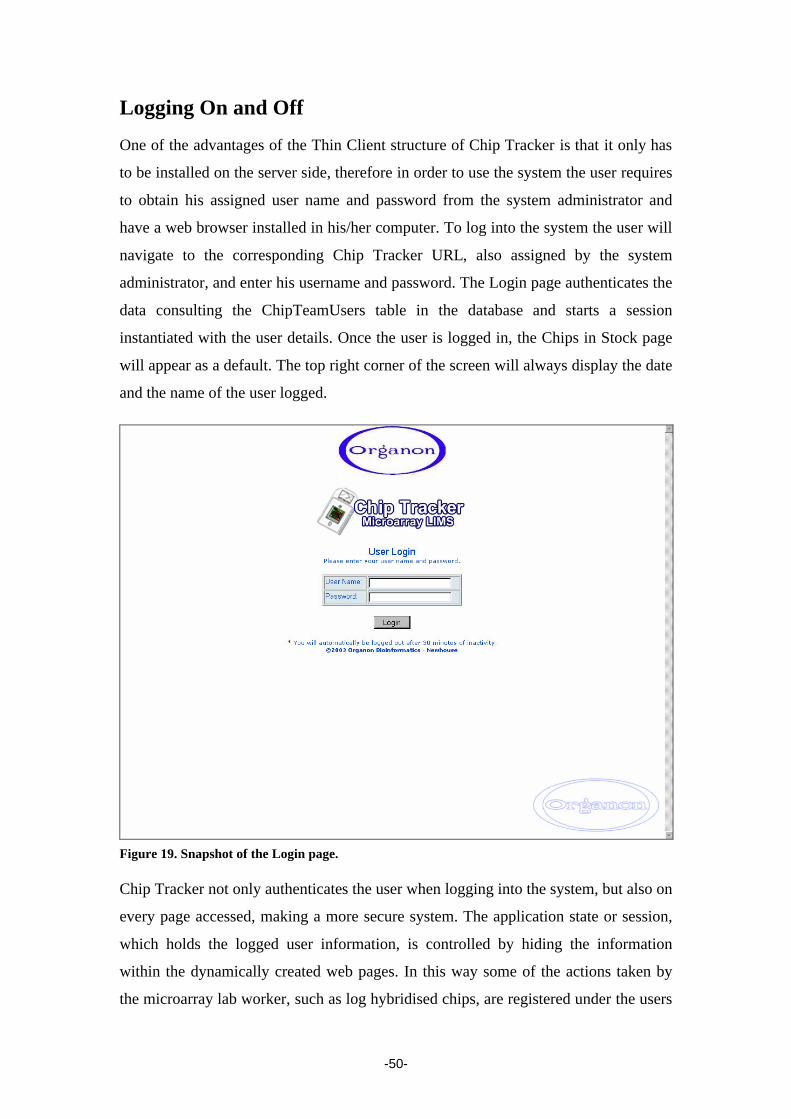
-50-
Logging On and Off
One of the advantages of the Thin Client structure of Chip Tracker is that it only has
to be installed on the server side, therefore in order to use the system the user requires
to obtain his assigned user name and password from the system administrator and
have a web browser installed in his/her computer. To log into the system the user will
navigate to the corresponding Chip Tracker URL, also assigned by the system
administrator, and enter his username and password. The Login page authenticates the
data consulting the ChipTeamUsers table in the database and starts a session
instantiated with the user details. Once the user is logged in, the Chips in Stock page
will appear as a default. The top right corner of the screen will always display the date
and the name of the user logged.
Figure 19. Snapshot of the Login page. Chip Tracker not only authenticates the user when logging into the system, but also on
every page accessed, making a more secure system. The application state or session,
which holds the logged user information, is controlled by hiding the information
within the dynamically created web pages. In this way some of the actions taken by
the microarray lab worker, such as log hybridised chips, are registered under the users
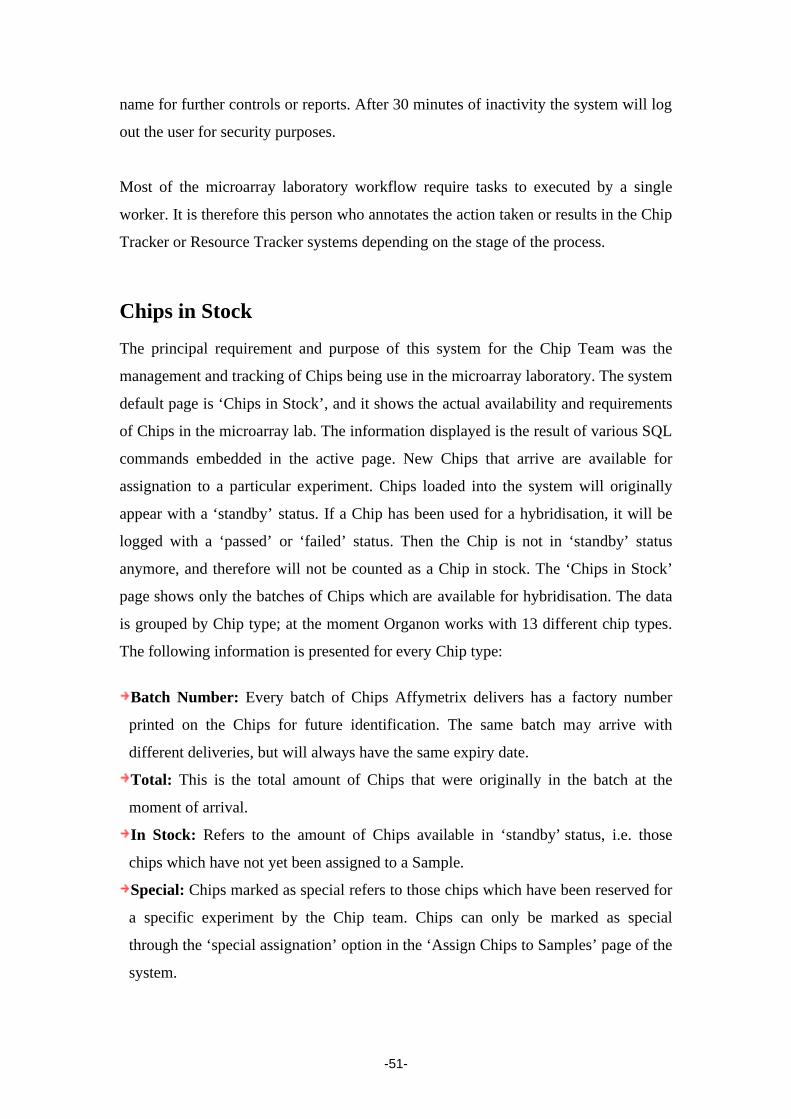
-51-
name for further controls or reports. After 30 minutes of inactivity the system will log
out the user for security purposes.
Most of the microarray laboratory workflow require tasks to executed by a single
worker. It is therefore this person who annotates the action taken or results in the Chip
Tracker or Resource Tracker systems depending on the stage of the process.
Chips in Stock
The principal requirement and purpose of this system for the Chip Team was the
management and tracking of Chips being use in the microarray laboratory. The system
default page is ‘Chips in Stock’, and it shows the actual availability and requirements
of Chips in the microarray lab. The information displayed is the result of various SQL
commands embedded in the active page. New Chips that arrive are available for
assignation to a particular experiment. Chips loaded into the system will originally
appear with a ‘standby’ status. If a Chip has been used for a hybridisation, it will be
logged with a ‘passed’ or ‘failed’ status. Then the Chip is not in ‘standby’ status
anymore, and therefore will not be counted as a Chip in stock. The ‘Chips in Stock’
page shows only the batches of Chips which are available for hybridisation. The data
is grouped by Chip type; at the moment Organon works with 13 different chip types.
The following information is presented for every Chip type:
Batch Number: Every batch of Chips Affymetrix delivers has a factory number
printed on the Chips for future identification. The same batch may arrive with
different deliveries, but will always have the same expiry date.
Total: This is the total amount of Chips that were originally in the batch at the
moment of arrival.
In Stock: Refers to the amount of Chips available in ‘standby’ status, i.e. those
chips which have not yet been assigned to a Sample.
Special: Chips marked as special refers to those chips which have been reserved for
a specific experiment by the Chip team. Chips can only be marked as special
through the ‘special assignation’ option in the ‘Assign Chips to Samples’ page of the
system.
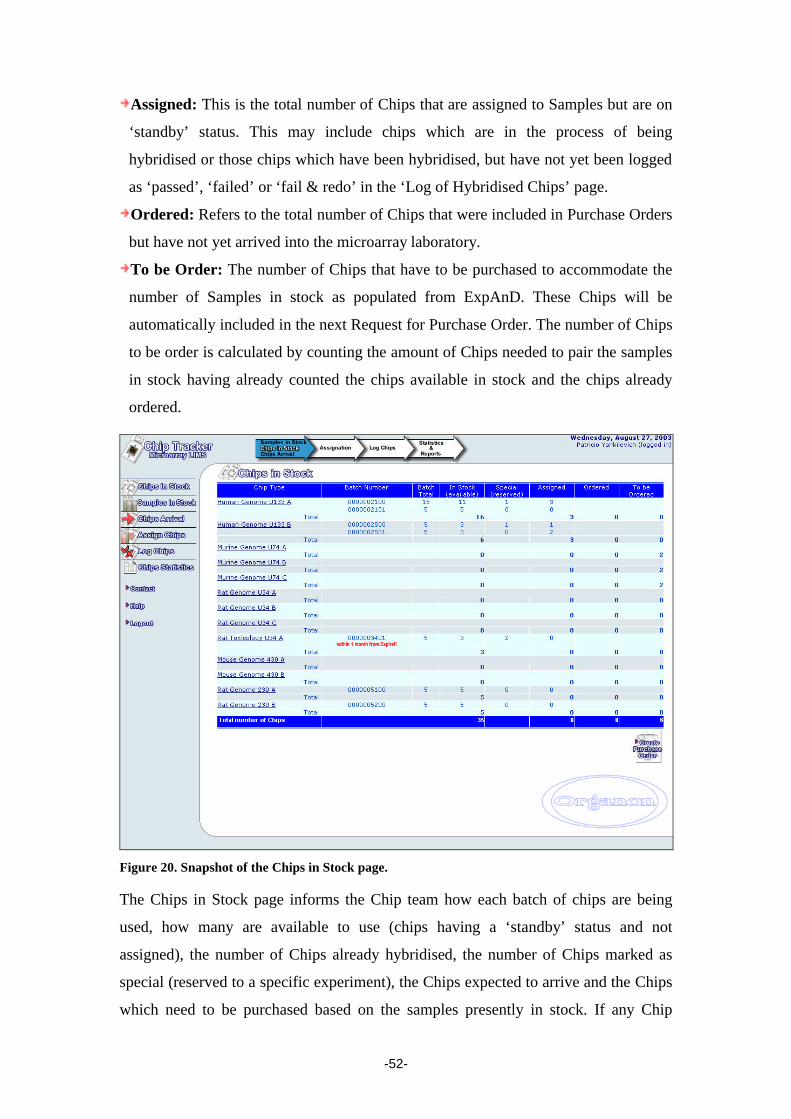
-52-
Assigned: This is the total number of Chips that are assigned to Samples but are on
‘standby’ status. This may include chips which are in the process of being
hybridised or those chips which have been hybridised, but have not yet been logged
as ‘passed’, ‘failed’ or ‘fail & redo’ in the ‘Log of Hybridised Chips’ page.
Ordered: Refers to the total number of Chips that were included in Purchase Orders
but have not yet arrived into the microarray laboratory.
To be Order: The number of Chips that have to be purchased to accommodate the
number of Samples in stock as populated from ExpAnD. These Chips will be
automatically included in the next Request for Purchase Order. The number of Chips
to be order is calculated by counting the amount of Chips needed to pair the samples
in stock having already counted the chips available in stock and the chips already
ordered.
Figure 20. Snapshot of the Chips in Stock page. The Chips in Stock page informs the Chip team how each batch of chips are being
used, how many are available to use (chips having a ‘standby’ status and not
assigned), the number of Chips already hybridised, the number of Chips marked as
special (reserved to a specific experiment), the Chips expected to arrive and the Chips
which need to be purchased based on the samples presently in stock. If any Chip
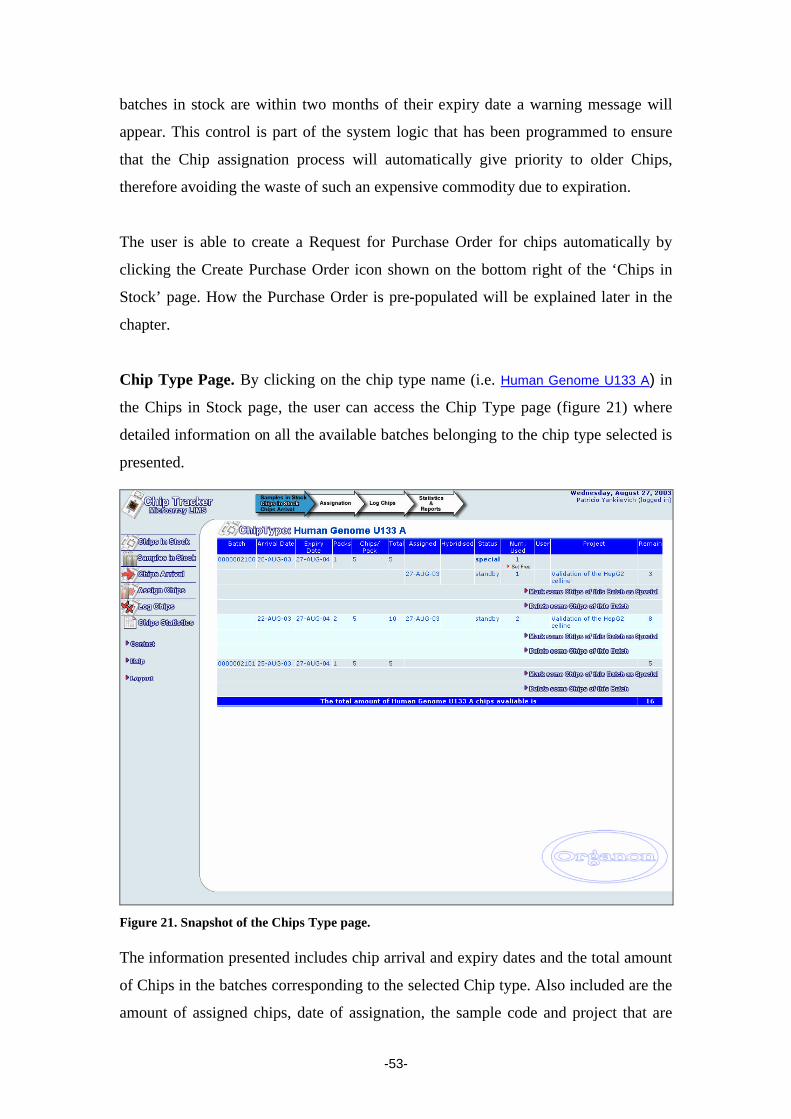
-53-
batches in stock are within two months of their expiry date a warning message will
appear. This control is part of the system logic that has been programmed to ensure
that the Chip assignation process will automatically give priority to older Chips,
therefore avoiding the waste of such an expensive commodity due to expiration.
The user is able to create a Request for Purchase Order for chips automatically by
clicking the Create Purchase Order icon shown on the bottom right of the ‘Chips in
Stock’ page. How the Purchase Order is pre-populated will be explained later in the
chapter.
Chip Type Page. By clicking on the chip type name (i.e. Human Genome U133 A) in
the Chips in Stock page, the user can access the Chip Type page (figure 21) where
detailed information on all the available batches belonging to the chip type selected is
presented.
Figure 21. Snapshot of the Chips Type page. The information presented includes chip arrival and expiry dates and the total amount
of Chips in the batches corresponding to the selected Chip type. Also included are the
amount of assigned chips, date of assignation, the sample code and project that are
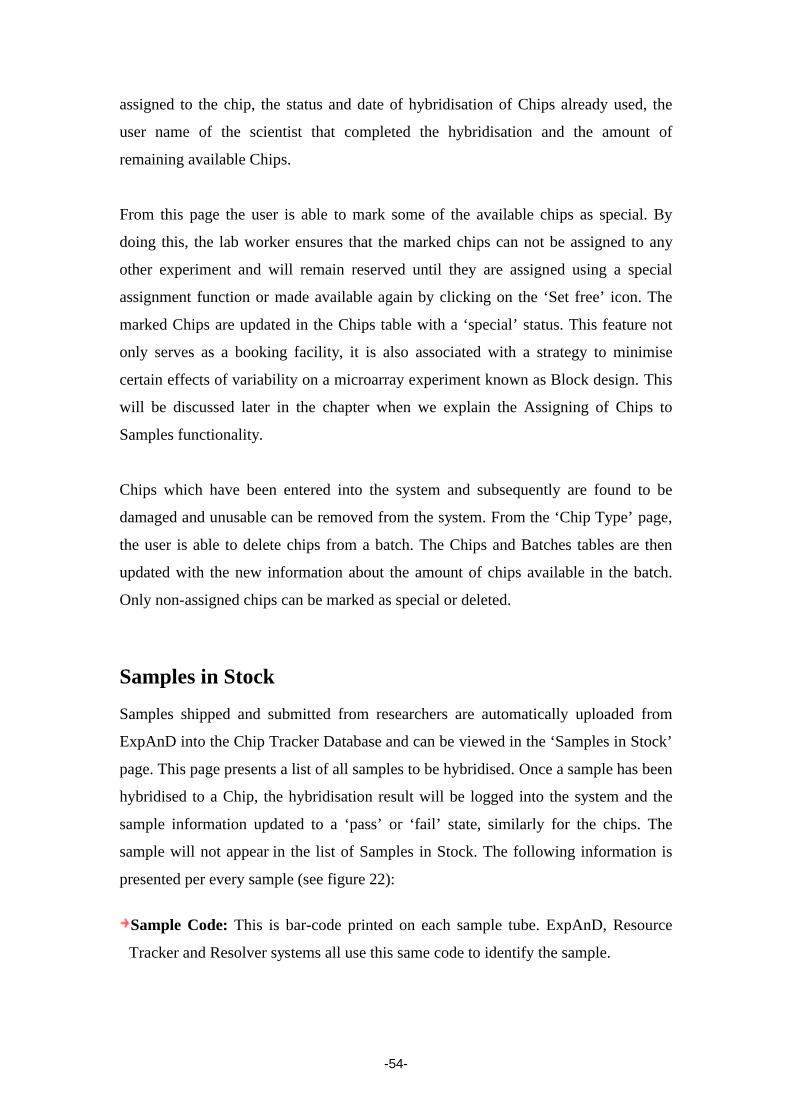
-54-
assigned to the chip, the status and date of hybridisation of Chips already used, the
user name of the scientist that completed the hybridisation and the amount of
remaining available Chips.
From this page the user is able to mark some of the available chips as special. By
doing this, the lab worker ensures that the marked chips can not be assigned to any
other experiment and will remain reserved until they are assigned using a special
assignment function or made available again by clicking on the ‘Set free’ icon. The
marked Chips are updated in the Chips table with a ‘special’ status. This feature not
only serves as a booking facility, it is also associated with a strategy to minimise
certain effects of variability on a microarray experiment known as Block design. This
will be discussed later in the chapter when we explain the Assigning of Chips to
Samples functionality.
Chips which have been entered into the system and subsequently are found to be
damaged and unusable can be removed from the system. From the ‘Chip Type’ page,
the user is able to delete chips from a batch. The Chips and Batches tables are then
updated with the new information about the amount of chips available in the batch.
Only non-assigned chips can be marked as special or deleted.
Samples in Stock
Samples shipped and submitted from researchers are automatically uploaded from
ExpAnD into the Chip Tracker Database and can be viewed in the ‘Samples in Stock’
page. This page presents a list of all samples to be hybridised. Once a sample has been
hybridised to a Chip, the hybridisation result will be logged into the system and the
sample information updated to a ‘pass’ or ‘fail’ state, similarly for the chips. The
sample will not appear in the list of Samples in Stock. The following information is
presented per every sample (see figure 22):
Sample Code: This is bar-code printed on each sample tube. ExpAnD, Resource
Tracker and Resolver systems all use this same code to identify the sample.

-55-
Chip type: This is the Chip type requested to be hybridised to the sample. The
assignation functionality of the system will only choose this type of chips to be
assigned to the sample.
Project: Refers to the name of the project that includes this sample.
Group: This is the name of the research group who submitted the sample to be
hybridised.
Responsible: The name of the researcher that submitted the sample data from
ExpAnD and shipped the biological sample to the microarray lab.
Assign to batch: If the sample has been assigned to a particular Chip then this
column will show the batch number of the corresponding chip. A flag will appear if
the assigned chip is marked as ‘special’.
Figure 22. Snapshot of the Samples in Stock page. Affymetrix GeneChip arrays do not have a unique identification number printed on
the Chip cartridge. Samples are therefore not assigned to a particular chip but to a
particular batch where the chip belongs. Several different batches from the same chip
type may populate the stock.

-56-
When Chips arrive and are loaded into the system, a unique id is assigned to every
chip as a means for the Chip Tracker system to track every individual chip and
sample. Samples already have a unique sample code. While assigning a sample to a
Chip, the system will update the sample record with a chip_id from one of the chips in
the assigned batch, and the chip record will be updated with the corresponding sample
code. In addition to this, the assignation date will also be updated from null to the
present one. Note that both chips and samples assigned will remain in ‘standby’ status
until they are logged as hybridised.
Sample Page. By clicking on the sample code (i.e. 000872) in the ‘Samples in Stock’
page, the users can access the Sample page (figure 23) where detailed information
of the sample is presented. The information shown on this page refers to the detailed
information of the sample such as Shipment Date, Laboratory Book and Page,
Experiment name, Chip types requested, Status, Assigned batch number and Assign
Date.
Figure 23. Snapshot of the Sample page. A single sample can request one or more different chips from a set for hybridisation
(i.e. MG_U74Av2 or Bv2 or Cv2). A single sample is used on up to three Chips. Each

-57-
sample, or extract of it, is called a Prep (preparation) and every prep can be assigned
and hybridised independently and at different times.
If a sample does not pass the QC criteria as set by the Chip Team, the responsible
researcher will be asked to resubmit the sample. The original sample will be deleted
from the system by checking the delete box on this page. In the same way, if the prep
was assigned to a batch which was found to be defective, then it is also possible to un-
assign the prep from this page.
Prompt of Purchase Orders
This process has been systemised in order to guide and manage the Purchase Orders
that are being sent from the microarray laboratory. Previously, each time there was a
chip requirement, the microarray lab worker would fill out a Request for Purchase
Order form. This system creates a pre-populated purchase order form and so reduces
the probability of added human error.
By clicking on the ‘Create a Purchase Order’ icon at the bottom right hand side of the
Chips in Stock page the order will be automatically created (figure 24) to include all
the Chips that are necessary for hybridisation to the samples arriving in the lab. These
Chips which were previously in the ‘To be Ordered’ column of the Chips in Stock
page, will now appear in the ‘Ordered’ column.
Affymetrix supplies its GeneChips in single batch packs of 5 chips. The system
automatically calculates the amount of packs necessary for every chip type included
in the order. If the user would like to exclude a certain chip type from the order, to be
ordered later perhaps, then the row corresponding to the chip type can be deleted by
clicking on the Erase this row icon.
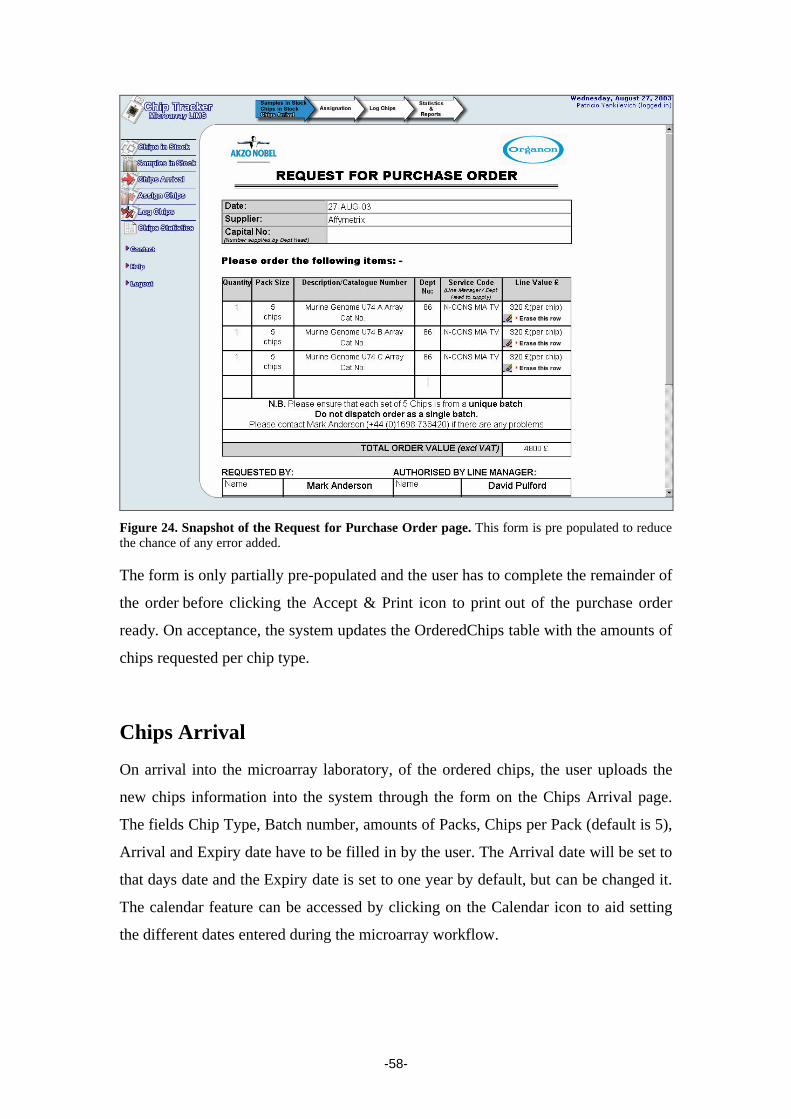
-58-
Figure 24. Snapshot of the Request for Purchase Order page. This form is pre populated to reduce the chance of any error added. The form is only partially pre-populated and the user has to complete the remainder of
the order before clicking the Accept & Print icon to print out of the purchase order
ready. On acceptance, the system updates the OrderedChips table with the amounts of
chips requested per chip type.
Chips Arrival
On arrival into the microarray laboratory, of the ordered chips, the user uploads the
new chips information into the system through the form on the Chips Arrival page.
The fields Chip Type, Batch number, amounts of Packs, Chips per Pack (default is 5),
Arrival and Expiry date have to be filled in by the user. The Arrival date will be set to
that days date and the Expiry date is set to one year by default, but can be changed it.
The calendar feature can be accessed by clicking on the Calendar icon to aid setting
the different dates entered during the microarray workflow.
-59-
The Chips Arrival Form (figure 25) has been designed to be short and simple in order
to facilitate the uploading of new shipments that may include several different
batches. Following completion and submission of the form, the system will perform a
set of validations which include; checking that the batch number inserted has not been
previously entered on that same date and the batch number does not belongs to an
existing batch of different chip type. Batch sizes produced by Affymetrix are large, so
it is possible that packs with the same batch number can arrive on different dates.
Figure 25. Snapshot of the Chips Arrival page. Through this form new chips are uploaded into the system. After submitting the new Chip information the system stores these information into
the Chips and Batches tables and a message of success or error is displayed on the
error communication area above the form. The uploaded information will now appear
in the ‘Chips in Stock’ page.
Assignation of Chips to Samples
When designing a microarray experiment, it is important to understand and account
for many possible sources of noise and variation. These sources may contribute to
-60-
problems such as measurement error, confounding, elevated false positives and false
negatives rates, and bias association. To different areas of variation can be identified;
technological and biological. Technological variation may occur due to imprecise
quantification of total RNA sample, variation between microarray batches, non-
validated laboratory protocols, etc. As mentioned in the microarray technology
chapter, the oligonucleotide Chip manufacturing process may introduce errors,
subsequently batch-to-batch variance may contribute to data bias [Li et al., 2001].
Theoretically, with the development of technology and automation, the technological
variation could be virtually eliminated. Biological variation i.e., variation in gene
expression among genes, cells, cell lines, animals, etc., would remain present, even if
the amount of RNA could be accurately quantified. The two components –
technological and biological – contribute to the total variance in an experiment, and
therefore researchers must account for both of them at the experimental design and
analysis stages [Bobashev et al., 2002].
The process of assigning a Chip to a sample is essential not only to avoid any chip
expiration, is part of the design strategy included to minimise the effects of variability
that can be present in gene microarray experiments. The effects on variability can be
reduced by good experimental design, quality experimental material (i.e. the samples
and microarrays) and competent processing using validated protocols.
As part of the design strategy, a random assignation process is included in the Chip
Tracker application. Randomisation also provides an objective basis for the
appropriateness of certain statistical procedures and control of type 1 errors in
hypothesis tests [Piantadosi, 1997].
Another strategy for minimising the effects of variability is known as blocking or
block design experiments. This technique control the source of variation by grouping
experimental units into internally homogeneous batches and in this way keeps
extraneous experimental conditions uniform within a block [Cochran and Cox, 1992].
The Chip Tracker feature of marking the chips of a certain batch as special, meaning
reserved or blocked, in addition to the special assignation included in the Assign
Chips page, is related to the block design technique to control variation.
-61-
A list of all the unassigned samples is presented in the ‘Assign Chips’ page. In order
to assign a Chip to a Sample for hybridisation the user has to check the box of the
sample(s) they would like to assign and select a type of assignation strategy (i.e.
Random) to be followed by the system. The following is an explanation of every
assignation procedure:
Random: This is the default assignation. The key idea of using Random assignation
of Chips to Samples is to reduce the technological variation which may arise from
using different batches. The assignation operates by firstly identifying if there are
chips, within the chip type batches available, that are within two months from expiry.
If so, these chips will be prioritised for use and assigned to the samples. If none of the
available chips are about to expire, then the chips will be chosen randomly from all
the available batches of the corresponding chip type and assigned to the samples.
Special chips (blocked) are not going to be picked by this type of assignation.
Oldest 1st: If this type of assignation is selected then the system will choose the chips
that are closer to their expiry date (chronologically from the available Chips of the
batches corresponding chip type), and assign them to the samples. Special Chips are
not going to be assigned by this type of assignation.
Special: This assignation strategy will selected from chips which have been marked
as special (from the available special chips of the corresponding chip type) by
choosing from those that are closer to their expiry date and assign them to the
samples. Note that chips have to be previously marked as special in order to be
assigned. As mentioned on the other strategies, chips marked as special are not
assigned through any other assignation type. These chips can understand as blocked or
reserved.

-62-
Figure 26. Snapshot of the Assign Chips page. The Samples marked by the user to be assigned are randomly shuffled before the
chosen Chips (which were selected by the chosen assignation strategy) are assigned to
them. This Sample shuffling before assignation is carried out to reduce even further
any risk which may be caused by batch to batch variation.
The SQL commands used by the system to perform the correct selection of chips to be
assigned can be found in Appendix B. The Appendix also includes other SQL queries
embedded in the different system pages to be consulted.
After the samples have been assigned, the user will navigate back to the Samples in
Stock page where the corresponding batch numbers of the chips assigned to the
samples can be viewed. At this stage all the information is available for the Chip
Team to begin working on the hybridisation process. The Chip status will be updated
following hybridisation by using the ‘Log Chips’ page on the system.
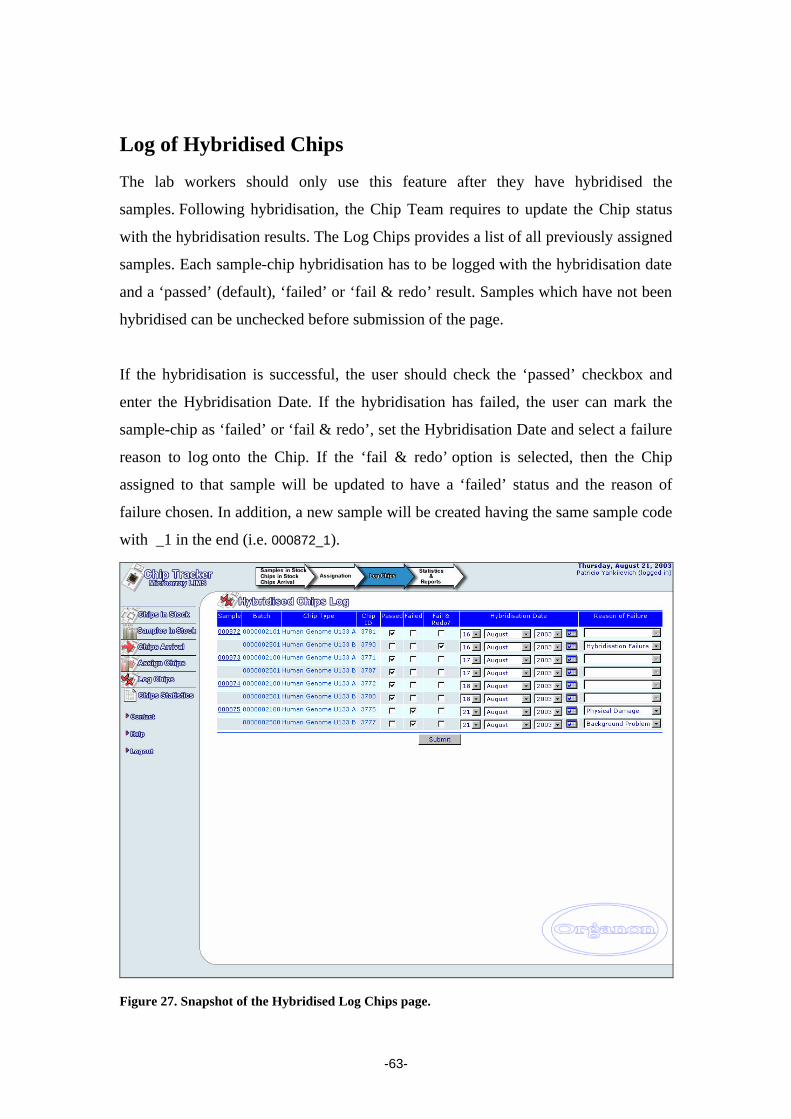
-63-
Log of Hybridised Chips
The lab workers should only use this feature after they have hybridised the
samples. Following hybridisation, the Chip Team requires to update the Chip status
with the hybridisation results. The Log Chips provides a list of all previously assigned
samples. Each sample-chip hybridisation has to be logged with the hybridisation date
and a ‘passed’ (default), ‘failed’ or ‘fail & redo’ result. Samples which have not been
hybridised can be unchecked before submission of the page.
If the hybridisation is successful, the user should check the ‘passed’ checkbox and
enter the Hybridisation Date. If the hybridisation has failed, the user can mark the
sample-chip as ‘failed’ or ‘fail & redo’, set the Hybridisation Date and select a failure
reason to log onto the Chip. If the ‘fail & redo’ option is selected, then the Chip
assigned to that sample will be updated to have a ‘failed’ status and the reason of
failure chosen. In addition, a new sample will be created having the same sample code
with _1 in the end (i.e. 000872_1).
Figure 27. Snapshot of the Hybridised Log Chips page.
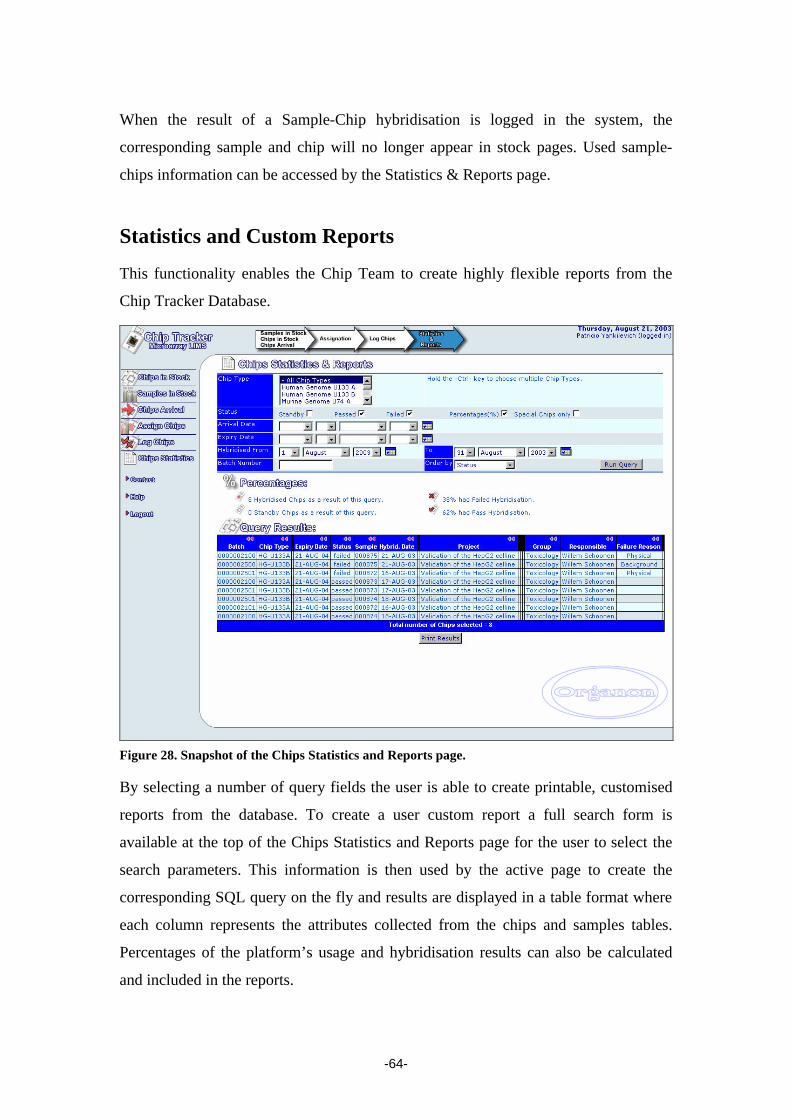
-64-
When the result of a Sample-Chip hybridisation is logged in the system, the
corresponding sample and chip will no longer appear in stock pages. Used sample-
chips information can be accessed by the Statistics & Reports page.
Statistics and Custom Reports
This functionality enables the Chip Team to create highly flexible reports from the
Chip Tracker Database.
Figure 28. Snapshot of the Chips Statistics and Reports page. By selecting a number of query fields the user is able to create printable, customised
reports from the database. To create a user custom report a full search form is
available at the top of the Chips Statistics and Reports page for the user to select the
search parameters. This information is then used by the active page to create the
corresponding SQL query on the fly and results are displayed in a table format where
each column represents the attributes collected from the chips and samples tables.
Percentages of the platform’s usage and hybridisation results can also be calculated
and included in the reports.
-65-
Before printing the report the user is able to hide some of the unwanted data columns
of the report by clicking on the arrows at the top of every column. This creates a
simpler and more condensed report that can fit on to the width of a single page.
Clicking on the deselected compressed column will make it visible again.
The feature of statistics and reports is very important to the Chip team as a means of
documenting and summarising the platforms throughput and performance.

-66-
Chapter 8
System Validation of Chip Tracker
System Validation
Commercially-available LIMS have been around since the 1980’s. In addition, many
laboratories have designed, implemented, and maintained in-house LIMS as
mentioned in the LIMS chapter. The heart of any LIMS is the software and like other
laboratory systems, the LIMS software is subject to quality control and quality
assurance checks. In regulatory environments, this associated QA/QC is referred to as
system validation. The primary purpose of system validation is to ensure that the
software is performing in a manner for which it was designed. For example, the
system acceptance criteria should be established and tested against quantifiable tasks
to determine if the desired outcome has been achieved [Turner, 2001]. Chip Tracker
features, such as the accurate accounting of the chips and samples in stock, creation of
purchase orders or the assignation of chips to samples for hybridisation must be
quantifiable and verifiable by the end user. System validation ensures that the entire
system has been properly tested, incorporates the required controls, and maintains and
will continue to maintain data integrity. Laboratories must establish protocols and
standards for the validation process and associated documentation.
Proper validation of a LIMS will allow a laboratory to comply with regulations and
also provide comprehensive documentation on the system that is necessary to
troubleshoot future problems. Validation of complex computerised systems
guarantees the intended use and is therefore an unavoidable requirement. The audit of
the supplier, the user requirement specifications and the acceptance test results
respectively on the software are of special interest within a customised LIMS.

-67-
Control Life Cycle of the project
Regular interaction was maintained with the molecular biologist experts at the
microarray laboratory throughout the project life cycle in order to capture the
computational necessities of managing the information in the microarray lab. We used
Rational Rose, a visual modelling tool based on the Unified Modelling Language
(UML), to visualize, understand, and refine the requirements, but especially to have a
common way to communicate with the experts and to document our development. In
addition to this, during the development of the project we had made regular
presentations of the evolving Chip Tracker prototype to the Bioinformatics, System
Development and Chip Team sections of the company in order to make sure that all
the requirements were satisfactory.
By following a model-driven prototype approach we could develop the Chip Tracker
application in a controlled way and have the consensus of the different departments
reaching the stages of implementation, installation and test successfully.
The life cycle activities of this project were the activities in a typical LIMS life-cycle
which include:
• Management / Project Initiation Phase
• Requirements Phase
• Design Phase
• Implementation Phase
• Installation and Test Phase
Future activities involve Operation and Support Phase.
User Acceptance Test
User Acceptance Test is a document that we develop to enable the users test the
software in real situations. This test allows us to make final adjustments to the
software before its release. We asked the users to take some time to read the
document and to follow the instructions in it. These guide them through a complete
execution of a microarray experiment workflow, and are then able to give us they
feedback about the Chip Tracker application.

-68-
The test is essentially a run through of what is involved in the use of the Chip Tracker
application. It is to ensure that the system works well for the users: navigation buttons
work, dropdown menus are correct and data are being entered and retrieved correctly.
There are questions asked generally requiring a yes or no answer where yes means
that the system is working and behaves properly. Before the user starts the test a
couple of microarray experiments are added into the database. This simulates a wet-
lab researcher who has just entered the information of a microarray experiment into
the ExpAnD system (information that is automatically collected by Chip Tracker) and
submitted the biological samples to the microarray laboratory. A start test script was
created to populate the Chip Tracker database with a new set of samples from the
simulated microarray experiments that it is executed on request for the testing user
just before the start of the test.
As the Chip Team is made of three workers other people involved in the project from
the Bioinformatics and Systems Development teams were asked to take the User
Acceptance Test. This made a total of six different testing users. The feedback
returned was excellent and allowed us to identify improvements to the system. The
users were familiar and agreed with the way the system displayed the information.
This is one of the advantages of following a prototype approach during the system
design. Moreover, the users found the interface very friendly and intuitive to the point
that they did not have to read the system help page in order to use the software for
first time. A copy of the User Acceptance Test document can be found in the
Appendix C.
-69-
Chapter 9
Conclusion and Future Work The aim to develop an integrated system to manage and track chips and samples used
in the microarray laboratory has been achieved. The computational tool presented in
this project provides a solution to the management problems encountered by the
microarray laboratory team and captures the microarray workflow logic, administrate
chip purchase emissions or prepare custom reports and statistics. The Chip Tracker is
a robust and coherent microarray LIMS software that enable a systematic workflow
within the oligonucleotide microarray laboratory. Thus, Chip Tracker will improve
performance and reduce the probability errors added on the microarray experiments.
A special effort was made to create an easy to use environment and a simple user
interface in order to facilitate the system usage and incorporation into microarray
laboratories.
Throughout the testing and deployment phases of the project we have identified
necessary improvements in the system. Where time allows, most of these
improvements were implemented. The actual version of Chip Tracker is GEML
compliant and integrates perfectly with the rest of the systems in the platform or any
other software that follows this standard. Although the Organon platform will
continue operating on GEML, future work on this system should extend the Chip
Tracker XML Parser component to be MAGE compliant.
Although Chip Tracker was specifically developed to guide and manage an
oligonucleotide array workflow which involves one-channel hybridisations only, it
does comply to standards and is thus a portable and flexible application that can be
use as a stand alone microarray LIMS. The task to adapt this system to a two-channel
microarray workflow, where two samples are hybridise to a single chip, should by
relatively straight forward.
-70-
In the future protein chips may supplant DNA chips, as protein expression is as good
(or better) a measure of disease than gene sequences. It is possible therefore that
protein testing may become a technology of choice in understanding disease
aetiology. Microarray software should be able to cope with the constant
improvements in technology. The Chip Tracker has a robust architecture, it is flexible
and complies to standards and is therefore easily adaptable. The XML Parser
component, which complies with the microarray standard of communication and the
way the software interacts with other systems are key issues in its design. This
features enabled us to create a small application to carry out specific tasks that
integrates with the Organon Bioinformatics Infrastructure. The desirable microarray
features of software (flexibility, robustness and data integration) have been
successfully implemented in Chip Tracker.
These are some of the advantages on using Chip Tracker microarray LIMS as part of
the microarray laboratory workflow:
• Organise Chip orders,
• Assign Samples to Chips for hybridisation,
• Create Statistics and Reports,
• Link to the existing systems and automate data collection,
• Improve the planning and organisation of the microarray experiments,
• Lack of Chip wastage,
• Improve accuracy and turnaround times,
• Reduce the probability of errors.
Finally, Chip Tracker microarray LIMS is an attempt to close the gap between
computational and wet research laboratories. This task is one of the bioinformatics
community ultimate challenges, to integrate data from many interrelated sources.
Chip Tracker accomplishes this task by providing the microarray laboratory workers
with an integrated data workflow environment to meet the needs of the already fast
increasing demand of microarray experiments in the new process of drug discovery.

-71-
Bibliography [3rd Millennium] <http://www.3rdmill.com/initiatives/resources.html> [Affymetrix, 1] GeneChip® Technology. Affymetrix Image Library. <http://www.affymetrix.com/corporate/media/image_library/image_library_1.affx> [Affymetrix, 2] GeneChip Arrays for Gene Expression Analysis. Affymetrix Technology. <https://www.affymetrix.com/technology/ge_analysis/index.affx> [Affymetrix, 3] GeneChip® Node System. Affymetrix Support, Instruments. <http://www.affymetrix.com/support/technical/datasheets/node_datasheet.pdf> [Affymetrix, 4] Phylogenetic tree schematic. Affymetrix Products. GeneChip Arrays. <http://www.affymetrix.com/en/images/phylogenetic_tree_exp.gif> [Affymetrix, 5] The Role of the GeneChip® System in Drug Discovery & Development. (2003) Affymetrix Research Community. <http://www.affymetrix.com/support/technical/other/drug_discovery_brochure.pdf> [Amersham, 2002] Scierra™ Microarray Laboratory Workflow System < http://www.amershambiosciences.com > Ref. no. 63-0048-53 Rev–A, 2002-08 [Bobashev et al., 2002]. G.V. Bobashev, S. Das, and A. Das Experimental Design for Gene Microarray Experiments and Differential Expression Analysis. Microarray data analysis II. Kluwer Academic. Publ. Pp. 23-40. [Brazma et al., 2001] Brazma,A., Hingamp,P., Quackenbush,J., Sherlock,G., Spellman,P., Stoeckert,C., Aach,J., Ansorge,W., Ball,C.A., Causton,H.C., Gaasterland,T., Glenisson,P., Holstege,F.C.P., Kim,I.F., Markowitz,V., Matese,J.C., Parkinson,H., Robinson,A., Sarkans,U., Schulze-Kremer,S., Stewart,J., Taylor,R., Vilo,J. and Vingron,M. (2001) Minimum information about a microarray experiment (MIAME)—toward standards for microarray data. Nature Genetics, 29, 365-371. [Bund et al., 1998] Bund C., Heinemann G.W., Jager B., Trinkler M. Validation of a customized LIMS. Pharm Acta Helv. 1998 Feb;72(6):349-56. [Butte, 2002] Butte,A. The use and analysis of microarray data. (2002). Nat. Rev. Drug Discov. 1, 951-960. [Cochran and Cox, 1992] Cochran W.G. and Cox, G.M. Experimental Designs. New York. Wiley, 1992. [Dopazo, 2002] Dopazo, J Microarray Data Processing And Analysis.Microarray data analysis II. Kluwer . (2002) Academic. Publ. Pp. 43-63.
-72-
[GeneCRC]. The Cooperative Research Centre for Discovery of Genes for Common Human Diseases (Gene CRC) <http://www.genecrc.org/> [Hoffman, 2000] Hoffman M. Rosetta Biosoftware April 11, 2000 communiqué. <http://xml.coverpages.org/geml.html> [Kokocinski et al., 2003] Felix Kokocinski, Gunnar Wrobel, Meinhard Hahn, and Peter Lichter QuickLIMS: facilitating the data management for DNA-microarray fabrication Bioinformatics 2003 19: 283-284 [Lao et al., 2002] Lao H. Saal, Carl Troein, Johan Vallon-Christersson, Sofia Gruvberger, Åke Borg and Carsten Peterson BioArray Software Environment: A Platform for Comprehensive Management and Analysis of Microarray Data Genome Biology 2002 3(8): software0003.1-0003.6 [Li et al., 2003] Jiang Li and Jeffrey A. Johnson Comparative Studies Using cDNA vs. Oligonucleotide Arrays An introduction to Toxicogenetics. Burczynski. CRC Press. 2003; Pp. 17-28 [Lockhart et al., 1996] Lockhart,D.J., Dong,H., Byrne,M.C., Follettie,M.T., Gallo,M.V., Chee,M.S., Mittmann,M., Wang,C., Kobayashi,M., Horton,H., and Brown,E.L. (1996). Expression monitoring by hybridization to high-density oligonucleotide arrays. Nat. Biotechnol. 14, 1675-1680. [McConnell et al., 2002]. Patrick McConnell, Kimberly Johnson, and David J. Lockhart. An Introduction to DNA Microarrays. Microarray data analysis II. Kluwer . (2002) Academic. Publ. Pp. 9-21. [McIndoe et al., 2003] Richard A. McIndoe, Aaron Lanzen, and Kimberly Hurtz MADGE: scalable distributed data management software for cDNA microarrays Bioinformatics 2003 19: 87-89. [Piantadosi, 1997] Piantadosi S. Clinical Trials: A methodological perspective. New York: John Wiley, 1997. [Schena et al., 1995] Schena M, Shalon D, Davis RW, et al. Quantitative monitoring of gene expression patterns with complementary DNA microarray. Science 1995;270;467-470. [Searls, 2000]. David B. Searls, Using bioinformatics in gene and drug discovery, Drug Discovery Today 5 (4) (2000) pp. 135-143. [Spellman et al., 2002]. Spellman,P.T., Miller,M., Stewart,J., Troup,C., Sarkans,U., Chervitz,S., Bernhart,D., Sherlock,G., Ball,C., Lepage,M., Swiatek,M., Marks,W.L., Goncalves,J., Markel,S., Iordan,D., Shojatalab,M., Pizarro,A., White,J., Hubley,R., Deutsch,E., Senger,M., Aronow,B.J., Robinson,A., Bassett,D., Stoeckert Jr,C.J. and Brazma,A. (2002) Design and implementation of microarray gene expression markup language (MAGE-ML). Genome Biology, 3(9), research0046.1-0046.9.
-73-
[Stoeckert et al., 2002] Stoeckert CJ, Causton HC, Ball CA. Microarray databases: standards and ontologies. Nat Genet. 2002 Dec;32 Suppl 2:469-73. [Turner et al., 2001] Turner E, Bolton J. Required steps for the validation of a Laboratory Information Management System. Qual Assur. 2001 Jul-Dec;9(3-4):217-24.

-74-
Appendix A GEML .xml example file This is an example of a Samples file imported by Chip Tracker: <?xml version="1.0" encoding="UTF-8" ?>
- <project name="Ovarian cycle induced immature mice" id="23" date="20-SEP-2002" by="Anjo Van Heijst"
organization="Organon Laboratories Ltd">
- <prep code="000702" name="000702" date="24-JUL-2003" prepared_by="Anjo Van Heijst" type="total RNA"
method="Trizol" description="Prep contains only 6 ug. David Pulford gave permission for this small amount."
cells_per_ml="na" prep_ug="6" prep_conc_ug_ul="1.0" location="na" reference_text="5205-750/018/19/02BB23"
scientist="Anjo Van Heijst">
- <treatment name="Humegon treatment 48h" step_number="1" media="na" volume="" volume_units="" temperature=""
temperature_units="" duration="2880" wash_before="false" description="Humegon treatment 48h">
- <treatment_compound concentration="7.5" concentration_units="active units">
<compound_reference code="63" />
<solvent_reference name="water" />
</treatment_compound>
</treatment>
</prep>
<shipment code="950" shipped_by="Anjo Van Heijst" ship_date="30-JUL-2003" delivered_by="" />
- <resource code="000702" type="oRNA" description="" init_volume="6" init_concentration="1.0" data_file="BioSizing_Total-
RNA-Nano_00269_2002-09-13_15-30-56_Partial.cld" qc_data_file="" qc_flag="true">
<shipment_ref code="950" />
<pattern_ref name="MG_U74Av2" />
<pattern_ref name="MG_U74Bv2" />
<pattern_ref name="MG_U74Cv2" />
</resource>
<other name="project_group" value="Female Contraception" />
</project>
Figure A1. This tree represents the LIMS Category of GEML 2.2
Example of SQL command to insert the parsed data into the Samples table: INSERT INTO SAMPLES (sample_id, chiptype_id, shipment_id, labbooknumber, labbookpage, experiment, project, projectgroup, esponsable, shipmentdate, status) VALUES (prep code, pattern_ref name, shipment code, prep reference_text *first entrance (XX/./.), rep reference_text *second entrance(./XX/.), prep reference_text *third entrance (././XX), project name, other value, shipment hipped_by, shipment ship_date, 'standby');

-75-
Appendix B SQL commands The following are some examples of SQL commands embedded in the system pages: Login Page: str_SQL = "select user_id, fname, sname from chipteamusers where username='" & sUserName & "' AND password='" & sPassword set rsChip = cnChipTracker.Execute(str_SQL)
Chips in Stock: ' SELECTION OF THE ALL THE DIFFERENT CHIPTYPES INSTOCK '______________________________________________________ strSQL = "select * from chiptypes where chiptype_id IN (select chiptype_id from samples where status='standby' )" & _ " OR chiptype_id IN (select chiptype_id from chips where status='standby' ) " & _ " OR chiptype_id IN (select chiptype_id from orderedchips) " set rsChipsTypes = cnChipTracker.Execute(strSQL) 'COLUMN WITH TOTAL NUM OF CHIPS IN A BATCH '_________________________________________ strSQL = "select sum(total) from batches where batch_ID = '" & rsBatches(0) 'SELECT AVALIABLE CHIPS '_________________________________________ strSQL = "select count(*) from chips where chiptype_ID=" & rsChipsTypes(0) & " AND status='standby' AND sample_id is null " & _ "AND special is null AND batch_ID='" & rsBatches(0) 'SELECT SPECIAL CHIPS '_________________________________________ strSQL = "select count(*) from chips where chiptype_ID=" & rsChipsTypes(0) & " AND status='standby' AND special is not null " & _ " AND batch_ID='" & rsBatches(0) 'SELECT ASSIGNED CHIPS '_________________________________________ strSQL = "select count(*) from chips where chiptype_ID=" & rsChipsTypes(0) & " AND status='standby' AND sample_id is not null " & _ " AND batch_ID='" & rsBatches(0) 'SELECT BATCH MONTHS FROM EXPIRY '_________________________________________________ strSQL = "select months_between( expirydate, SYSDATE) FROM DUAL, BATCHES where batch_ID = '" & rsBatches(0) ' SELECTION OF THE ALREADY ORDERED CHIPS '_________________________________________ strSQL = "select amount from orderedchips where chiptype_ID=" & rsChipsTypes(0) ' CALCULATION OF TOTAL CHIPS TO BE ORDERED '_________________________________________ ' NOT ASSIGNED SAMPLES strSQL = "select count(*) from samples where chip_id is null AND assigndate is null " & _ " AND status NOT IN ('passed','fail') AND chiptype_ID=" & rsChipsTypes(0) ' NOT ASSIGNED CHIPS strSQL = "select count(*) from chips where sample_id is null AND assigndate is null " & _ " AND status NOT IN ('passed','fail') AND chiptype_ID=" & rsChipsTypes(0)
Purchase Order strUpdate_SQL = "UPDATE ORDEREDCHIPS SET amount=" & auxTotalOrdered & " WHERE CHIPTYPE_ID =" & chiptypeLoop
Samples in Stock: strSQL = "select * from samples where status='standby' ORDER BY sample_id"
Sample: strSQL = "select sample_id, chiptype_id, shipment_id, labbooknumber, labbookpage, experiment, " & _ " project, projectgroup, responsable, comments, status, chip_id, to_char(assigndate), to_char(shipmentdate) " & _ " from samples where sample_id='" & auxSampleID
Chips Arrival: strInsert_SQL = "INSERT INTO BATCHES " & _ "(BATCH_ID, CHIPTYPE_ID, ARRIVALDATE, EXPIRYDATE, STATUS, PACKS, " & _ "CHIPSPERPACK, TOTAL) VALUES ('" & txtbatchID & "', " & txtChipType & ", '" & txtArrival & "','" & txtExp &_ "','instock'," & txtPacks & ", " & txtChips & ", " & auxTotalChips & ")"

-76-
strInsert_SQL = "INSERT INTO CHIPS " & _ "(CHIP_ID, CHIPTYPE_ID, DESCRIPTION, ARRIVALDATE, BATCH_ID, EXPIRYDATE, " & _ " STATUS) VALUES ( CHIP_ID_SEQ.NextVal, " & txtChipType & ", '" & txtDesc & "', '" & txtArrival & _
"', '" & txtbatchID & "', '" & txtExp & "', 'standby')"
Assignation of Chips to Samples: ' SELECTION OF CHIPS TO ASSIGN '____________________________________________________________________ 'OLDEST FIRST ASSIGNMENT '____________________________________________ if txtAssignation="oldest" then str_SQL = "select chip_id from chips where chiptype_id=" & chiptype_id &" AND status='standby' AND sample_id is null " & _ " AND special is NULL AND expirydate >= SYSDATE ORDER BY expirydate asc" end if '____________________________________________ 'SPECIAL ASSIGNMENT '____________________________________________ if txtAssignation="special" then str_SQL = "select chip_id from chips where chiptype_id=" & chiptype_id &" AND status='standby' AND sample_id is null " & _ " AND special='Y' AND expirydate >= SYSDATE ORDER BY expirydate asc" end if '____________________________________________ 'RANDOM ASSIGNMENT '____________________________________________ if txtAssignation="random" then str_SQL = "select chip_id from chips, DUAL where chiptype_id=" & chiptype_id &" AND status='standby' AND sample_id is null " & _ " AND special is NULL AND expirydate <= sysdate + 61 AND expirydate >= SYSDATE ORDER BY expirydate asc" set rsChipAux = cnChipTracker.Execute(str_SQL) 'IF THERE ARE NO CHIPS OF THIS CHIP TYPE IN WITHIN 2 MONTHS FROM EXPIRY 'THEN A RANDOM SELECTION OF THIS CHIPTYPE IS DONE
if rsChipAux.EOF then cnChipTracker.Execute( " CREATE OR REPLACE VIEW random_chips AS SELECT DBMS_UTILITY.GET_HASH_VALUE (TO_CHAR(SYSDATE, 'HH24:MI:SS')||chip_id,2,32768) as RANDOM_ORDER, chips.* FROM chips, DUAL" )
str_SQL = " select chip_id from random_chips where chiptype_id=" & chiptype_id &" AND status='standby' AND sample_id is null " & _ " AND special is NULL AND expirydate >= SYSDATE ORDER BY RANDOM_ORDER" end if
end if '____________________________________________________________________ 'ASSIGNATION OF CHIPS TO SAMPLES '____________________________________________ strUpdate_SQL = "UPDATE CHIPS SET SAMPLE_ID='" & sample_id & "', ASSIGNDATE='" & oraToday & "', " & _ " PROJECT='" & auxProject & "' WHERE CHIP_ID=" & auxChip_id cnChipTracker.Execute(strUpdate_SQL) strUpdate_SQL = "UPDATE SAMPLES SET CHIP_ID=" & auxChip_id & ", ASSIGNDATE='" & oraToday & "' " & _ " WHERE SAMPLE_ID='" & sample_id & "' AND CHIPTYPE_ID=" & chiptype_id cnChipTracker.Execute(strUpdate_SQL)
Log Hybridised Chips: ' CHIP-SAMPLES TO LOG SELECTION '____________________________________________ strSQL = "select * from chips where sample_id IS NOT NULL AND assigndate IS NOT NULL AND status='standby' ORDER BY sample_id" ' LOG CHIP-SAMPLES AS PASSED '____________________________________________ strUpdate_SQL = "UPDATE CHIPS SET STATUS='passed', HYBDATE='" & auxHDate & "', " & _ " USED='Y', USER_ID=" & _ session("UserID") & " WHERE CHIP_ID=" & auxChip_id strUpdate_SQL = "UPDATE SAMPLES SET STATUS='passed' WHERE SAMPLE_ID='" & auxSample_id & "' AND CHIPTYPE_ID=" & _ auxChipType_id ' LOG CHIP-SAMPLES AS FAILED AND REDO '____________________________________________ strUpdate_SQL = "UPDATE CHIPS SET STATUS='failed', HYBDATE='" & auxHDate & "', " & _ " USED='Y', USER_ID=" & session("UserID") & ", FAILREASON='" & auxReason & "' " & _ " WHERE CHIP_ID=" & auxChip_id strUpdate_SQL = "UPDATE SAMPLES SET STATUS='redo' WHERE SAMPLE_ID='" & auxSample_id & "' AND CHIPTYPE_ID=" & _ auxChipType_id strInsert_SQL = "INSERT INTO SAMPLES(sample_id,chiptype_id,shipment_id,labbooknumber,labbookpage,experiment,project," & _ "projectgroup,responsable,comments,status)values('" & auxNameSample & "'," & auxChipType_id &"," & _ rsSample(2) &",'"& rsSample(3) &"'," & _ rsSample(4) & ",'" & rsSample(5)& "','" & rsSample(6) & "','" & _ rsSample(7) & "','" & rsSample(8) & "','" & rsSample(9) & "','standby')"
Report Query (made on the fly): strSQL = " select c.batch_id,c.chiptype_id,to_char(c.arrivaldate),to_char(c.expirydate),c.status,c.sample_id,to_char(c.hybdate)," & _ " c.user_id,c.special,c.chip_id,c.failreason,s.project,s.projectgroup,s.responsable,s.experiment,s.labbooknumber,s.labbookpage from chips c, samples s where 1=1 AND c.chip_id=s.chip_id(+) " & _ queryChipType & queryStatus & querySpecial & queryArrival & queryExpiry & queryHybraF & queryHybraT & queryBatch & _ " ORDER BY " & queryOrder
-77-
Appendix C Chip Tracker User Acceptance Test
Patricio Yankilevich
August 2003
The Chip Tracker is a Microarray Laboratory Information Management System (Microarray LIMS). It provides the microarray laboratory workers with a web accessible tool, which enables them to manage and track the submissions of biological samples and microarray chips used in the microarray laboratory.
Scientists that use the microarray facility must first enter details of their experiment into the Expand (Experiment Annotation Database) database. This data is used to populate the Resolver database and to inform the Chip Team of samples that are sent to Newhouse. The Chip Tracker application also collects the Expand data via an automated process on an hourly basis.
The Chip Tracker web pages allow a user to manage and track the microarray experimental workflow from any computer in the Intranet. The Chip Tracker manages many aspects of the experimental workflow such as:
• Automatic assignation of samples to chips for hybridisation using a choice of randomisation processes
• Chip fault logging facility • Dynamic creation of statistical reports on the platform usage
The Chip Tracker Microarray LIMS has been under development at Organon Newhouse since May this year. The Chip Team experts have been involved throughout the life cycle of this project to ensure that their requirements of the application where met.
This document is the "User Acceptance Test". It is intended to enable end users to test the software in real situations. It will allow the development team to make final adjustments to the software before its release in September 2003. Please take some time to read this document and to follow the instructions in it. It may take about an hour to complete, and can be done over several days if necessary.
Please email your completed document to [email protected] by Wednesday 20 of August.
Contact details: Patricio Yankilevich, Bioinformatics, Newhouse.
Email: [email protected]
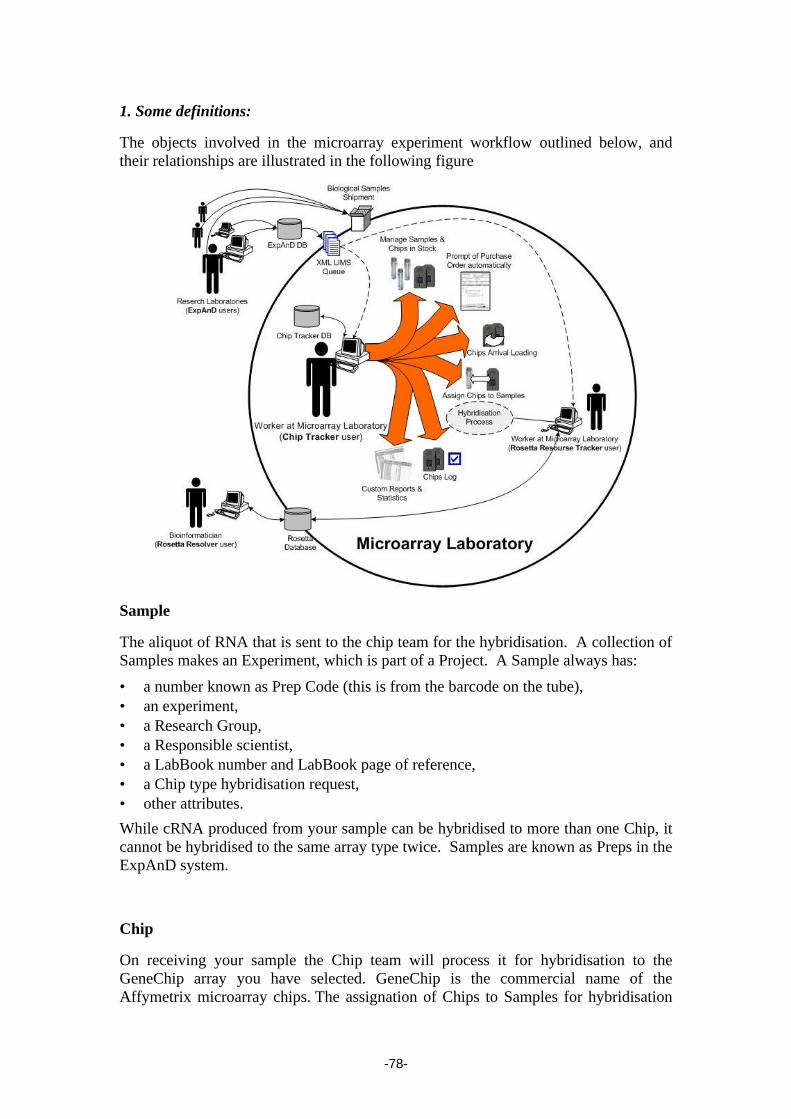
-78-
1. Some definitions:
The objects involved in the microarray experiment workflow outlined below, and their relationships are illustrated in the following figure
Sample
The aliquot of RNA that is sent to the chip team for the hybridisation. A collection of Samples makes an Experiment, which is part of a Project. A Sample always has:
• a number known as Prep Code (this is from the barcode on the tube), • an experiment, • a Research Group, • a Responsible scientist, • a LabBook number and LabBook page of reference, • a Chip type hybridisation request, • other attributes.
While cRNA produced from your sample can be hybridised to more than one Chip, it cannot be hybridised to the same array type twice. Samples are known as Preps in the ExpAnD system.
Chip
On receiving your sample the Chip team will process it for hybridisation to the GeneChip array you have selected. GeneChip is the commercial name of the Affymetrix microarray chips. The assignation of Chips to Samples for hybridisation
-79-
can be controlled by the Chip Tracker application. Chips have the following attributes:
• Batch number • Chip Type (Human Genome U133 A, Human Genome U133 B, Rat Genome
U34 A, Rat Genome U34 B, Rat Genome U34 C, etc…) • Arrival and Expiry dates • Other attributes.
2. The Test
Please contact us ([email protected]) before you start the test so that we can we can ensure that test data is available for you to work on. We have created a Start Test script, which populates the Chip Tracker database with a new set of samples from a microarray experiment that will be run on your request just before you start testing.
This test is essentially a run through what is involved in the use of the Chip Tracker application. It is to ensure that the system works well for the users for example: navigation buttons work, dropdown menus are correct and data are being entered and retrieved correctly. The questions asked generally require a "yes" or "no" answer. If the system is working (a ‘yes’ answer) correctly please check the box after the question. If you answer no to a question please leave the box unchecked.
2.1 Access to the Chip Tracker Web Site
This test is to ensure that the user can enter the Chip Tracker website.
1. Open a Microsoft Internet Explorer browser session. Go to the Chip Tracker login URL, http://morpheus/chiptracker/
Does this take you to the Chip Tracker Login page?
2. From the Chip Tracker Login page enter your User Name and Password provided with this test and click “Login”.
Have you been able log into the system?
Can you see you Name and log status on the top right corner of the screen?
Does this take you to the Chips in Stock (default home page)?
Pass:
Fail:
Comments:
-80-
2.2 Chips in Stock
This test is to check the management of Chips in Stock is working
1. A successful login will open the Chips is Stock page. There you can see the chip availability in the microarray laboratory and the chips that are requested.
Do you see each Chip Type, showing no Batches and zero availability?
Do you see on the far right column the number of Chips to be ordered per Chip Type?
2. Choose the Samples in Stock option on the navigation frame on the left of your screen. Check that the total amount of Preps (see bottom of the list of samples) present in stock is equal to the total amount of Chips to be order in the Chips in Stock page.
Do you understand the relationship between the Samples in Stock and the Chips to be ordered?
3. Go back to the Chips in Stock page and create a Request for Purchase Order of the chips required to start the “Ovarian cycle induced immature mice” Project which involves Murine Genome Chips only by clicking the Create Purchase Order icon. Modify the Purchase Form to order Murine Chips A, B and C only and not the Human ones by erasing the Human Genome rows of the form. Fill the rest of the form and click on the Accept & Print icon.
Do you see that the amount of Packs has been calculated automatically?
Did you notice that you are able to modify the Purchase Order to include only those chips you wish to order?
Could you print out the Purchase Order correctly?
Were you able to avoid the header and footer from being printed in your report?
Do you see in the Chips in Stock page that there are no more Chips to be Order of the Murine type, but now this amount appear as Ordered?
Do you see that the Human Chips still to be Ordered?
Note: If you like to avoid the annoying header and footer from appear in your printed Purchase Order go to the File menu in your Browser (top left of your screen) and select the Page Setup option, then erase what is appearing in the Header and Footer boxes and accept. Now the next time you print an Order the header and footer will not appear.
Pass:
Fail:
Comments:

-81-
2.3 Samples in Stock
This test is to check the management of Chips in Stock is working
1. Choose the Samples in Stock option on the navigation frame on the left of your screen.
Do you see a list of all Samples in stock showing sample code, Chip type requested, Project, Group, Experiment and Responsible for each sample?
2. The last column on the right shows a batch number in case that the sample had been assign to chip for hybridisation. It should be empty at this stage. Now, click on any the sample codes in order to get additional info.
Do you see the Sample page showing further info about that Sample?
3. Go back to Samples in Stock, suppose that one of the Human samples (e.g. 000875) does not passed the QC done on the arriving to the Microarray Lab, so you decide to get in touch which the responsible researcher to order a new sample and delete this sample from the system. So, go ahead and delete the sample by click into the sample code, this will take you to the Sample page, mark both preps of the sample to be deleted and delete them.
Did you succeed in the task of deleting a useless sample?
Do you see that this sample is not shown on the Samples in Stock list anymore?
Pass:
Fail:
Comments:
2.4 Chips Arrival
This test is to check that the process of loading arriving batches of chips into the system is working
1. Choose the Chips Arrival option on the navigation frame on the left of your screen. Lets say that three different batches of 1 pack of 5 chips each arrived with the Murine Genome Chips. The corresponding batches are:
Chip Type Batch Number Packs Chips Expiry Date Murine Genome A 0000002100 1 5 20 May 2004 Murine Genome B 0000002101 1 5 25 May 2004 Murine Genome C 0000002102 1 5 14 July 2004
Now go ahead and load the every batch, one at a time, into the system. Note that the Expiry Date is been set to one year by default but you may have to change it. If you ever use the calendar feature by clicking on the calendar icon please note that the calendar will be showing the actual date and you may have to navigate to next year to set an expiry date.
-82-
Were you able to load the batches?
Could you use the calendar?
2. Try to load a new batch into the system using the number 0000002100 for a different Chip Type. Now try to load a new batch into the system using the number 0000002100 and Murine Genome A.
Do you find that the validations are correct?
3. Go to the Chips in Stock page and check that all the chips that you just loaded are in Stock, which mean that they are available. Please note that used chips are not going to be shown in the Chips in Stock page for the simple reason that they are not available anymore.
Do you notice that once the Murine chips arrived they are not shown as Ordered anymore?
Can you click at the Chip Type name and see the details of the available batches?
Pass:
Fail:
Comments:
2.5 Assign Chips
This test is to check the Assignation of Chips to Samples process is working
1. Choose the Assign Chips option on the navigation frame on the left of your screen. Now that you have Murine Chips in stock you can start the experiment but first you have to assign a Chip to Sample. In this page you have a list of samples that has not been assigned to a chip yet. Go ahead and mark the samples that you would like to hybridise, remember that there are Murine chips in stock only so you would not be able to assign chips the Human samples for example.
There three different types of assignation Random, Oldest 1st and Special where
Random: If there are any chips of the corresponding chip type available that are within two months from expiry then these chips are chosen be assign to the samples, but if non of the available chips of the corresponding chip type are about to expiry then the chips will be chosen randomly from the available batches of the corresponding chip type and assign to the samples. Special chips are not going to be assigned by this type of assignation.
Older 1st: The system will choose the chips that are closer to expiry date from the available chips of the corresponding chip type, and assign them to the samples. Special chips are not going to be assigned by this type of assignation.
Special: The system will choose chips marked as special that are closer to expiry date from the available special chips of the corresponding chip type, and assign them to the samples. Note that chips have to be previously marked as special in order to be assign. Chips marked as special would not be assigned through any other assignation type, so we can understand these chips as reserved.

-83-
2. Now go ahead and assign chips to the preps in the sample 000702 with the default assignation type (Random)
Were you able to assign the samples?
Try to assign other samples with Special assignation; Do you get an error message?
Go to Samples in Stock, Do you see the samples assigned to the corresponding batches?
Click into the 000702 link to see the detail of the assigned preps, Can you see it?
Go to Chips in Stock, Do you see the chips assigned and a reduction on Chips in Stock?
Go back to Assign Chips, Do you see the assigned samples are not present anymore?
3. Random Assignation. Now we are going to test the randomness of assignation, in order to do this you have to had a couple of batches more per Murine chip type into the system from the Chip Arrival page. Add batches: 0000002103 and 0000002104 of Murine Genome A 0000002105 and 0000002106 of Murine Genome B 0000002107 and 0000002108 of Murine Genome C all batches with the default expiry date. Go back to the Assign Chips page and assign the preps of the sample 000703 with the Random type of assignation.
Were you able to assign the samples?
Go to Samples in Stock, Do you see the samples 000703 were assigned randomly to the batches of the corresponding chip type?
Go to Chips in Stock, Do you see the chips assigned and a reduction on Chips in Stock?
Go back to Assign Chips, Do you see the assigned samples are not present anymore?
4. Now go to the Samples in Stock page and click into the 000703 link to see the sample detail. Check every sample to be Unassigned and click on the Unassign button.
Can you unassign the preps in the 000703 sample?
Go to Samples in Stock, Do you see that the preps in the 000703 sample are now unassigned?
Go to Chips in Stock, Do you see an increase of chips in Stock and a reduction of assigned?
Go back to Assign Chips and assign preps in sample 000703 randomly again. Do you see that the batches assigned are probably not the same as before?
5. Oldest 1st Assignation. In order to test this type of assignation we will unassign a prep first and then we will add a new batch that is about to expire. Go to the Samples in Stock page and click into the 000703 link to see the sample detail and unassign prep Murine Genome A. Now add a batch 0000002109 containing Murine Genome A chips that has a expiry date in the next week for example. Now go to the Assign Chips page, check prep Murine Genome A of the sample 000703 to assign, choose the Oldest 1st assignation type and assign.
Were you able to assign the sample?
Go to Samples in Stock, Do you see the prep Murine Genome A of the sample 000703 is assigned to the 0000002109 batch?
-84-
6. Special Assignation. In order to test this type of assignation you should first mark some chips as special. But now we will start working with the samples of the other project in stock “Validation of the HepG2 celline” which involves Human Genome chips. So now go to the Chips in Stock page and from there create a Purchase Order of Human Genome Chips. Once you print out the order we can assume that times goes fast and now the chips had arrived, so please load into the system through the Chips Arrival page the following batches:
Chip Type Batch Number Packs Chips Expiry Date Human Genome A 0000003000 1 5 20 June 2004 Human Genome B 0000003001 1 5 25 June 2004
Now go to the Chips in Stock page click on the Human Genome A chip type to get to the Chip Type detail page. From this page you are able to mark some of the available chips as Special (which as we mention earlier will make this chips reserved). Go ahead and mark 3 of the chips as Special, do the same for some of the chips of the Human Genome B.
Were you able to mark some chips as Special?
Go to Chips in Stock, Do you see that these chips had been subtracted from the in Stock because now are reserved and not available anymore?
Go to Assign Chips, and assign samples 000872 and 000873 using a Special type of assignation. Were you able to do the special assignation?
Go to Chips in Stock, and click on the Chip Type link to go to Chip Type detail page of the Human Genome chips and set free the rest of special chips that are not assigned. Were you able to free (unreserved) those chips?
Pass:
Fail:
Comments:
HIBRIDISATION TAKES PLACE AT STAGE
(Rosetta Resource Tracker aids in this task)
2.6 Log Chips
This test is to check the logging of hybridised chips process is working
1. Choose the Log Chips option on the navigation frame on the left of your screen. You should be able to see a list of all the assigned samples. The lab worker should only use this feature after he has the hybridisation results. Go ahead and log some of the hybridised chips, every sample-chip hybridised appears as “Pass” by default. If you do not have the hybridisation results yet you can unmark and leave a blank to be filled later. If the hybridisation process failed you can mark the chip as “Fail” or “Fail & Redo” select a failure reason to chip. If you chose “Fail & Redo” on for example the sample 000702 hybridised with a chip of the batch 0000002100 then the chip assigned to that sample will be marked as fail and a new sample 000702_1 will be created to be hybridise again.
Were you able to log the chips?
-85-
Go to Chips in Stock, Do you see that these chips had been subtracted from the assigned chips because now are used and not available anymore?
Go to Samples in Stock, Do you see that the logged samples are there anymore because they have been used already?
Go to Samples in Stock, Do you see the new samples for the sample-chips you marked as “Fail & Redo”?
Pass:
Fail:
Comments:
2.7 Chips Statistics
This test is to check the reports and statistics are working
1. Choose the Chips Statistics option on the navigation frame on the left of your screen. You should be able to see a form to let you create queries on the Chip Tracker Database. By filling the conditions on what you would like to query you are able to create customise reports to print. Now go ahead and do you first report by listing all the Murine Genome Chips that has been used in the facility. Make sure that to selected the Murine Chip Type, the chips with “Passed” and “Failed” status and not the ones on “Standby”. Now click on the Run Query button.
Were you able to see the report?
Can you see that you are able to hide columns of the report by pressing on the arrows? By pressing in the remaining part of the column you are able to unhide it.
2. Now try a different query, this time choose All Chip Types, all the chip status “Standby”, “Passed” and “Failed”, and mark the “Percentage” option. Now run the query.
Were you able to see the percentages at the top of the report?
3. Now play around with different queries by changing the dates or query specifically on a batch number. Also print some of you reports, note that if you are not hiding any of the columns you will have to set you printer to landscape page orientation.
Could you print your reports?
Have you notice that query conditions are shown at the top of the report?
4. If you like to avoid the annoying header and footer from appear in your reports go to the File menu in your Browser (top left of your screen) and select the Page Setup option, then erase what is appearing in the Header and Footer boxes and accept. Now print another report.
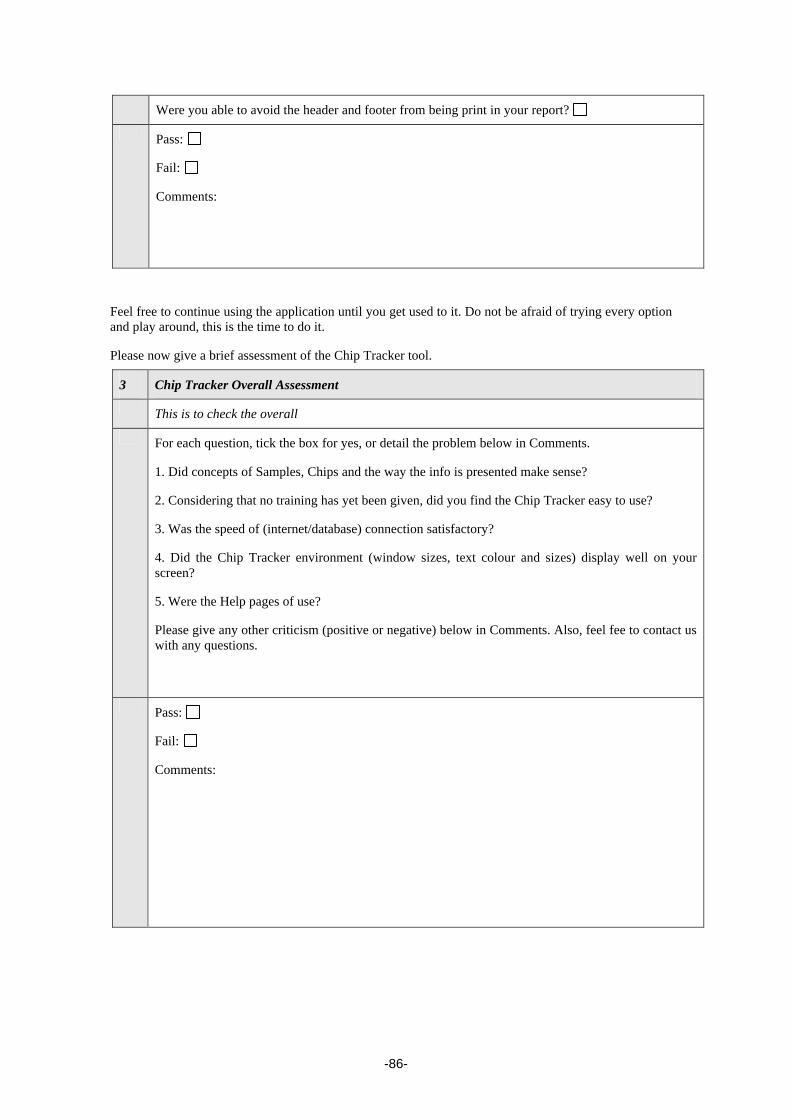
-86-
Were you able to avoid the header and footer from being print in your report?
Pass:
Fail:
Comments:
Feel free to continue using the application until you get used to it. Do not be afraid of trying every option and play around, this is the time to do it.
Please now give a brief assessment of the Chip Tracker tool.
3 Chip Tracker Overall Assessment
This is to check the overall
For each question, tick the box for yes, or detail the problem below in Comments.
1. Did concepts of Samples, Chips and the way the info is presented make sense?
2. Considering that no training has yet been given, did you find the Chip Tracker easy to use?
3. Was the speed of (internet/database) connection satisfactory?
4. Did the Chip Tracker environment (window sizes, text colour and sizes) display well on your screen?
5. Were the Help pages of use?
Please give any other criticism (positive or negative) below in Comments. Also, feel fee to contact us with any questions.
Pass:
Fail:
Comments: