chloroplast competition is controlled by lipid
TRANSCRIPT
Chloroplast competition is controlled by lipidbiosynthesis in evening primrosesJohanna Sobanskia, Patrick Giavaliscob, Axel Fischerc, Julia M. Kreinerd, Dirk Waltherc, Mark Aurel Schöttlera,Tommaso Pellizzera, Hieronim Golczyke, Toshihiro Obataf, Ralph Bocka, Barbara B. Searsg, and Stephan Greinera,1
aDepartment Organelle Biology, Biotechnology and Molecular Ecophysiology, Max Planck Institute of Molecular Plant Physiology, 14476 Potsdam-Golm,Germany; bDepartment Molecular Physiology, Max Planck Institute of Molecular Plant Physiology, 14476 Potsdam-Golm, Germany; cDepartment MetabolicNetworks, Max Planck Institute of Molecular Plant Physiology, 14476 Potsdam-Golm, Germany; dDepartment of Ecology & Evolutionary Biology, Universityof Toronto, ON M5S 3B2, Canada; eDepartment of Molecular Biology, Institute of Biotechnology, John Paul II Catholic University of Lublin, Konstantynów 1I,20-708, Poland; fCenter for Plant Science Innovation and Department of Biochemistry, University of Nebraska-Lincoln, Lincoln, NE 68588; and gDepartmentof Plant Biology, Michigan State University, East Lansing, MI 48824-1312
Edited by Daniel B. Sloan, Colorado State University, Fort Collins, CO, and accepted by Editorial Board Member Joseph R. Ecker February 4, 2019 (received forreview July 6, 2018)
In most eukaryotes, organellar genomes are transmitted preferen-tially by the mother, but molecular mechanisms and evolutionaryforces underlying this fundamental biological principle are far fromunderstood. It is believed that biparental inheritance promotescompetition between the cytoplasmic organelles and allows thespread of so-called selfish cytoplasmic elements. Those can be, forexample, fast-replicating or aggressive chloroplasts (plastids) that areincompatible with the hybrid nuclear genome and therefore malad-aptive. Here we show that the ability of plastids to compete againsteach other is a metabolic phenotype determined by extremely rapidlyevolving genes in the plastid genome of the evening primroseOenothera. Repeats in the regulatory region of accD (the plastid-encoded subunit of the acetyl-CoA carboxylase, which catalyzesthe first and rate-limiting step of lipid biosynthesis), as well as inycf2 (a giant reading frame of still unknown function), are respon-sible for the differences in competitive behavior of plastid geno-types. Polymorphisms in these genes influence lipid synthesis andmost likely profiles of the plastid envelope membrane. These inturn determine plastid division and/or turnover rates and hencecompetitiveness. This work uncovers cytoplasmic drive loci con-trolling the outcome of biparental chloroplast transmission. Here,they define the mode of chloroplast inheritance, as plastid com-petitiveness can result in uniparental inheritance (through elimi-nation of the “weak” plastid) or biparental inheritance (when twosimilarly “strong” plastids are transmitted).
biparental inheritance | selfish cytoplasmic elements |correlation mapping | acetyl-CoA carboxylase | ycf2
Most organelle genomes are inherited from the mother (1,2), but biparental transmission of plastids has evolved in-
dependently multiple times. Approximately 20% of all angio-sperms contain chloroplasts in the pollen generative cell, indicatingat least a potential for biparental transmission (2–4). Althoughreasons for this are controversial (2, 5–9), a genetic consequence ofthe biparental inheritance patterns is a genomic conflict betweenthe two organelles. When organelles are transmitted to the progenyby both parents, they compete for cellular resources. As the plastidsdo not fuse and hence their genomes do not undergo sexual re-combination, selection will favor the organelle genome of thecompetitively superior plastid (2, 10–13). In a population, the en-suing “arms race” can lead to evolution and spread of selfish oraggressive cytoplasmic elements that potentially could harm thehost cell. The mechanisms and molecular factors underlying thisphenomenon are elusive, yet there is solid evidence for a wide-spread presence of competing organelles (2). Heteroplasmic cellscan be created from cell fusion events, mutation of organelle DNA,or sexual crosses (14–17), but only very few cases have been studiedin some detail in model organisms. One them is Drosophila, inwhich mitochondrial competition experiments can be set up viacytoplasmic microinjections (18, 19). Another is the evening prim-
rose (genus Oenothera) (20, 21). This plant genus is certainly themodel organism of choice to study chloroplast competition; theoriginal theory of “selfish” cytoplasmic elements is based on eve-ning primrose genetics (10): in the Oenothera, biparental plastidinheritance is the rule (22), and the system is a prime example ofnaturally occurring aggressive chloroplasts (2, 10). Based on ex-tensive crossing studies, five genetically distinguishable chloroplastgenome (plastome) types were shown to exist. Those were desig-nated by Roman numerals (I–V) and grouped into three classesaccording to their inheritance strength or assertiveness rates incrosses (strong, plastomes I and III; intermediate, plastome II; andweak, plastomes IV and V), reflecting their ability to outcompete asecond chloroplast genome in the F1 generation upon biparentaltransmission (20, 22, 23). The plastome types were initially identi-fied based on their (in)compatibility with certain nuclear genomes(24, 25). Strong plastomes provide “hitchhiking” opportunities for
Significance
Plastids and mitochondria are usually uniparentally inherited,typically maternally. When the DNA-containing organelles aretransmitted to the progeny by both parents, evolutionarytheory predicts that the maternal and paternal organelles willcompete in the hybrid. As their genomes do not undergo sex-ual recombination, one organelle will “try” to outcompete theother, thus favoring the evolution and spread of aggressivecytoplasms. The investigations described here in the eveningprimrose, a model species for biparental plastid transmission,have discovered that chloroplast competition is a metabolicphenotype. It is conferred by rapidly evolving genes that areencoded on the chloroplast genome and control lipid bio-synthesis. Because of their high mutation rate, these loci canevolve and become fixed in a population very quickly.
Author contributions: J.S. performed the main experimental work; P.G., A.F., J.M.K., D.W.,M.A.S., T.P., H.G., T.O., B.B.S., and S.G. provided supportive data; A.F. and S.G. developedthe correlation mapping approach; J.M.K. implemented PGLS; J.S., P.G., A.F., J.M.K., D.W.,M.A.S., T.P., H.G., T.O., R.B., B.B.S., and S.G. analyzed and discussed the data; B.B.S. and S.G.designed the study; J.S. and S.G. wrote themanuscript; and P.G., A.F., D.W., M.A.S., H.G., R.B.,and B.B.S. participated in writing.
The authors declare no conflict of interest.
This article is a PNAS Direct Submission. D.B.S. is a guest editor invited by the EditorialBoard.
This open access article is distributed under Creative Commons Attribution License 4.0 (CC BY).
Data deposition: The sequences reported in this paper have been deposited in the GenBankdatabase (accession nos. EU262890.2, EU262891.2, KT881170.1, KT881171.1, KT881172.1,KT881176.1, KU521375.1, KX687910.1, KX687913.1, KX687914.1, KX687915.1, KX687916.1,KX687917.1, and KX687918.1).1To whom correspondence should be addressed. Email: [email protected].
This article contains supporting information online at www.pnas.org/lookup/suppl/doi:10.1073/pnas.1811661116/-/DCSupplemental.
Published online March 4, 2019.
www.pnas.org/cgi/doi/10.1073/pnas.1811661116 PNAS | March 19, 2019 | vol. 116 | no. 12 | 5665–5674
GEN
ETICS
Dow
nloa
ded
by g
uest
on
Oct
ober
17,
202
1

loci that result in incompatible or maladaptive chloroplasts, andthese would be viewed as selfish cytoplasmic elements (2, 10). It wasfurther shown that the loci, which determine the differences incompetitive ability of the chloroplast, are encoded by the chloro-plast genome itself (20, 22, 23).
ResultsTo pinpoint the underlying genetic determinants, we developedan association mapping approach that correlates local sequencedivergence to a phenotype. We analyzed 14 complete chloroplast
genomes from Oenothera WT lines, whose inheritance strengthhad been previously classified in exhaustive crossing analyses (20,22, 26). This enabled us to correlate the experimentally de-termined inheritance strengths to sequence divergence in a givenalignment window (Materials and Methods and SI Appendix, SIText). The Pearson’s and Spearman’s applied correlation metricsassociated the genetic determinants of inheritance strength withfour major sites: the regulatory region of the fatty acid bio-synthesis gene accD (promoter, 5′-UTR, and protein N terminus),the origin of replication B (oriB), ycf1, and ycf2 (including its
A
B
Fig. 1. Correlation mapping to identify chloroplast loci for inheritance strength in the WT chloroplast genomes. (A) Spearman and Pearson correlation toinheritance strength plotted against alignment windows of the WT plastomes. Relevant genes or loci with significant correlation are indicated in the linearplastome maps above. The region displayed in B is highlighted by green circles. Significant correlations (P < 0.05) are shown in black. Correlations to k-meansclasses are shown. Further details are provided in Materials and Methods, SI Appendix, SI Text, and main text. (B) Correlation to inheritance strength at theaccD region in the WT plastomes. Individual sequences are sorted according to their competitive ability. Polymorphic regions are indicated in black, and thinlines represent gaps mostly resulting from deletions. (Upper) Alignment of the trnQ–UUG–accD intergenic spacer (−3,437 to −1) and the accD gene, includingpromoter, 5′-UTR, and CDS. The accD CDS, starting from +1, is highlighted in green. Regions marked by “interval 1” and “interval 2” display nearly absolutecorrelation to inheritance strength (SI Appendix, SI Text and Dataset S1). Note that these sequence intervals span the promotor region, the 5′-UTR, and the 5′-end of accD. All three are considered to play a regulatory role (29, 75–78). (Lower) Amino acid sequence of the AccD N terminus and correlation to inheritancestrength. Colors indicated different amino acids. Most variation in the sequence is conferred by repeats encoding glutamic acid-rich domains marked in purple(SI Appendix, SI Text).
5666 | www.pnas.org/cgi/doi/10.1073/pnas.1811661116 Sobanski et al.
Dow
nloa
ded
by g
uest
on
Oct
ober
17,
202
1

promoter/5′-UTR; Fig. 1 and SI Appendix, SI Text, Fig. S1, andDataset S1). The ycf1 and ycf2 genes are two ORFs of unknownfunction; ycf1 (or tic214) has tentatively been identified as anessential part of the chloroplast protein import machinery (27),but this function has been questioned (28). The accD gene en-codes the β-carboxyltransferase subunit of the plastid-localizedplant heteromeric acetyl-CoA carboxylase (ACCase). The enzymeis responsible for catalyzing the initial tightly regulated and rate-limiting step in fatty acid biosynthesis. The other three requiredACCase subunits, α-carboxyltransferase, biotin-carboxyl carrierprotein, and biotin carboxylase, are encoded by nuclear genes (29).The polymorphisms detected through our correlation mappingrepresent large insertions/deletions (indels), which are in frame inall coding sequences (CDSs; Fig. 1B and SI Appendix, SI Text, Figs.S2–S6, and Dataset S2). Several other polymorphisms in intergenicspacers of photosynthesis and/or chloroplast translation genes werecorrelated with plastome assertiveness rates (Fig. 1A and SI Ap-pendix, SI Text and Dataset S1). However, both of those gene classesare unlikely to affect chloroplast inheritance, as other studies haveshown that mutations in genes that result in chlorophyll-deficientchloroplasts do not alter their inheritance strengths in the eveningprimrose (20, 30, 31) (SI Appendix, SI Text). By contrast, the large
ORFs of unknown function, the origins of replication, and a centralgene in lipid metabolism such as accD (29) are serious candidates toencode factors involved in chloroplast competition.Because of the lack of measurable sexual recombination in
seed plant chloroplast genomes (2), our correlation mappingmethod first established associations of polymorphic loci that arefixed in the slow plastome type IV with weak inheritancestrength, regardless of their functional relevance (SI Appendix, SIText). Ideally, this problem can be partially circumvented ifphylogenetic independence of the correlation between inheri-tance strength and a sequence’s window comprising a candidatelocus can be shown. Therefore, to correct for phylogeny in ourcorrelation mapping analysis, we implemented phylogeneticgeneralized least squares (PGLS). This, however, yielded in-significant results after P value adjustment when applied to allsequence windows of the WT plastomes (SI Appendix, SI Text,Fig. S1, and Dataset S1). Because the correlation mapping re-sults did not withstand controlling for phylogeny and multipletesting, we aimed to generated mutants from the candidate locito test whether those loci affect inheritance strength. For this, weconducted a genetic screen for weak chloroplast mutants derivedfrom the strong chloroplast genome I by employing a plastome
A B
C D
Fig. 2. Transmission efficiencies of plastome I variants and theWT plastomes I-johSt (strong), II-suavG (intermediate), and IV-atroSt (weak) as determined by crosseswith I-chi/I-hookdV (strong) and IV-delta/IV-atroSt (weak). (A and C) Classical approach based on counting of variegated seedlings. (B and D) MassARRAY assayquantifyingmaternal and paternal ptDNA.WTs and green variants were crossed as the seed parent to I-chi as male parent (A) and as the pollen parent to IV-delta asfemale parent (C). The X-axis depicts the average percentage of variegated progeny (percentage biparental inheritance) obtained from three seasons (2013, 2014,and 2015). Fisher’s exact test determined significance of differences between variants and their progenitor I-johSt (***P < 0.0001, **P < 0.001, *P < 0.01). Crosses ofI-johSt and variants with I-hookdV as male (B) and with IV-atroSt as female parent (D). Box plots represent the transmission frequencies of the paternal plastomesmeasured by MassARRAY. To account for significant differences vs. I-johSt, Kruskal–Wallis one-way ANOVA on ranks was performed (*P < 0.05). Because of thedetection threshold of theMassARRAY (5–10%), most variants show the same or slightly decreased transmission efficiency as their WT I-johSt (B and D). Only for theweak variants VC1 and V3g is the difference of the ratio of paternal and maternal ptDNA in the pool large enough to result in the detection of a significantly lowerassertiveness rate in both crossing directions. Altogether, the classical approach using bleached chloroplast mutants gives more reliable results and allows a muchfiner discrimination of transmission efficiencies (cf. A vs. B and C vs. D). Further details are provided in SI Appendix, SI Text.
Sobanski et al. PNAS | March 19, 2019 | vol. 116 | no. 12 | 5667
GEN
ETICS
Dow
nloa
ded
by g
uest
on
Oct
ober
17,
202
1

mutator (pm) allele (Materials and Methods). The pm-basedmutagenesis approach yields indels in repetitive regions (32),similar to those identified by our association mapping (SI Ap-pendix, SI Text). This led to the isolation of 24 plastome I variantswith altered inheritance strength (Fig. 2 and SI Appendix, SIText). As we selected for green and photosynthetically competentchloroplasts in the mutagenesis (Materials and Methods), none ofthose variants differed from the WT in their photosyntheticparameters, chloroplast size, or chloroplast volume per cell. Theplants with the variant plastomes did not display any growthphenotype (SI Appendix, SI Text and Figs. S7–S9). Sequenceanalysis of 18 variants, spanning the range of observed variationin inheritance strength, revealed an average of seven mutationevents per variant. The analysis included one additional variant(VC1) with more background mutations, which resulted from itsisolation after being under the mutagenic action of the pm forseveral generations (Materials and Methods and SI Appendix, SIText). Most of the pm-induced mutations are composed of singlebase pair indels at oligo(N) stretches in intergenic regions, i.e.,not of functional relevance, or larger in-frame indels at thehighly repetitive sites of accD, ycf1, ycf2, or oriB (SI Appendix,Figs. S2–S6, Table S1, and Dataset S2). Correlation analysis toinheritance strengths at these sites confirmed the relevance ofaccD and ycf2 in chloroplast inheritance (r = 0.72, P = 0.05 forthe 5′ end of AccD; r = 0.91, P < 0.0005 for the promotor/5′-UTR of ycf2; and r = 0.70, P < 0.005 for a mutated site in Ycf2;Fig. 3 and SI Appendix, SI Text and Figs. S2–S6 and S10). Thesefindings were confirmed by two additional very weak mutantsderived from the strong plastome III (Materials and Methods andSI Appendix, SI Text). Based on the full chloroplast genome se-quences of these lines (SI Appendix, Dataset S2), it appeared thatthe promotor/5′-UTR of accD is affected in one of the lines. Inaddition, in both lines, the ycf2 gene is most heavily mutatedcompared with all other (weak) materials sequenced so far. Thisstrongly advocates for ycf2 being involved in chloroplast com-petition (SI Appendix, Table S2). The very weak variants ofplastome III, as well as correlation analysis of oriB and ycf1 in theplastome I variants, did not support an involvement of theseregions in the inheritance phenotype (Fig. 3 and SI Appendix, SIText, Figs. S6 and S10, and Tables S1 and S2). Furthermore, thesecond replication origin (oriA) was found to be nearly identicalwithin all sequenced WT or mutant plastomes.These data argue against plastid DNA (ptDNA) replication,
per se, being responsible for differences in chloroplast compet-itiveness. This conclusion is in line with previous analyses of theOenothera replication origins, which had suggested that theirvariability does not correlate with the competitive strength of theplastids (33, 34) (SI Appendix, SI Text). We further confirmedthis by determining the relative ptDNA amounts of chloroplastswith different inheritance strengths in a constant nuclear back-ground. No significant variation of ptDNA amounts was ob-served over a developmental time course in these lines, thusexcluding ptDNA stability and/or turnover as a potential mech-anism (SI Appendix, SI Text and Fig. S11). Moreover, no signif-icant differences in nucleoid numbers per chloroplast or nucleoidmorphology was observed, as judged by DAPI staining (SI Ap-pendix, SI Text and Figs. S12 and S13).Next, we conducted a more detailed analysis of accD and ycf2. In
a constant nuclear background, the weakWT plastome IV appearedto be an accD overexpressor compared with the strong WT plas-tome I, as judged from Northern blot analyses. However, thisoverexpression could not be detected in the plastome I variants thathave a weakened competitive ability. Similar results were obtainedfor ycf2, which has an RNA of approximately 7 kb, reflecting thepredicted size of the full-length transcript (SI Appendix, SI Text andFig. S14). Interestingly, lower bands, probably reflecting transcriptprocessing and/or degradation intermediates, differ between the
strong WT plastome I and the weak WT plastome IV, with thelatter being similar to the weak plastome I variants.As these analyses did not allow conclusions about the func-
tionality of AccD or Ycf2 in our lines, we decided to determinethe ACCase activity in chloroplasts isolated from a constantnuclear background. As shown in Fig. 4A, the presence of largemutations/polymorphisms in the N terminus of the accD readingframe co-occurs with higher levels of ACCase enzymatic activity.Surprisingly, mutations/polymorphisms in ycf2 also have an in-fluence on ACCase activity, as revealed by lines that are notaffected by mutations in accD. The molecular nature of thisfunctional connection between Ycf2 and ACCase activity iscurrently unclear, although Ycf2 shares weak homologies to theFtsH protease (35, 36), which has a regulatory role in lipopoly-saccharide synthesis in Escherichia coli (37). In any case, a simplerelationship of ACCase activity and competitive ability of plas-tids is not present, but alterations in the earliest step of fatty acidbiosynthesis can conceivably result in various changes in lipidmetabolism (SI Appendix, SI Text).To examine the alterations in lipid biosynthesis, we deter-
mined the lipid composition of seedlings harboring strong andweak WT chloroplasts as well as the variants that differ inchloroplast inheritance strength (SI Appendix, SI Text and TableS3). Then, we employed a least absolute shrinkage and selectionoperator (LASSO) regression model to predict competitiveability of a given chloroplast (Fig. 4B). As chloroplast in-heritance strength is independent of photosynthetic compe-tence (SI Appendix, SI Text), we included pale lines. The aim wasto enrich the lipid signal responsible for inheritance strength, i.e.,to deplete for structural lipids of the photosynthetic thylakoidmembrane, which is a major source of chloroplast lipids (38).Indeed, of 102 lipids analyzed, 20 predictive ones for inheritancestrengths were identified (Fig. 4C and SI Appendix, SI Text andTable S4). Strikingly, the signal is independent of greening (i.e.,an intact thylakoid membrane system and the photosyntheticcapacity), which is in line with the genetic data (SI Appendix, SIText). This result hints at the chloroplast envelope determiningassertiveness rates, a view that is supported by the fact that halfof the predictive lipids come from lipid classes present in plas-tidial membranes and abundant in the chloroplast envelope, suchas MGDG, DGDG, PG, and PC (39). The remaining predictivelipids mostly represent storage lipids (TAG). This might be aresult of an altered fatty acid pool (SI Appendix, SI Text). Sta-tistical significance of enrichment of a given class could not beestablished as a result of low numbers (SI Appendix, SI Text andTables S4 and S5), although, especially in the lipid class PC, whichis the dominant phospholipid class in the chloroplast outer enve-lope (40), 4 of 13 detected lipids were found to be predictive. In thechloroplast, PCs are specific to the envelope membrane and es-sentially absent from thylakoids. This makes it very likely that thelipid composition of the envelope membrane affects chloroplastcompetition. A possible explanation could be that strong and weakchloroplasts differ in division rates, for example, as a result of dif-ferential effectiveness in recruiting chloroplast division rings, whichare anchored by membrane proteins (41). Alternatively, chloro-plast stability might depend on envelope membrane composi-tion. Strictly speaking, we cannot exclude a (further) involvementof extraplastidial membranes to the inheritance phenotype (mostof the total cellular PCs are found in the ER and the plasmamembrane) (38), but this would require a much more compli-cated mechanistic model.
DiscussionThe present work explains plastid competition followingbiparental inheritance from a mechanistic perspective andpoints to genetic loci that appear to be responsible for thesedifferences. Moreover, as chloroplast competition can resultin uniparental inheritance through the elimination of weak
5668 | www.pnas.org/cgi/doi/10.1073/pnas.1811661116 Sobanski et al.
Dow
nloa
ded
by g
uest
on
Oct
ober
17,
202
1
chloroplasts (9, 20, 30), at least for the evening primrose, themechanistic explanation can be extended to uniparental trans-mission. Because approximately 20% of all angiosperms containptDNA in the sperm cell, it is likely that this mechanism ispresent in other systems (3, 5, 42). However, it should be em-phasized that uniparental inheritance can be achieved by multi-ple mechanisms (2), and nuclear loci controlling the mode oforganelle inheritance still need to be identified.
Arguably, the most surprising finding from our work is thediscovery that chloroplast competition in evening primroses isessentially a metabolic phenotype and not directly connected toptDNA replication or copy number (43). The underlying mo-lecular loci are rapidly evolving genes throughout the plantkingdom. In general, the Ycf1 and Ycf2 proteins as well as the Nterminus of AccD are highly variable in angiosperms (44–46).Interactions between them were repeatedly suggested (46, 47);
A
B
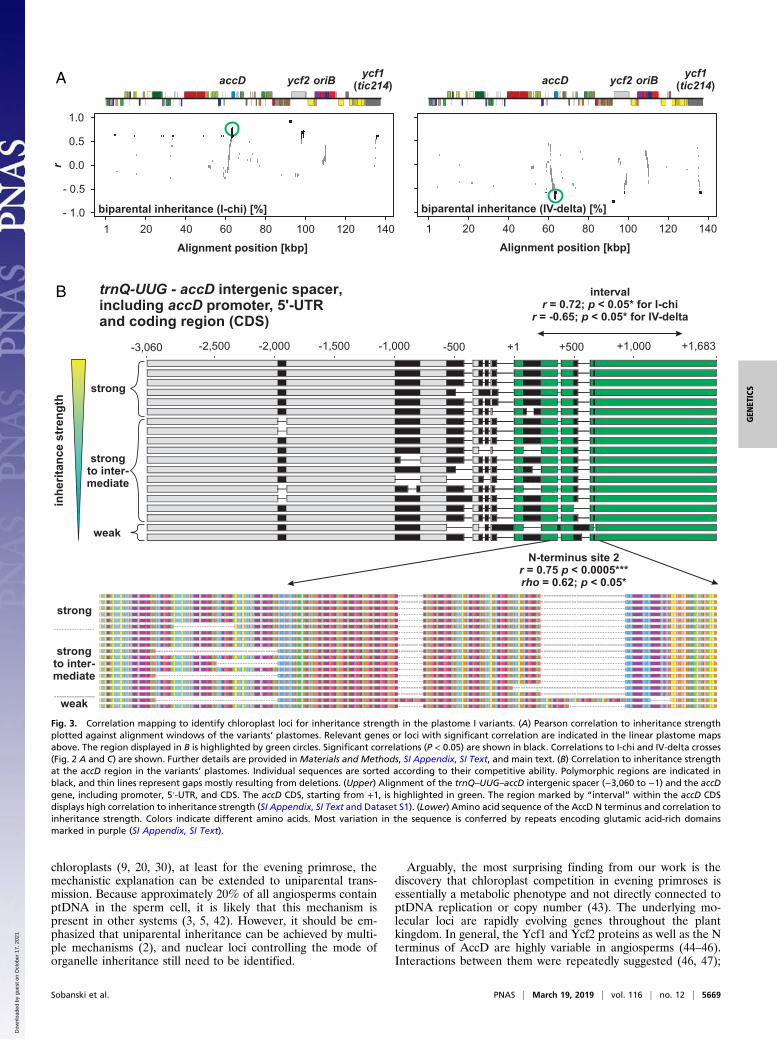
Fig. 3. Correlation mapping to identify chloroplast loci for inheritance strength in the plastome I variants. (A) Pearson correlation to inheritance strengthplotted against alignment windows of the variants’ plastomes. Relevant genes or loci with significant correlation are indicated in the linear plastome mapsabove. The region displayed in B is highlighted by green circles. Significant correlations (P < 0.05) are shown in black. Correlations to I-chi and IV-delta crosses(Fig. 2 A and C) are shown. Further details are provided in Materials and Methods, SI Appendix, SI Text, and main text. (B) Correlation to inheritance strengthat the accD region in the variants’ plastomes. Individual sequences are sorted according to their competitive ability. Polymorphic regions are indicated inblack, and thin lines represent gaps mostly resulting from deletions. (Upper) Alignment of the trnQ–UUG–accD intergenic spacer (−3,060 to −1) and the accDgene, including promoter, 5′-UTR, and CDS. The accD CDS, starting from +1, is highlighted in green. The region marked by “interval” within the accD CDSdisplays high correlation to inheritance strength (SI Appendix, SI Text and Dataset S1). (Lower) Amino acid sequence of the AccD N terminus and correlation toinheritance strength. Colors indicate different amino acids. Most variation in the sequence is conferred by repeats encoding glutamic acid-rich domainsmarked in purple (SI Appendix, SI Text).
Sobanski et al. PNAS | March 19, 2019 | vol. 116 | no. 12 | 5669
GEN
ETICS
Dow
nloa
ded
by g
uest
on
Oct
ober
17,
202
1

e.g., the loss of ycf1, ycf2, and accD genes from the plastome ofgrasses (48), as well as their common retention in many plas-tomes of nonphotosynthetic parasites (49), provides room forspeculation about functional interaction (46). In addition, Silene,a genus in which biparental chloroplast transmission is described(50), exhibits accelerated evolution of accD (51). In contrast,Campanulastrum, again displaying biparental chloroplast in-heritance (9), has lost accD from the chloroplast genome, and itsycf2 is under accelerated evolution (52). In pea, which usuallyshows uniparental chloroplast inheritance, one strain with bi-parental chloroplast inheritance exists, and biparental transmissionis accompanied by chloroplast/nuclear genome incompatibility inthe resulting hybrid (53), with repeats in accD implicated as beingresponsible (54). Analysis of a very similar chloroplast/nucleargenome incompatibility in Oenothera also identifies repeats inaccD as causative (55). Hence, correlation of the highly divergentaccD gene (and/or ycf2) with the presence or absence of bi-parental inheritance and/or chloroplast incompatibility is certainly
worth investigating on a broader phylogenetic scale. Connectedwith that, the accD plastome variants represent a superb materialto study ACCase regulation and those of its nuclear counterparts.Interaction effects in different nuclear genomic background shouldbe observable.In the plastome of the evening primrose, the loci involved in
chloroplast competition are very sensitive to replication slippageas a result of the presence of highly repetitive sequences, andthat process appears to be the major mechanism of spontaneouschloroplast mutation (31, 44) (SI Appendix, SI Text). This resultis somewhat reminiscent of recent findings in Drosophila inwhich sequence variation in the noncoding regulatory region ofthe mitochondrial genome, containing the origins of replication,was associated with different competitive abilities. Similar toOenothera, these sequences are highly repetitive and hyper-variable and contribute to cytoplasmic drive. In Drosophila, theyare among the most divergent ones in Metazoa, pointing to theirpositive selection (19) (SI Appendix, SI Text).
A
C
B
Fig. 4. ACCase activity and prediction of inheritance strengths based on lipid level. (A) ACCase activity of chloroplasts with difference inheritance strengthssorted according to competitive abilities (percentage biparental inheritance I-chi; cf. Fig. 2); accD OE, accD overexpressor; AccD N-ter, AccD N terminus (SIAppendix, SI Text). Compared with I-johSt, −, not affected; +, mildly affected; ++, intermediately affected; +++, strongly affected; n/d, not determined (cf. SIAppendix, Figs. S1–S5 and S14). Note the influence of mutations in ycf2 on AccD activity in a nonmutated accD background (yellow box), the striking co-occurrence of mutations in the AccD N terminus with ACCase activity (blue boxes), and co-occurrence of large mutations/polymorphisms in site 3 of Ycf2 withinheritance strengths (green box). Significance of difference compared with I-johSt was calculated by using a paired two-tailed t test (***P < 0.0005, **P <0.005, and *P < 0.05). (B) Histogram of Pearson correlation coefficient cvR between actual and predicted inheritance strengths obtained from 100 cross-validation runs. Note the shift toward 1.0, pointing to the predictive power of lipid data in the LASSO regression model. (C) Average linear LASSO modelcoefficients of the 102 lipids/molecules available for analysis (cf. SI Appendix, Table S4). The 20 identified predictive lipids are marked in color. PCs, thedominant phospholipids of the chloroplast outer envelope, are indicated in red. In general, large absolute values show predictive power negatively orpositively correlating with inheritance strength. Predictive lipids were designated when their absolute average weight was greater than 1 SD of all weightvalues obtained for the 102 lipids. For better presentability, lipids/molecules with an absolute average weight ∼0.00 were removed from the figure.
5670 | www.pnas.org/cgi/doi/10.1073/pnas.1811661116 Sobanski et al.
Dow
nloa
ded
by g
uest
on
Oct
ober
17,
202
1

Our analyses show that, as a result of their high mutationrates, cytoplasmic drive loci can evolve and become fixed in apopulation very quickly: in Oenothera, the current view on theevolutionary history of the plastome is IV → II → I/III (56), withan estimated divergence time of ∼830,000 y (44). This is largelybased on chloroplast/nuclear incompatibility and can explain whyplastomes IV and II (although compatible with the nuclear ge-nomes of many Oenothera species) were outcompeted by thenewly evolved aggressive plastomes I and III in many species.Interestingly, the extant plastomes I and III do not form a phy-logenetic clade. The recently evolved strong plastome I clusterswith the intermediately strong plastome II, with recently evolvedplastome III as outgroup (SI Appendix, Fig. S1B). The di-vergence time of II and III, however, is only approximately420,000 y (44). Hence, evolution and fixation of an aggressivecytoplasm happened twice independently within a very shorttime frame.
Materials and MethodsPlant Material. Throughout this work, the terms “Oenothera” or “eveningprimrose” refer to subsection Oenothera (genus Oenothera section Oenothera)(56). Plant material used here is derived from the Oenothera germ-plasm collection harbored at the Max Planck Institute of Molecular PlantPhysiology (Potsdam-Golm, Germany) (57). Part of this collection is the so-called Renner Assortment, a collection of lines thoroughly characterized bythe genetic school of Otto Renner (22, 58). Therefore, the original materialof Schötz (21, 26), which determined the classes of chloroplast replicationspeeds, was available for correlation mapping (as detailed later). For allother genetic or physiological work presented here, the nuclear geneticbackground of Oenothera elata subsp. hookeri strain johansen Standard (59)was used. The employed chloroplast (genomes) are native or were intro-gressed into that race by author S.G. or Wilfried Stubbe. The WT chloroplastgenomes (I-johSt, I-hookdV, II-suavG, and IV-atroSt) are compatible with,and hence green when combined with, the johansen Standard nucleus. Thechloroplast genome III-lamS confers a reversible bleaching, so-called vires-cent, phenotype in this genetic background (56, 60) (SI Appendix, Fig. S15).The white chloroplast mutants I-chi and IV-delta (SI Appendix, Fig. S15) arepart of the huge collection of spontaneous plastome mutants compiled byStubbe and coworkers (31, 61, 62). Both mutants harbor a similar single locusmutation in the psaA gene (encoding a core subunit of photosystem I) andderive from the strong and weak WT plastomes I-hookdV and IV-atroSt,respectively (31). SI Appendix, Tables S6–S11 provide a summary of allstrains and origins of the chloroplast genomes, including the pm-inducedvariants that are subsequently described.
Plastome Mutator Mutagenesis. The pm line is a descendant of the originalisolate E-15–7 of Melvin D. Epp. The nuclear pm allele was identified after anethyl methanesulfonate mutagenesis (63) in johansen Standard. Whenhomozygous, the pm causes a 200–1,000× higher rate of chloroplast mu-tants compared with the spontaneous frequency. The underlying muta-tions mostly represent indels resulting from replication slippage events(32, 63–66).
Johansen Standard plants newly restored to homozygosity for the nuclearpm allele (pm/pm) were employed to mutagenize the chloroplast genome (I-johSt) as described previously (35). Homozygous pm plants were identifiedwhen new mutant chlorotic sectors were observed on them. On those plants,flowers on green shoots were backcrossed to the WT PM allele as pollendonor. In the resulting pm/PM populations, the chloroplast mutations werestabilized. This led (after repeated backcrosses with the PM allele and se-lection with appropriate markers against the paternal chloroplast) tohomoplasmic green variants derived from the strong plastome I-johSt. Thevariants differ by certain indels or combination of indels, and the materialwas designated V1a, V1b, V2a, etc., where “V” stands for variant, the Arabicnumber for the number of the backcrossed plant in the experiment, and thesmall Latin letter for the shoot of a given plant. An additional line, namedVC1, was derived from a similar pm mutagenesis of I-johSt, but the muta-genesis was conducted over several generations. Therefore, VC1, which isalso a green variant, carries a much larger number of background mutationsthan do variants V1a, V1b, V2a, etc. (SI Appendix, Table S10). The two var-iant chloroplast genomes III-V1 and III-V2 (SI Appendix, Table S11) have aderivation similar to VC1. They are derived from the strong WT chloroplastgenome III-lamS, which displays a reversible bleaching (virescent phenotype)in the johansen Standard nuclear genetic background. To mutagenize this
chloroplast genome, it was introgressed into the pm/pm background ofjohansen Standard by Wilfried Stubbe and self-pollinated for a number ofgenerations. When stabilized with the PM allele, it still displayed a virescentphenotype that is comparable to the original WT plastome III-lamS (SI Ap-pendix, Fig. S15). Both lines quite likely go back to the same ancestral pm/pm-johansen Standard III-lamS plant, i.e., experienced a common muta-genesis before separating, although the number of (independent) muta-genizing generations is unclear.
Determination of Plastid Inheritance Strength. In the evening primroses, bi-parental transmission of plastids shows maternal dominance, i.e., F1 plantsare homoplasmic for the maternal chloroplast or heteroplasmic for the pa-ternal and maternal chloroplasts. If, in such crosses, one of the chloroplasts ismarked by a mutation, resulting in a white phenotype, the proportion ofvariegated (green/white; i.e., heteroplasmic) seedlings can be used to de-termine chloroplast inheritance strength (as percentage of biparental in-heritance). Moreover, if, in such crosses, one of the crossing partners is keptconstant, the inheritance strength of all tested chloroplasts with respect tothe constant one can be determined (20, 21, 26, 30). For example, in the I-chicrosses (in which the strong white plastid is donated by the father, as de-tailed later), more variegated seedlings are found in the F1, indicating thatmore paternal (white) chloroplasts were able to outcompete the dominatingmaternal green chloroplasts. Hence, in this crossing direction, small bi-parental percentage values indicate strong (i.e., assertive) plastomes fromthe maternal parent and high biparental values indicate weak variantscontributed by the maternal parent. The situation is reversed in the re-ciprocal cross in which the white chloroplast is donated by the mother, as isthe case in the IV-delta crosses. Here, the weak white chloroplast is maternal,and strong green variants contributed by the pollen give high fractions ofvariegated plants in the F1, whereas low percentages of biparental progenyresult when weak green variants are carried by the pollen donor.
Crossing Studies. All crossing studies between chloroplast genomes wereperformed in the constant nuclear background of the highly homozygousjohansen Standard strain (as described earlier). Germination efficiency in allpopulations was 100% (SI Appendix, Supplementary Materials and Meth-ods). Transmission efficiencies of the green plastome I variants (V1a, V1b,V2a, etc.) were determined by using the white chloroplast I-chi (strong in-heritance strength) and IV-delta (weak inheritance strength) as crossingpartners, respectively. This allows the determination of the inheritancestrength of a given green chloroplast relative to a white one based onquantification of the biparental (variegated) progeny among the F1, asprogeny that inherit chloroplasts from only the paternal parent are virtuallynonexistent (SI Appendix, SI Text). The fraction of variegated (green/white)seedlings was assessed in the I-chi crosses in which the white mutant wascontributed by the paternal parent. Similarly, variegated (white/green)seedlings were quantified in the IV-delta crosses in which the white mutantwas donated by the maternal parent (21, 26, 30) (as described earlier). In theI-chi crosses, the green plastome I variants, as well as the WT chloroplastgenomes I-johSt (strong inheritance strength; native in the genetic back-ground of johansen Standard and the original WT chloroplast genome usedfor mutagenesis), II-suavG (intermediate inheritance strength), and IV-atroSt(weak inheritance strength) were crossed as female parent to I-chi in threefollowing seasons (2013, 2014, and 2015). In the IV-delta crosses, greenvariants and I-johSt were crossed as male parent to IV-delta, again in threeindependent seasons, 2013, 2014, and 2015. From each cross of each season,randomized populations of 100–300 plants were grown twice indepen-dently, followed by visual assessment of the number of variegated seedlings/plantlets 14–21 d after sowing (DAS; I-chi crosses) or 7–14 DAS (IV-deltacrosses). Based on these counts, the percentage of variegated progeny wascalculated for each individual cross. To determine statistically significantdifferences between the transmission efficiencies of the plastome I variantsand I-johSt, the numbers from all three seasons were summed for a partic-ular cross and a Fisher’s exact test was employed.
A very similar experiment was performed to determine the inheritancestrength of the two variants III-V1 and III-V2 (SI Appendix, SI Text), whichderive from the strong chloroplast genomes III-lamS. Here, in two inde-pendent seasons (2015 and 2016), the WT I-johSt was used as pollen donorto induce variegation between the maternal plastome III (giving rise to avirescent phenotype) and the green plastome I (native in the background ofjohansen Standard as described earlier).
To determine transmission efficiencies independent of white chloroplastmutants or other bleached material, the plastome I variants (including theirWT I-johSt) were crossed to the green WT plastomes IV-atroSt (weak in-heritance strength) as female parent and to I-hookdV (strong inheritance
Sobanski et al. PNAS | March 19, 2019 | vol. 116 | no. 12 | 5671
GEN
ETICS
Dow
nloa
ded
by g
uest
on
Oct
ober
17,
202
1

strength) as male parent in two independent seasons (2013 and 2014).F1 progeny was harvested at 6 DAS by pooling 60–80 randomized seedlings,and the ratios of the plastome types in the pool were analyzed via Mas-sARRAY (Agena Bioscience) as described in the following section.
MassARRAY: Multiplexed Genotyping Analysis Using iPlex Gold. SNP geno-typing to distinguish plastome I-johSt and I-hookdV/I-chi or I-johSt and IV-atroSt/IV-delta and subsequent quantification of their plastome ratios inappropriate F1swas carriedoutwith theMassARRAY system (Agena Bioscience).The systemwas used to analyze chloroplast transmission efficiencies in differentcrosses. For this, total DNA was prepared from 60–80 randomized pooledplantlets at 6 DAS. Then, 10 SNPs distinguishing the plastomes I-johSt and I-hookdV/I-chi (I/I assay) and 15 SNPs between I-johSt and IV-atroSt/IV-delta (I/IVassay) were selected. Two appropriate primers flanking the SNP and oneunextended primer (binding an adjacent sequence to the SNP) were designedby using MassARRAY Assay Design v4.0 (Agena Bioscience). Primer sequencesand SNPs and their positions in I-johSt are listed in SI Appendix, Table S12.Plastome regions were amplified in a 5-μL PCR containing PCR buffer (2 mMMgCl2, 500 μM dNTP mix, 1 U HotStartTaq; Agena Bioscience), 10 ng DNA, and10 (I/I assay) or 15 (I/IV assay) PCR primer pairs, respectively, at concentrationsranging from 0.5 to 2.0 μM. The reaction mix was incubated for 2 min at 95 °Cin 96-well plates, followed by 45 cycles of 30 s at 95 °C, 30 s at 56 °C, and 60 s at72 °C, and a final elongation for 5 min at 72 °C. Excess nucleotides were re-moved by adding 0.5 U shrimp alkaline phosphatase (SAP) enzyme and SAPbuffer (Agena Bioscience), followed by an incubation for 40 min at 37 °C and5 min at 85 °C. For the primer extension reaction, the iPLEX reaction mixture(containing Buffer Plus, Thermo Sequenase, and termination mix 96; AgenaBioscience) and, depending on the primer, the extension primers at a concen-tration of 7–28 μM were added. Sequence-specific hybridization and sequence-dependent termination were carried out for 30 s at 94 °C, followed by 40 cyclesof 5 s at 94 °C plus five internal cycles of 5 s at 52 °C and 5 s at 80 °C, and finally3 min at 72 °C. After desalting with CLEAN resin (Agena Bioscience), the sam-ples were spotted on 96-pad silicon chips preloaded with proprietary matrix(SpectroCHIP; Agena Bioscience) by using the Nanodispenser RS1000 (AgenaBioscience). Subsequently, data were acquired with a MALDI-TOF mass spec-trometer MassARRAY Analyzer 4 (Agena Bioscience) and analyzed with thesupplied software. To identify significant differences in the frequencies of pa-ternal ptDNA, Kruskal–Wallis one-way ANOVA on ranks was performed.
k-Means Clustering to Classify Inheritance Strength. For the WT chloroplasts,inheritance strength was classified by using the biparental transmissionfrequencies (percentage of variegated plants in F1, as detailed earlier) of thechloroplasts “biennis white” and “blandina white” according to Schötz (26)(SI Appendix, SI Text). Both crossing series included the same 25 WT chlo-roplasts, 14 of which had fully sequenced genomes and were employed forcorrelation mapping (SI Appendix, Table S7 and as detailed later). Theoriginal data are provided in the study of Schötz (26) and summarized byCleland (ref. 22, p. 180) and in SI Appendix, Table S13. Based on the twotransmission frequencies, the WT plastomes were clustered by using the k-means algorithm with Euclidean distance as distance dimension. The optimalnumber of centers was calculated with the pamk function of the fpc pack-age, as implemented in R v.3.2.1 (67). Strikingly, essentially the same threeclasses (strong, intermediate, and weak) were obtained that had been pre-viously determined by Schötz (20, 22) (SI Appendix, SI Text and Fig. S16).
For the variants, we used the transmission frequencies from I-chi and IV-delta crosses obtained from this work (Fig. 2 and SI Appendix, SI Text andTable S10). As the data-driven determination of the optimal number ofclusters (k = 2, as detailed earlier) does not reflect the biological situation,upon repeated k-means runs, we chose the number of centers with the besttrade-off between lowest swapping rate of the samples between the clus-ters and the biological interpretability. This approach resulted in four classes(SI Appendix, SI Text and Fig. S16).
Correlation Mapping. For correlation mapping in WTs, 14 completely se-quenced plastomes (GenBank accession nos. EU262890.2, EU262891.2,KT881170.1, KT881171.1, KT881172.1, KT881176.1, KU521375.1, KX687910.1,KX687913.1, KX687914.1, KX687915.1, KX687916.1, KX687917.1, andKX687918.1)with known inheritance strength (20, 22, 26) (SI Appendix, Table S7) wereemployed. The eight chloroplast genomes assigned to accession numbersstarting with KU or KX were newly determined in the course of this work.Mapping of genetic determinants in the green variants was done in 18 fullysequenced mutagenized plastomes (V1a, V1b, V1c, V2a, V2b, V2g, V3a, V3b,V3c, V3d, V3e, V3f, V3g, V3h, V4b, V4c, V7a, and VC1) as well as their WTreference (I-johSt; GenBank accession no. AJ271079.4).
In both sequence sets, divergence at a given alignment window wascorrelated to the experimentally determined inheritance strengths of achloroplast genome. For the WTs, inheritance strength was measured byusing the paternal transmission frequencies (i.e., percentage of variegatedplants in the F1) of the chloroplasts biennis white or blandinawhite accordingto Schötz (26) (SI Appendix, SI Text) or k-means classes combining the twodatasets by clustering (SI Appendix, SI Text and Table S13 and as describedearlier). For the variants, we used the transmission frequencies from the I-chiand IV-delta crosses determined in this work, as well as the k-means classesthat were obtained from them (Fig. 2, SI Appendix, SI Text and Table S10,and as described earlier).
For correlation of these transmission frequencies to loci on the chloroplastgenome, the redundant inverted repeat A (IRA) was removed from all se-quences. Then, plastomes were aligned with ClustalW (68) and the align-ments were curated manually (SI Appendix, Dataset S2). Subsequently, byusing a script in R v3.2.1 (67) (SI Appendix, Dataset S3), nucleotide changes(SNPs, insertions, and deletions) relative to a chosen reference sequenceplastome [I-hookdV (KT881170.1) for WT set and I-johSt (AJ271079.4) forvariant set; SI Appendix, SI Text] were counted window-wise by two ap-proaches: (i) segmenting the reference sequence in overlapping windows byusing a sliding-window approach with a window size of 1 kb and a step sizeof 10 bp, yielding a matrix of 13,912 × 13 (WT set) and 13,668 × 18 (variants),respectively; or (ii) defining regions of interest with correspondingly chosenwindow sizes. Then, Pearson’s and Spearman’s correlation coefficients werecalculated between (i) the total count of nucleotide changes for everyplastome in the aligned sequence window compared with the reference (i.e.,total sequence divergence) and (ii) the determined inheritance strength ofthe plastomes (SI Appendix, Fig. S17 and Dataset S1). For the sliding-windowapproach, P values were adjusted for multiple testing by using Benjamini–Hochberg correction. To reduce the number of P value adjustments, adja-cent alignment windows with identical count vectors were collapsed intoone. To annotate the correlation mapping script output file, gene annota-tion of the consensus sequence (SI Appendix, Dataset S2) was converted intobed format (SI Appendix, Dataset S3) and combined with the correlationbins by using intersectBed and groupBy of the bedtools package (69). Forvisualization (Figs. 1A and 3A and SI Appendix, Figs. S1 and S10), correlationcoefficients obtained for every alignment window were plotted as a func-tion of the alignment position. Correlation values greater than the P valuethreshold (>0.05) are grayed out. Linear chloroplast genome maps were de-rived from the annotation of the consensus of both sequence sets (SI Appendix,Dataset S2) and drawn by OrganellarGenomeDRAW v1.2 (70) in a linear modeby using a user-defined configuration XML file. Alignments of selected plas-tome regions were visualized in Geneious v10.2.3 (71) and subsequently, as theoutput of OrganellarGenomeDRAW, edited in CorelDraw X8 (Corel).
ACCase Activity Assay. ACCase activity was measured in isolated chloroplastsuspensions (72, 73) diluted to 400 μg chlorophyll per milliliter (SI Appendix,Supplementary Materials and Methods). To validate equilibration to chlo-rophyll, protein concentration using a Bradford assay (Quick Start Bradford1× Dye Reagent; Bio-Rad; with BSA solutions of known concentrations asstandards) and chloroplast counts per milliliter of suspension were de-termined for the same samples. For chloroplast counting, the suspension wasfurther diluted 1:10, with 15 μL subsequently loaded on a Cellometer Dis-posable Cell Counting Chamber (Electron Microscopy Sciences) and analyzedunder a Zeiss Axioskop 2 microscope (Zeiss). For each sample, six “B squares”were counted, and chloroplast concentration was calculated as chloroplastsper milliliter = 10 × average count per B square/4 × 10−6. All three equili-bration methods gave comparable results.
ACCase activity was measured as the acetyl-CoA–dependent fixation ofH14CO3
− into acid-stable products. For each plant line (I-johSt, V1c, V3e, V2a,V2g, V3d, V3c, VC1, V3g, and IV-atroSt), three independent chloroplastisolations (i.e., three biological replicates) were analyzed in triplicate, in-cluding individual negative controls (minus acetyl-CoA) for each measure-ment. A total of 10 μL of chloroplast suspensions were incubated with 40 μLof reagent solution, with a final concentration of 100 mM Tricine KOH, pH8.2, 100 mM potassium chloride, 2 mM magnesium chloride, 1 mM ATP,0.1 mM Triton X-100, 10 mM sodium bicarbonate, 0.5 mM acetyl-CoA, and40 mM radioactively labeled sodium bicarbonate (NaH14CO3, ca. 4,000 dpm/nmol;Amersham) at room temperature for 20 min. For the negative control,acetyl-CoA in the reaction mixture was replaced by water. Reactions werestopped by adding 50 μL 2 M hydrochloric acid. The sample was transferredto a scintillation vial, and acid labile radioactivity (i.e., remaining H14CO3
−)was evaporated by heating for 20 min at 85 °C. After addition of 3 mLscintillation mixture (Rotiszint eco plus; Carl Roth), the acid-stable radioac-tivity from incorporation of H14CO3
− (14C dpm) was detected by liquid
5672 | www.pnas.org/cgi/doi/10.1073/pnas.1811661116 Sobanski et al.
Dow
nloa
ded
by g
uest
on
Oct
ober
17,
202
1

scintillation counter (LS6500; Beckman Coulter). ACCase activity is repre-sented as the 14C incorporation rate into acid-stable fraction (dpm perminute) calculated by dividing the total fixed radioactivity by 20 min. Therates in three replicated reactions were averaged, and corresponding valuesfrom negative control samples were subtracted and normalized by thenumber of chloroplasts to gain ACCase activity in individual samples. Theaverage rates were calculated for each line. To combine all measurements,relative ACCase activities were calculated for each experiment as relative tothe I-johSt line, and significant differences between each line and the WTwere identified by using a two-tailed paired t test, followed by P valueadjustment by using the Benjamini–Hochberg procedure.
Predictability of Inheritance Strength Based on Lipid-Level Data as ExplanatoryVariables. Lipidomics data from Oenothera seedlings of the strain johansenStandard, harboring chloroplast genomes with different assertiveness rates(SI Appendix, Supplementary Materials and Methods), were analyzed jointlyto test for predictability of inheritance strength based on lipid levels. Forthis, 33 probes representing 16 genotypes whose chloroplast genomesranged from inheritance strength class 1 to 5 (SI Appendix, SI Text) weremeasured in five replicates in three independent experimental series (SIAppendix, SI Text and Table S3). In this dataset, a total of 184 differentlipids/molecules could be annotated (SI Appendix, Dataset S4 and as de-scribed earlier). To normalize across experiments, the data from each serieswere log-transformed and median-centered based on genotypes with in-heritance strengths of 1, i.e., for every lipid/molecule, its median level acrossall “inheritance strengths = 1 genotypes” was determined and subtractedfrom all genotypes tested in the respective experimental series. Inheritancestrength 1 was then selected to serve as a common reference across all threeexperimental series. Subsequently, the three experimental series werecombined into a single set. Only those lipids/molecules for which level datawere available across all three datasets were considered further, leaving102 lipids/molecules for analysis (SI Appendix, Dataset S4)LASSO regression model. Inheritance strength was predicted based on themedian-centered lipid-level data by using LASSO, a regularized linear re-gression approach (74), as implemented in the “glmnet” R software package(R v3.2.1) (67). glmnet was invoked with parameter α set to 1 to perform
LASSO regression (SI Appendix, Dataset S4). The penalty parameter λ wasdetermined from the built-in cross-validation applied to training set data(i.e., all but two randomly selected genotypes) and set to the 1-SE estimatedeviation from the optimal (minimal error) value and assuming Gaussianresponse type. All other parameters were taken as their default values.Predictive lipids. As a regularized regression method, LASSO aims to use fewpredictor variables, which allows better identification of truly predictivelipids. Summarized from all 100 cross-validation runs performed, lipids/molecules were ranked by their mean linear model coefficients assigned tothem in the LASSO regression, with their absolute value indicating influencestrength and their sign indicating positive or negative correlation of theirabundance to inheritance strength.Test for enrichment of predictive lipids/molecules in lipid classes. Across all100 cross-validation runs, the importance of each of the 102 molecules wasassessed based on their average absolute weight factor (avgW) by which theyentered the 100 LASSO models. Molecules with avgW of greater than 1 SDobtained across all 102 molecules were considered important. Then, all lipids/molecules were assigned to their respective class (MGDG, DGDG, SQDG, PG,PC, PI, PE, FA, PE, TAG, CoQ, chlorophyll, and pheophytin), and every class wastested for enrichment in the lipid/molecule set considered to be important.This was done by employing a Fisher’s exact test, yielding P values and oddsratios. The P values express enrichment, and the odds ratio express the rel-ative enrichment or depletion of a particular class among the set ofimportant lipids.
ACKNOWLEDGMENTS. We thank Werner Dietrich and Wilfried Stubbe, whocompiled the comprehensive Oenothera collection that allowed us to usethe original material of the Renner school; John B. Ohlrogge for advice re-garding the ACCase activity assay; Michael Tillich for help with the MassArraysystem; Stephen I. Wright for fruitful discussion on PGLS; the Max Planck In-stitute of Molecular Plant Physiology GreenTeam for their support; the Orna-mental Plant Germplasm Centre for providing the line chicaginensis de Vries;and Liliya Yaneva-Roder for technical assistance. This research was sup-ported by the Max Planck Society (S.G., P.G., D.W., M.A.S., and R.B.). DAPIfluorescent patterns were analyzed with microscopy equipment funded byPolish National Science Centre Grant 2015/19/B/N22/01692 (to H.G.).
1. Birky CW, Jr (2001) The inheritance of genes in mitochondria and chloroplasts: Laws,mechanisms, and models. Annu Rev Genet 35:125–148.
2. Greiner S, Sobanski J, Bock R (2015) Why are most organelle genomes transmittedmaternally? BioEssays 37:80–94.
3. Hu Y, Zhang Q, Rao G, Sodmergen (2008) Occurrence of plastids in the sperm cells ofCaprifoliaceae: Biparental plastid inheritance in angiosperms is unilaterally derivedfrom maternal inheritance. Plant Cell Physiol 49:958–968.
4. Birky CW, Jr (1995) Uniparental inheritance of mitochondrial and chloroplast genes:Mechanisms and evolution. Proc Natl Acad Sci USA 92:11331–11338.
5. Zhang Q, Sodmergen (2010) Why does biparental plastid inheritance revive in an-giosperms? J Plant Res 123:201–206.
6. Bendich AJ (2013) DNA abandonment and the mechanisms of uniparental inheritanceof mitochondria and chloroplasts. Chromosome Res 21:287–296.
7. Reboud X, Zeyl C (1994) Organelle inheritance in plants. Heredity 72:132–140.8. Jansen RK, Ruhlman TA (2012) Plastid genomes of seed plants. Genomics of Chloro-
plasts and Mitochondria, Advances in Photosynthesis and Respiration, eds Bock R,Knoop V (Springer, Dordrecht, The Netherlands), Vol 35, pp 103–126.
9. Barnard-Kubow KB, McCoy MA, Galloway LF (2017) Biparental chloroplast inheritanceleads to rescue from cytonuclear incompatibility. New Phytol 213:1466–1476.
10. Grun P (1976) Cytoplasmic Genetics and Evolution (Columbia Univ Press, New York),1st Ed, p 446.
11. Hoekstra RF (1990) Evolution of uniparental inheritance of cytoplasmic DNA.Organizational Constrains of the Dynamics of Evolution, eds Smith MJ, Vida J(Manchester Univ Press, Manchester, UK), pp 269–278.
12. Cosmides LM, Tooby J (1981) Cytoplasmic inheritance and intragenomic conflict.J Theor Biol 89:83–129.
13. Eberhard WG (1980) Evolutionary consequences of intracellular organelle competi-tion. Q Rev Biol 55:231–249.
14. Hoekstra RF (2011) Nucleo-cytoplasmic conflict and the evolution of gamete di-morphism. The Evolution of Anisogamy, eds Togashi T, Cox PA (Cambridge Univ Press,Cambridge, UK), pp 111–130.
15. Rand DM, Haney RA, Fry AJ (2004) Cytonuclear coevolution: The genomics of co-operation. Trends Ecol Evol 19:645–653.
16. Barr CM, Neiman M, Taylor DR (2005) Inheritance and recombination of mitochon-drial genomes in plants, fungi and animals. New Phytol 168:39–50.
17. Greiner S (2012) Plastome mutants of higher plants. Genomics of Chloroplasts andMitochondria, Advances in Photosynthesis and Respiration, eds Bock R, Knoop V(Springer, Dordrecht, The Netherlands), Vol 35, pp 237–266.
18. De Stordeur E (1997) Nonrandom partition of mitochondria in heteroplasmic Drosophila.Heredity (Edinb) 79:615–623.
19. Ma H, O’Farrell PH (2016) Selfish drive can trump function when animal mitochondrialgenomes compete. Nat Genet 48:798–802.
20. Kirk JTO, Tilney-Bassett RAE (1978) The plastids. Their Chemistry, Structure, Growth
and Inheritance (Elsevier, Amsterdam), 2nd Ed.21. Schötz F (1954) Über Plastidenkonkurrenz bei Oenothera. Planta 43:182–240.22. Cleland RE (1972) Oenothera–Cytogenetics and Evolution (Academic, London), 1st Ed,
p 370.23. Gillham NW (1978) Organelle Heredity (Raven, New York), 1st Ed, p 602.24. Stubbe W (1964) The role of the plastome in evolution of the genus Oenothera.
Genetica 35:28–33.25. Greiner S, Rauwolf U, Meurer J, Herrmann RG (2011) The role of plastids in plant
speciation. Mol Ecol 20:671–691.26. Schötz F (1968) Über die Plastidenkonkurrenz bei Oenothera II. Biol Zentralbl 87:
33–61.27. Kikuchi S, et al. (2013) Uncovering the protein translocon at the chloroplast inner
envelope membrane. Science 339:571–574.28. Bölter B, Soll J (2017) Ycf1/Tic214 is not essential for the accumulation of plastid
proteins. Mol Plant 10:219–221.29. Salie MJ, Thelen JJ (2016) Regulation and structure of the heteromeric acetyl-CoA
carboxylase. Biochim Biophys Acta 1861:1207–1213.30. Chiu W-L, Stubbe W, Sears BB (1988) Plastid inheritance in Oenothera: Organelle
genome modifies the extent of biparental plastid transmission. Curr Genet 13:
181–189.31. Massouh A, et al. (2016) Spontaneous chloroplast mutants mostly occur by replication
slippage and show a biased pattern in the plastome of Oenothera. Plant Cell 28:
911–929.32. Stoike LL, Sears BB (1998) Plastome mutator-induced alterations arise in Oenothera
chloroplast DNA through template slippage. Genetics 149:347–353.33. Sears BB, Stoike LL, Chiu WL (1996) Proliferation of direct repeats near the Oenothera
chloroplast DNA origin of replication. Mol Biol Evol 13:850–863.34. Chiu W-L, Sears BB (1992) Electron microscopic localization of replication origins in
Oenothera chloroplast DNA. Mol Gen Genet 232:33–39.35. Wolfe KH (1994) Similarity between putative ATP-binding sites in land plant plastid
ORF2280 proteins and the FtsH/CDC48 family of ATPases. Curr Genet 25:379–383.36. De Las Rivas J, Lozano JJ, Ortiz AR (2002) Comparative analysis of chloroplast ge-
nomes: Functional annotation, genome-based phylogeny, and deduced evolutionary
patterns. Genome Res 12:567–583.37. Langklotz S, Baumann U, Narberhaus F (2012) Structure and function of the bacterial
AAA protease FtsH. Biochim Biophys Acta 1823:40–48.38. Kobayashi K, Wada H (2016) Role of lipids in chloroplast biogenesis. Lipids in Plant
and Algae Development, eds Nakamura Y, Li-Beisson Y (Springer, Cham, Switzerland),
pp 103–125.
Sobanski et al. PNAS | March 19, 2019 | vol. 116 | no. 12 | 5673
GEN
ETICS
Dow
nloa
ded
by g
uest
on
Oct
ober
17,
202
1

39. Block MA, Dorne AJ, Joyard J, Douce R (1983) Preparation and characterization ofmembrane fractions enriched in outer and inner envelope membranes from spinachchloroplasts. II. Biochemical characterization. J Biol Chem 258:13281–13286.
40. Botella C, Jouhet J, Block MA (2017) Importance of phosphatidylcholine on thechloroplast surface. Prog Lipid Res 65:12–23.
41. Osteryoung KW, Pyke KA (2014) Division and dynamic morphology of plastids. AnnuRev Plant Biol 65:443–472.
42. Corriveau JL, Coleman AW (1988) Rapid screening method to detect potential bi-parental inheritacne of plastid DNA and results for over 200 angiosperm species. Am JBot 75:1443–1458.
43. Nishimura Y, Stern DB (2010) Differential replication of two chloroplast genomeforms in heteroplasmic Chlamydomonas reinhardtii gametes contributes to alterna-tive inheritance patterns. Genetics 185:1167–1181.
44. Greiner S, et al. (2008) The complete nucleotide sequences of the five geneticallydistinct plastid genomes of Oenothera, subsection Oenothera: I. Sequence evaluationand plastome evolution. Nucleic Acids Res 36:2366–2378.
45. Wicke S, Schneeweiss GM, dePamphilis CW, Müller KF, Quandt D (2011) The evolutionof the plastid chromosome in land plants: Gene content, gene order, gene function.Plant Mol Biol 76:273–297.
46. de Vries J, Sousa FL, Bölter B, Soll J, Gould SB (2015) YCF1: A green TIC? Plant Cell 27:1827–1833.
47. Bölter B, Soll J (2016) Once upon a time–Chloroplast protein import research frominfancy to future challenges. Mol Plant 9:798–812.
48. Jansen RK, et al. (2007) Analysis of 81 genes from 64 plastid genomes resolves rela-tionships in angiosperms and identifies genome-scale evolutionary patterns. Proc NatlAcad Sci USA 104:19369–19374.
49. Wicke S, Naumann J (2018) Molecular evolution of plastid genomes in parasiticflowering plants. Advances in Botanical Research, eds Chaw S-M, Jansen RK (Aca-demic, New York), Vol 85, pp 315–347.
50. Newton WCF (1931) Genetical experiments with Silene otities and related species.J Genet 24:109–120.
51. Rockenbach K, et al. (2016) Positive selection in rapidly evolving plastid-nuclear en-zyme complexes. Genetics 204:1507–1522.
52. Barnard-Kubow KB, Sloan DB, Galloway LF (2014) Correlation between sequencedivergence and polymorphism reveals similar evolutionary mechanisms acting acrossmultiple timescales in a rapidly evolving plastid genome. BMC Evol Biol 14:268.
53. Bogdanova VS, Galieva ER, Kosterin OE (2009) Genetic analysis of nuclear-cytoplasmicincompatibility in pea associated with cytoplasm of an accession of wild subspeciesPisum sativum subsp. elatius (Bieb.) Schmahl. Theor Appl Genet 118:801–809.
54. Bogdanova VS, et al. (2015) Nuclear-cytoplasmic conflict in pea (Pisum sativum L.) isassociated with nuclear and plastidic candidate genes encoding acetyl-CoA carbox-ylase subunits. PLoS One 10:e0119835.
55. Ulbricht-Jones ES (2017) The virescent and narrow leaf phenotype of a plastome-genome-incompatible Oenothera hybrid is associated with the plastid gene accDand fatty acid synthesis. PhD thesis (Univ Potsdam, Potsdam, Germany).
56. Dietrich W, Wagner WL, Raven PH (1997) Systematics of Oenothera SectionOenothera Subsection Oenothera (Onagraceae) (American Society of Plant Taxono-mists, Laramie, WY), 1st Ed, p 234.
57. Greiner S, Köhl K (2014) Growing evening primroses (Oenothera). Front Plant Sci 5:38.58. Harte C (1994) Oenothera–Contributions of a Plant to Biology (Springer, Berlin), 1st Ed.
59. Cleland RE (1935) Cyto-taxonomic studies on certain Oenotheras from California. ProcAm Philos Soc 75:339–429.
60. Stubbe W (1989) Oenothera–An ideal system for studying the interaction of genomeand plastome. Plant Mol Biol Rep 7:245–257.
61. Kutzelnigg H, Stubbe W (1974) Investigation on plastome mutants in Oenothera: 1.General considerations. Subcell Biochem 3:73–89.
62. Stubbe W, Herrmann RG (1982) Selection and maintenance of plastome mutants andinterspecific genome/plastome hybrids from Oenothera. Methods in ChloroplastMolecular Biology, eds Edelman M, Hallick RB, Chua N-H (Elsevier, Amsterdam), pp149–165.
63. Epp MD (1973) Nuclear gene-induced plastome mutations in Oenothera hookeri: I.Genetic analysis. Genetics 75:465–483.
64. Chang T-L, et al. (1996) Characterization of primary lesions caused by the plastomemutator of Oenothera. Curr Genet 30:522–530.
65. Chiu W-L, et al. (1990) Oenothera chloroplast DNA polymorphisms associated withplastome mutator activity. Mol Gen Genet 221:59–64.
66. Sears BB, Sokalski MB (1991) The Oenothera plastome mutator: Effect of UV irradi-ation and nitroso-methyl urea on mutation frequencies.Mol Gen Genet 229:245–252.
67. R Core Team (2015) R: A Language and Environment for Statistical Computing.Version 3.2.1 (R Foundation for Statistical Computing, Vienna).
68. Thompson JD, Higgins DG, Gibson TJ (1994) CLUSTAL W: Improving the sensitivity ofprogressive multiple sequence alignment through sequence weighting, position-specific gap penalties and weight matrix choice. Nucleic Acids Res 22:4673–4680.
69. Quinlan AR, Hall IM (2010) BEDTools: A flexible suite of utilities for comparing ge-nomic features. Bioinformatics 26:841–842.
70. Lohse M, Drechsel O, Kahlau S, Bock R (2013) OrganellarGenomeDRAW–A suite oftools for generating physical maps of plastid and mitochondrial genomes and visu-alizing expression data sets. Nucleic Acids Res 41:W575–W581.
71. Kearse M, et al. (2012) Geneious Basic: An integrated and extendable desktop soft-ware platform for the organization and analysis of sequence data. Bioinformatics 28:1647–1649.
72. Hunter SC, Ohlrogge JB (1998) Regulation of spinach chloroplast acetyl-CoA carbox-ylase. Arch Biochem Biophys 359:170–178.
73. Thelen JJ, Ohlrogge JB (2002) The multisubunit acetyl-CoA carboxylase is stronglyassociated with the chloroplast envelope through non-ionic interactions to the car-boxyltransferase subunits. Arch Biochem Biophys 400:245–257.
74. Tibshirani R (1996) Regression shrinkage and selection via the Lasso. J R Stat Soc B 58:267–288.
75. Hirata N, Yonekura D, Yanagisawa S, Iba K (2004) Possible involvement of the 5′-flanking region and the 5’UTR of plastid accD gene in NEP-dependent transcription.Plant Cell Physiol 45:176–186.
76. Hajdukiewicz PT, Allison LA, Maliga P (1997) The two RNA polymerases encoded bythe nuclear and the plastid compartments transcribe distinct groups of genes in to-bacco plastids. EMBO J 16:4041–4048.
77. Swiatecka-Hagenbruch M, Liere K, Börner T (2007) High diversity of plastidial pro-moters in Arabidopsis thaliana. Mol Genet Genomics 277:725–734.
78. Kozaki A, Mayumi K, Sasaki Y (2001) Thiol-disulfide exchange between nuclear-encoded and chloroplast-encoded subunits of pea acetyl-CoA carboxylase. J Biol Chem276:39919–39925.
5674 | www.pnas.org/cgi/doi/10.1073/pnas.1811661116 Sobanski et al.
Dow
nloa
ded
by g
uest
on
Oct
ober
17,
202
1