chloroplast dna evolves slowly in the palm family arecaceae)
TRANSCRIPT

Chloroplast DNA Evolves Slowly in the Palm Family ( Arecaceae)'
Mark A. Wilson, Brandon Gaut, and Michael T. Clegg Department of Botany and Plant Sciences, University of California, Riverside
A survey of cpDNA restriction-site variation for 22 species representing five of the six subfamilies of the palm family was conducted. Phylogenetic reconstructions based on the restriction-site data are in general agreement with conventional analyses based on morphological characters. Base-substitution estimates, derived from the restriction-site data, indicate a potential 5-l 3-fold decrease in substitution rates within the palms relative to rate estimates for annual plant taxa. Approximately 1,000 bp of the rbcL gene (ribulose-1,5-bisphosphate carboxylase, large subunit) were sequenced from species representing two subfamilies of the palms. The com- plete DNA sequence data are in accord with the restriction-site data and indicate a total rate of nucleotide substitution that is about eightfold lower than that observed for annual plants.
Introduction
The Arecaceae, a family of -200 genera and -2,700 species, is one of the best represented angiosperm families in the fossil record. Leaf and stem fossils appear as early as 80-85 Myr ago (Mya), and pollen microfossils are found beginning -65 Mya (Daghlian 198 1; Muller 198 1). The palms also are the most morphologically diverse of the monocot families-and, perhaps, of all angiosperms (Moore and Uhl 1982). A wide range of morphological and anatomical features have been used in systematic studies of the Arecaceae. These features have included overall size; growth habit; anatomy and morphology of leaves, stems, and reproductive structures; and chromosome numbers. The evolutionary and phylogenetic implications of these and other characters have been reviewed elsewhere (Moore 1973; Moore and Uhl 1982; Uhl and Dransfield 1987). With such a long evolutionary history and the great mor- phological diversity of the group, it is not surprising that it has been difficult to develop a phylogenetic classification of the palms. There have been numerous classification schemes proposed, beginning with the works of von Martius ( 1849-53) and Drude ( 1889). The most current classification includes 200 genera in six subfamilies-the Coryphoideae, Calamoideae, Nypoideae, Ceroxyloideae, Arecoideae, and Phytele- phantoideae (Uhl and Dransfield 1987). The phylogenetic placement of two other distinctive groups, the phoenicoid and caryotoid palms, has been controversial. Uhl and Dransfield include them within the Coryphoideae and Arecoideae, respectively.
Owing to a slow rate of nucleotide substitution, chloroplast DNA (cpDNA) re- striction-site variation has been shown to be well suited for studies of genetic rela- tionships at or below the family level. The chloroplast genome of most angiosperms consists of a large and a small region of single-copy DNA separated by a pair of
1. Key words: chloroplast DNA, rate of nucleotide substitution, palm family, ribulose- 1,5-bisphosphate carboxylase.
of Botany and Plant Sciences, Address for correspondence and reprints: Michael T. Clegg, Department University of California, Riverside, Riverside, California 9252 1.
Mol. Biol. Evol. 7(4):303-314. 1990. 0 1990 by The University of Chicago. All rights reserved. 0737-4030/90/0704-0002$02.00
303

304 Wilson et al.
identical but inverted repeat sequences. Chloroplast genome size ranges from - 120 kb to 2 10 kb, with most being - 150 kb in size. In contrast to the case for nuclear and plant mitochondrial genomes, chloroplast gene sequence rearrangements are quite rare (Palmer 1987 ) . Therefore, restriction-pattern differences between taxa may be interpreted as site changes caused by single base substitutions or as single insertion- deletion events (referred to as “indels”). By relating variation in cpDNA restriction- fragment patterns to specific mutations, either base substitutions or indels, data sets suitable for phylogenetic reconstructions using parsimony analysis may be produced (i.e., see Palmer and Zamir 1982; Sytsma and Gottlieb 1986; Jansen and Pal- mer 1988).
Restriction-site variation also may be used to estimate total sequence divergence between taxa (i.e., see Palmer and Zamir 1982; Clegg et al. 1984; Sytsma and Gottlieb 1986). Such distance measures may be used to reconstruct phylogenies (i.e., see Sytsma and Gottlieb 1986) or to estimate base-substitution rates by using divergence times inferred from the fossil record. Comparison of these rates may determine whether base-substitution rates are similar (clocklike) or variable across taxa.
We surveyed cpDNA restriction-fragment-length polymorphisms ( RFLPs) among 22 palm species representing five of the six subfamilies. In the present paper, we present the evolutionary pattern derived, for the Arecaceae, from these data. Fur- thermore, we obtained an estimate of the rate of cpDNA nucleotide substitution based on site changes. Finally, we compared rates of evolution as estimated from restriction- site data with estimates from direct DNA sequence comparisons. Our results show a greatly reduced rate of nucleotide substitution in the palm family relative to that in annual plant taxa.
Material and Methods Tissue Sources and Nucleic Acid Isolation
Fresh leaf tissue, from either newly expanding or young mature leaves, was col- lected from 26 individuals representing 22 species. Five specimens of Phoenix dac- tyZzj.ka-one each of the varieties Amir Hajj, Bentamooda, Hilali, Khadrawy, and Medjool-were assayed as a control to compare within- and between-species variation. Materials were obtained from the University of California, Riverside campus; the San Diego Zoo; the Huntington Botanical Gardens; the USDA Station at Brawley, Calif.; and the Fairchild Tropical Gardens in Miami (see Appendix).
Nucleic Acid Isolation and Restriction-Endonuclease Digestion
Total DNA was extracted using either the method of Wagner et al. ( 1987) or a modification (Doyle and Doyle 1987) of the method of Saghai-Maroof et al. ( 1984). The modifications of the Saghai-Maroof et al. method were as follows: One gram of fresh leaf material was ground to a slurry in 8 ml of 2 X extraction buffer [ 100 mM Tris-( hydroxymethyl)amino-methane-HCl pH 8.0, 1.4 M NaCl, 20 mM EDTA (eth- ylenediaminetetraacetic acid), 2% hexadecyltrimethylammonium bromide, 0.2% 2- mercaptoethanol] at 60°C in a mortar which had also been heated to 60°C. Ground glass was added to aid grinding. The slurry was transferred to a centrifuge tube and incubated at 60°C for 15-30 min. After incubation, the slurry was extracted with 1 vol of chloroform and centrifuged at 6,000 g to remove debris. The supematant was removed to a clean tube, and nucleic acids were collected by precipitation with a two- thirds volume of cold isopropanol. This method yielded 50- 100 pg of total DNA per gram fresh weight of leaf tissue. The method of Wagner et al. yielded roughly the same amount of DNA, of slightly higher average molecular weight.

cpDNA Evolution in Palms 305
Approximately l-2 pg of total DNA from each individual was digested with each of five restriction enzymes (BarnHI, CZaI, EcoRI, HindIII, and HpaI). The di- gested DNAs were size fractionated by electrophoresis on 1% agarose gels in Tris- Acetate pH 8.3 (40 mM Tris Base, 20 mM sodium acetate, 2 mM EDTA) at 25 V until a bromophenol blue marker dye had migrated - 10 cm. The size-fractionated DNAs were transferred to GeneScreen@ membrane (New England Nuclear) by alkali transfer. Hybridizations were performed at 42”C, washes were performed at 60°C and membranes were stripped for rehybridizations according to method I of the GeneScreen procedures. Eight overlapping cloned fragments of cpDNA were individ- ually hybridized to the palm total DNA blots. Seven of the cloned fragments were derived from pearl millet, Pennisetum americanum (Thomas et al. 1984), and one was derived from barley, Hordeum vulgare (Zurawski et al. 1984). Positions of these clones on the barley cpDNA molecule are shown in figure 1. Probes were labeled by the random priming technique of Feinberg and Vogelstein ( 1984), except that alpha- 32PdATP was used in the reaction instead of alpha-32PdCTP. Kodak XAR film was exposed to the hybridized filters l-5 d with DuPont Cronex Hi Plus intensifying screens at -70°C. Autoradiographs were developed with a Kodak X-Omat M20 pro- cessor.
The nature of RFLPs was determined by physical mapping of variable fragments. These polymorphisms were the result either of loss or gain of restriction sites (pre- sumably base substitutions) or of insertion-deletion of DNA sequences. All mutations were coded as discrete presence-absence characters. Site-change mutations were used to estimate numbers of base substitutions per site (Nei and Li 1979). Base-substitution estimates were used as distance measures for a phylogenetic reconstruction by the Fitch and Margoliash ( 1967) method. Both analyses were performed by programs contained within the “phylogenetic inference package” (Phylip version 2.6) of J. Fel- senstein.
DNA Sequencing
Total DNA from Serenoa repens and Calamus usitatus was digested to completion with EcoRI and ligated into the phage vector Lambda gtl0. Clones containing EcoRI fragments with the rbcL sequence were recovered following plaque hybridization with the plasmid vector pMCSp5 from Pennisetum americanum, which includes the rbcL gene (Thomas et al. 1984) .%Positive clones were plaque purified, and DNA was prepared and subcloned into pUC 118 and M 13. Sequencing reactions were carried out using
16 23Bh 66236 166
wbA atpB I-be1
El 00
1okb pMCSp6 , pMCSp4 , PMCW
I I
H-HH pMCS6 pMCs8 pMCsa
pMCS7 H pHvu H2
FIG. 1 .--Locations on pearl millet chloroplast genome of cpDNA clones used as probes. Inverted repeat regions are indicated by heavy lines.

306 Wilson et al.
the dideoxy method of Sanger et al. ( 1977 to conserved internal portions of the gene.
), with primers synthesized to correspond
Results and Discussion Restriction-Site Variation in Palm cpDNA
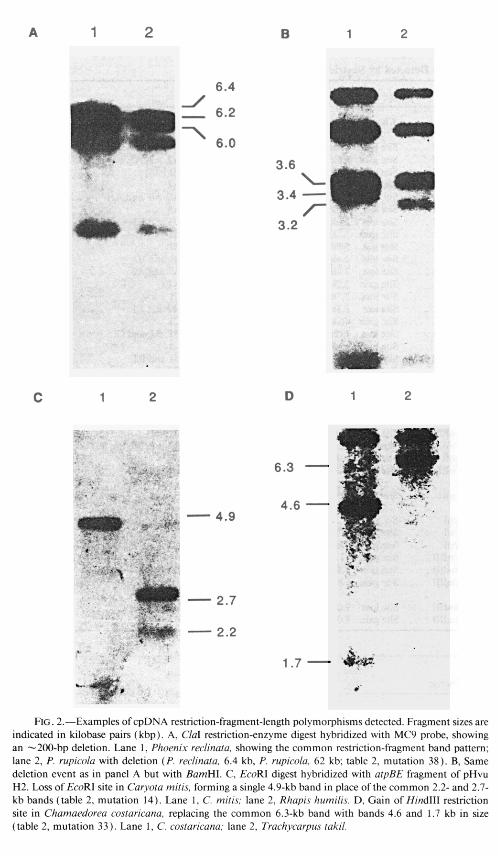
Restriction-fragment analysis using the five restriction enzymes BarnHI, CZaI, &&I, HindIII, and HpaI, in conjunction with -50 kb in overlapping cpDNA probes, allowed the identification of 78 restriction sites and seven indels in the 22 species of palms examined. Forty-two of the 78 restriction sites detected were common to all species. The remaining 36 variable sites and the seven indels are listed in table 1. Examples of cpDNA fragments produced by each type of mutation are shown in fig- ure 2.
Ten of the 36 polymorphic sites were shared by two or more genera. The two Calamus species shared seven restriction-site changes and two indels not found in any of the other taxa. The five Phoenix dactyZzj&a varieties had identical restriction patterns. The 36 variable restriction sites account for 46% of the total number of sites detected. This proportion of variability is greater than that seen in many studies of cpDNA restriction-site variation. For example, Sytsma and Gottlieb ( 1986) found that 18% of sites were polymorphic in Clarkia and Heterogaura. Other studies have reported values ranging from - 2%, for comparisons between 14 species of Triticum and Aegilops (Bowman et al. 1983)) to 9.6% between seven species of Brassica (Palmer et al. 1983 ). In contrast, Jansen and Palmer ( 1988) found that 2 11 of 2 13 restriction sites varied among 16 species of the Asteraceae.
Estimates of the number of substitutions per nucleotide, based on the proportion of shared restriction sites between each species pair, were calculated by the method of Nei and Li ( 1979). Estimates ranged from 0.000 to 0.024 substitutions per base, with an average value of 0.009. Reported base-substitution values in Brassica ranged from 0 to 0.024 (Palmer et al. 1983), in Lisianthus from 0 to 0.003 (Sytsma and Schaal 1985), in Clarkia and Heterogaura from 0.002 to 0.016 with a mean of 0.0108 ( Sytsma and Gottlieb 1986)) and, between Pennisetum and Cenchrus, from 0 to 0.0 12 (Clegg et al. 1984). The base-substitution values estimated within the palms are only slightly higher than values reported for the grass species Pennisetum and Cenchrus and are more or less equivalent to that seen in the Brassica and Clarkia-Heterogaura studies. This low level of estimated substitution is surprising, both because the pro- portion of variable restriction sites was at least twice as high as that in other reported studies and because the taxa in this study are more distantly related. The apparent discrepancy between the relatively higher proportion of variable restriction sites and the low number of estimated per-site substitutions may be explained by the fact that 18 of the 36 variable sites in the present study are restricted to only four taxa-Caryota mitis, Chamaedorea costaricana, and the two Calamus species. The remaining 18 variable restriction sites are distributed more or less equally among the other 18 taxa.
The base-substitution estimates were used as distance measures to produce the Fitch and Margoliash phylogenetic network shown in figure 3. This analysis groups taxa on the basis of their relative distance measures from one another. The length of the line separating taxa is a direct measure of the genetic distance between them. The phylogenetic analysis provides additional insight into the possible evolutionary rela- tionships among the palm subfamilies. The Coryphoideae are presumed to represent an ancestral group in the Arecaceae. An early split then gave rise to the remaining subfamilies. Fossil information suggests that the Coryphoideae, Arecoideae, Nypoideae, and Calamoideae have been distinct evolutionary lines for a.60 Myr. Although fossil

Table 1 Mutations Detected by Restriction-Endonuclease Analysis
A. Site Changes
Enzyme Change Size Probe Species
1. BamHI . . . . Site gain 4.7kb to 3.7+ 1 .O 2. BamHI . . . . Site gain 6.6kb to 5.7+0.9 3. BamHI . . . . Site gain 6.6kb to 5.0+ 1.6 4. BamHI . . . . Site gain 6.5kb to 5.3+1.2 5. BamHI . . . . Site gain 5.7kb to 5.2+0.5 6. BamHI . . . . Site loss 2.3kb+0.5 to 2.8 7. BamHI . . . . Site loss 2.5kb+O.3 to 2.8 8. ClaI . . . . . . . Site gain 5.6kb to 3.3+2.3 9. ClaI . . . . . . Site loss 5.6kb+ 1 .O to 6.6
10. ClaI . . . . . . . Site loss 2.4kb+ 1.3 to 3.2 11. CZUI.. . . . . . Site loss 7.8kb+3.2 to 11 12. ClaI. . . . . . Site gain 2.5kb to 1.9+0.6 13. ClaI. . . . . . . Site loss 2.7kb+0.6 to 3.3 14. EcoRI . . . . . Site loss 2.7kb+2.2 to 4.9 15. EcoRI . . . . . Site gain 4.8kb to 4.4+0.4 16. EcoRI . . . . . Site loss 1 .Okb+O.5 to 1.5 17. EcoRI . . . . . Site loss 1.5kb+0.5 to 2.0 18. EcoRI . . . . . Site loss 1.9kb+ 1.6 to 3.5 19. EcoRI . . . . . Site loss 2.6kb+ 1 .O to 3.6 20. EcoRI . . . . . Site loss 8.0kb+3.5 to 11.5 21. EcoRI . . . . . Site gain 1 l.Okb to 8.6+2.4 22. EcoRI . . . . . Site gain 8.6kb to 4.3+4.4 23. EcoRI . . . . . Site gain 11 .Okb to 5.6+5.6 24. EcoRI . . . . . Site gain 3.5kb to 1.7+1.7 25. EcoRI . . . . . Site loss 3.5kb+4.2 to 8.0 26. EcoRI . . . . Site gain 8.0kb to 7.0+ 1 .O 27. EcoRI . . . . . Site gain 11 .Okb to 1 O.O+ 1 .O
28. EcoRI . . . . Site gain 3.5kb to 3.0+0.5
29. HpaI . . . . . . Site gain >25kb to >23+2.0 30. HpaI . . . . . . Site loss 1 l.Okb+4.6 to 15.6 31. HpuI . . . . . . Site gain 7.8kb to 6.2+1.6 32. Hind111 . . . . Site gain 12.5kb to 5.7+6.8 33. Hind111 . . . . Site gain 6.3kb to 4.6+1.7 34. Hind111 . . . . Site gain 6.6kb to 5.4+ 1.2
35. Hind111 . . . . Site loss 9.Okb+ 1.8 to 10.8 36. Hind111 . . . . Site gain 9.Okb to 7.2+1.8
pMCSp5 PMCW pMCSp5 pMCSp5 pMCSp5 pMCS3 pMCSp6 pMCSp5 pMCSp5 PMCW pMCSp4,5 pMCSp6 pMCSp4 pHvu H2 pMCSp5 pMCSp5 pMCSp5 pMCS3 pMCSp5 pMCSp4 pMCSp4 PMCSp4,6 PMCW pMCSp4 pMCSp4 pMCSp4 pMCS3 and
PMCW pMCS3 and
pMCSp4 pMCSp5 pMCSp5 pMCSp4,5 pMCSp5 pMCSp5 pMCS3 and
pMCSp4 pMCSp4 pMCSp4
Bl and B2 A2, A3, A5, A6, A7, A8, A9, and Al0 El Al A8, A9, and Al0 A8 Cl and E7 E2 El Bl and B2 A2 and A3 AI0 El D2 and El Cl Bl, B2, and Cl Cl Bl and B2 D2 Cl Bl and B2 Bl and B2 A8, A9, and Al0 BI, B2 D2, E2, E3, E4, E5, E6, and E7 D2 E6 and E7
E7
D2 El D2 E5 D2 A4 and D2
Bl and B2 Bl and B2
B. Addition and Deletions
Change Size (kb) Enzyme(s) Probe Species
37. Deletion . . . . 38. Deletion . . . . 39. Deletion . . . . 40. Deletion . . . . 41. Addition. . . . 42. Addition. . . . 43. Deletion . . . .
0.2 CZuI and EcoRI pMCSp6 A8 and A9 0.2 BarnHI, ClaI, and EcoRI pMCSp5 A10 0.7 CZuI, EcoRI, and Hind111 pMCSp5 Bl and B2 0.3 ClaI and EcoRI pMCSp6 Bl and B2 0.2 EcoRI pMCSp5 Dl 0.2 BumHI, EcoRI, and HpaI pMCSp5 E2 0.2 ClaI pMCSp4 E7

cpDNA Evolution in Palms 309
ARECOIDEAE
Geonoma sp.
Cocos nuciferu
Howea belmoreana Hedyscepe canterbvri
Trithrinux acanthocoma
Chamaerops humifis
Ceroxylon hexundrum
Phoenix reclinata
CORYPHOIDEAE
f \ \ 1
Nypa fruticans
/
NYPOIDEAE
CALAMOIDEAE FIG. 3.-Fitch-Margoliash phylogenetic network derived from base-substitution estimates. The length
of the line connecting any two taxa is proportional to the estimated number of base substitutions between them. The scale bar equals 1 substitution/ 1,000 bases. Average % SD over all species in this tree is 17.4.
records do not support such an early separation of the Ceroxyloideae, both the present distribution of living genera and the presence of many primitive features in these palms also suggest ancient derivation of that subfamily ( Moore 1973 ) . The same may be true of the caryotoid group. The basic pattern that is presently accepted for the evolutionary history of the palms has been an early radiation into the major groups, with subsequent specialization of a few groups, such as the Phoeiceae within the Cor- yphoideae. From a broad perspective, the phylogenetic analysis derived from the re- striction-site data is generally consistent with these interpretations of the evolution of the palm family.

310 Wilson et al.
Estimates of Nucleotide-Substitution Rates
Dividing the per-nucleotide base-substitution estimates obtained from the re- striction-site data, by time since divergence as based on fossil records, gives an estimate of nucleotide-substitution rates between taxa. The fossil data available for palms allow comparisons to be made for four of the subfamilies (table 2). Using fossil evidence of a minimum divergence time of 60 Myr between other palms and Calamus (Daghlian 198 1; Muller 198 1 ), we estimated the base-substitution rate as - 1.3 X lo-” substi- tutions/site/year. If one assumes that there was an equally early divergence for the Ceroxyloideae, the estimated rate between the ceroxyloid palm Ceroxylon and the remaining taxa is 5.2 X 10 -’ ‘. This is a 2.5-fold difference in substitution-rate estimates. An overall estimate of 6.7 X lo-” nucleotide substitutions/ site/year was determined between barley and maize cpDNAs by assuming a divergence time of 50 Mya (Zurawski et al. 1984). The estimate was based on direct sequence comparisons of the chloroplast- encoded large subunit gene for ribulose- 1,5-bisphosphate carboxylase ( 1,43 1 bp), to- gether with -800 bp of noncoding DNA 5’ to the gene. This rate is more than fivefold greater than that between the calamoid and other palms and is almost 13-fold greater than the estimated substitution rate between the ceroxyloid and other palms.
Restriction-site comparisons may not provide an accurate estimate of substitution rates, because small indels may be confounded with restriction-site changes and tend to be estimated as nucleotide substitutions. Small indels (typically 1- 10 bp in length) are a common mutational class in noncoding regions of the chloroplast genome (Zu- rawski and Clegg 1987). In addition, different regions of the molecule may evolve at different rates. For instance, it is now well established that the inverted-repeat region evolves at a reduced rate relative to other regions (Clegg et al. 1984; Doebley et al. 1987; Palmer 1987). For these reasons, rate comparisons using complete DNA se- quence data based on the same gene taken from different taxa are more desirable.
To further characterize the apparent rate differences estimated from the restriction- site data, we sequenced 985 bp of the rbcL gene from Serenoa repens (Coryphoideae) and Calamus usitatus (Calamoideae) . The sequence comparisons are shown in figure 4. Only 10 nucleotide differences (five silent mutations and five replacement mutations) were observed between the two palm species. The number of nucleotide substitutions was estimated using the 3ST model of Kimura ( 198 1 ), which yielded 0.005 1 (SE = 0.0072) replacements and the same number of silent substitutions per nucleotide site. If one assumes a divergence time of 60 Mya, the rate estimates (expressed on a per-nucleotide site-per-year basis) are each 4.2 X 10-l’. An estimate for the average
Table 2 Estimates of the Number of Substitutions per Nucleotide Site (following the method of Nei and Li 1979), per Year, Between Palm Subfamilies Represented by Fossil Records (Daghlian 1981)
Subfamily Fossil Age (Mya)
Substitution rate
Coryphoideae ..... N ypoideae ........ Arecoideae ........ Calamoideae ......
80 5.8 x 10-l’ 60 1.1 x lo-‘O 60 7.8 X lo-” 60 1.3 x lo-lo

cpDNA Evolution in Palms 311
Serenoa Calamus
Serenoa Calamus
Serenoa Calamus
0 0
MTTCCCACT __________
TCTTATTCCA -_________
AMCTTTCCA ___-____--
50 50
MGTTGAMG AGATAAGTTG MCMGTATG GTCGTCCTCT __________ __________ ___---__-- __________
100 100
150 150
200 200
ACTATTMaC CMMTTGGG ATTATCCGCA MGMCTACG GTAGAGCGGT ----__-- g- __________ ___--___-- __________ __________
Serenoa Calamus
Serenoa Calamus
Serenoa Calamus
TTATGMTGT CTACGCGGTG __-___---_ __________
GACTTGATTT TACCMGGAT GATGMMCG __________ _______-__ _-___--___
TGMCTCACA ACCATTTATG __________ --___--___
CGTTGGAGAG ACCGTTTCTT ATTTTGTGCC ________-- __-____--- __________
250 GMGCAaTTT ATAMGCGCA GGCCGAMCG GGTGAMTCA MGGACATTA 250 _-_-_-_-_-__c--_-_ __________ __________ _______--_ _-___-____
Serenoa Calamus
Serenoa Calamus
300 300
350 350
400 400
CTTGMTGCT ACTGCGGGTA CATGTGMGA __________ -____--___ ________-_
TTGCCAGAGA __________
ATTGGGAGTT CCTATCGTM __________ ____---_--
Serenoa Calamus
GGATTCACTG __________
CAMTACTAG --___--___
CTTGGCTCAT TATTGCCGCG ATMCGGCCT __________ __-------- __________
Serenoa Calamus
450 450
ACTTCTTCAC ATCCATCGCG CMTGCATGC AGTTATTGAT AGACAGMM __________ _____-____ ____--___- __________ _-________
Serenoa Calamus
500 500
ATCATGGTAT GCATTTTCGT GTACTAGCTA MGCATTACG TATGTCTGGT __-____-__ _-___--___ __________ __-_-__--_ _---__-___
Serenoa Calamus
550 GGAGATCATA TTCACGcAGG TACAGTAGTG GGT&ACTGG MGGGGMCG 550 __---__--_ _--__- a-_ Q _________- __---__--_ ----__-___
Serenoa 600 TGAGATGACT TTGGGTTTTG TTGATTTATT Calamus 600 __--___--- _--__--___ __________
Serenoa Calamus
650 MGACCGMG TCGCGGTATC TTTTTTACTC MGATTGGGT CTCTATGCCA 650 __________ __________ _________- _______-__ ---------_
Serenoa Calamus
700 700
GGTGTTATaC CCGTGGCTTC AGGGGGTATT CATGTTTGGC ATATGCCTGC _-_-_-___-_-_c_ ______-___ __________ _______--_ _-________
Serenoa Calamus
750 750
CCTGACCGM ----------
ATCTTTGGaG --------g-
ATGATTCCGT ----------
Serenoa Calamus
800 CTTTAGGACA CCCTTGGGGA 800 __________ _-____----
MTGCACCCG --------_-
Serenoa Calamus
850 GCTTTAGMG CGTGTGTACA AGCTCGTMT GAGGGACGTG ATCTTGCTCG 850 __________ __________ ____-____- ___--__--- _-________
Serenoa Calamus
900 TGMGGTMT GAMTTATCC GTGMGCTAG CAMTGGAGC CCTGMCTAG 900 _______-__ __________ ---------- _______--_ ----------
Serenoa Calamus
950 950
$GTCCGCTTG TGMGTATGG MgGaGATCA MTTC __________ _______--_ __a_c___” ___-_
AGGCCCGCCT _-_t__--__
CATGGCATCC __________
ATTGGGATGT __________
MTGATcAM ------g---
AGGGCCgTAT ------a---
TGCATGACTA CTTMCTGGG _______--- __________
ACGTGATGAT TTTATTGAM __--___--- _---__-___
ACTACAGTTT _______--_
GTGCAGTAGC __c____---
GGCGGAGGM __________
TMTCGGGTG ----______
FIG. 4.-Sequence of 985 bp of the Serenoa repens rbcL gene. Differences between Serenoa and Calamus are indicated by giving the Calamus nucleotide below the Serenoa sequence.
rate of silent substitution in rbcL between annual monocot and dicot species is 1.5 X lo-’ (Zurawski and Clegg 1987).
Direct comparisons between these estimates indicates a 36-fold reduction in the silent rate for the palm taxa. A remarkable feature of the palm data is the equal number of replacement and silent substitutions. As a consequence, there is only a fourfold reduction in the rate of replacement substitutions for the palm taxa relative to the annual dicot and monocot contrast. The total estimate of nucleotide substitution per nucleotide site, taken over all nucleotide positions, is 0.0 10 (SE = 0.0 15) for the palm contrast, which compares with a total estimate of 0.067 (SE = 0.007) for barley versus maize (Zurawski et al. 1984). Assuming both that barley and maize diverged 50 Mya and a divergence time of 60 Mya for Calamus versus Seranoa leads to an estimated sevenfold excess of nucleotide substitutions for the two grass taxa relative

3 12 Wilson et al.
to the two palms. These calculations are consistent with the estimates based on the restriction-site data given above. Ratios like those presented here have large SEs, es- pecially since relatively few mutational events were observed among the palms. Nev- ertheless, the overall picture is consistent with the restriction-site data in indicating a substantially reduced rate of cpDNA evolution in palms.
Wu and Li ( 1985 ) have proposed that the number of cell divisions prior to germ- line formation may influence rates of mitochondrial DNA (mtDNA) sequence evo- lution in vertebrates. Humans undergo twice as many cell cycles prior to formation of the germ-line tissue as do rodents, and they appear to display an mtDNA substitution rate half that of mice. The great difference in base-substitution rate estimates between palms and grasses may be an indication of an effect of generation time on cpDNA evolutionary rates. Thus the far greater time to reproduction in long-lived perennial plants, as compared with that in annuals, may play a role in generating these widely divergent estimates of base-substitution rates.
Most studies of cpDNA variation have utilized annuals or short-lived perennial plants. Preliminary investigations of cpDNA restriction-site variation in the Jugland- aceae (Smith and Doyle 1986), a family of woody dicotyledons with a relatively long fossil record (>60 Myr), have suggested a considerably slower rate of cpDNA evolution when compared with the current data from mainly annual plants. Further research
base of on long-lived, long-generation-time information from which to examine
perennials will provide a much needed variation in rates of cpDNA evolution.
Acknowledgments
We are grateful to James E. Eckenwalder for helpful discussions of the study and thank Douglas and Pamela Soltis, David Giannasi, and Liz Zimmer for their comments on the manuscript. We also thank Steve Morgan of the University of California, Riv- erside, Botanic Garden; Myron Kimnach of Huntington Botanic Gardens; and Roger Sanders of Fairchild Tropical Gardens for their assistance in plant material collec- tion. This work was supported in part by National Science Foundation grant BSR- 8500206.
APPENDIX
Species Used for Restriction-Map Comparisons, According to Subfamilial Classification
The letters in parentheses indicate the sources: a = Fairchild Tropical Gardens; b = University of California, Riverside; c = USDA station; d = San Diego Zoo; e = Huntington Gardens.
I. Coryphoideae A. Corypheae
1. Trithrinax acanthocoma Drude (a) 2. Trachycarpus fortunei Wendl. (b) 3. Trachycarpus takil Becc. (b) 4. Rhapis humilis Blume (b) 5. Serenoa repens Bartr. (b) 6. Sabal domingensis Becc. (b) 7. Chamaerops humilis L. (b)
B. Phoeniceae 8. Phoenix dactyli&a L. (b)
var. Amir Hajj (c) var. Bentamooda (c)

cpDNA Evolution in Palms 3 13
var. Hilali (c) var. Khadrawy (c) var. Medjool (c)
9. P. reclinata Jacq. (b) 10. P. rupicola T. Anders. (b)
II. Calamoideae A. Calamae
1. Calamus usitatus (d) 2. Calamus sp. (a)
III. Nypoideae 1. Nypa fruticans Wurmb. (a)
IV. Ceroxyloideae A. Ceroxylae
1. Ceroxylon hexandrum Dugand (e) B. Hyophorbeae
2. Chamaedorea costaricana Qrst. (a) V. Arecoideae
A. Caryoteae 1. Caryota mitis Lour. (a)
B. Areceae 2. Neodypsis decaryi Jumelle (e) 3. Hedyscepe canterburi Wendl. et Dr. (e) 4. Howea belmoreana Becc. (e) 5. Drymophloeus subdisticha H. E. Moore (a)
C. Cocoeae 6. Cocos nucifera L. (a)
D. Geonomeae 7. Geonoma sp. (e)
LITERATURE CITED
BOWMAN, C. M., G. BONNARD, and T. A. DYER. 1983. Chloroplast DNA variation between species of Triticum and Aegilops: location of the variation on the chloroplast genome and its relevance to the inheritance and classification of the cytoplasm. Theor. Appl. Genet. 65: 247-262.
CLEGG, M. T., J. R. Y. RAWSON, and K. THOMAS. 1984. Chloroplast DNA variation in pearl millet and related species. Genetics 106:449-46 1.
DAGHLIAN, C. P. 198 1. A review of the fossil record of Monocotyledons. Bot. Rev. 47:5 17- 555.
DOEBLEY, J. W. RENFROE, and A. BLANTON. 1987. Restriction site variation in Zea chloroplast genome. Genetics 117:139-147.
DOYLE, J. J., and J. L. DOYLE. 1987. A rapid DNA isolation procedure from small quantities of fresh leaf tissue. Phytochem. Bull. 19: 1 l-l 5.
DRUDE, 0. 1889. Palmae. Pp. l-93 in A. Engler and K. Prantl, eds. Die naturlichen Pflanzen- familien. II teil., 3 abt.
FEINBERG, A. P., and B. VOGELSTEIN. 1984. A technique for radiolabelling DNA restriction endonuclease fragments to high specific activity. Anal. Biochem. 137:266-267.
FITCH, W. M., and E. MARGOLIASH. 1967. Construction of phylogenetic trees. Science 155: 279-284.
JANSEN, R. K., and J. D. PALMER. 1988. Phylogenetic implications of chloroplast DNA restriction site variation in the Mutiseae (Asteraceae). Am J. Bot. 75:753-766.
KIMURA, M. 198 1. Estimation of evolutionary distance between homologous nucleotide se- quences. Proc. Natl. Sci. USA 78:454-458.

3 14 Wilson et al.
MOORE, H. E. Jr. 1973. The major groups of palms and their distributions. Gentes Herbarium 11:27-141.
MOORE, H. E. Jr., and N. W. UHL. 1982. Major trends of evolution in palms. Bot. Rev. 4&l- 69.
MULLER, J. 198 1. Fossil pollen records of extant angiosperms. Bot. Rev. 47: l- 142. NEI, M., and W. LI. 1979. Mathematical model for studying genetic variation in terms of
restriction endonucleases. Proc. Natl. Acad. Sci. USA 76:5269-5273. PALMER, J. D. 1987. Chloroplast DNA evolution and biosystematic uses of chloroplast DNA
variation. Am. Nat. 13O:S6-S29. PALMER, J. D., C. R. SHIELDS, D. B. COHEN, and T. J. ORTON. 1983. Chloroplast DNA evolution
and the origin of amphidipoid Brussica species. Theor. Appl. Genet. 65: 18 1- 189. PALMER, J. D., and D. ZAMIR. 1982. Chloroplast DNA evolution and phylogenetic relationships
in Lycopersicon. Proc. Natl. Acad. Sci. USA 79:5006-5010. SAGHAI-MAROOF, M. A., K. M. SOLIMAN, R. A. JORGENSEN, and R. W. ALLARD. 1984. Ri-
bosomal DNA spacer length polymorphisms in barley: Mendelian inheritance, chromosomal location, and population dynamics. Proc. Natl. Acad. Sci. USA 81:80 14-80 18.
SANGER, F., S. NICKLEN, and A. R. COULSON. 1977. DNA sequencing with chain terminating inhibitors. Proc. Natl. Acad. Sci. USA 74:5463-5467.
SMITH, J. F., and J. J. DOYLE. 1986. Chloroplast DNA variation and evolution in the Jugland- aceae. Am. J. Bot. 78:730.
SYTSMA, K. J., and L. D. GOTTLIEB. 1986. Chloroplast DNA evolution and phylogenetic re- lationships in Clarkia sect. Peripetasma (Onagraceae ) . Evolution 40: 1248- 1262.
SYSTMA, K. J., and B. A. SCHAAL. 1985. Phylogenies of the Lisianthius skinneri (Gentianaceae) species complex in Panama utilizing DNA restriction fragment analysis. Evolution 39:594- 608.
THOMAS, K. M., B. J. WOOD, C. L. BASSETT, and J. R. Y. RAWSON. 1984. A restriction en- donuclease map of the chloroplast genome of pearl millet. Cut-r. Genet. 8:291-297.
UHL, N. W., and J. DRANSRELD. 1987. Genera Palmarum. L. H. Bailey Hortorium and the International Palm Society, Ithaca, N.Y., and Allen, Lawrence, Kans.
VON MARTIUS, C. F. P. 1849-53. Historia naturalis Palmarum. Leipzig. WAGNER, D. B., G. R. FURNIER, M. A. SAGHAI-MAROOF, S. M. WILLIAMS, B. P. DANCIK, and
R. W. ALLARD. 1987. Chloroplast DNA polymorphisms in lodgepole and jack pines and their hybrids. Proc. Natl. Acad. Sci. USA 84:2097-2100.
WV, C.-I., and W.-H. LI. 1985. Evidence for higher rates of nucleotide substitution in rodents than in man. Proc. Natl. Acad. Sci. USA 82: 174 1-1745.
ZURAWSKI, G., and M. T. CLEGG. 1987. Evolution of higher-plant chloroplast DNA-encoded genes: implications for structure-function and phylogenetic studies. Annu. Rev. Plant Physiol. 38:391-418.
ZURAWSKI, G., M. T. CLEGG, and A. H. D. BROWN. 1984. The nature of nucleotide sequence divergence between barley and maize chloroplast DNA. Genetics 106:735-749.
WALTER M. FITCH, reviewing editor
Received June 27, 1989; revision received February 16, 1990
Accepted February 22, 1990