choosing the best mattress: an experiment in finding a bed
TRANSCRIPT

RTI Press
Choosing the Best Mattress An Experiment in Testing Whether Individuals Choose a Bed That Leads to Improved SleepSean O Hogan Jack D Edinger Gayle S Bieler and Andrew D Krystal
August 2011
ReseaRch RepoRt
This publication is part of the RTI Press Research Report series
RTI International 3040 Cornwallis Road PO Box 12194 Research Triangle Park NC 27709-2194 USA
Tel +19195416000 Fax +19195415985 E-mail rtipressrtiorg Web site wwwrtiorg
RTI Press publication RR-0016-1108
This PDF document was made available from wwwrtiorg as a public service of RTI International More information about RTI Press can be found at httpwwwrtiorgrtipress
RTI International is an independent nonprofit research organization dedicated to improving the human condition by turning knowledge into practice The RTI Press mission is to disseminate information about RTI research analytic tools and technical expertise to a national and international audience RTI Press publications are peer-reviewed by at least two independent substantive experts and one or more Press editors
Suggested CitationHogan S O Edinger J D Bieler G S and Krystal A D (2011) Choosing the best mattress An experiment in testing whether individuals choose a bed that leads to improved sleep (RTI Press publication No RR-0016-1108) Research Triangle Park NC RTI Press Retrieved [date] from httpwwwrtiorgrtipress
copy2011 Research Triangle Institute RTI International is a trade name of Research Triangle Institute
All rights reserved Please note that this document is copyrighted and credit must be provided to the authors and source of the document when you quote from it You must not sell the document or make a profit from reproducing it
doi103768rtipress2011rr00161108
wwwrtiorgrtipress
About the AuthorsSean O Hogan PhD is a former project director in RTI Internationalrsquos Survey Research Department He participated in the design of the study and served as its project director between 2008 and 2011
Jack D Edinger PhD is a senior psychologist at the Veterans Affairs Medical Center in Durham North Carolina
Gayle S Bieler MS is a senior statistician at RTI International Ms Bieler led design and implementation of statistical data analysis
Andrew D Krystal MD is director of the Quantitative EEG Laboratory at Duke University Medical Center and an assistant professor in Dukersquos Department of Psychiatry and Behavioral Sciences
Choosing the Best Mattress An Experiment in Testing Whether Individuals Choose a Bed That Leads to Improved SleepSean O Hogan Jack D Edinger Gayle S Bieler and Andrew D Krystal
AbstractA comfortable mattress is said to be an essential ingredient in a good nightrsquos sleep but we have little understanding of the effects of sleep surface on sleep outcomes such as daytime drowsiness or energy Most studies devoted to testing the effects of sleep surface on sleep have been hampered by methodological shortcomings these include having small numbers of subjects and evaluating a narrow array of bedding systems We hypothesized that motion and self-reported measures of sleep quality and outcomes would demonstrate that the optimal mattress would differ from person to person We hypothesized that individuals would be able to select one mattress from among several under showroom circumstances that would lead to optimal rest We find that optimal mattress firmness varies among individuals and is reflected at least to a degree by overnight motion When allowed to test mattresses in a typical showroom experience individuals choose a mattress that does not minimize overnight motion and maximize perceived sleep quality This suggests that they may not be receiving the health benefits that come from optimal rest Therefore both manufacturers and sleep scientists could improve sleep outcomes by testing ways to help consumers select a mattress
ContentsIntroduction 2
Methods 3
study Design and sample 3
statistical Methods 3
Results 6
actigraphically Determined Bed Ranking (Motion Bed Rank) 6
sleep Quality Bed Ranking 8
self-selected Versus actigraphically Determined Best Bed 9
Discussion 10
References 11
Acknowledgments Inside back cover
2 Hogan et al 2011 RTI Press
IntroductionA growing body of literature indicates the effects of sleep on health ability to function and quality of life (Alapin et al 2001 CDC 2007 Elmenhorst et al 2008 Hamilton et al 2007 Hanel Dartman amp Shishoo 1996 NIH 2003a 2003b Roberts Roberts amp Duong 2008 Van Dongen Maislin Mullington amp Dinges 2003) A comfortable mattress is commonly assumed to be an essential ingredient in a good nightrsquos sleep (Better Sleep Council 2008b) However we have little understanding of the effects of sleep surface on sleep outcomes such as daytime drowsiness or energy Moreover most studies devoted to testing the effects of sleep surface on sleep have been hampered by methodological shortcomings these include having small numbers of subjects and evaluating a narrow array of bedding systems (Lopez-Torrez Porcar Solaz amp Romero 2008)
When trying to select a comfortable mattress or one that will provide optimal sleep consumers confront the decision to choose from among several mattresses Sources of information easily accessible to laypersons (see for example reports by the Better Sleep Council 2008b and Consumer Reports 2005) essentially tell consumers to trust their own judgment In other words consumers are told to base their decision on an in-store experience of lying on sitting on and feeling the mattresses Unfortunately the scientific literature is not much more helpful to health care providers who might wish to offer guidance to the layperson choosing a mattress This literature has been silent on the extent to which individuals should evaluate a mattress or whether they are capable of selecting the mattress that leads to best outcomes such as quality of rest reduced drowsiness or increased daytime energy In addition we found that the current literature typically suffers from three shortcomings that have deprived experts and laypersons alike of this knowledge (Krystal Edinger Bieler Mladsi amp Hogan 2011) These deficiencies are that most studies of mattress effects on sleep have relied on (1) a small number of people
enrolled in the study (2) a narrow array of test mattresses1 and (3) a narrow focus on individuals suffering from a chronic sleep ailment of some sort
To help address this deficiency in knowledge we recruited a sample of 128 healthy adults (referred to as subjects participants or individuals) and asked them to sleep on an array of seven mattresses for up to 1 month each We recorded measures of overnight motion (with a sensor called an actigraph) and participants completed diary reports of sleep quality and daytime function According to the collected data individuals vary substantially in the degree of mattress firmness that reduces their morning pain and optimizes their sleep experience and subsequent daytime functioning (Krystal et al 2011) Along with validating the methods of measurement we reported that a slight increase in sleep efficiency (actigraphically measured time devoted to sleep actually spent sleeping) can lead to improved quality of sleep as reported in diary observations
In this our second report from this study we build on the foundation of our earlier paper (Krystal et al 2011) For this study we hypothesized that overnight actigraphic motion measurements (which indicate sleep and awake periods during the time devoted to sleep) and self-reported diary measures of sleep would demonstrate that an optimal mattress could be identified for an individual and that the ldquobestrdquo mattress would differ from person to person We also hypothesized that changes in measured overnight motion would coincide with other measures of sleep and daytime functioning (eg as daytime energy and drowsiness) Finally we hypothesized that individuals would be able to rely on conventional shopping procedures to select one mattress from among several under showroom circumstances that would lead to optimal rest Here we address these questions As in the last paper we relied on a randomized single-blind within-subject crossover study examining multiple levels of mattress firmness in a large sample of individuals without complaints of pain or sleep difficulty
1 In this report the terms mattress and bed are used interchangeably
Choosing the Best Mattress 3
Methods
Study Design and SampleOur previous paper explains in detail our study procedures sample selection and methods of measurement We summarize our methods here to inform readers of the basic elements of our protocol
We recruited a convenience sample of 128 healthy adults who lived in the Raleigh-Durham area of North Carolina Table 1 describes the age body mass index (BMI) gender race and partnership status of our sample members None of the subjects had a sleep-affecting disease sleep-disrupting prescription drug regimen or lifestyle that is known to interrupt sleep (eg frequent travel infants to care for overnight work shift)
(Ancoli-Israel et al 2003 Morgenthaler et al 2007) The American Academy of Sleep Medicine supports the use of actigraphic measurement to identify sleep and wake periods (Littner et al 2003) To measure pain sleep quality daytime drowsiness and other parameters participants entered reports in an electronic diary
Self-Selection of Preferred MattressBefore beginning the in-home part of the sleep study we sought to test whether the typical shopping experience would lead subjects to choose the one mattress that results in best sleep We simulated a showroom environment where all of the subjects tried each mattress To maintain the blind study protocol we arranged the seven study mattresses in random order in the simulated showroom The participants were blinded to the mattressrsquos manufacturer construction materials design and level of firmness
We asked them to act as though they were in the market to buy a mattress and to select the one they preferred As part of the selection process we encouraged each participant to ldquotest driverdquo the mattress They were encouraged to lie on feel and evaluate the mattresses Participants were allowed as much time as they wanted to make their selection (typically they took 10 to 15 minutes) and were able to make notes of their observations We conducted the mattress self-selection during participant training in a laboratory located in Research Triangle Park North Carolina
Statistical MethodsWe began the analysis by ranking the mattresses (referred to in the rest of this section as ldquobedsrdquo) at the participant level according to their average amount of overnight motion on each bed This was measured in terms of the number of minutes during which the actigraph measured motion during the night normalized to 8 hours devoted to sleep The measure of motion refers to the number of 1-minute intervals in which the actigraph measured any amount of motion during the time from sleep onset to final arousal while the subject was lying in bed We ranked the beds for each individual from best (coded 1) to worst (coded 7) where 1 indicates that Bed j (j=1hellip7) has least average actigraphic motion for
Table 1 Descriptive statistics of study sample
Variable Sample Size Mean or Percentage Distribution
Age in years 128 404 (Range 240ndash680)
BMI 128 259 (Range 179ndash450)
Gender 128 61 Female 39 Male
Raceethnicity 128 805 White133 African American55 Asian08 Native American
Partner status 128 66 slept with partner41 were members of couples in the study (26 couples in study)
BMI = body mass index
Subjects slept on each of the seven test mattresses in their own homes The mattresses were made by the same manufacturer ensuring consistency in materials and production processes so that the only difference evaluated would be firmness The inner-spring mattresses ranged in firmness to mirror the range typically found in the US marketplace Each of the subjects in this study used each mattress for approximately 1 month They were assigned to each mattress using a Latin square randomization system so that subjects were not on consecutively firmer or softer mattresses Nothing on the mattress would have indicated to the subject the level of firmness when the bed arrived at the home
To measure sleep duration and efficiency participants wore a widely accepted monitor called an actigraph
4 Hogan et al 2011 RTI Press
subject i and 7 indicates Bed j has greatest actigraphic motion for subject i We call the effect resulting from this mattress ranking the motion bed rank Based on this ranking a participantrsquos best motion bed is the mattress with the smallest average motion minutes per night (normalized to 8 hours devoted to sleep)
We used a linear regression model to estimate and compare average overnight motion within each motion bed rank category This analysis estimates the degree to which motion (reported in minutes) was reduced on the best motion bed as compared with other beds To conduct the linear regression analyses we analyzed longitudinal data from all compliant nights on all mattresses from each participant simultaneously in a general linear mixed model (Diggle Liang amp Zeger 1994 Laird amp Ware 1982 Lindsay 1993) The outcome variable was overnight motion The main independent variable of interestmdashmotion bed rankmdashwas modeled as a categorical variable for evaluating the overall motion bed rank effect and as a continuous variable for evaluating a trend effect The MIXED procedure in SAS Version 913 (SAS Institute 2006) was used to account for the correlation of mattresses and nights within participants (Brown amp Prescott 2006 Senn 2002) Statistical significance refers to p lt 005 and all p-values are two-sided
We used a similar regression modeling approach to evaluate the effect of motion bed rank on eight key diary outcomes except in these models we also adjusted for the participantrsquos age gender BMI ordinal day on bed and time spent in bed (also referred to as time devoted to sleep) The diary outcomes are as follows self-reported sleep time number of overnight awakenings minutes awake overnight sleep quality level of restedness at start of day (also referred to as well-restedness at start of day) pain upon waking (also referred to as morning pain) daytime sleepiness and daytime energy Sleep quality restedness morning pain daytime energy and daytime sleepiness are self-reports using a 7-point Likert-type scale from least (1) to greatest (7) Minutes awake were categorized and reported using an ordinal scale (1=0 minutes 2=1-15 minutes 3=16-30 minutes 4=31-45 minutes 5=45-60 minutes 6=60+ minutes) Self-reported sleep time was recorded in minutes
We evaluated the overall effect of motion bed rank and the trend across bed rank on each of the diary-reported sleep outcomes We also performed pairwise comparisons among motion bed ranks (best motion bed vs second-best bed best motion bed vs average of all others) and estimated model-adjusted means (also known as least square means) within each motion bed rank category
An example of the linear regression equation for one sleep outcome self-reported number of awakenings is as follows
Number of Awakeningsijk= β0 + (β1 x Motion Bed Rankij)
+ (β2 x Ordinal Day on Bedijk) + (β3 x Time in Bedijk) + (β4 x Agei) + (β5 x Genderi) + (β6 x BMIi) + (β7 x Study Period 1ijk) + hellip+ (β12 x Study Period 6ijk)
where β0mdash β12 are the regression coefficients to be estimated The response and independent variables are defined as follows
bull Self-reported number of overnight awakenings (response variable measured by the diary for subject i bed j night k)
bull Motion bed rank (coded 1ndash7 for subject i bed j modeled as categorical or continuous depending on whether the hypothesis is to evaluate an overall effect of motion bed rank or to evaluate trend across motion bed rank)
bull Ordinal day on bed (this measures the acclimation effect coded 1 to number of days on bed modeled as continuous for subject i bed j night k)
bull Time in bed (amount of time devoted to sleep in minutes as determined by actigraphy modeled as continuous for subject i bed j night k)
bull Age (in years at entrance into study modeled as continuous for subject i)
bull Gender (coded 1 for males 0 for females for subject i)
bull BMI (body mass index or weightheight2 modeled as continuous for subject i)
bull Study period (Latin square crossover design variable coded 1ndash7 modeled as categorical for subject i bed j)
Choosing the Best Mattress 5
Table 2 presents descriptive statistics for the response variables used in the regression analyses and describes the nature of the variables
In addition to ranking the beds by overnight motion we also ranked the beds within subject by their average self-reported sleep quality on each bed (averaged over the nights that the subject slept on the bed) Higher values of self-reported sleep quality indicate better sleep on a 7-point scale Based on this ranking a participantrsquos best sleep quality bed is the mattress with the highest average sleep quality score We carried out a similar set of regression analyses as previous replacing motion bed rank with a ranking based on self-reported sleep quality Sleep quality bed rank is modeled as continuous (one regression coefficient) for evaluating trend and modeled as categorical (six regression coefficients) for all other hypotheses
Participantsrsquo Self-Selection of ldquoBestrdquo MattressIn the final part of this analysis we turned our attention to whether the participantrsquos showroom ldquotest driverdquo provided a means of choosing a mattress that predicts best sleep for that individual More
specifically we evaluated whether the mattress that individuals had said they would choose for themselves agreed with their optimal mattress as determined by actigraphy and separately by reported sleep quality Self-reported sleep quality is based on diary reports of sleep quality during his or her in-home testing
To accomplish this we estimated the kappa measure of agreement2 (Agresti 2002) between the self-selected bed and the actigraphically determined best bed for each individual and also between the self-selected bed and self-reported best sleep quality bed for each individual We also estimated the kappa measure of agreement between the self-selected bed and the top 3 best motion beds based on the observed vs expected percentage of participants for which the self-selected bed is among the motion bed ranks of 1 2 or 3 for the participant Finally we estimated the mean and median motion bed rank associated with an individualrsquos self-selected bed
Table 2 Descriptive statistics for sleep variables
Variable (type and measure) NNumber missing Minimum Mean Maximum
Actigraph
Overnight motion in minutes per night (continuous variable normalized to 8 hours) 16366 0 0 6144 31631
Time in bed devoted to sleep (continuous variable in minutes) 16366 0 3200 44729 106900
Diary
Self-reported sleep time (continuous variable in minutes) 15941 425 0 43378 88800
Number of awakenings (continuous) 14912 1454 0 095 1200
Minutes awake overnight (categorized from 1 to 6 in 15-minute increments where 1=0 minutes and 6=60+ minutes) 15059 1307 100 178 600
Sleep quality (categorical 1=Not at all 7=Very good sleep) 16315 51 100 508 700
Well-restedness in AM (categorical 1=Not at all 7=Very well rested) 16315 51 100 487 700
Morning pain (any type) (categorical 1=None 7=Worst imaginable) 16282 84 100 156 700
Daytime sleepiness (categorical 1=Not at all 7=Very sleepy) 15116 1250a 100 283 700
Daytime energy (categorical 1=Not at all 7=Very energetic) 15116 1250a 100 486 700
a Missing values for Daytime Sleepiness and Daytime Energy indicate lack of an evening diary report on the calendar day immediately following the previous nightrsquos actigraph data
2 The kappa statistic measures the extent of agreement between two raters beyond what would be expected by chance alone
6 Hogan et al 2011 RTI Press
As in our prior report the analyses focused on the 128 participants who successfully completed the study (Krystal et al 2011) The previous report provides complete details on our approach to including or excluding individual observations for analysis
Results
Actigraphically Determined Bed Ranking (Motion Bed Rank)The best motion bed was relatively evenly distributed across mattresses in our sample Figure 1 depicts the frequency distribution of the actigraphically determined best bed across mattresses Table 3 presents the results of the regression modeling (SAS MIXED procedure) The first row of that table determines the extent to which actigraph-measured motion per night is lower on the best motion bed compared to other beds The results in the columns labeled Bed Rank 1 through Bed Rank 7 report the (model-adjusted) means for actigraphic and diary measures The Bed Rank 1 column indicates that the mean overnight minutes of motion per 8 hours was slightly more than 54 minutes on the actigraphically determined best bed (Bed Rank 1) The Bed Rank 7 column reports that on average actigraphic measurement found nearly 69 minutes of overnight motion on the worst bed (Bed Rank 7) This is a difference of 15 minutes and is statistically significant (p=00001)
In Table 3 the rightmost column indicates that the best motion bed on average is associated with 326 fewer minutes of motion than the second-best bed This difference is statistically significant (p = 00001) This column also reports that the best bed is associated with 83 fewer minutes of motion than the average of all other beds in the motion ranking (second through seventh) and this too is statistically significant (p=00001)
Although the differences in total motion are numerically small analysis of the effect of motion bed rank on diary outcomes indicates that the bed with lowest motion was significantly associated with better sleep quality better feeling of restedness at the start of the day improved daytime energy fewer nighttime awakenings and fewer minutes awake
Self-reported sleep quality was significantly improved on the bed with the least overnight motion compared with the bed with the second-lowest motion (p=00048) and with the average of all other beds (p=00010) In addition sleep quality decreased linearly with bed rank (p=00001) Average scores for sleep quality ranged from 513 on the best motion bed to 505 on the second-best bed to 499 on the worst bed out of a Likert-type scale of 1 (not at all good) to 7 (very good)
Self-reported level of restedness was significantly improved on the best motion bed compared with the average of all other beds (p=00193) and restedness also decreased linearly with bed rank (p = 00078) Average scores for restedness ranged from 491 and 487 on the best and second-best motion beds to 481 on the worst bed out of a Likert-type scale of 1 (not at all rested) to 7 (very well rested)
Self-reported daytime energy increased linearly with bed rank such that daytime energy tended to increase in beds ranked higher on actigraphic sleep (p=00016) However daytime energy on the best motion bed was only marginally increased when compared to the average of all other beds (p=00574) The average score for daytime energy ranged from 490 and 488 on the best and second-best motion beds to 481 on the worst bed out of a Likert-type scale of 1 (not at all energetic) to 7 (very energetic)
Figure 1 Frequency distribution of best motion bed
15
18
2019
15
2120
117
140
156148
117
164156
7654321
Study Beds
Num
ber a
nd P
erce
nt o
f Par
tici
pant
s
0
5
10
15
20
25
Choosing the Best Mattress 7
Self-reported number of nighttime awakenings were significantly reduced on the best motion bed compared with second best (p=00039) and compared with the average of all other beds (p=00015) The reduction in awakenings were also linearly related to motion bed rank (plt00001) The average number of nighttime awakenings ranged from 091 and 099 on the best and second-best motion beds to 105 on the worst bed
Self-reported number of minutes awake overnight was also significantly reduced on the best motion bed compared to the average of all other beds (p=00002) and the reduction in minutes awake overnight was also linearly related to motion bed rank (plt00001) The average number of minutes awake overnight (categorized in 15-minute increments from 1=0 minutes 2=1-15 minuteshellip 6=60+ minutes) ranged from 172 and 176 on the best and second-best motion beds to 188 on the worst bed
Table 3 Effect of motion bed rank on sleep outcomes
Sleep Response Variable
Model-Adjusteda Mean (SE) Overall Bed Rank p-value
Rank 1 vs 2b Rank 1 vs All Othersc Linear Trendd
Bed Rank 1
Bed Rank 2
Bed Rank 3
Bed Rank 4
Bed Rank 5
Bed Rank 6
Bed Rank 7
Actigraph
Overnight minutes of motion per 8 hourse
5435(163)
5761(163)
5962(163)
6151(163)
6342(163)
6521(163)
6853(163)
00001-326 (038) p=00001 -830 (029) p=00001 220 (005) p=00001
Diary (Self-Report)
Sleep time (minutes)
43503 (233)
43501 (233)
43305(232)
43365(233)
43201(232)
43269(233)
43359(233)
NSNS NS -036 (019) p=00595
Number of awakenings
09054 (00702)
09886 (00702)
09268 (00700)
09246 (00701)
09725 (00700)
09921 (00701)
10493(00701)
00001-008 (003) p=00039 -007 (002) p=0001500175 (00039) p=00000
Minutes awake overnight
172(005)
176(005)
173(005)
179(005)
183(005)
181(005)
188(005)
00001NS -008 (002) p=00002 0025 (0004) p=00000
Sleep quality513
(007)505
(007)508
(007)510
(007)507
(007)507
(007)499
(007)00001
008 (003) p=00048 007 (002) p=00010 -0015 (0004) p=00001
Well-restedness491
(007)487
(007)488
(007)488
(007)487
(007)488
(007)481
(007)00347
NS 005 (002) p=00193-001(0004) p=00078
Morning pain severity
153(006)
156(006)
151(006)
155(006)
160(006)
153(006)
156(006)
00263NS NS NS
Daytime sleepiness278
(008)282
(008)281
(008)285
(008)276
(008)277
(008)290
(008)00002
NS NS NS
Daytime energy490
(008)488
(008)485
(008)493
(008)490
(008)484
(008)481
(008)00001
NS 004 (002) p=00574-001 (0003) p=00016
BMI = body mass index NS = not statistically significant (p gt 005) SE = standard errora Diary means within levels of motion bed rank are adjusted for the following model covariates Ordinal Day in Bed Time in Bed Age Gender BMI and Study Period b Bed Rank 1 minus Bed Rank 2 Estimated difference SE and p-value (2-sided) c Bed Rank 1 minus average of Bed Ranks 2ndash7 Estimated difference SE and p-value (2-sided) d Linear trend across Bed Ranks (1=Best 7=Worst) Estimated slope SE and p-value (2-sided)e Means within levels of motion bed rank are not adjusted for any covariates They are included as descriptive information
NOTE Bed Rank 1 indicates least overnight motion measured by actigraphy and Bed Rank 7 indicates greatest motion measured by actigraphy All analyses carried out using the SAS MIXED procedure
8 Hogan et al 2011 RTI Press
Sleep Quality Bed Ranking Table 4 reports the results of a similar analysis identifying the ldquobest bedrdquo as determined by the diary measure of overnight sleep quality In the first row of the table the columns labeled Bed Rank 1 through Bed Rank 7 report self-report sleep quality means along the Likert scale where 1 is worst sleep quality and 7 is best On average all bed ranks rate above the midpoint (4) with the best sleep quality bed on average rated 56 on the scale and the second-best rated 541 The lowest rating bed had a sleep quality
score of 432 The far-right column indicates an average increase of 019 (35 percent improvement) in sleep quality between the best and second-best sleep quality bed (plt00001) This column also indicates an increase of 065 (13 percent improvement) in sleep quality on the best bed compared with the average of the remaining bed ranks (plt00001) Sleep quality decreased linearly with bed rank (plt00001)
Most importantly there was a significant relationship between sleep quality bed rank and actigraphic
Table 4 Effect of sleep quality bed rank on actigraphic motion and other sleep outcomess
Sleep Response Variable
Model-Adjusteda Mean (SE) Overall Bed Rank p-value
Rank 1 vs 2b Rank 1 vs All Othersc Linear Trendd
Bed Rank 1
Bed Rank 2
Bed Rank 3
Bed Rank 4
Bed Rank 5
Bed Rank 6
Bed Rank 7
Sleep Qualitye 560(007)
541(007)
524(007)
510(007)
493(007)
474(007)
432(007)
lt0001019 (003) plt00001 065 (002) plt00001 -020 (00050) plt00001
Actigraph
Overnight minutes of motion per 8 hours
6153(164)
6197(164)
6254(164)
6255(164)
6221(164)
6312(164)
6262(164)
00233-043 (046) p=03501 -097 (034) p=00055 019 (006) p=00023
Diary (Self-Report)
Sleep time (minutes)
43441(231)
43655(233)
43469(232)
43256(233)
43308 (234)
43098(233)
43236(235)
00021-214 (137) p=01210 104 (103) p=03156 -068 (018) p=00003
Number of awakenings
080(007)
087(007)
092(007)
096(007)
095(007)
108(007)
123(007)
lt0001-007 (002) p=00168 -020 (002) plt00001 006 (00038) p=lt00001
Minutes awake overnight
166(005)
168(005)
176(005)
178(005)
180(005)
190(005)
198(005)
lt0001-002 (002) p=05018 -016 (002) plt00001 005 (00037) plt00001
Well-restedness527
(007)515
(007)502
(007)489
(007)476
(007)457
(007)432
(007)lt0001
012 (002) plt00001 049 (001) plt00001 -015 (00034) plt00001
Morning pain severity
134(006)
142(006)
151(006)
148(006)
159 (006)
170(006)
186(006)
lt0001-008 (002) p=00029-025 (002) plt00001 008 (00036) plt00001
Daytime sleepiness
264(008)
271(008)
276(008)
283(008)
282(008)
296(008)
300(008)
lt0001-007 (003) p=00401-020 (002) plt00001 006 (00045) plt00001
Daytime energy504
(008)502
(008)493
(008)489
(008)479
(008)476
(008)463
(008)lt0001
002 (002) p=04659 020 (001) plt00001 -007 (00033) plt00001
BMI = body mass index NS = not statistically significant (p gt 005) SE = standard errora Means within levels of Sleep Quality Bed Rank are adjusted for the following model covariates Ordinal Day in Bed Time in Bed Age Gender BMI and Study Periodb Bed Rank 1 minus Bed Rank 2 Estimated difference SE and p-value (2-sided) c Bed Rank 1 minus average of Bed Ranks 2ndash7 Estimated difference SE and p-value (2-sided) d Linear trend across Bed Ranks (1=Best 7=Worst) Estimated slope SE and p-value (2-sided) e Means not adjusted for any covariates They are included as descriptive information
NOTE Bed Rank 1 indicates highest sleep quality measured by diary and Bed Rank 7 indicates lowest sleep quality measured by diary All analyses carried out in the SAS MIXED procedure
Choosing the Best Mattress 9
motion (p=00233) as well as many diary outcomes most notably number of awakenings (plt00001) number of minutes awake overnight (categorized) (plt00001) well-restedness (plt00001) morning pain severity (plt00001) daytime sleepiness (plt00001) and daytime energy (plt00001) After adjusting for covariates actigraphic motion minutes was significantly reduced in the best sleep quality bed compared to the average of all other bed ranks and motion increased linearly with bed rank The beds ranked best and second-best for self-reported sleep quality are also the two beds with the lowest level of actigraphically measured motion
The number of awakenings and minutes awake overnight were both significantly reduced in the best sleep quality bed compared to the average of all other bed ranks with each increasing linearly with bed rank The number of awakenings was also significantly reduced in the best sleep quality bed compared to second best Well-restedness and daytime energy were both significantly improved in the best sleep quality bed compared to the average of all other bed ranks with each decreasing linearly with bed rank Well-restedness was also significantly improved in the best sleep quality bed compared to second best Finally morning pain severity and daytime sleepiness were both significantly reduced in the best sleep quality bed compared to the second best bed and compared to the average of all other bed ranks with each increasing linearly with bed rank
Self-Selected Versus Actigraphically Determined Best BedWe conducted a series of analyses to determine whether the mattress that individuals indicated they would choose for themselves was predictive of their optimal mattress (or mattresses) as determined by either actigraphy or self-reported sleep quality In other words can people predict their optimal mattress from a typical in-store experience Results indicate that standard showroom testing does not lead individuals to select the bed that will provide their best sleep as measured by either self-reported sleep quality or actigraphic measurement over an extended period of time Although the self-selected bed varied in our sample (see Figure 1) it was associated with a median motion bed rank of only
4 out of 7 (ie mid-rank) and the same was true for self-reported sleep quality (Table 5) Consistent with this the kappa measure of agreement between the best motion bed and self-select bed was not significantly different from 0 indicating no additional agreement than what would be expected by chance alone (Table 6) Agreement between self-select bed and the top 3 best motion beds (motion bed rank of 1 2 or 3) was also not significantly different from 0 (Table 7) as the percentage of participants whose self-select bed was among the top 3 motion best beds was only 38 percent (vs 43 percent expected by chance alone) This suggests that the customary showroom ldquotest driverdquo in fact often leads consumers to suboptimal mattress selection
Table 5 Average motion bed rank and self-reported sleep quality bed rank of self-selected bed
Variable Used to Determine Bed Rank Statistic
Estimated Bed Rank
(1ndash7)Lower 95
LimitUpper 95
Limit
Actigraphic Motiona (in minutes)
Average 4172 3826 4518
Median 4000 4000 5000
Self-Reported Sleep Quality (coded 1ndash7)
Average 3875 3525 4225
Median 4000 3000 4000
a Actigraphic motion is number of minutes of recorded overnight motion normalized to an 8-hour night
Table 6 Agreement between self-selected bed and best motion bed
Methods Compared
Kappa Estimate
Lower 95 Limit
Upper 95 Limit
Self-Select vs Best Motiona Bed
-00114 -00795 00567
a Best motion bed is the mattress firmness with the smallest average overnight motion minutes per 8 hours
Table 7 Agreement between self-selected bed and top 3 best motion beds
Methods Compared
Kappa Estimate
Observed Percentagea
Expected Percentageb
P-value H0 Kappa=0
Self-Select vs Top 3 Best Motionc Beds
-00801 3828 4286 02904
a Observed percentage of people for which self-select bed is among the top 3 best motion beds (motion bed ranks 1 2 or 3)
b Expected percentage of people for which self-select bed is among the top 3 best motion beds (motion bed ranks 1 2 or 3)
c The top 3 best motion beds are the three mattress firmness levels with the smallest average overnight motion minutes per 8 hours
10 Hogan et al 2011 RTI Press
Discussion Our prior report documented that mattress firmness has significant effects on sleep and daytime function (Krystal et al 2011) Very low and very high levels of firmness tended to be associated with relatively worse sleep greater morning pain and poorer daytime function
Our results build on those observations We provide here six main conclusions from our blinded controlled study
1 Individuals differ as to the degree of mattress firmness that is associated with their best sleep
2 Actigraphic activity level has significant utility for identifying the best mattress for an individual (Table 3)
3 The best bed as measured by actigraphic motion significantly minimizes self-reported number of overnight awakenings and minutes awake overnight and significantly maximizes self-reported sleep quality and well-restedness in the morning (Table 3)
4 The best bed as determined by self-reported sleep quality in the morning significantly minimizes actigraphic motion self reported number of awakenings minutes awake overnight and morning pain severity and maximizes well-restedness daytime sleepiness and daytime energy (Table 4)
5 People are essentially left to chance when trying to select a mattress using the generally recommended ldquotest driverdquo on the showroom floor (Tables 5ndash7)
6 The actigraphically best mattress was well distributed among the sample of participants and across the seven mattresses studied
These data indicate that activity level is not a reflection of mattress firmness rather it provides an indication of the mattress that yields optimal sleep for an individual This is consistent with our previously reported finding that activity level was not significantly correlated with mattress firmness (Krystal et al 2011) Thus our findings imply that
improving sleep in many individuals by improving mattress fit is quite possible Our results also suggest that actigraphically determined activity level may have some utility in this regard
These observations suggest that improving mattress fit may improve sleep Pain daytime sleepiness and energy level appear to be affected more by mattress firmness than by the degree to which firmness is suitable for an individual This may reflect the fact that we excluded individuals with pain insomnia or daytime sleepiness from this study Assessing the effects of mattress fit on these measures in studies that include such individuals is an important question for future research
The mattress that individuals chose as optimal before the randomized controlled phase of the study did not predict either the actigraphically determined best mattress or the best mattress as determined by reported sleep quality This finding raises the possibility that the ordinary showroom experience does not lead individuals to select the mattress that results in best sleep over a more extended period This finding should inspire study into ways in which consumers can be better equipped to identify mattresses that lead to optimal sleep and the health benefits that come from better rest
In summary our study indicates that optimal mattress firmness varies among individuals and is reflected at least to a degree by actigraphic activity level When allowed to test mattresses in a typical showroom experience individuals appear to choose mattresses that do not optimize their sleep Given that this ldquotest driverdquo approach is commonplace it would seem that most of the general public may be sleeping on mattresses improperly suited to the individual owners This would help explain to some extent why so many Americans are not enjoying the health benefits that come from optimal rest Sleep science could assist bedding retailers in improving their customersrsquo sleep outcomes by developing better in-store methods of aiding in the mattress selection process
Choosing the Best Mattress 11
ReferencesHanel S E Dartman T amp Shishoo R (1996)
Measuring methods for comfort rating of seats and beds International Journal of Industrial Ergonomics 20 163ndash172
Krystal A Edinger J Bieler G Mladsi S amp Hogan S (2011) Mattress matters A randomized controlled Latin-square crossover study of the effects of mattress support on sleep pain and daytime functioning Research Triangle Park NC RTI Press
Laird N M amp Ware J H (1982) Random effects models for longitudinal data Biometrics 38 963ndash974
Lindsay J (1993) Models for repeated measurements Oxford Oxford University Press
Littner M Kushida C A Anderson W M Bailey D Berry R B Davila D G Hirshkowitz M Kapen S Kramer M Loube D Wise M amp Johnson S F (2003) Practice parameters for the role of actigraphy in the study of sleep and circadian rhythms An update for 2002 Sleep 26 337ndash341
Loacutepez-Torres M Porcar R Solaz J amp Romero T (2008) Objective firmness average pressure and subjective perception in mattresses for the elderly Applied Ergonomics 39 123ndash130
Morgenthaler T Alessi C Friedman L Owens J Kapur V Boehlecke B Brown T Chesson A Jr Coleman J Lee-Chiong T Pancer J amp Swick T J (2007) Practice parameters for the use of actigraphy in the assessment of sleep and sleep disorders An update for 2007 Sleep 30(4) 519ndash529
National Institutes of Health (NIH) National Institute of Neurological Disorders and Stroke (2003a) Brain basics Understanding sleep Bethesda MD National Institute of Neurological Disorders and Stroke
National Institutes of Health (NIH) National Center for Sleep Disorders Research (2003b) National sleep disorders research plan NIH Report No 03-5209 Bethesda MD National Institute of Neurological Disorders and Stroke
Agresti A (2002) Categorical data analysis 2nd ed New York John Wiley and Sons
Alapin I Fichten C S Libman E Creti L Bailes S amp Wright J (2001) How is good and poor sleep in older adults and college students related to daytime sleepiness fatigue and ability to concentrate Journal of Psychosomatic Research 49(5) 381ndash390
Ancoli-Israel S Cole R Alessi C Chambers M Moorcroft amp Pollak C P (2003) The role of actigraphy in the study of sleep and circadian rhythms Sleep 3 342ndash392
Better Sleep Council (2008a) Consumer attitudes about mattresses are evolving but purchasing behavior is slow to change Sleep Savvy April
Better Sleep Council (2008b) Mattress buying guide Available at httpwwwbettersleeporgEase shopasp
Brown H amp Prescott R (2006) Applied mixed models in medicine 2nd ed New York John Wiley and Sons
Centers for Disease Control and Prevention (CDC) (2007) Sleep and sleep disorders Sleep hygiene tips Available at httpwwwcdcgovsleep hygienehtm
Consumer Reports (2005) How to buy a mattress without losing sleep June 12ndash17
Diggle P J Liang K Y amp Zeger S L (1994) Analysis of longitudinal data Oxford Oxford University Press
Elmenhorst E M Elmenhorst D Luks N Maass H Vejvoda M amp Samel A (2008) Partial sleep deprivation Impact on the architecture and quality of sleep Sleep Medicine 8 840ndash850
Hamilton N A Gallagher M W Preacher K J Stevens N Nelson C A Karlson C amp McCurdy D (2007) Insomnia and well being Journal of Consulting amp Clinical Psychology 75 939ndash946
12 Hogan et al 2011 RTI Press
Roberts R E Roberts C R amp Duong H T (2008) Chronic insomnia and its negative consequences for health and functioning of adolescents A 12-month prospective study Journal of Adolescent Health 42 294ndash302
SAS Institute Inc (2006) SASSTAT userrsquos guide Version 913 Cary NC SAS Institute Inc
Senn S (2002) Cross-over trials in clinical research 2nd ed New York John Wiley and Sons
Van Dongen H P Maislin G Mullington J M amp Dinges D F (2003) The cumulative cost of additional wakefulness Dose-response effects on neurobehavioral functions and sleep physiology from chronic sleep restriction and total sleep deprivation Sleep 2 117ndash126
AcknowledgmentsSleep to Live Institute of Joplin Missouri sponsored this research Sleep to Live Institute did not exercise editorial control over the analysis or reporting of the results We recognize the contributions of Michael SS Lawrence Jeff Barghout and Scott Mladsi in the design and implementation of this experiment
RTI International is an independent nonprofit research organization dedicated to improving the human condition by turning knowledge into practice RTI offers innovative research and technical solutions to governments and businesses worldwide in the areas of health and pharmaceuticals education and training surveys and statistics advanced technology international development economic and social policy energy and the environment and laboratory and chemistry services
The RTI Press complements traditional publication outlets by providing another way for RTI researchers to disseminate the knowledge they generate This PDF document is offered as a public service of RTI International
wwwrtiorgrtipress RTI Press publication RR-0016-1108
- Abstract
- Introduction
- Methods
-
- Study Design and Sample
- Statistical Methods
-
- Results
-
- Actigraphically Determined Bed Ranking (Motion Bed Rank)
- Sleep Quality Bed Ranking
- Self-Selected Versus Actigraphically Determined Best Bed
-
- Discussion
- References
- Acknowledgments
-
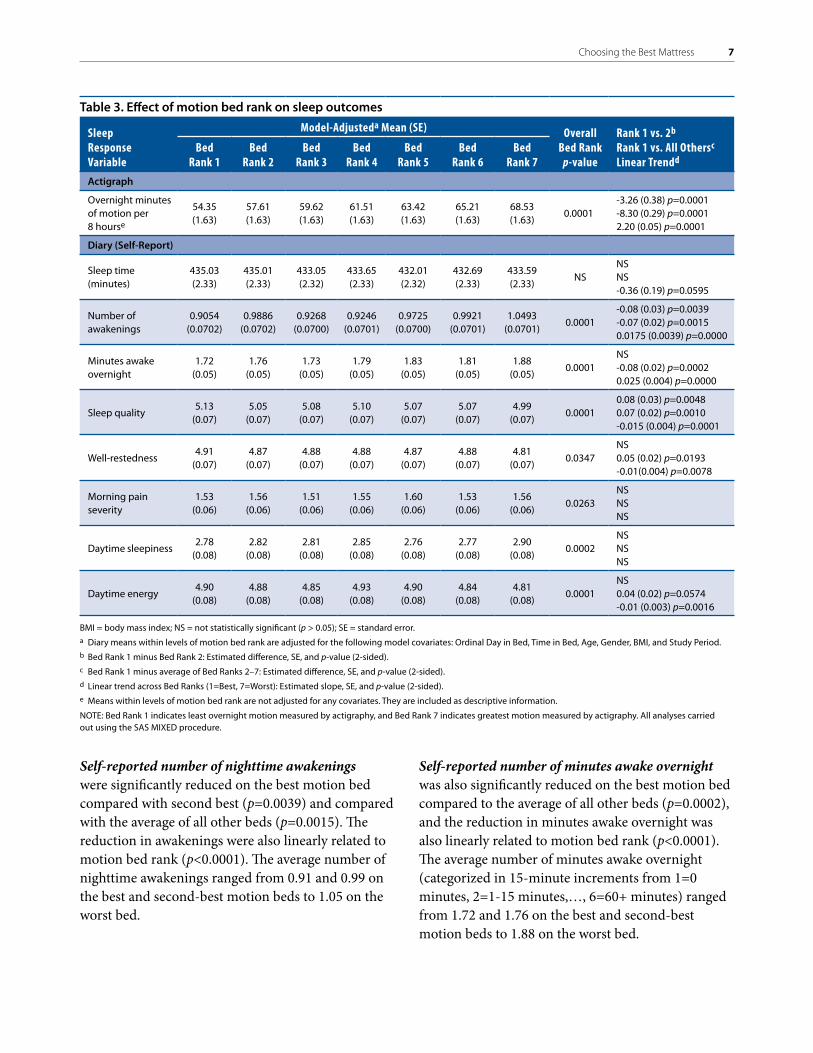
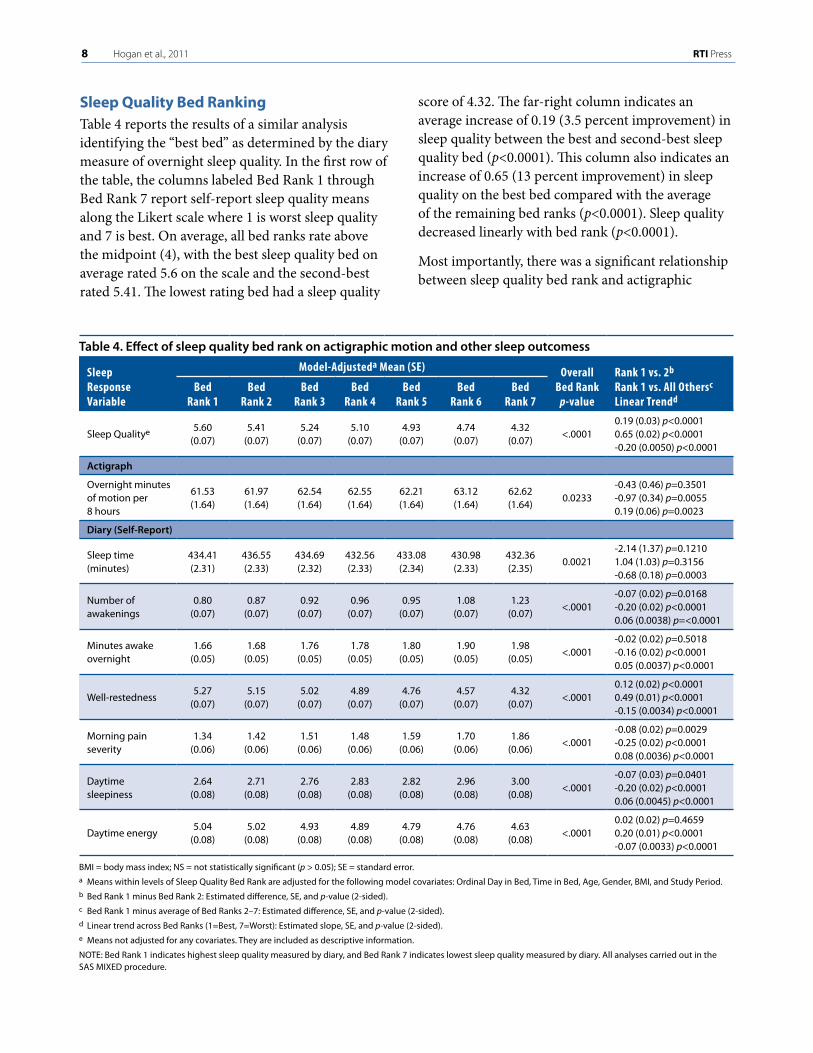