choosing the correct data analysis - ir.unimas.my talk_data analysis unimas.pdf · agenda style...
TRANSCRIPT
Choosing the Correct Data AnalysisRayenda Khresna Brahmana
Faculty of Economics and Business
Agenda Style
Rayenda Khresna Brahmana1
Your Text Here2
Your Text Here3
Your Text Here4
Your Text Here5

Rayenda
Brahmana
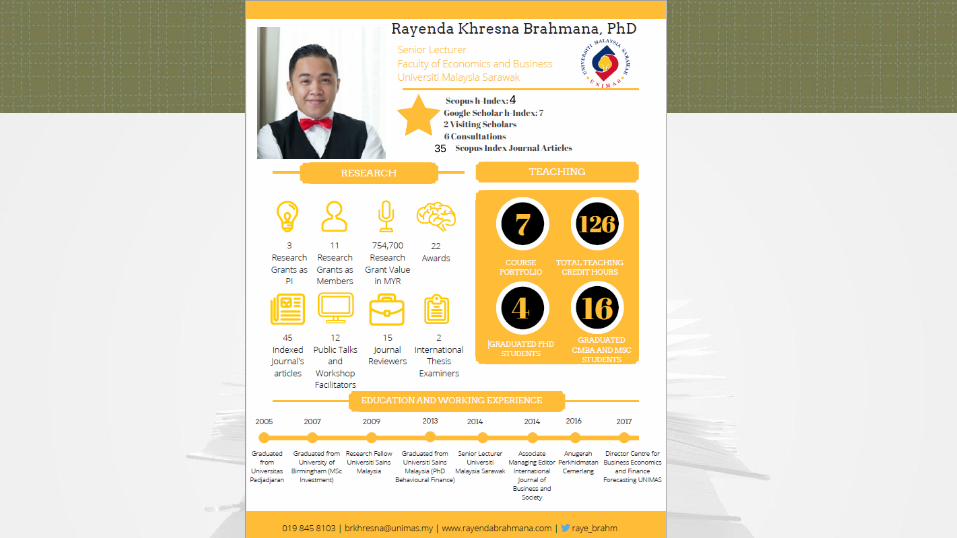
4
35

Research Design
Paradigm
Quantitative, qualitative, mixed-method designs:
What does each methodology entail?
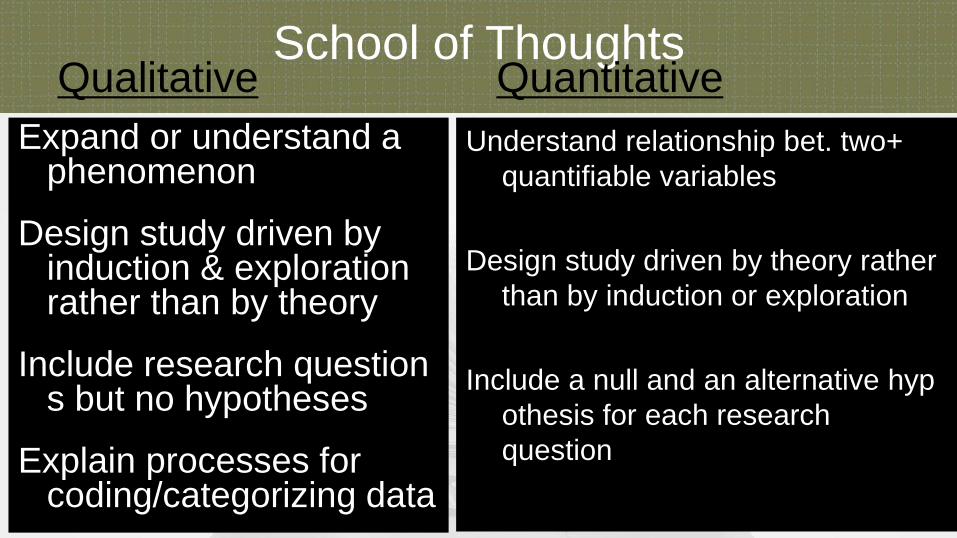
School of ThoughtsQualitative Quantitative
Expand or understand a phenomenon
Design study driven by induction & exploration rather than by theory
Include research questions but no hypotheses
Explain processes for coding/categorizing data
Understand relationship bet. two+
quantifiable variables
Design study driven by theory rather
than by induction or exploration
Include a null and an alternative hyp
othesis for each research
question
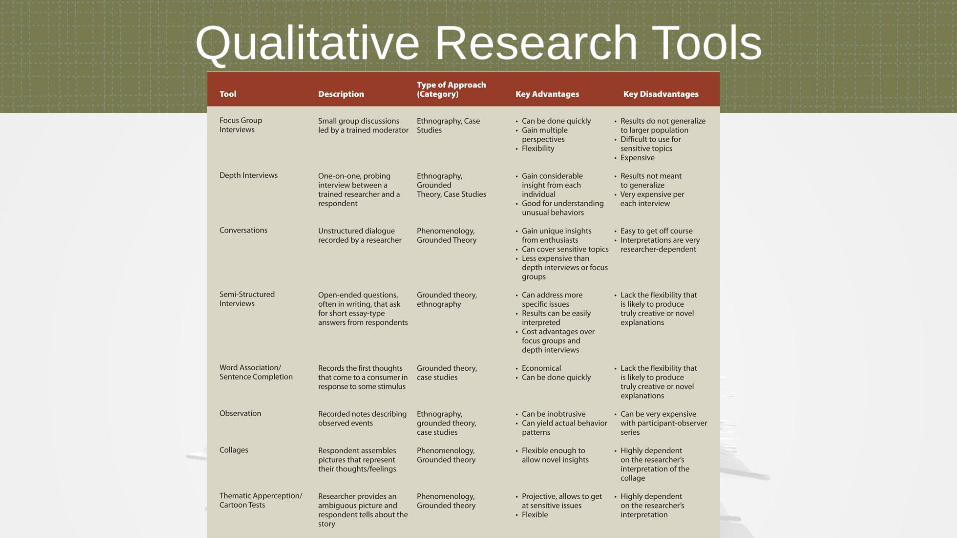
Qualitative Research Tools
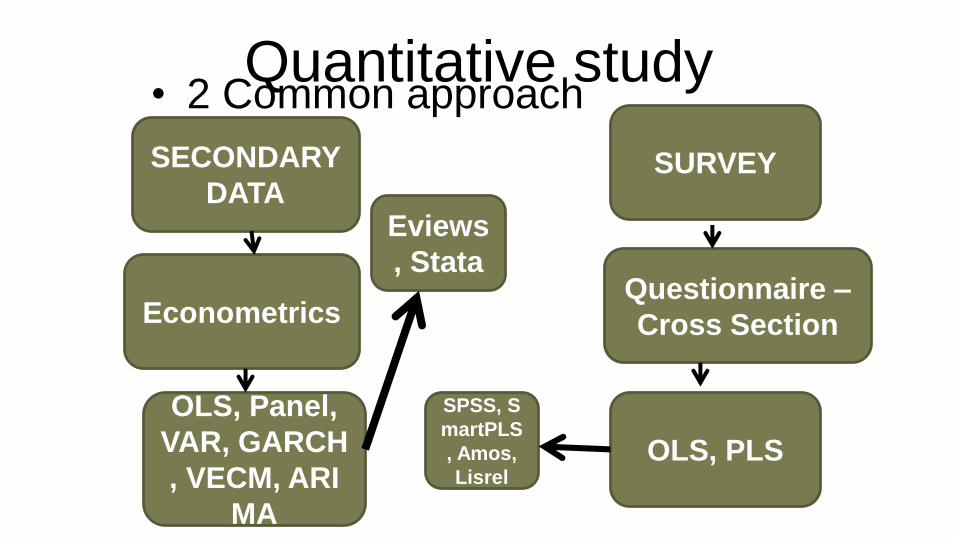
Quantitative study• 2 Common approach
SECONDARY
DATASURVEY
EconometricsQuestionnaire –
Cross Section
OLS, Panel,
VAR, GARCH
, VECM, ARI
MA
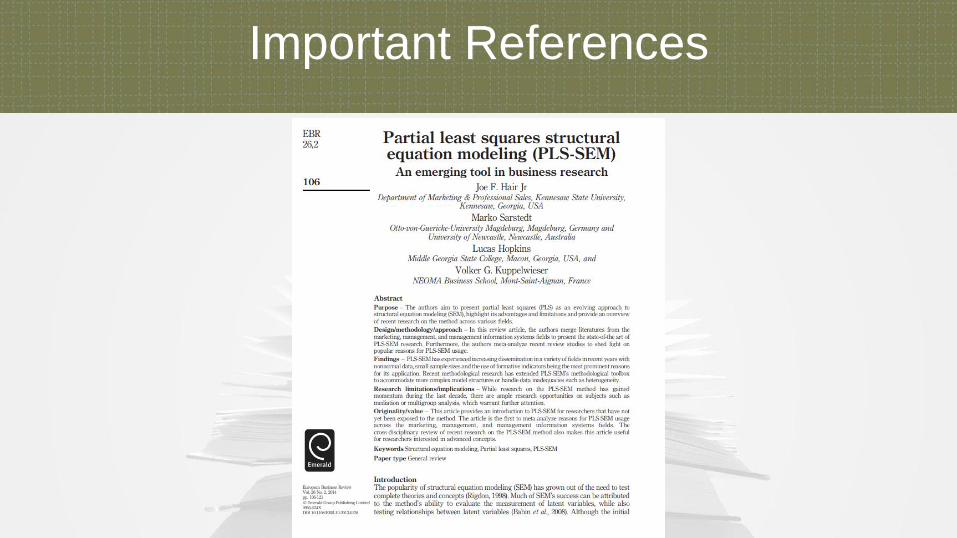
OLS, PLS
Eviews
, Stata
SPSS, S
martPLS
, Amos,
Lisrel

Research Design
• Each research design has different research tool
• 4 Research Design
– Experiment
– Survey
– Secondary Data
– Observation

Research Design
Experimental Manipulation check
Survey Reliability and Validity
Observation Tendency Test
CLRM the 4 Classical Assumption
Panel Regression Breusch and Pagan LM, and Hausman Test
Cointegration and VECM Unit Root Test
Different design, different test

Choosing Data
Analysis
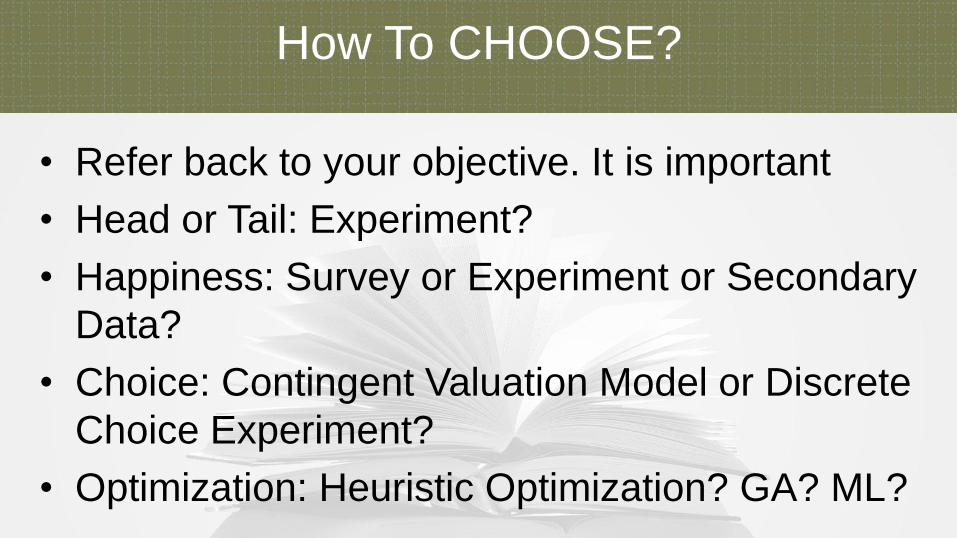
• Refer back to your objective. It is important
• Head or Tail: Experiment?
• Happiness: Survey or Experiment or Secondary
Data?
• Choice: Contingent Valuation Model or Discrete
Choice Experiment?
• Optimization: Heuristic Optimization? GA? ML?
How To CHOOSE?
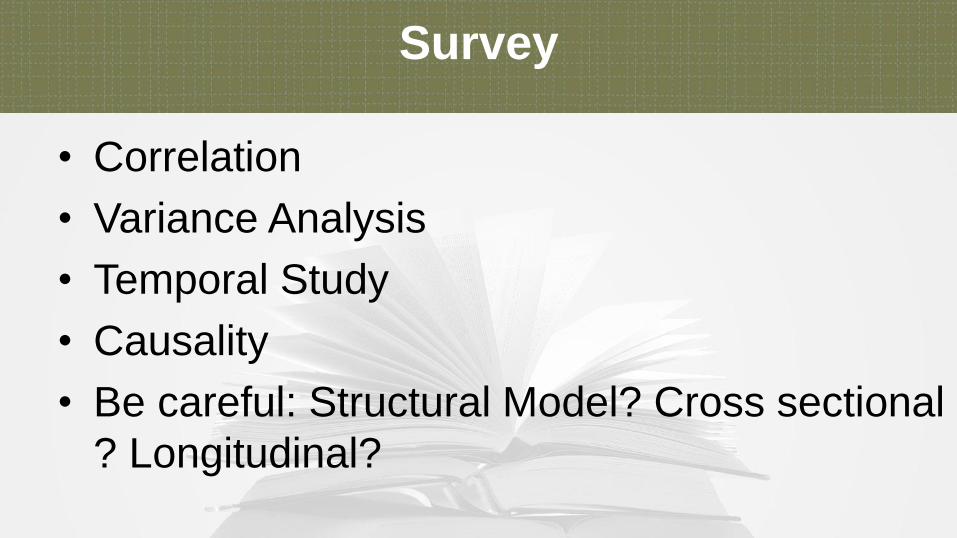
Survey
• Correlation
• Variance Analysis
• Temporal Study
• Causality
• Be careful: Structural Model? Cross sectional
? Longitudinal?

Experiment
• T-test? Paired? Mean? Independent? Krus
kall Wallis?
• Simulation (Magnitude)
• Factorial Design?
• Correlation?
• Descriptive
• Causality Effect?

Secondary Data
• Cross-Sectional? Multiple Regression Family
• Time Series? OLS, Cointegration, GARCH,
ARIMA, GMM, etc
• Panel? Panel Regression
• Correlation?
• Causality?
• Descriptive?
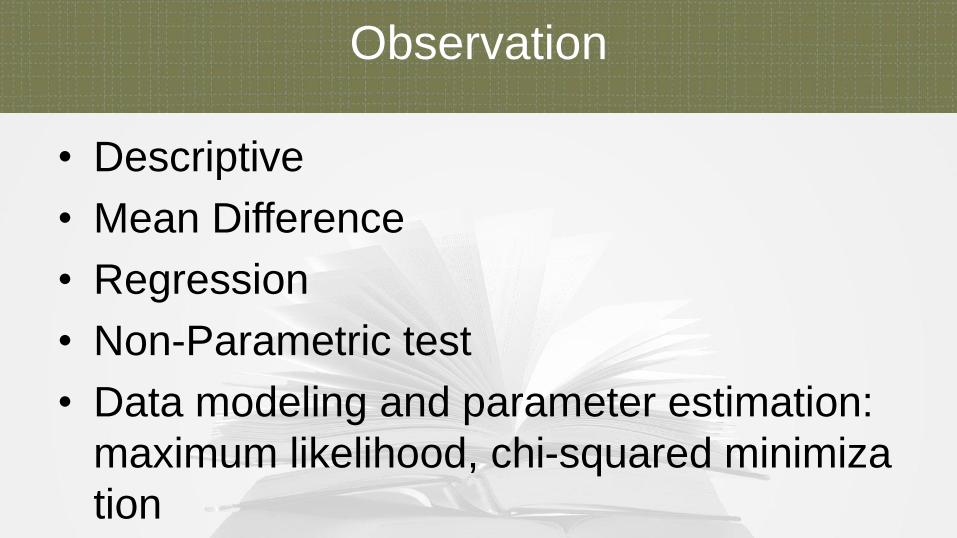
Observation
• Descriptive
• Mean Difference
• Regression
• Non-Parametric test
• Data modeling and parameter estimation:
maximum likelihood, chi-squared minimiza
tion
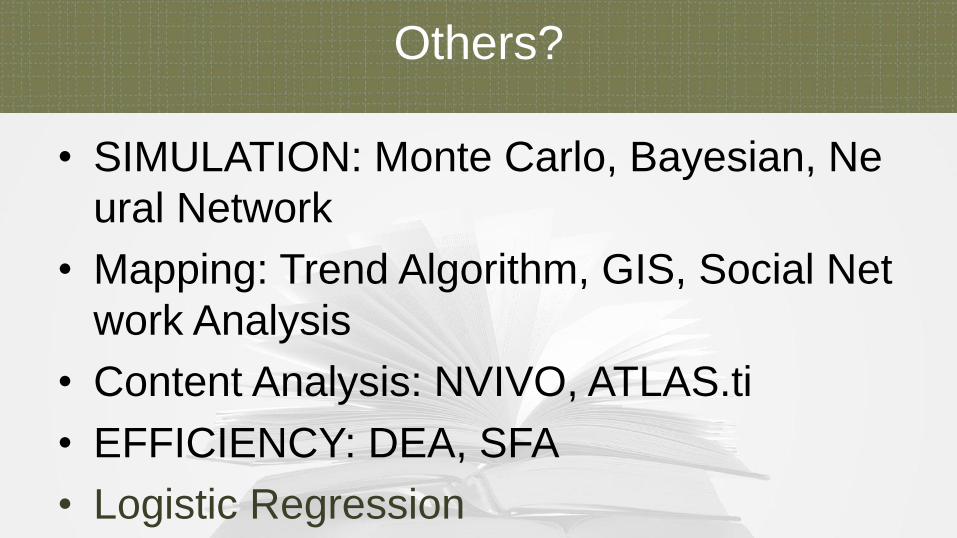
Others?
• SIMULATION: Monte Carlo, Bayesian, Ne
ural Network
• Mapping: Trend Algorithm, GIS, Social Net
work Analysis
• Content Analysis: NVIVO, ATLAS.ti
• EFFICIENCY: DEA, SFA
• Logistic Regression

Extra Note
• Moderation Effect: Cohen F2, Hayes and Pallant
(2018)
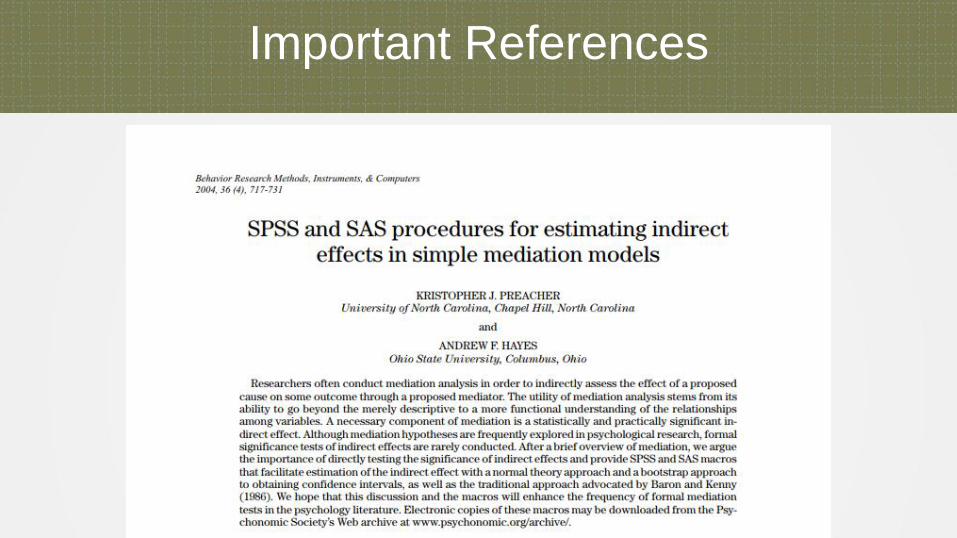
• Mediation Effect: Preacher and Hayes (2004), S
obel Test, R2 Changed Size, etc
• Endogeneity: TSLS, GMM
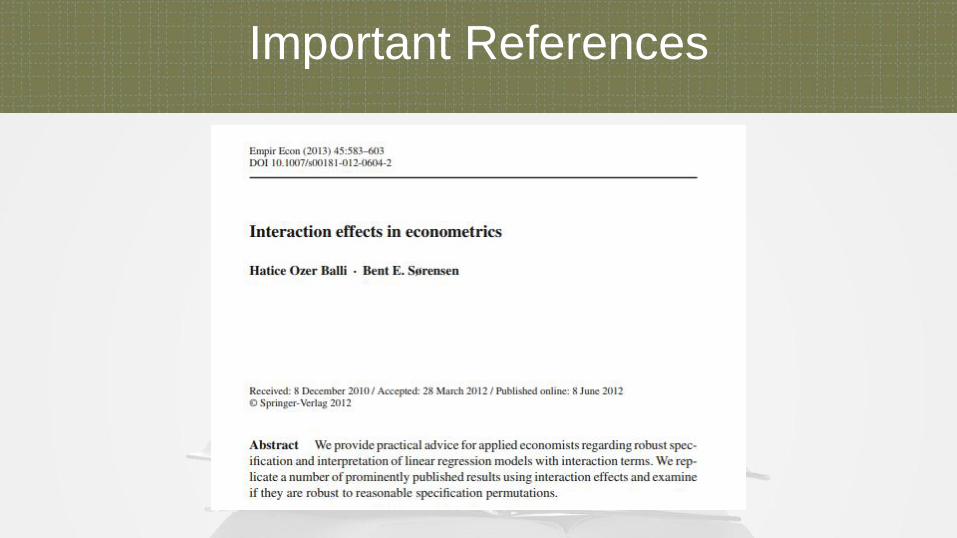
• Interaction Model
• Sample Size: G-Power, Sekaran and Bougie (20
10), Rule of 10, Normality, Sample Iteration, etc
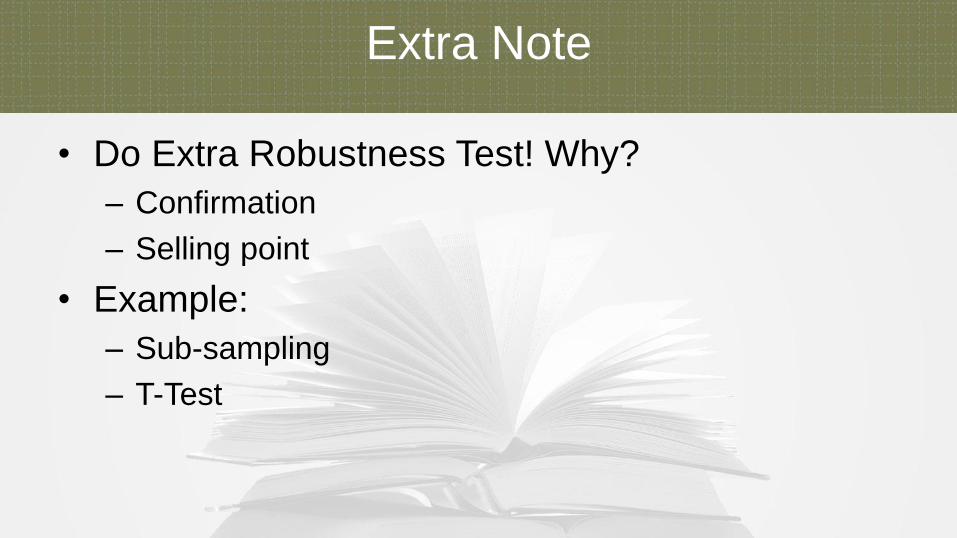
Extra Note
• Do Extra Robustness Test! Why?
– Confirmation
– Selling point
• Example:
– Sub-sampling
– T-Test
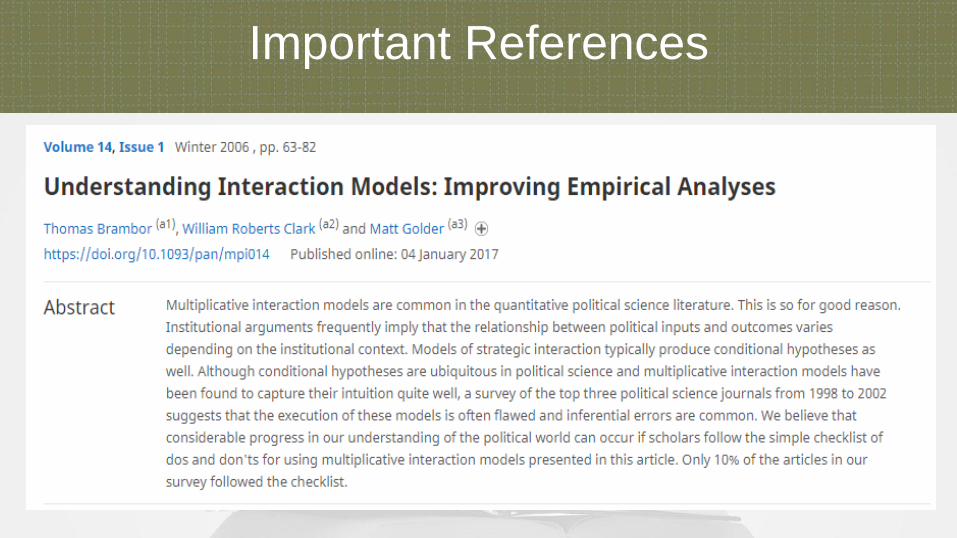
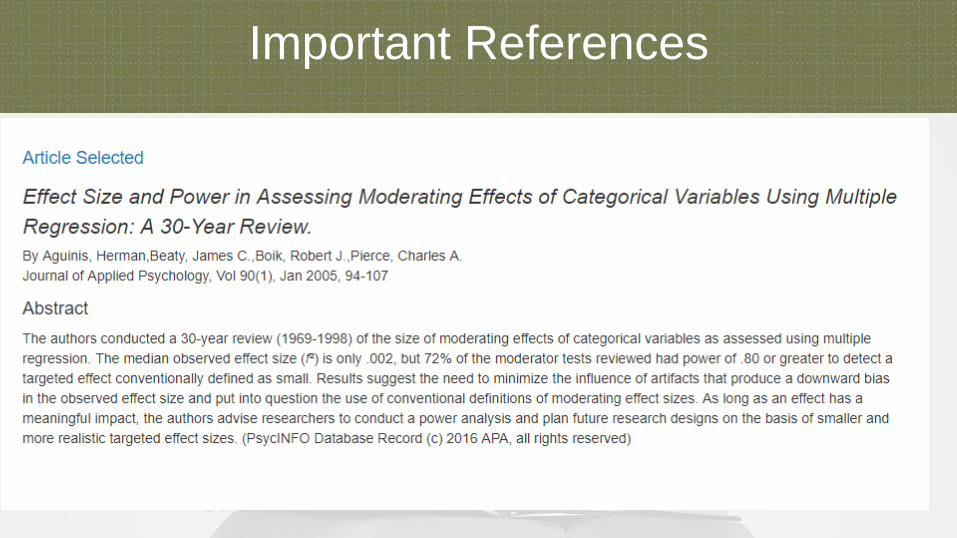
Important References
Important References
Important References
Important References

Important References
Important References

So, what is our conclusion?
1. Choosing data analysis has to always refer back to your research objective and
research philosophy
2. If you are PhD or MPhil, make sure you know the research philosophy before est
ablishing a new model. Ask first, what is your epistemological assumption? Your
ontological? Your axiological? Etc
3. There is no such thing as the best method. But there is always a room for wrongly
-choose-model
4. Understand first your method before you write it

Thank you