chp webinar slidedeck
TRANSCRIPT
A webinar produced in partnership between Alliance for Industrial Efficiency, the Business Council for Sustainable Energy, and CHP Association
With participation from the American Gas Association and Solar Turbines
GET THE FACTS: http://www.bcse.org/sustainableenergyfactbook#Factbook
Combined Heat and Power in AmericaMarch 16, 2017
Welcome / AIE Introduction – Alexandra Rekkas, Senior Research Associate, David Gardiner and Associate / Alliance for Industrial Efficiency
CHP Association Introduction – Dale Louda, Executive Director, CHP AssociationOverview of 2017 Factbook with CHP Focus – Lisa Jacobson, President,
Business Council for Sustainable Energy
Panel – CHP Industry Views –Moderator : Alexandra Rekkas, DGA /AIE
PanelistsGil Amengual, Director of Marketing and Product Strategies, Solar TurbinesDale Louda, Executive Director, CHP AssociationRichard Meyer, Director of Energy Analysis and Standards, American Gas
Association
Question & Answer –Moderator: Andy Barnes, Policy Associate, BCSE
Combined Heat & Power in America Agenda


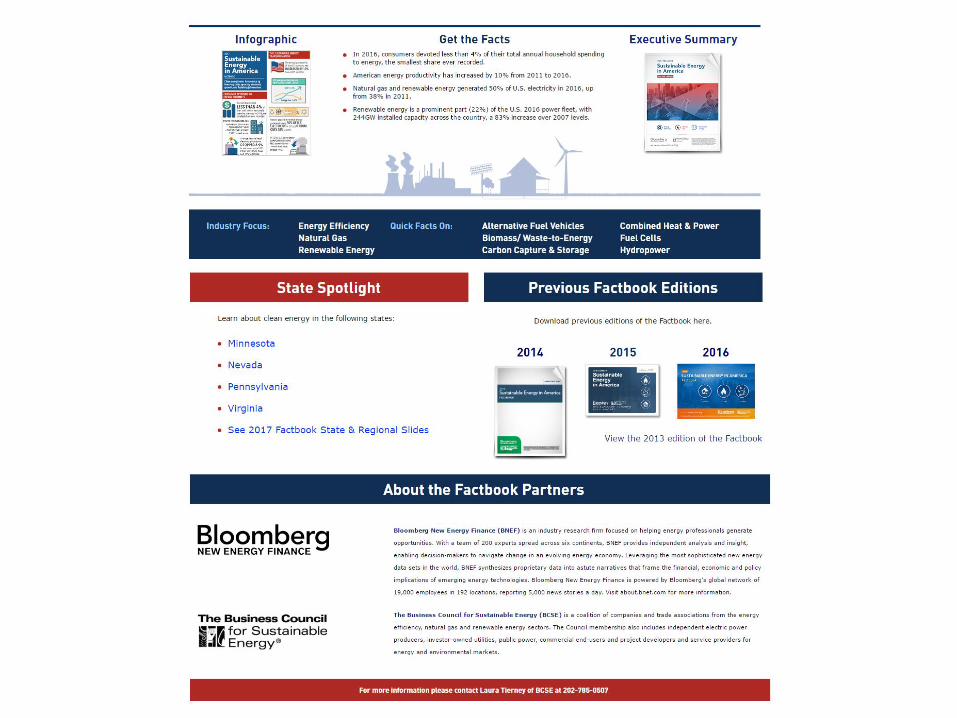
About the BCSE
• The Business Council for Sustainable Energy (BCSE) is a coalition of companies and trade associations from the energy efficiency, natural gas and renewable energy sectors.
• The Council advocates for policies at state, national and international levels that:• increase the use of commercially-‐available clean energy technologies, products and services
• support an affordable, reliable power system• reduce air pollution & greenhouse gas emissions
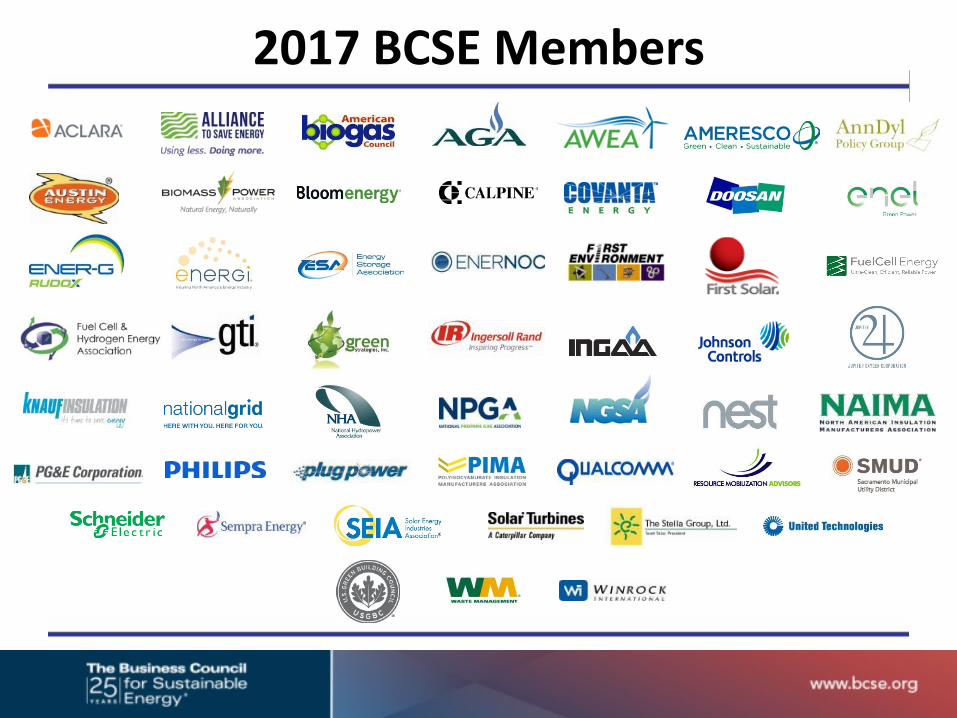
2017 BCSE Members
Sponsored By:
No portion of this document may be reproduced, scanned into an electronic system, distributed, publicly displayed or used as the basis of derivative works without attributing Bloomberg Finance L.P. and the Business Council for Sustainable Energy. For more information on terms of use, please contact [email protected]. Copyright and Disclaimer notice on the last page applies throughout. Developed in partnership with the Business Council for Sustainable Energy.
GET THE FACTS www.bcse.org
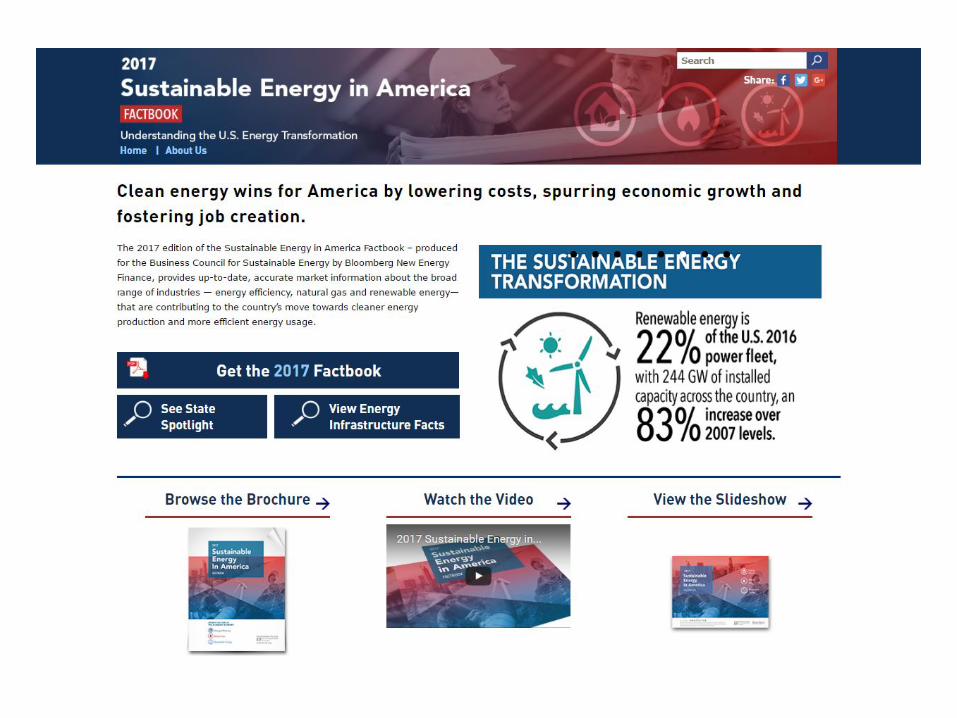
2017
Sustainable Energy in AmericaFACTBOOK
11© Bloomberg Finance L.P. 2017. Developed in partnership with The Business Council for Sustainable Energy.
Highlights
2016 saw a number of new landmarks in US energy:˗ GDP grew 1.6%, while energy consumption fell 0.2%˗ Record solar PV build (12.5GW)˗ The US became a natural gas net exporter
Sustainable energy is the new normal:˗ 92% of power generating capacity built in the past 25 years is renewable or natural gas
˗ Natural gas has displaced coal as the largest source of power˗ Renewables provided 15% of power, up from 8% in 2007˗ Power-sector emissions 24% below 2005 levels, economy-wide down 12%
Meanwhile, energy prices are low and falling:˗ Wind and solar costs have fallen dramatically and are competitive with gas and coal in many regions of the country
˗ Consumers are dedicating less of household spending to electricity, natural gas, and overall energy than any other time on record
12© Bloomberg Finance L.P. 2017. Developed in partnership with The Business Council for Sustainable Energy.
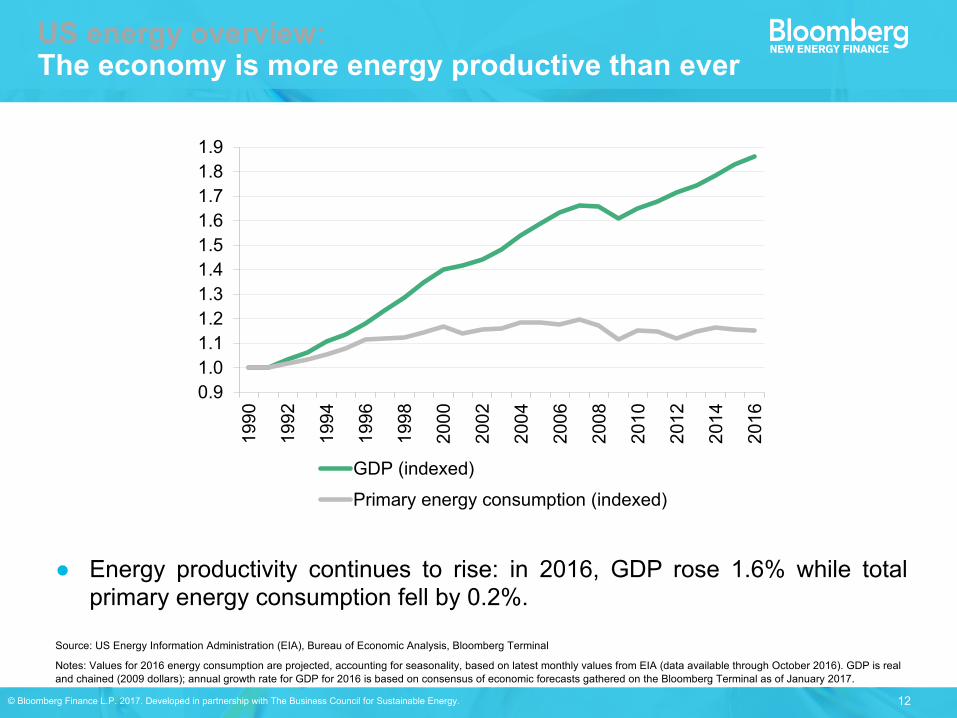
Source: US Energy Information Administration (EIA), Bureau of Economic Analysis, Bloomberg Terminal
Notes: Values for 2016 energy consumption are projected, accounting for seasonality, based on latest monthly values from EIA (data available through October 2016). GDP is real and chained (2009 dollars);; annual growth rate for GDP for 2016 is based on consensus of economic forecasts gathered on the Bloomberg Terminal as of January 2017.
Energy productivity continues to rise: in 2016, GDP rose 1.6% while totalprimary energy consumption fell by 0.2%.
US energy overview: The economy is more energy productive than ever
0.91.01.11.21.31.41.51.61.71.81.9
1990
1992
1994
1996
1998
2000
2002
2004
2006
2008
2010
2012
2014
2016
GDP (indexed)Primary energy consumption (indexed)
13© Bloomberg Finance L.P. 2017. Developed in partnership with The Business Council for Sustainable Energy.
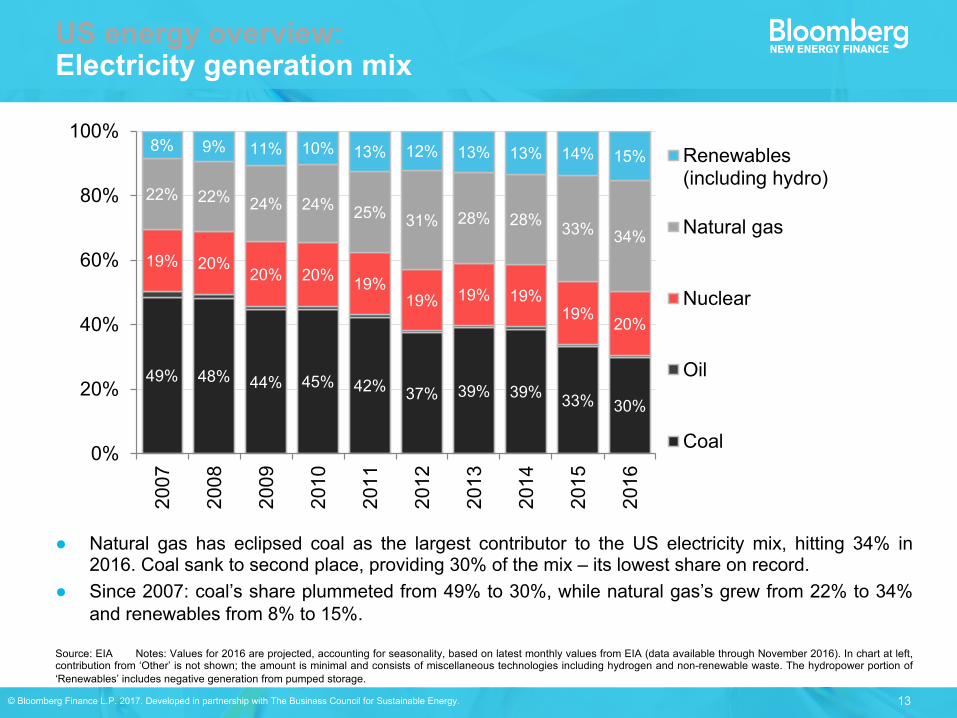
US energy overview:Electricity generation mix
Source: EIA Notes: Values for 2016 are projected, accounting for seasonality, based on latest monthly values from EIA (data available through November 2016). In chart at left,contribution from ‘Other’ is not shown;; the amount is minimal and consists of miscellaneous technologies including hydrogen and non-renewable waste. The hydropower portion of‘Renewables’ includes negative generation from pumped storage.
Natural gas has eclipsed coal as the largest contributor to the US electricity mix, hitting 34% in2016. Coal sank to second place, providing 30% of the mix – its lowest share on record.
Since 2007: coal’s share plummeted from 49% to 30%, while natural gas’s grew from 22% to 34%and renewables from 8% to 15%.
49% 48% 44% 45% 42% 37% 39% 39% 33% 30%
19% 20%20% 20% 19%
19% 19% 19%19% 20%
22% 22% 24% 24% 25% 31% 28% 28% 33% 34%
8% 9% 11% 10% 13% 12% 13% 13% 14% 15%
0%
20%
40%
60%
80%
100%2007
2008
2009
2010
2011
2012
2013
2014
2015
2016
Renewables(including hydro)
Natural gas
Nuclear
Oil
Coal
14© Bloomberg Finance L.P. 2017. Developed in partnership with The Business Council for Sustainable Energy.
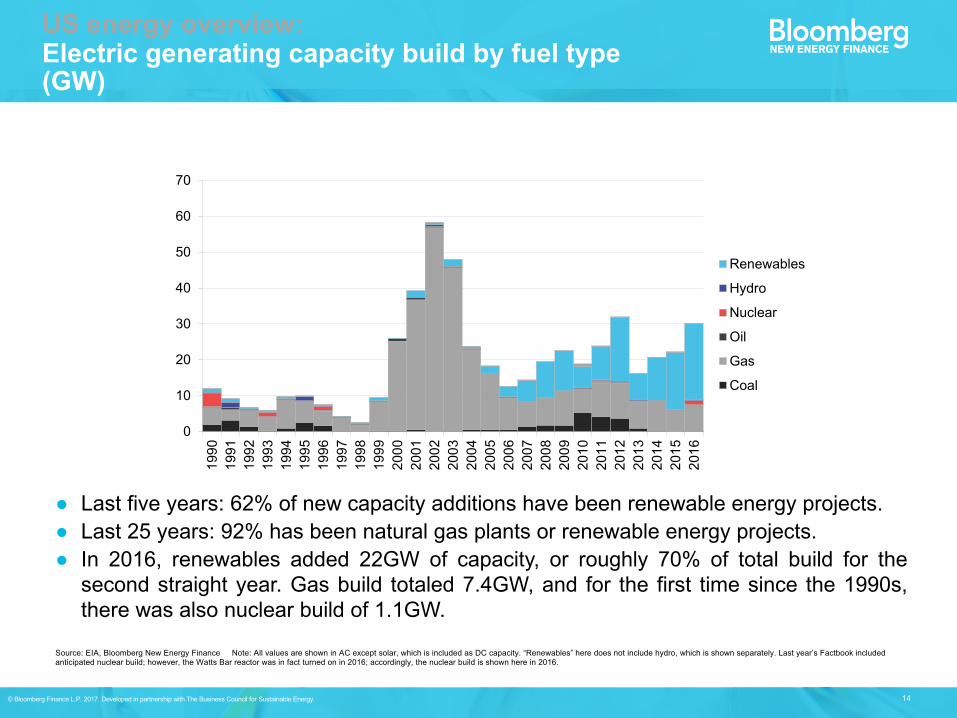
Last five years: 62% of new capacity additions have been renewable energy projects. Last 25 years: 92% has been natural gas plants or renewable energy projects. In 2016, renewables added 22GW of capacity, or roughly 70% of total build for thesecond straight year. Gas build totaled 7.4GW, and for the first time since the 1990s,there was also nuclear build of 1.1GW.
Source: EIA, Bloomberg New Energy Finance Note: All values are shown in AC except solar, which is included as DC capacity. “Renewables” here does not include hydro, which is shown separately. Last year’s Factbook included anticipated nuclear build;; however, the Watts Bar reactor was in fact turned on in 2016;; accordingly, the nuclear build is shown here in 2016.
US energy overview: Electric generating capacity build by fuel type (GW)
0
10
20
30
40
50
60
70
1990
1991
1992
1993
1994
1995
1996
1997
1998
1999
2000
2001
2002
2003
2004
2005
2006
2007
2008
2009
2010
2011
2012
2013
2014
2015
2016
Renewables
Hydro
Nuclear
Oil
Gas
Coal
15© Bloomberg Finance L.P. 2017. Developed in partnership with The Business Council for Sustainable Energy.
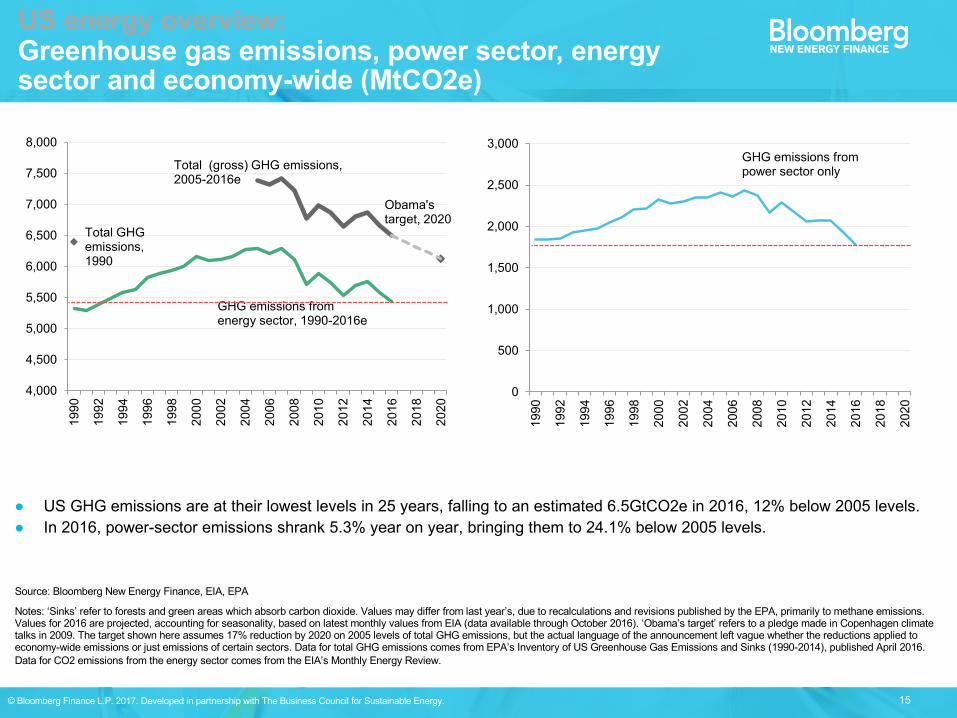
US GHG emissions are at their lowest levels in 25 years, falling to an estimated 6.5GtCO2e in 2016, 12% below 2005 levels. In 2016, power-sector emissions shrank 5.3% year on year, bringing them to 24.1% below 2005 levels.
Source: Bloomberg New Energy Finance, EIA, EPA
Notes: ‘Sinks’ refer to forests and green areas which absorb carbon dioxide. Values may differ from last year’s, due to recalculations and revisions published by the EPA, primarily to methane emissions. Values for 2016 are projected, accounting for seasonality, based on latest monthly values from EIA (data available through October 2016). ‘Obama’s target’ refers to a pledge made in Copenhagen climate talks in 2009. The target shown here assumes 17% reduction by 2020 on 2005 levels of total GHG emissions, but the actual language of the announcement left vague whether the reductions applied to economy-wide emissions or just emissions of certain sectors. Data for total GHG emissions comes from EPA’s Inventory of US Greenhouse Gas Emissions and Sinks (1990-2014), published April 2016. Data for CO2 emissions from the energy sector comes from the EIA’s Monthly Energy Review.
4,000
4,500
5,000
5,500
6,000
6,500
7,000
7,500
8,000
1990
1992
1994
1996
1998
2000
2002
2004
2006
2008
2010
2012
2014
2016
2018
2020
GHG emissions from energy sector, 1990-2016e
Total GHG emissions,1990
Obama's target, 2020
Total (gross) GHG emissions,2005-2016e
0
500
1,000
1,500
2,000
2,500
3,000
1990
1992
1994
1996
1998
2000
2002
2004
2006
2008
2010
2012
2014
2016
2018
2020
GHG emissions from power sector only
US energy overview:Greenhouse gas emissions, power sector, energy sector and economy-wide (MtCO2e)
Falling costs for consumers
17© Bloomberg Finance L.P. 2017. Developed in partnership with The Business Council for Sustainable Energy.
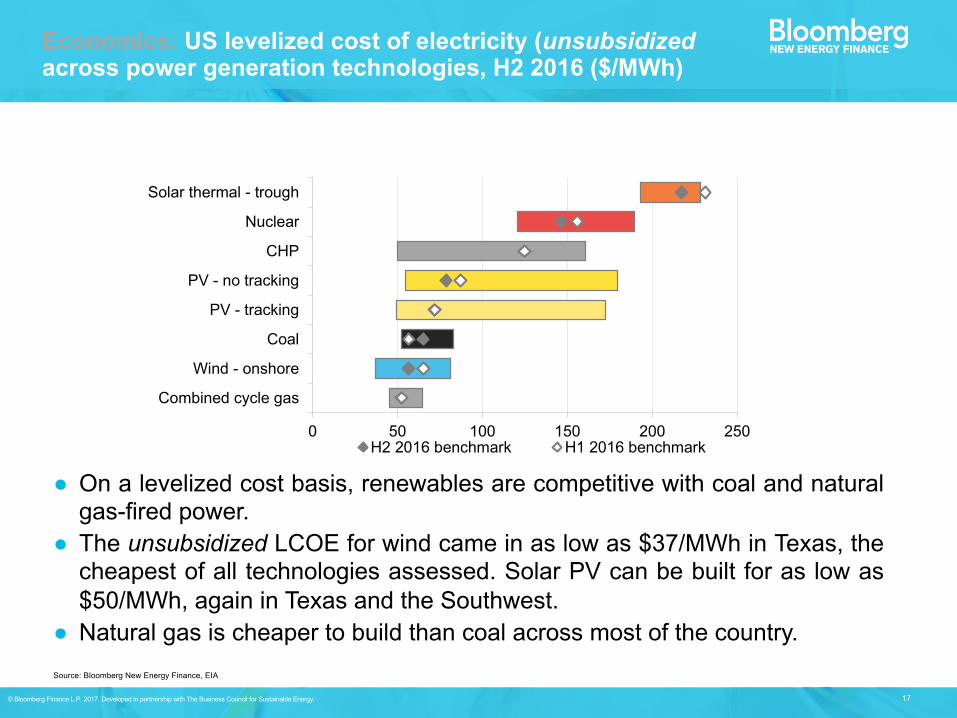
Economics: US levelized cost of electricity (unsubsidizedacross power generation technologies, H2 2016 ($/MWh)
Source: Bloomberg New Energy Finance, EIA
0 50 100 150 200 250
Combined cycle gas
Wind - onshore
Coal
PV - tracking
PV - no tracking
CHP
Nuclear
Solar thermal - trough
H2 2016 benchmark H1 2016 benchmark
On a levelized cost basis, renewables are competitive with coal and naturalgas-fired power.
The unsubsidized LCOE for wind came in as low as $37/MWh in Texas, thecheapest of all technologies assessed. Solar PV can be built for as low as$50/MWh, again in Texas and the Southwest.
Natural gas is cheaper to build than coal across most of the country.
18© Bloomberg Finance L.P. 2017. Developed in partnership with The Business Council for Sustainable Energy.
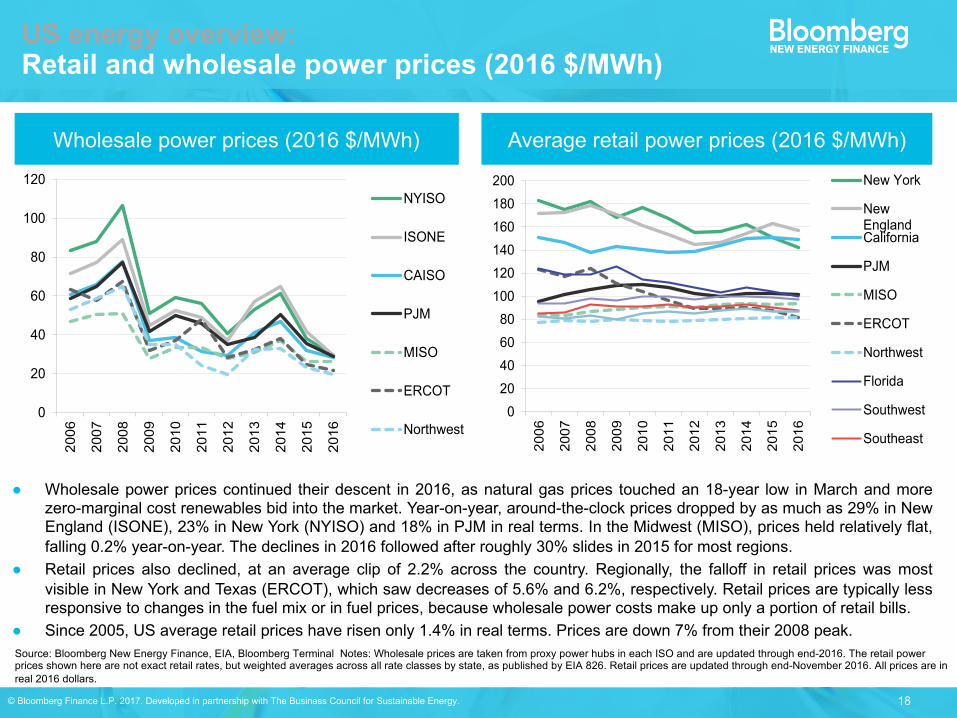
Source: Bloomberg New Energy Finance, EIA, Bloomberg Terminal Notes: Wholesale prices are taken from proxy power hubs in each ISO and are updated through end-2016. The retail power prices shown here are not exact retail rates, but weighted averages across all rate classes by state, as published by EIA 826. Retail prices are updated through end-November 2016. All prices are in real 2016 dollars.
Average retail power prices (2016 $/MWh)
Wholesale power prices continued their descent in 2016, as natural gas prices touched an 18-year low in March and morezero-marginal cost renewables bid into the market. Year-on-year, around-the-clock prices dropped by as much as 29% in NewEngland (ISONE), 23% in New York (NYISO) and 18% in PJM in real terms. In the Midwest (MISO), prices held relatively flat,falling 0.2% year-on-year. The declines in 2016 followed after roughly 30% slides in 2015 for most regions.
Retail prices also declined, at an average clip of 2.2% across the country. Regionally, the falloff in retail prices was mostvisible in New York and Texas (ERCOT), which saw decreases of 5.6% and 6.2%, respectively. Retail prices are typically lessresponsive to changes in the fuel mix or in fuel prices, because wholesale power costs make up only a portion of retail bills.
Since 2005, US average retail prices have risen only 1.4% in real terms. Prices are down 7% from their 2008 peak.
Wholesale power prices (2016 $/MWh)
020406080100120140160180200
2006
2007
2008
2009
2010
2011
2012
2013
2014
2015
2016
New York
NewEnglandCalifornia
PJM
MISO
ERCOT
Northwest
Florida
Southwest
Southeast
0
20
40
60
80
100
120
2006
2007
2008
2009
2010
2011
2012
2013
2014
2015
2016
NYISO
ISONE
CAISO
PJM
MISO
ERCOT
Northwest
US energy overview:Retail and wholesale power prices (2016 $/MWh)
19© Bloomberg Finance L.P. 2017. Developed in partnership with The Business Council for Sustainable Energy.
Source: Bureau of Economic Analysis, Bloomberg New Energy Finance Notes: Values for the fourth quarter of 2016 are preliminary.
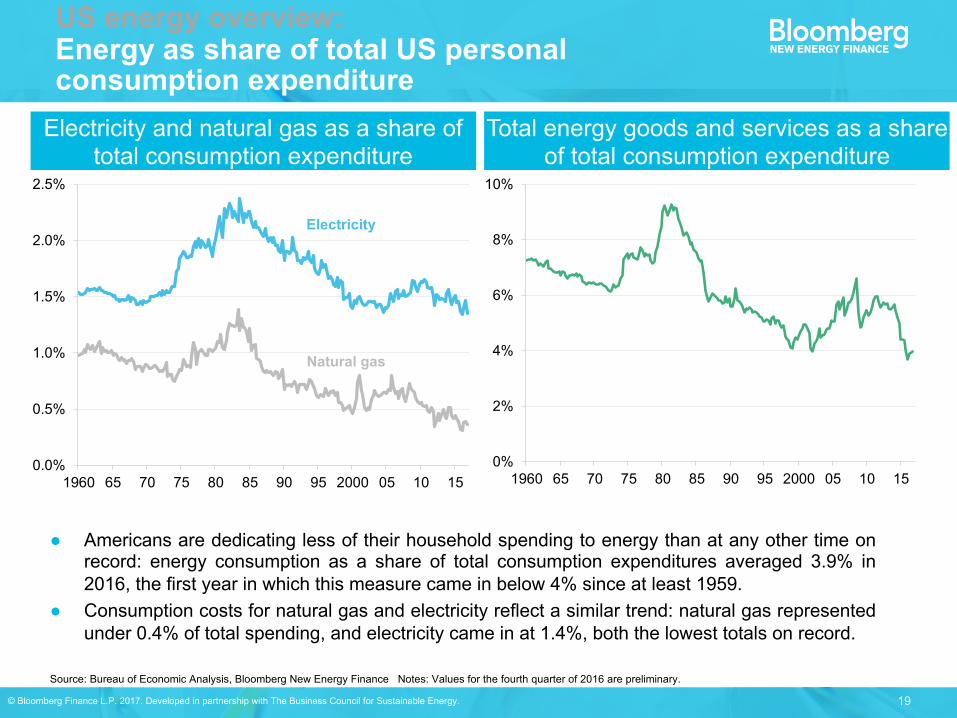
US energy overview:Energy as share of total US personal consumption expenditure
Americans are dedicating less of their household spending to energy than at any other time onrecord: energy consumption as a share of total consumption expenditures averaged 3.9% in2016, the first year in which this measure came in below 4% since at least 1959.
Consumption costs for natural gas and electricity reflect a similar trend: natural gas representedunder 0.4% of total spending, and electricity came in at 1.4%, both the lowest totals on record.
Electricity and natural gas as a share of total consumption expenditure
0.0%
0.5%
1.0%
1.5%
2.0%
2.5%
1960 65 70 75 80 85 90 95 2000 05 10 15
Electricity
Natural gas
Total energy goods and services as a share of total consumption expenditure
0%
2%
4%
6%
8%
10%
1960 65 70 75 80 85 90 95 2000 05 10 15
Global context
21© Bloomberg Finance L.P. 2017. Developed in partnership with The Business Council for Sustainable Energy.
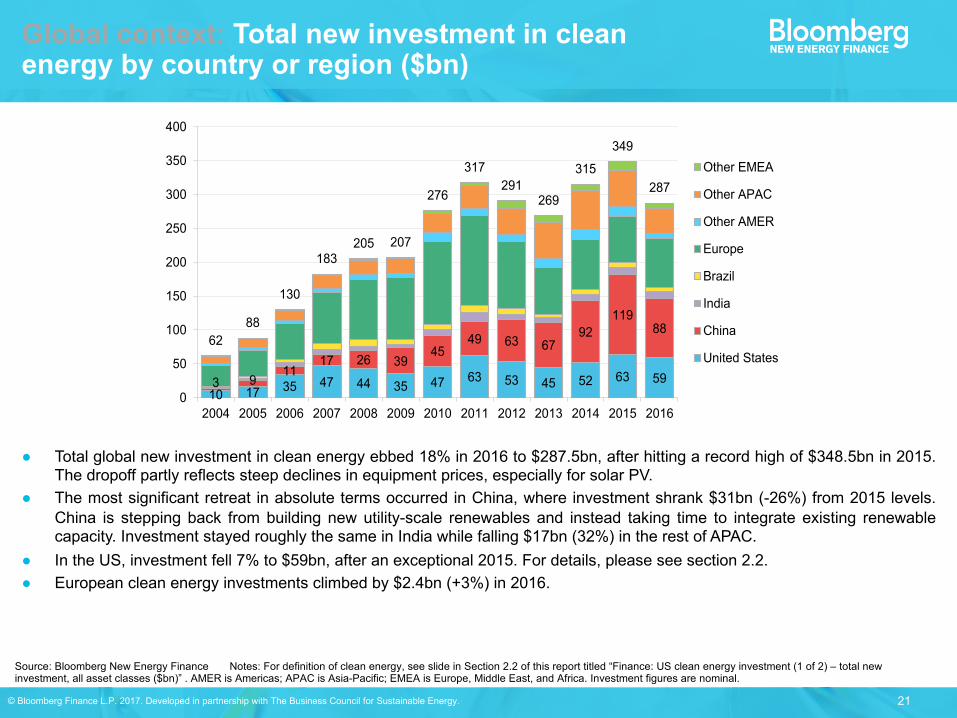
Global context: Total new investment in clean energy by country or region ($bn)
Total global new investment in clean energy ebbed 18% in 2016 to $287.5bn, after hitting a record high of $348.5bn in 2015.The dropoff partly reflects steep declines in equipment prices, especially for solar PV.
The most significant retreat in absolute terms occurred in China, where investment shrank $31bn (-26%) from 2015 levels.China is stepping back from building new utility-scale renewables and instead taking time to integrate existing renewablecapacity. Investment stayed roughly the same in India while falling $17bn (32%) in the rest of APAC.
In the US, investment fell 7% to $59bn, after an exceptional 2015. For details, please see section 2.2. European clean energy investments climbed by $2.4bn (+3%) in 2016.
Source: Bloomberg New Energy Finance Notes: For definition of clean energy, see slide in Section 2.2 of this report titled “Finance: US clean energy investment (1 of 2) – total new investment, all asset classes ($bn)” . AMER is Americas;; APAC is Asia-Pacific;; EMEA is Europe, Middle East, and Africa. Investment figures are nominal.
10 17 35 47 44 35 47 63 53 45 52 63 593 911
17 26 3945
49 63 6792
11988
6288
130
183205 207
276
317291
269
315
349
287
0
50
100
150
200
250
300
350
400
2004 2005 2006 2007 2008 2009 2010 2011 2012 2013 2014 2015 2016
Other EMEA
Other APAC
Other AMER
Europe
Brazil
India
China
United States
22© Bloomberg Finance L.P. 2017. Developed in partnership with The Business Council for Sustainable Energy.
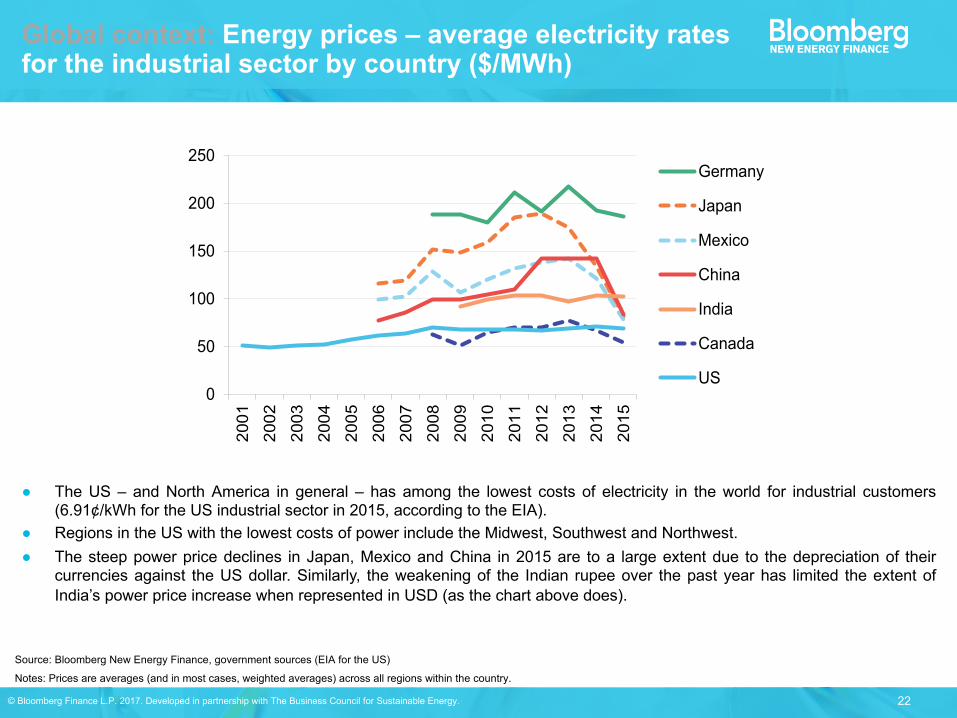
Global context: Energy prices – average electricity rates for the industrial sector by country ($/MWh)
The US – and North America in general – has among the lowest costs of electricity in the world for industrial customers(6.91¢/kWh for the US industrial sector in 2015, according to the EIA).
Regions in the US with the lowest costs of power include the Midwest, Southwest and Northwest. The steep power price declines in Japan, Mexico and China in 2015 are to a large extent due to the depreciation of their
currencies against the US dollar. Similarly, the weakening of the Indian rupee over the past year has limited the extent ofIndia’s power price increase when represented in USD (as the chart above does).
Source: Bloomberg New Energy Finance, government sources (EIA for the US)
Notes: Prices are averages (and in most cases, weighted averages) across all regions within the country.
0
50
100
150
200
250
2001
2002
2003
2004
2005
2006
2007
2008
2009
2010
2011
2012
2013
2014
2015
Germany
Japan
Mexico
China
India
Canada
US
Corporate action
24© Bloomberg Finance L.P. 2017. Developed in partnership with The Business Council for Sustainable Energy.
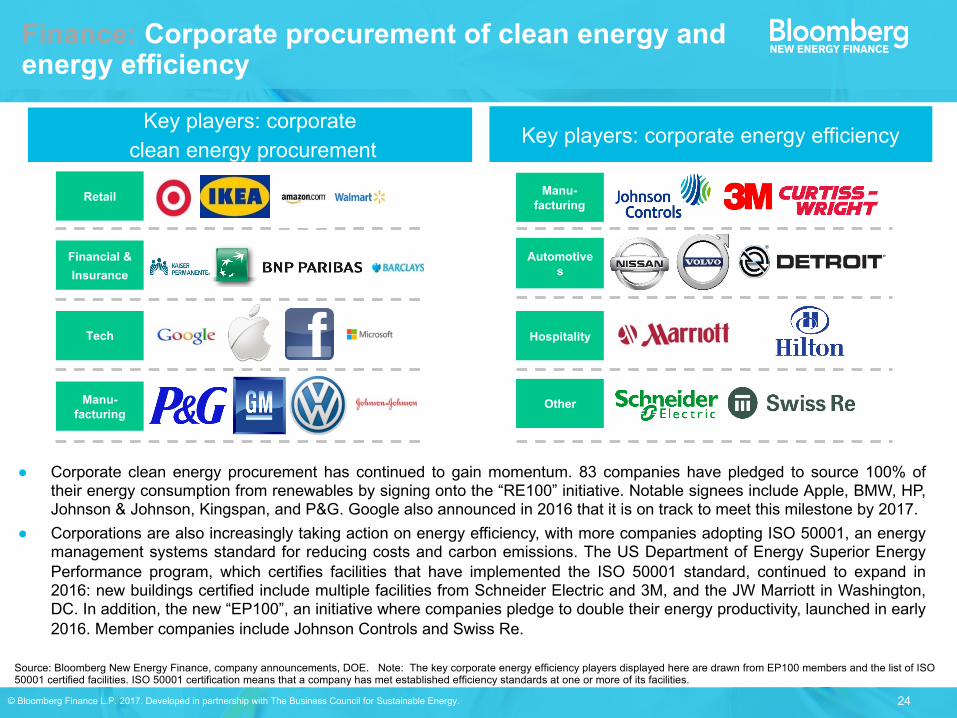
Source: Bloomberg New Energy Finance, company announcements, DOE. Note: The key corporate energy efficiency players displayed here are drawn from EP100 members and the list of ISO 50001 certified facilities. ISO 50001 certification means that a company has met established efficiency standards at one or more of its facilities.
Finance: Corporate procurement of clean energy and energy efficiency
Key players: corporateclean energy procurement
Key players: corporate energy efficiency
Corporate clean energy procurement has continued to gain momentum. 83 companies have pledged to source 100% oftheir energy consumption from renewables by signing onto the “RE100” initiative. Notable signees include Apple, BMW, HP,Johnson & Johnson, Kingspan, and P&G. Google also announced in 2016 that it is on track to meet this milestone by 2017.
Corporations are also increasingly taking action on energy efficiency, with more companies adopting ISO 50001, an energymanagement systems standard for reducing costs and carbon emissions. The US Department of Energy Superior EnergyPerformance program, which certifies facilities that have implemented the ISO 50001 standard, continued to expand in2016: new buildings certified include multiple facilities from Schneider Electric and 3M, and the JW Marriott in Washington,DC. In addition, the new “EP100”, an initiative where companies pledge to double their energy productivity, launched in early2016. Member companies include Johnson Controls and Swiss Re.
Retail
Financial &Insurance
Tech
Manu-facturing
Automotives
Other
Hospitality
Manu-facturing
Combined Heat and Power Markets

26© Bloomberg Finance L.P. 2017. Developed in partnership with The Business Council for Sustainable Energy.
318440 390 416
572422
1,257
167
156
233 241 287
280291
134
261
110
41510
708 647
717
962
729
1,397
469
0102030405060708090100
0
300
600
900
1,200
1,500
2008 2009 2010 2011 2012 2013 2014 2015
Other Commercial Industrial
Cumulative capacity
Deployment: US CHP build and generation
US CHP build (MW) and capacity (GW) US CHP generation (from plants tracked by EIA generation data) (TWh)
Installations sunk in 2015 to 469MW, following a 2014 peak of 1,397MW. The drop-off came on the back of a 87% year-on-year decline in industrial installments.
Cumulative capacity for CHP dipped from 82.7GW to 81.1GW due to site retirements and industrial plant closures. The exceptional CHP build in 2014 was accompanied by a corresponding uptick in generation, which persisted in 2015. 2016
generation is expected to remain close to the previous year’s level and contribute 9% of total US generation. Data may underestimate total CHP production because they do not reflect some newer installations, which tend to be smaller
in size and excluded from EIA estimates (see notes below).
Incremental (MW) Cumulative (GW)
Source: Bloomberg New Energy Finance, DOE CHP Installation Database (maintained by ICF, Inc.) Notes: EIA is the best available source for generation data. However, EIA data on CHP is notcomprehensive and so the generation figures are underestimated. Specifically, EIA does not collect data for sites <1MW;; EIA may not be aware of certain installations and thus may not send these sites asurvey for reporting;; and EIA categorizes some CHP systems as 'electric power' rather than 'industrial CHP', if these systems sell power to the grid while providing steam to an adjacent facility. Values for2016 are projected, accounting for seasonality, based on latest monthly values from EIA (data available through November 2016).
305 293 305 301 309 294
367 374 365
0
50
100
150
200
250
300
350
400
2008 2009 2010 2011 2012 2013 2014 2015 2016
27© Bloomberg Finance L.P. 2017. Developed in partnership with The Business Council for Sustainable Energy.
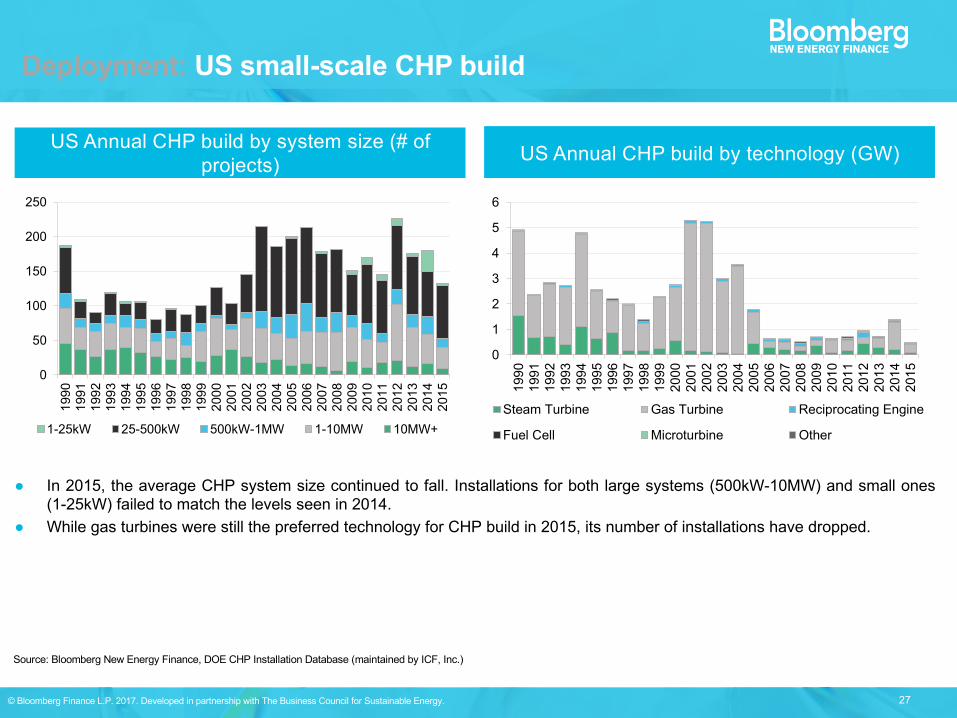
Deployment: US small-scale CHP build
Source: Bloomberg New Energy Finance, DOE CHP Installation Database (maintained by ICF, Inc.)
US Annual CHP build by system size (# of projects)
In 2015, the average CHP system size continued to fall. Installations for both large systems (500kW-10MW) and small ones(1-25kW) failed to match the levels seen in 2014.
While gas turbines were still the preferred technology for CHP build in 2015, its number of installations have dropped.
US Annual CHP build by technology (GW)
0
50
100
150
200
250
1990
1991
1992
1993
1994
1995
1996
1997
1998
1999
2000
2001
2002
2003
2004
2005
2006
2007
2008
2009
2010
2011
2012
2013
2014
2015
1-25kW 25-500kW 500kW-1MW 1-10MW 10MW+
0
1
2
3
4
5
6
1990
1991
1992
1993
1994
1995
1996
1997
1998
1999
2000
2001
2002
2003
2004
2005
2006
2007
2008
2009
2010
2011
2012
2013
2014
2015
Steam Turbine Gas Turbine Reciprocating Engine
Fuel Cell Microturbine Other
28© Bloomberg Finance L.P. 2017. Developed in partnership with The Business Council for Sustainable Energy.
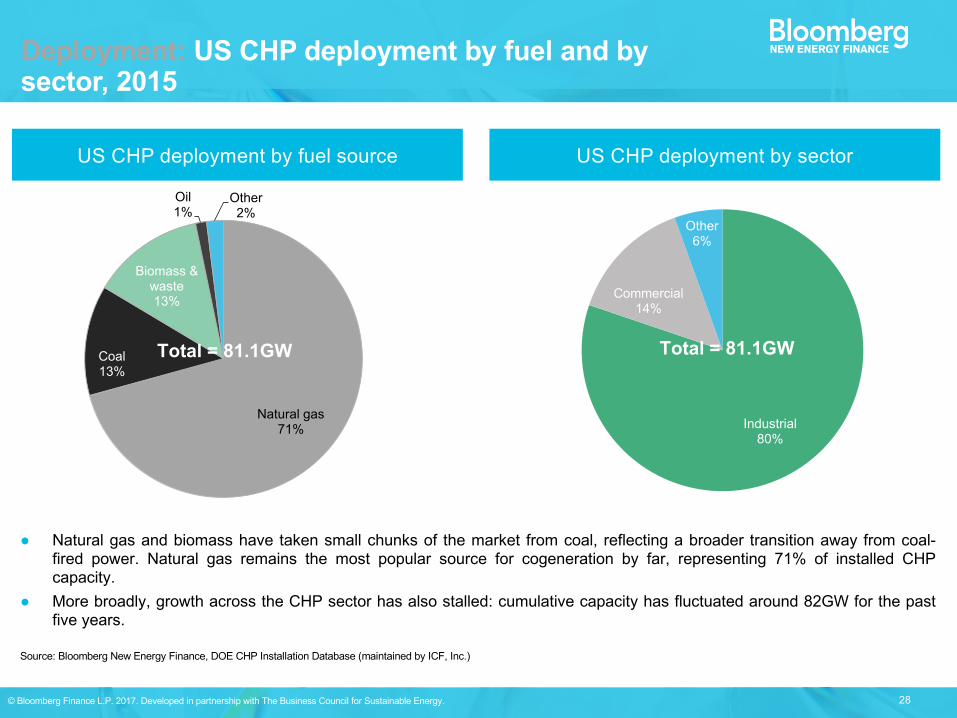
Natural gas and biomass have taken small chunks of the market from coal, reflecting a broader transition away from coal-fired power. Natural gas remains the most popular source for cogeneration by far, representing 71% of installed CHPcapacity.
More broadly, growth across the CHP sector has also stalled: cumulative capacity has fluctuated around 82GW for the pastfive years.
Deployment: US CHP deployment by fuel and by sector, 2015
US CHP deployment by fuel source US CHP deployment by sector
Source: Bloomberg New Energy Finance, DOE CHP Installation Database (maintained by ICF, Inc.)
Natural gas71%
Coal13%
Biomass & waste13%
Oil1%
Other2%
Total = 81.1GW
Industrial80%
Commercial14%
Other6%
Total = 81.1GW
29© Bloomberg Finance L.P. 2017. Developed in partnership with The Business Council for Sustainable Energy.
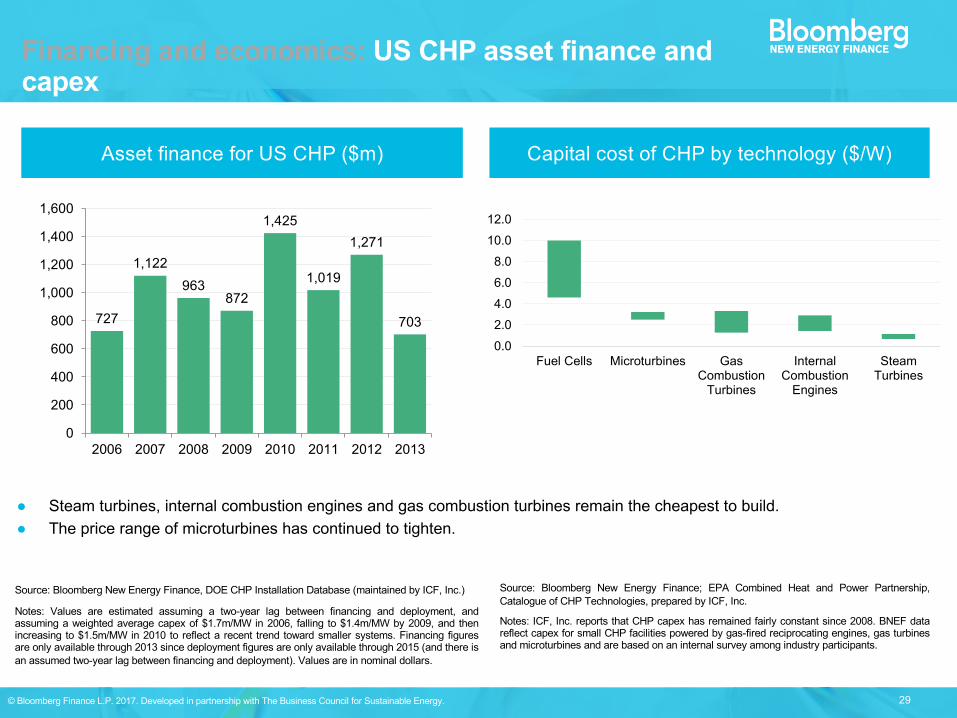
Steam turbines, internal combustion engines and gas combustion turbines remain the cheapest to build. The price range of microturbines has continued to tighten.
Financing and economics: US CHP asset finance and capex
Asset finance for US CHP ($m) Capital cost of CHP by technology ($/W)
Source: Bloomberg New Energy Finance, DOE CHP Installation Database (maintained by ICF, Inc.)
Notes: Values are estimated assuming a two-year lag between financing and deployment, andassuming a weighted average capex of $1.7m/MW in 2006, falling to $1.4m/MW by 2009, and thenincreasing to $1.5m/MW in 2010 to reflect a recent trend toward smaller systems. Financing figuresare only available through 2013 since deployment figures are only available through 2015 (and there isan assumed two-year lag between financing and deployment). Values are in nominal dollars.
Source: Bloomberg New Energy Finance;; EPA Combined Heat and Power Partnership,Catalogue of CHP Technologies, prepared by ICF, Inc.
Notes: ICF, Inc. reports that CHP capex has remained fairly constant since 2008. BNEF datareflect capex for small CHP facilities powered by gas-fired reciprocating engines, gas turbinesand microturbines and are based on an internal survey among industry participants.
0.02.04.06.08.010.012.0
Fuel Cells Microturbines GasCombustionTurbines
InternalCombustionEngines
SteamTurbines
727
1,122963
872
1,425
1,019
1,271
703
0
200
400
600
800
1,000
1,200
1,400
1,600
2006 2007 2008 2009 2010 2011 2012 2013
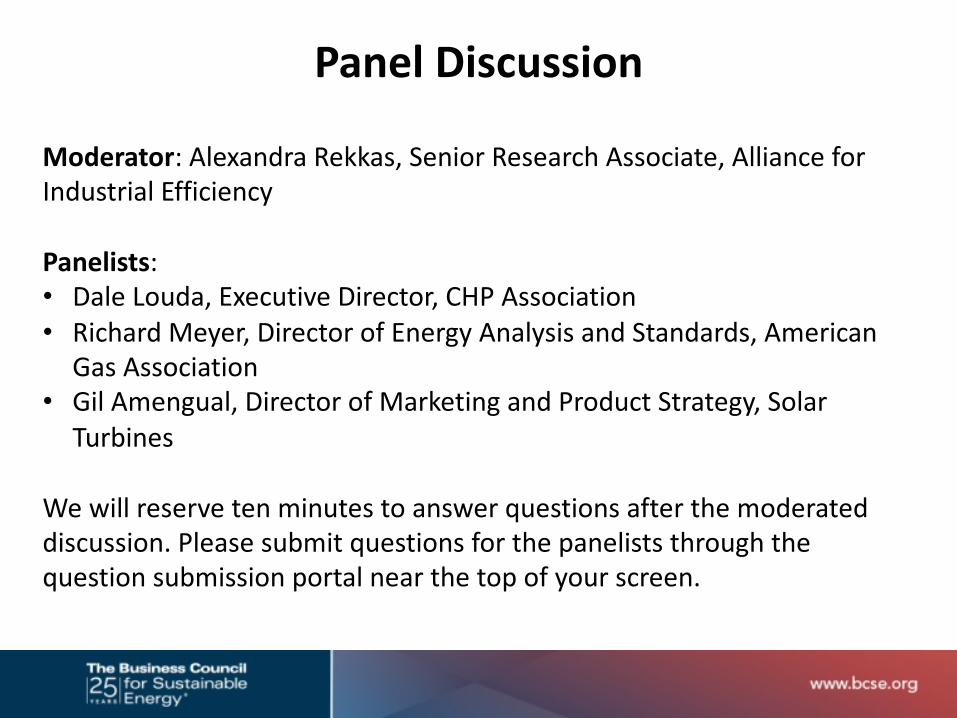
Moderator: Alexandra Rekkas, Senior Research Associate, Alliance for Industrial Efficiency
Panelists: • Dale Louda, Executive Director, CHP Association• Richard Meyer, Director of Energy Analysis and Standards, American
Gas Association• Gil Amengual, Director of Marketing and Product Strategy, Solar
Turbines
We will reserve ten minutes to answer questions after the moderated discussion. Please submit questions for the panelists through the question submission portal near the top of your screen.
Panel Discussion

The 2017 Sustainable Energy in America Factbook is available for free to download at: http://bit.ly/BCSEfactbook
AIE’s report, State Ranking of Potential Carbon Dioxide Emission Reductions through Industrial Energy Efficiency is available at: http://bit.ly/AIEstateRankings2016
As a reminder, a recording of this webinar will be sent out to all registrants within several days. Should you not receive a copy and wish to access a recorded version of this webinar please contact Andy Barnes at [email protected].
Participating organizations are listed below along with contact information of their representatives:
Alliance for Industrial EfficiencyAlexandra Rekkas: [email protected]
American Gas AssociationRichard Meyer: [email protected]
Business Council for Sustainable EnergyLisa Jacobson: [email protected]
CHP AssociationDale Louda: [email protected]
Solar TurbinesGil Amengual: [email protected]
Thank you for Joining Us!