chp6
DESCRIPTION
dTRANSCRIPT
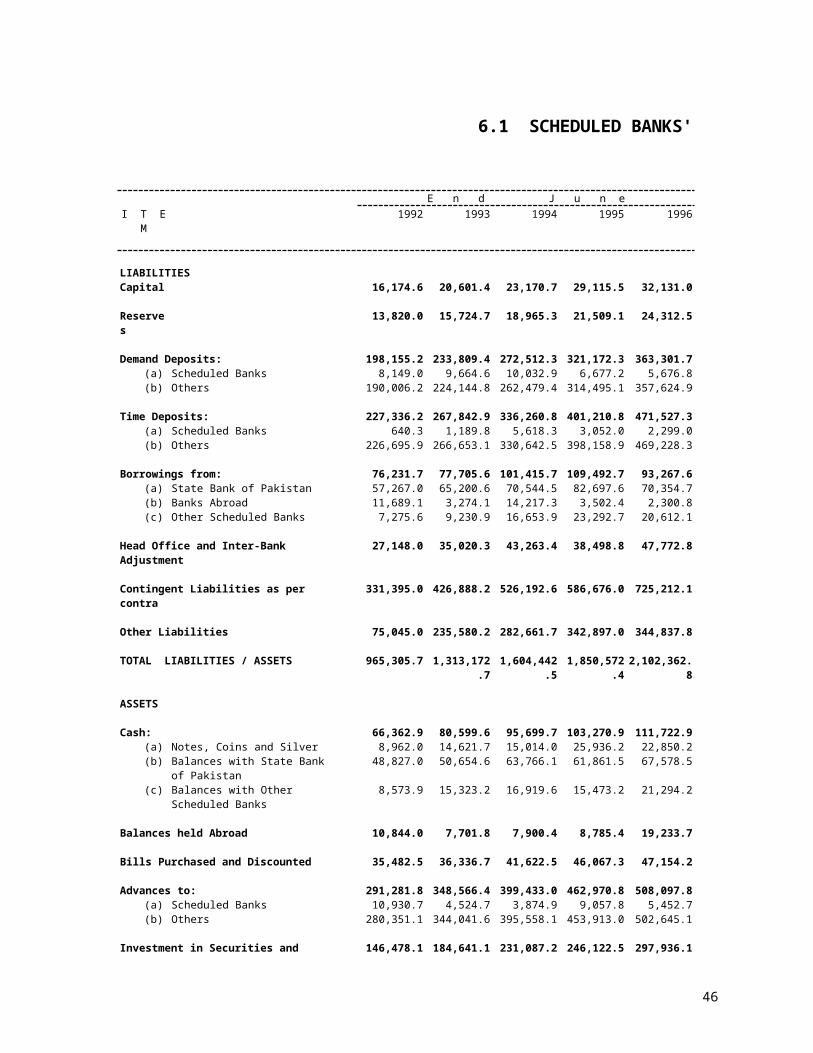
6.1 SCHEDULED BANKS'
E n d J u n eI T E M 1992 1993 1994 1995 1996
LIABILITIESCapital 16,174.6 20,601.4 23,170.7 29,115.5 32,131.0
Reserves 13,820.0 15,724.7 18,965.3 21,509.1 24,312.5
Demand Deposits: 198,155.2 233,809.4 272,512.3 321,172.3 363,301.7(a) Scheduled Banks 8,149.0 9,664.6 10,032.9 6,677.2 5,676.8(b) Others 190,006.2 224,144.8 262,479.4 314,495.1 357,624.9
Time Deposits: 227,336.2 267,842.9 336,260.8 401,210.8 471,527.3(a) Scheduled Banks 640.3 1,189.8 5,618.3 3,052.0 2,299.0(b) Others 226,695.9 266,653.1 330,642.5 398,158.9 469,228.3
Borrowings from: 76,231.7 77,705.6 101,415.7 109,492.7 93,267.6(a) State Bank of Pakistan 57,267.0 65,200.6 70,544.5 82,697.6 70,354.7(b) Banks Abroad 11,689.1 3,274.1 14,217.3 3,502.4 2,300.8(c) Other Scheduled Banks 7,275.6 9,230.9 16,653.9 23,292.7 20,612.1
Head Office and Inter-Bank Adjustment 27,148.0 35,020.3 43,263.4 38,498.8 47,772.8
Contingent Liabilities as per contra 331,395.0 426,888.2 526,192.6 586,676.0 725,212.1
Other Liabilities 75,045.0 235,580.2 282,661.7 342,897.0 344,837.8
TOTAL LIABILITIES / ASSETS 965,305.7 1,313,172.7 1,604,442.5 1,850,572.4 2,102,362.8
ASSETS
Cash: 66,362.9 80,599.6 95,699.7 103,270.9 111,722.9(a) Notes, Coins and Silver 8,962.0 14,621.7 15,014.0 25,936.2 22,850.2(b) Balances with State Bank of Pakistan 48,827.0 50,654.6 63,766.1 61,861.5 67,578.5(c) Balances with Other Scheduled Banks 8,573.9 15,323.2 16,919.6 15,473.2 21,294.2
Balances held Abroad 10,844.0 7,701.8 7,900.4 8,785.4 19,233.7
Bills Purchased and Discounted 35,482.5 36,336.7 41,622.5 46,067.3 47,154.2
Advances to: 291,281.8 348,566.4 399,433.0 462,970.8 508,097.8(a) Scheduled Banks 10,930.7 4,524.7 3,874.9 9,057.8 5,452.7(b) Others 280,351.1 344,041.6 395,558.1 453,913.0 502,645.1
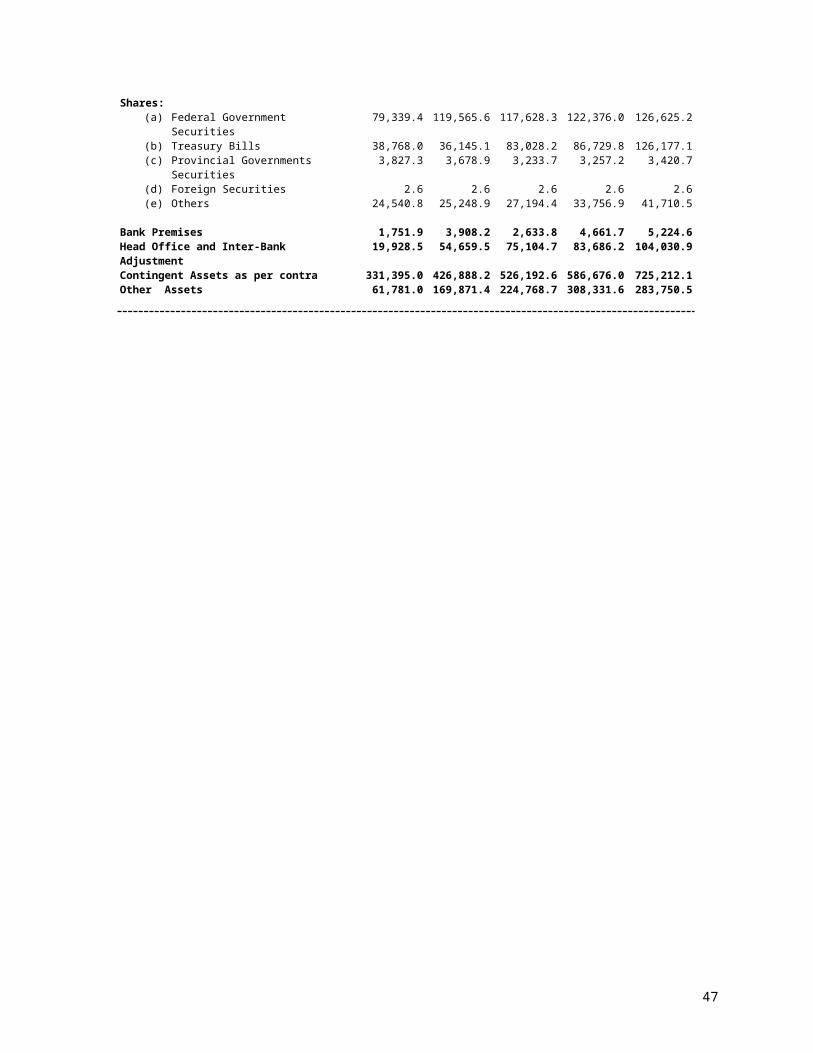
Investment in Securities and Shares: 146,478.1 184,641.1 231,087.2 246,122.5 297,936.1(a) Federal Government Securities 79,339.4 119,565.6 117,628.3 122,376.0 126,625.2(b) Treasury Bills 38,768.0 36,145.1 83,028.2 86,729.8 126,177.1(c) Provincial Governments Securities 3,827.3 3,678.9 3,233.7 3,257.2 3,420.7(d) Foreign Securities 2.6 2.6 2.6 2.6 2.6(e) Others 24,540.8 25,248.9 27,194.4 33,756.9 41,710.5
Bank Premises 1,751.9 3,908.2 2,633.8 4,661.7 5,224.6Head Office and Inter-Bank Adjustment 19,928.5 54,659.5 75,104.7 83,686.2 104,030.9Contingent Assets as per contra 331,395.0 426,888.2 526,192.6 586,676.0 725,212.1Other Assets 61,781.0 169,871.4 224,768.7 308,331.6 283,750.5
46
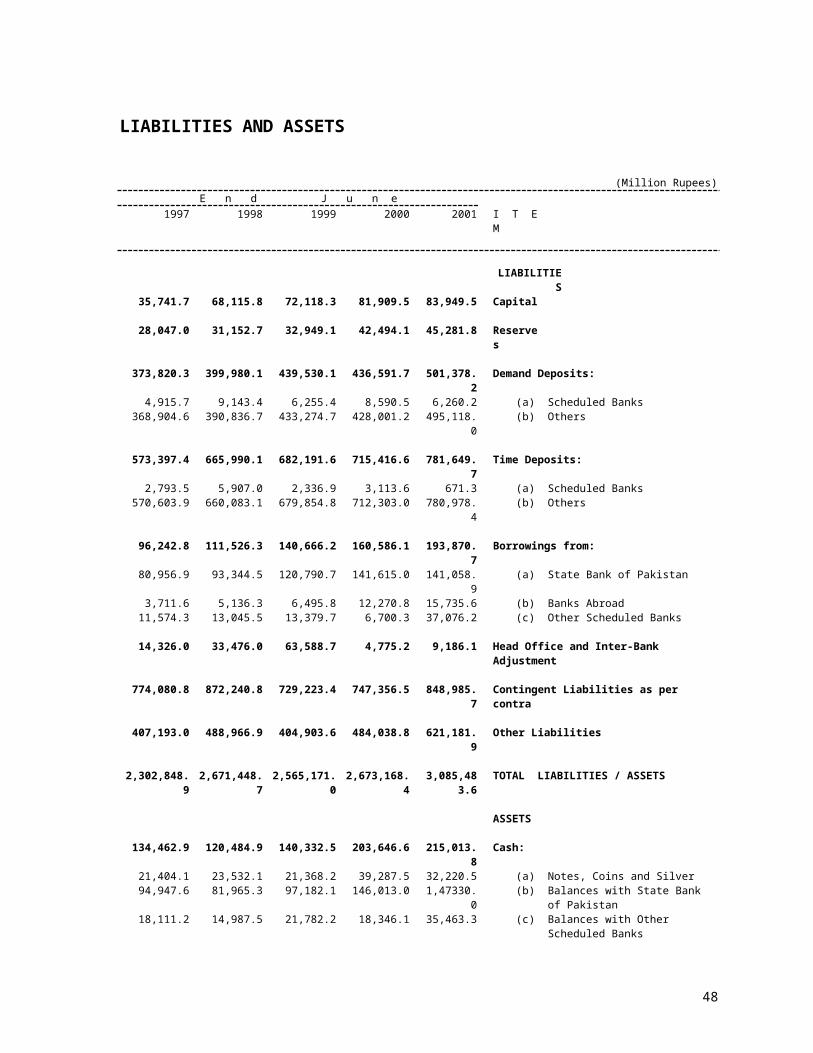
LIABILITIES AND ASSETS
(Million Rupees)E n d J u n e
1997 1998 1999 2000 2001 I T E M
LIABILITIES35,741.7 68,115.8 72,118.3 81,909.5 83,949.5 Capital
28,047.0 31,152.7 32,949.1 42,494.1 45,281.8 Reserves
373,820.3 399,980.1 439,530.1 436,591.7 501,378.2 Demand Deposits:4,915.7 9,143.4 6,255.4 8,590.5 6,260.2 (a) Scheduled Banks
368,904.6 390,836.7 433,274.7 428,001.2 495,118.0 (b) Others
573,397.4 665,990.1 682,191.6 715,416.6 781,649.7 Time Deposits:2,793.5 5,907.0 2,336.9 3,113.6 671.3 (a) Scheduled Banks
570,603.9 660,083.1 679,854.8 712,303.0 780,978.4 (b) Others
96,242.8 111,526.3 140,666.2 160,586.1 193,870.7 Borrowings from:80,956.9 93,344.5 120,790.7 141,615.0 141,058.9 (a) State Bank of Pakistan
3,711.6 5,136.3 6,495.8 12,270.8 15,735.6 (b) Banks Abroad11,574.3 13,045.5 13,379.7 6,700.3 37,076.2 (c) Other Scheduled Banks
14,326.0 33,476.0 63,588.7 4,775.2 9,186.1 Head Office and Inter-Bank Adjustment
774,080.8 872,240.8 729,223.4 747,356.5 848,985.7 Contingent Liabilities as per contra
407,193.0 488,966.9 404,903.6 484,038.8 621,181.9 Other Liabilities
2,302,848.9 2,671,448.7 2,565,171.0 2,673,168.4 3,085,483.6 TOTAL LIABILITIES / ASSETS
ASSETS
134,462.9 120,484.9 140,332.5 203,646.6 215,013.8 Cash:21,404.1 23,532.1 21,368.2 39,287.5 32,220.5 (a) Notes, Coins and Silver94,947.6 81,965.3 97,182.1 146,013.0 1,47330.0 (b) Balances with State Bank of Pakistan18,111.2 14,987.5 21,782.2 18,346.1 35,463.3 (c) Balances with Other Scheduled Banks
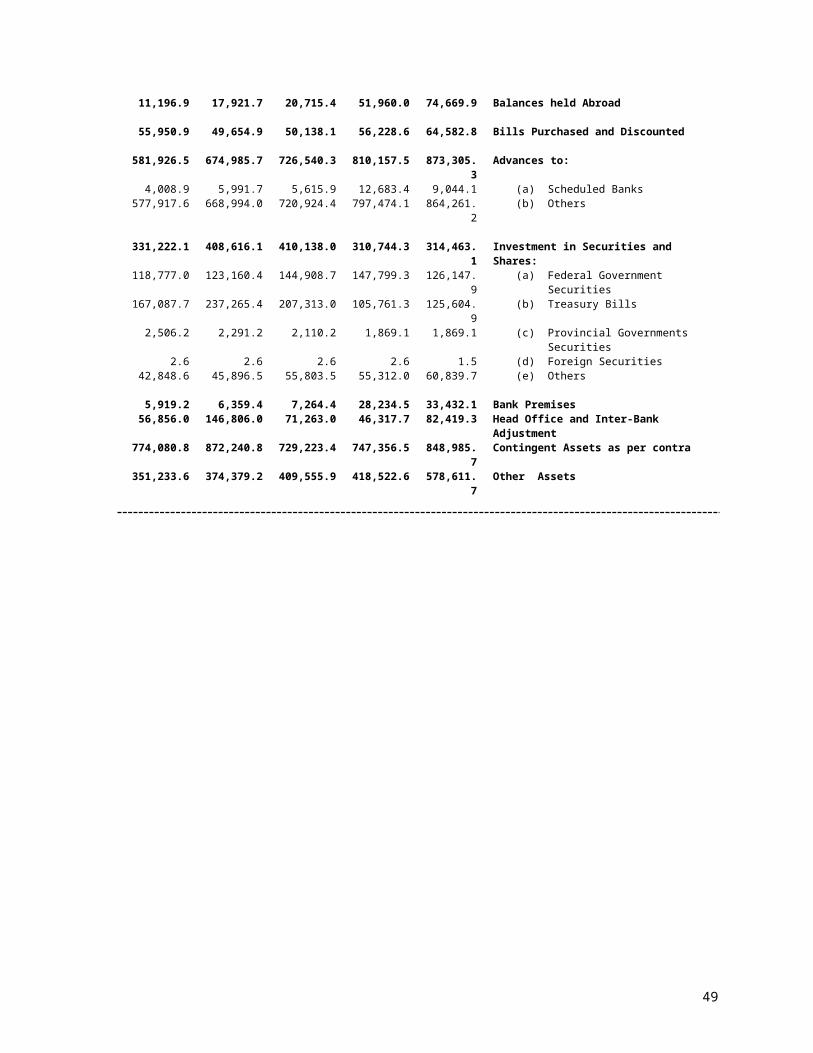
11,196.9 17,921.7 20,715.4 51,960.0 74,669.9 Balances held Abroad
55,950.9 49,654.9 50,138.1 56,228.6 64,582.8 Bills Purchased and Discounted
581,926.5 674,985.7 726,540.3 810,157.5 873,305.3 Advances to:4,008.9 5,991.7 5,615.9 12,683.4 9,044.1 (a) Scheduled Banks
577,917.6 668,994.0 720,924.4 797,474.1 864,261.2 (b) Others
331,222.1 408,616.1 410,138.0 310,744.3 314,463.1 Investment in Securities and Shares:118,777.0 123,160.4 144,908.7 147,799.3 126,147.9 (a) Federal Government Securities167,087.7 237,265.4 207,313.0 105,761.3 125,604.9 (b) Treasury Bills
2,506.2 2,291.2 2,110.2 1,869.1 1,869.1 (c) Provincial Governments Securities2.6 2.6 2.6 2.6 1.5 (d) Foreign Securities
42,848.6 45,896.5 55,803.5 55,312.0 60,839.7 (e) Others
5,919.2 6,359.4 7,264.4 28,234.5 33,432.1 Bank Premises56,856.0 146,806.0 71,263.0 46,317.7 82,419.3 Head Office and Inter-Bank Adjustment
774,080.8 872,240.8 729,223.4 747,356.5 848,985.7 Contingent Assets as per contra351,233.6 374,379.2 409,555.9 418,522.6 578,611.7 Other Assets
47
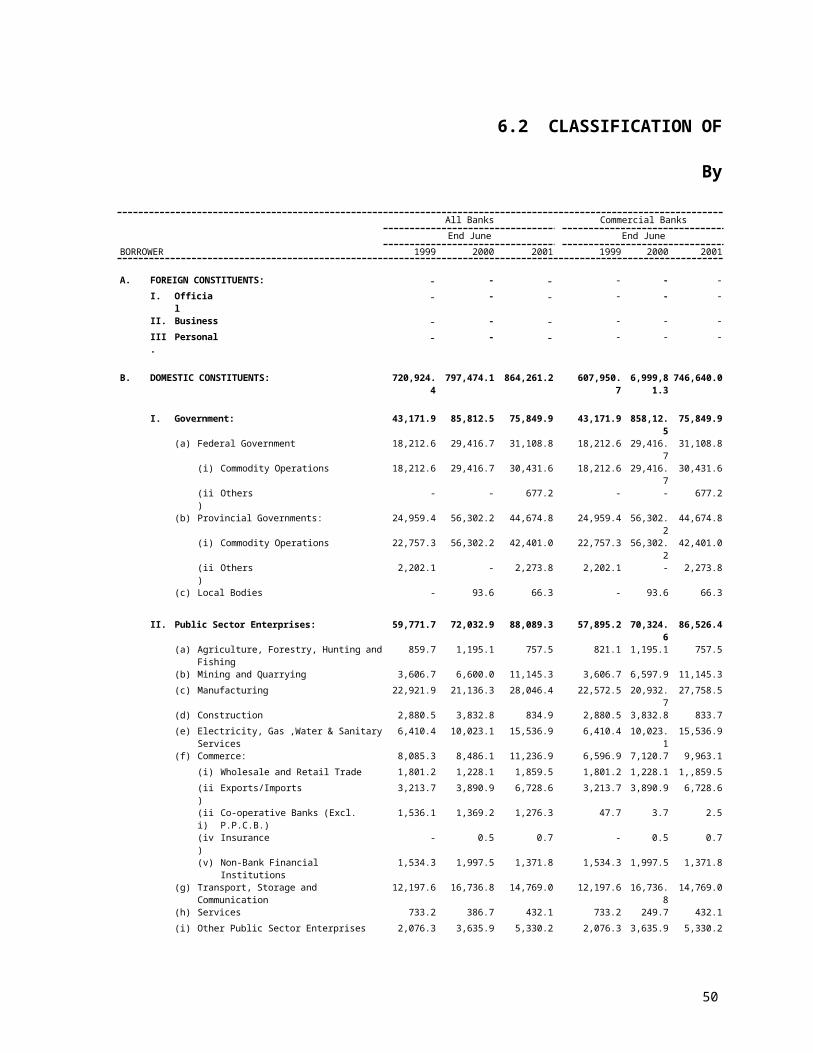
6.2 CLASSIFICATION OF
By
All Banks Commercial Banks
End June End June
BORROWER 1999 2000 2001 1999 2000 2001
A. FOREIGN CONSTITUENTS: - - - - - -
I. Official - - - - - -
II. Business - - - - - -
III. Personal - - - - - -
B. DOMESTIC CONSTITUENTS: 720,924.4 797,474.1 864,261.2 607,950.7 6,999,81.3 746,640.0
I. Government: 43,171.9 85,812.5 75,849.9 43,171.9 858,12.5 75,849.9
(a) Federal Government 18,212.6 29,416.7 31,108.8 18,212.6 29,416.7 31,108.8
(i) Commodity Operations 18,212.6 29,416.7 30,431.6 18,212.6 29,416.7 30,431.6
(ii) Others - - 677.2 - - 677.2
(b) Provincial Governments: 24,959.4 56,302.2 44,674.8 24,959.4 56,302.2 44,674.8
(i) Commodity Operations 22,757.3 56,302.2 42,401.0 22,757.3 56,302.2 42,401.0
(ii) Others 2,202.1 - 2,273.8 2,202.1 - 2,273.8
(c) Local Bodies - 93.6 66.3 - 93.6 66.3
II. Public Sector Enterprises: 59,771.7 72,032.9 88,089.3 57,895.2 70,324.6 86,526.4
(a) Agriculture, Forestry, Hunting and Fishing 859.7 1,195.1 757.5 821.1 1,195.1 757.5
(b) Mining and Quarrying 3,606.7 6,600.0 11,145.3 3,606.7 6,597.9 11,145.3
(c) Manufacturing 22,921.9 21,136.3 28,046.4 22,572.5 20,932.7 27,758.5
(d) Construction 2,880.5 3,832.8 834.9 2,880.5 3,832.8 833.7
(e) Electricity, Gas ,Water & Sanitary Services 6,410.4 10,023.1 15,536.9 6,410.4 10,023.1 15,536.9
(f) Commerce: 8,085.3 8,486.1 11,236.9 6,596.9 7,120.7 9,963.1
(i) Wholesale and Retail Trade 1,801.2 1,228.1 1,859.5 1,801.2 1,228.1 1,,859.5
(ii) Exports/Imports 3,213.7 3,890.9 6,728.6 3,213.7 3,890.9 6,728.6
(iii) Co-operative Banks (Excl. P.P.C.B.) 1,536.1 1,369.2 1,276.3 47.7 3.7 2.5
(iv) Insurance - 0.5 0.7 - 0.5 0.7
(v) Non-Bank Financial Institutions 1,534.3 1,997.5 1,371.8 1,534.3 1,997.5 1,371.8
(g) Transport, Storage and Communication 12,197.6 16,736.8 14,769.0 12,197.6 16,736.8 14,769.0
(h) Services 733.2 386.7 432.1 733.2 249.7 432.1
(i) Other Public Sector Enterprises 2,076.3 3,635.9 5,330.2 2,076.3 3,635.9 5,330.2
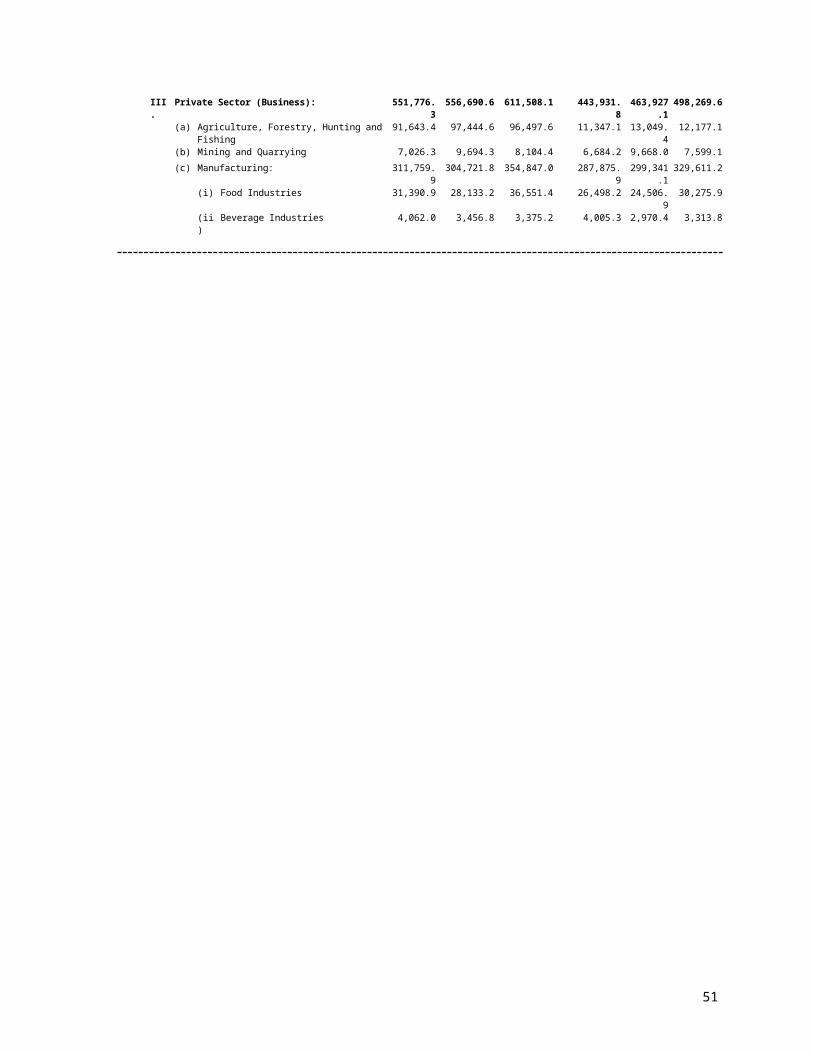
III. Private Sector (Business): 551,776.3 556,690.6 611,508.1 443,931.8 463,927.1 498,269.6
(a) Agriculture, Forestry, Hunting and Fishing 91,643.4 97,444.6 96,497.6 11,347.1 13,049.4 12,177.1
(b) Mining and Quarrying 7,026.3 9,694.3 8,104.4 6,684.2 9,668.0 7,599.1
(c) Manufacturing: 311,759.9 304,721.8 354,847.0 287,875.9 299,341.1 329,611.2
(i) Food Industries 31,390.9 28,133.2 36,551.4 26,498.2 24,506.9 30,275.9
(ii) Beverage Industries 4,062.0 3,456.8 3,375.2 4,005.3 2,970.4 3,313.8
48
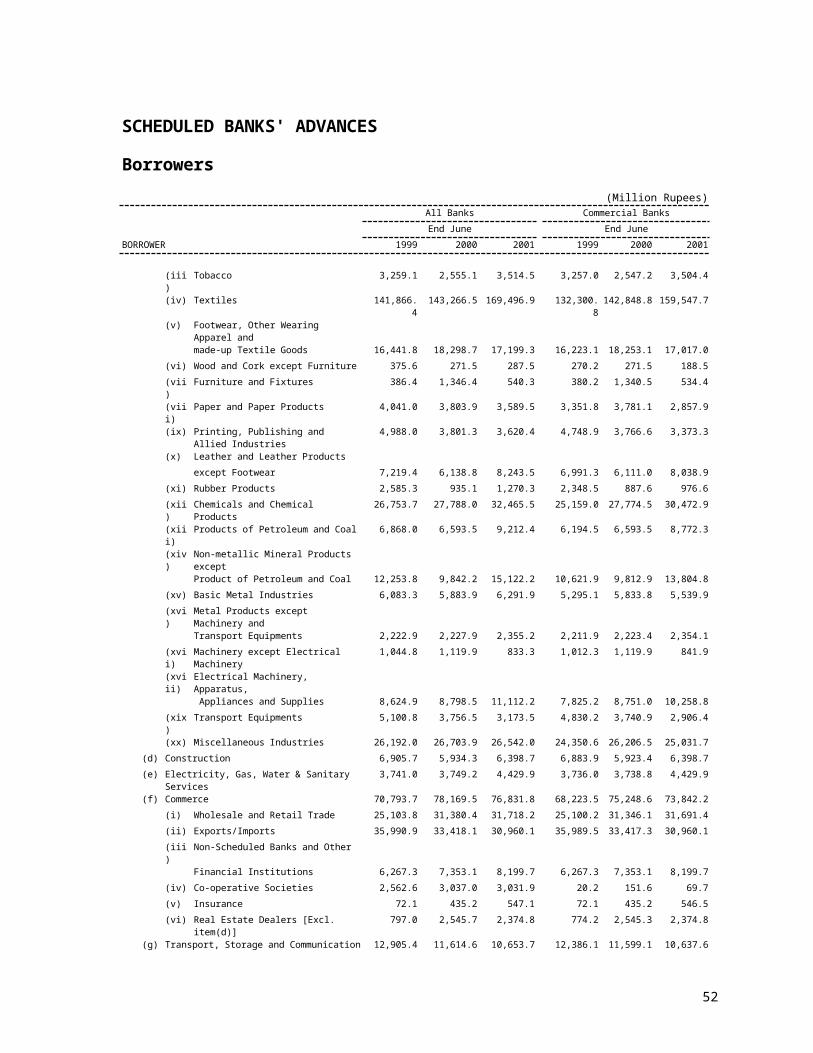
SCHEDULED BANKS' ADVANCES
Borrowers
(Million Rupees)
All Banks Commercial Banks
End June End June
BORROWER 1999 2000 2001 1999 2000 2001
(iii) Tobacco 3,259.1 2,555.1 3,514.5 3,257.0 2,547.2 3,504.4
(iv) Textiles 141,866.4 143,266.5 169,496.9 132,300.8 142,848.8 159,547.7
(v) Footwear, Other Wearing Apparel and
made-up Textile Goods 16,441.8 18,298.7 17,199.3 16,223.1 18,253.1 17,017.0
(vi) Wood and Cork except Furniture 375.6 271.5 287.5 270.2 271.5 188.5
(vii) Furniture and Fixtures 386.4 1,346.4 540.3 380.2 1,340.5 534.4
(viii) Paper and Paper Products 4,041.0 3,803.9 3,589.5 3,351.8 3,781.1 2,857.9
(ix) Printing, Publishing and Allied Industries 4,988.0 3,801.3 3,620.4 4,748.9 3,766.6 3,373.3
(x) Leather and Leather Products
except Footwear 7,219.4 6,138.8 8,243.5 6,991.3 6,111.0 8,038.9
(xi) Rubber Products 2,585.3 935.1 1,270.3 2,348.5 887.6 976.6
(xii) Chemicals and Chemical Products 26,753.7 27,788.0 32,465.5 25,159.0 27,774.5 30,472.9
(xiii) Products of Petroleum and Coal 6,868.0 6,593.5 9,212.4 6,194.5 6,593.5 8,772.3
(xiv) Non-metallic Mineral Products except
Product of Petroleum and Coal 12,253.8 9,842.2 15,122.2 10,621.9 9,812.9 13,804.8
(xv) Basic Metal Industries 6,083.3 5,883.9 6,291.9 5,295.1 5,833.8 5,539.9
(xvi) Metal Products except Machinery and
Transport Equipments 2,222.9 2,227.9 2,355.2 2,211.9 2,223.4 2,354.1
(xvii) Machinery except Electrical Machinery 1,044.8 1,119.9 833.3 1,012.3 1,119.9 841.9
(xviii) Electrical Machinery, Apparatus,
Appliances and Supplies 8,624.9 8,798.5 11,112.2 7,825.2 8,751.0 10,258.8
(xix) Transport Equipments 5,100.8 3,756.5 3,173.5 4,830.2 3,740.9 2,906.4
(xx) Miscellaneous Industries 26,192.0 26,703.9 26,542.0 24,350.6 26,206.5 25,031.7
(d) Construction 6,905.7 5,934.3 6,398.7 6,883.9 5,923.4 6,398.7
(e) Electricity, Gas, Water & Sanitary Services 3,741.0 3,749.2 4,429.9 3,736.0 3,738.8 4,429.9
(f) Commerce 70,793.7 78,169.5 76,831.8 68,223.5 75,248.6 73,842.2
(i) Wholesale and Retail Trade 25,103.8 31,380.4 31,718.2 25,100.2 31,346.1 31,691.4
(ii) Exports/Imports 35,990.9 33,418.1 30,960.1 35,989.5 33,417.3 30,960.1
(iii) Non-Scheduled Banks and Other
Financial Institutions 6,267.3 7,353.1 8,199.7 6,267.3 7,353.1 8,199.7
(iv) Co-operative Societies 2,562.6 3,037.0 3,031.9 20.2 151.6 69.7
(v) Insurance 72.1 435.2 547.1 72.1 435.2 546.5
(vi) Real Estate Dealers [Excl. item(d)] 797.0 2,545.7 2,374.8 774.2 2,545.3 2,374.8
(g) Transport, Storage and Communication 12,905.4 11,614.6 10,653.7 12,386.1 11,599.1 10,637.6
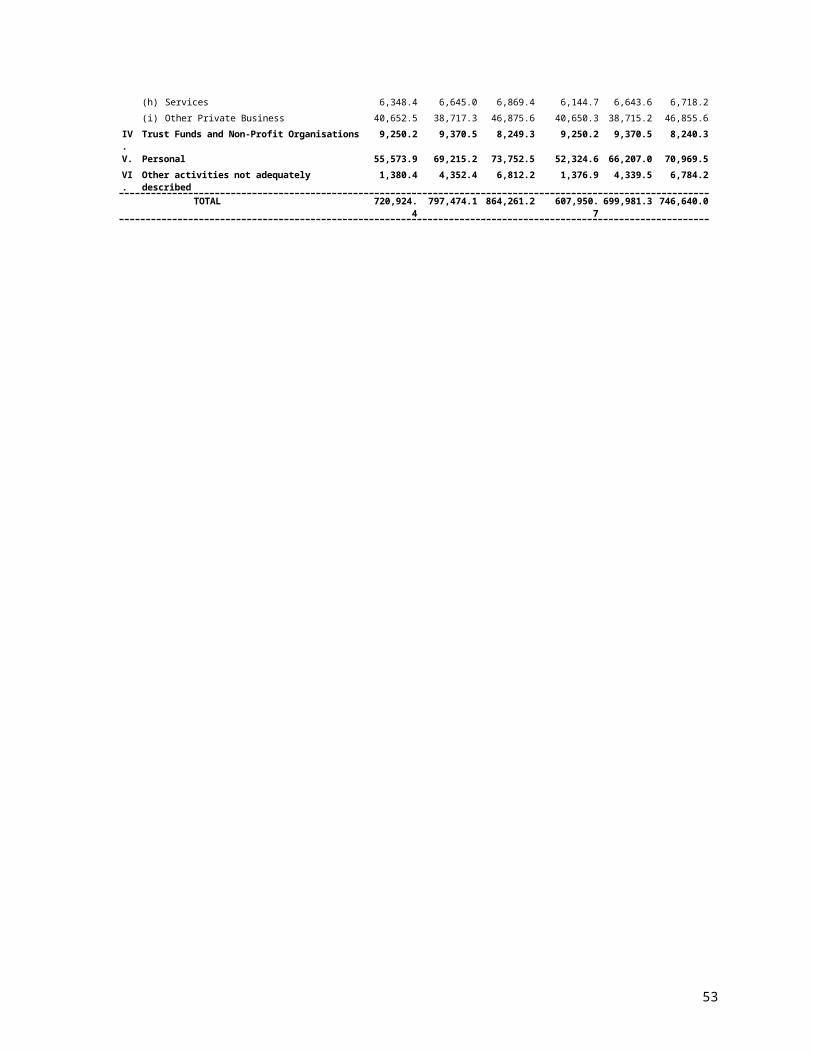
(h) Services 6,348.4 6,645.0 6,869.4 6,144.7 6,643.6 6,718.2
(i) Other Private Business 40,652.5 38,717.3 46,875.6 40,650.3 38,715.2 46,855.6
IV. Trust Funds and Non-Profit Organisations 9,250.2 9,370.5 8,249.3 9,250.2 9,370.5 8,240.3
V. Personal 55,573.9 69,215.2 73,752.5 52,324.6 66,207.0 70,969.5
VI. Other activities not adequately described 1,380.4 4,352.4 6,812.2 1,376.9 4,339.5 6,784.2
TOTAL 720,924.4 797,474.1 864,261.2 607,950.7 699,981.3 746,640.0
49
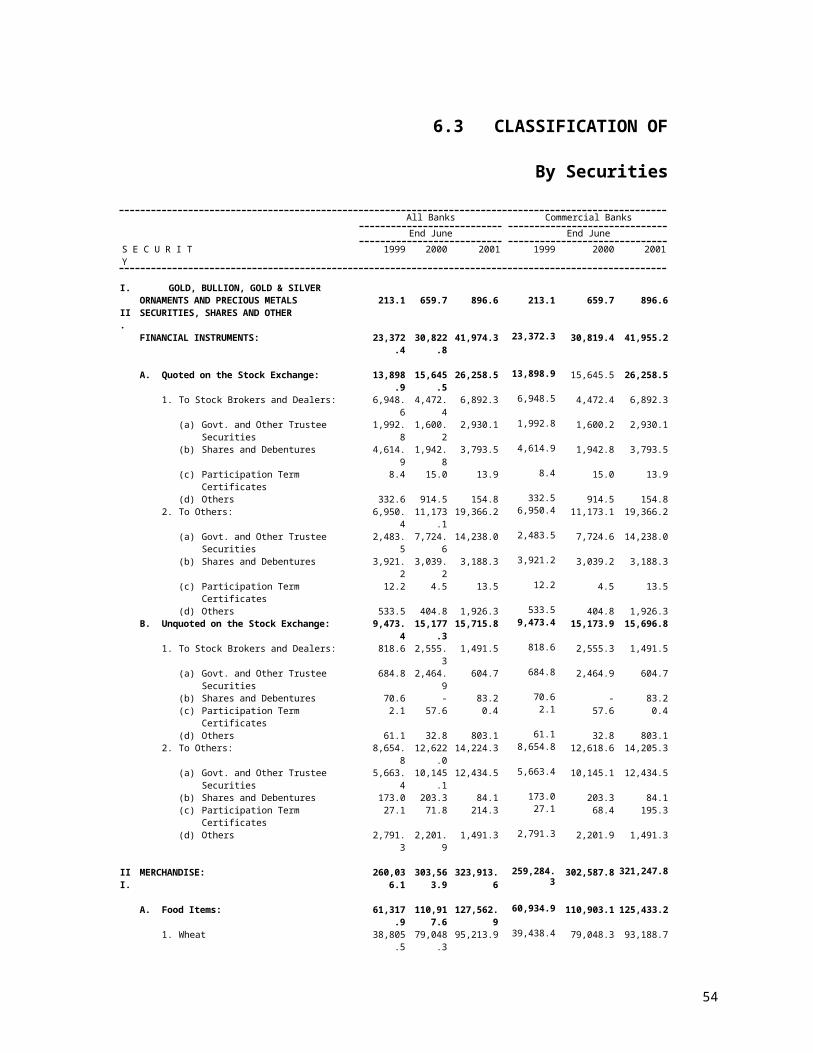
6.3 CLASSIFICATION OF
By Securities
All Banks Commercial Banks
End June End June
S E C U R I T Y 1999 2000 2001 1999 2000 2001
I. GOLD, BULLION, GOLD & SILVERORNAMENTS AND PRECIOUS METALS 213.1 659.7 896.6 213.1 659.7 896.6
II. SECURITIES, SHARES AND OTHERFINANCIAL INSTRUMENTS: 23,372.4 30,822.8 41,974.3 23,372.3 30,819.4 41,955.2
A. Quoted on the Stock Exchange: 13,898.9 15,645.5 26,258.5 13,898.9 15,645.5 26,258.51. To Stock Brokers and Dealers: 6,948.6 4,472.4 6,892.3 6,948.5 4,472.4 6,892.3
(a) Govt. and Other Trustee Securities 1,992.8 1,600.2 2,930.1 1,992.8 1,600.2 2,930.1(b) Shares and Debentures 4,614.9 1,942.8 3,793.5 4,614.9 1,942.8 3,793.5(c) Participation Term Certificates 8.4 15.0 13.9 8.4 15.0 13.9(d) Others 332.6 914.5 154.8 332.5 914.5 154.8
2. To Others: 6,950.4 11,173.1 19,366.2 6,950.4 11,173.1 19,366.2(a) Govt. and Other Trustee Securities 2,483.5 7,724.6 14,238.0 2,483.5 7,724.6 14,238.0(b) Shares and Debentures 3,921.2 3,039.2 3,188.3 3,921.2 3,039.2 3,188.3(c) Participation Term Certificates 12.2 4.5 13.5 12.2 4.5 13.5(d) Others 533.5 404.8 1,926.3 533.5 404.8 1,926.3
B. Unquoted on the Stock Exchange: 9,473.4 15,177.3 15,715.8 9,473.4 15,173.9 15,696.81. To Stock Brokers and Dealers: 818.6 2,555.3 1,491.5 818.6 2,555.3 1,491.5
(a) Govt. and Other Trustee Securities 684.8 2,464.9 604.7 684.8 2,464.9 604.7(b) Shares and Debentures 70.6 - 83.2 70.6 - 83.2(c) Participation Term Certificates 2.1 57.6 0.4 2.1 57.6 0.4(d) Others 61.1 32.8 803.1 61.1 32.8 803.1
2. To Others: 8,654.8 12,622.0 14,224.3 8,654.8 12,618.6 14,205.3(a) Govt. and Other Trustee Securities 5,663.4 10,145.1 12,434.5 5,663.4 10,145.1 12,434.5(b) Shares and Debentures 173.0 203.3 84.1 173.0 203.3 84.1(c) Participation Term Certificates 27.1 71.8 214.3 27.1 68.4 195.3(d) Others 2,791.3 2,201.9 1,491.3 2,791.3 2,201.9 1,491.3
III. MERCHANDISE: 260,036.1
303,563.9
323,913.6 259,284.3 302,587.8 321,247.8
A. Food Items: 61,317.9 110,917.6
127,562.9 60,934.9 110,903.1 125,433.2
1. Wheat 38,805.5 79,048.3 95,213.9 39,438.4 79,048.3 93,188.72. Rice and Paddy 3,343.8 5,251.7 6,321.2 3,343.8 5,251.7 6,321.23. Other Grain and Pulses: 357.3 2,186.8 788.4 355.9 2,186.8 788.4
(a) Indigenous 311.6 1,990.3 424.2 310.2 1,990.3 424.2(b) Imported 45.7 196.5 364.2 45.7 196.5 364.2
4. Edible Oil: 5,255.9 4,963.0 6,463.4 5,255.9 4,963.0 6,463.4(a) Indigenous 3,249.4 2,835.3 4,635.0 3,249.4 2,835.3 4,635.0(b) Imported 2,006.5 2,127.7 1,828.4 2,006.5 2,127.7 1,828.4
5. Sugar: 8,776.2 11,877.6 11,737.3 8,761.7 11,863.1 11,632.8(a) Indigenous 7,359.4 11,120.0 10,868.1 7,344.9 11,105.5 10,763.6(b) Imported 1,416.8 757.6 869.2 1,416.8 757.6 869.2
6. Kariana and Spices 1,072.1 2,183.9 1,186.9 1,072.1 2,183.9 1,186.97. Fish and Fish Preparation 963.8 1,041.2 1,200.6 963.8 1,041.2 1,200.68. Other Food Items: 2,743.3 4,365.0 4,651.1 2,743.3 4,365.0 4,651.1
(a) Indigenous 2,189.3 2,947.8 3,411.3 2,189.3 2,947.8 3,411.3(b) Imported 554.0 1,417.1 1,239.7 554.0 1,417.1 1,239.7
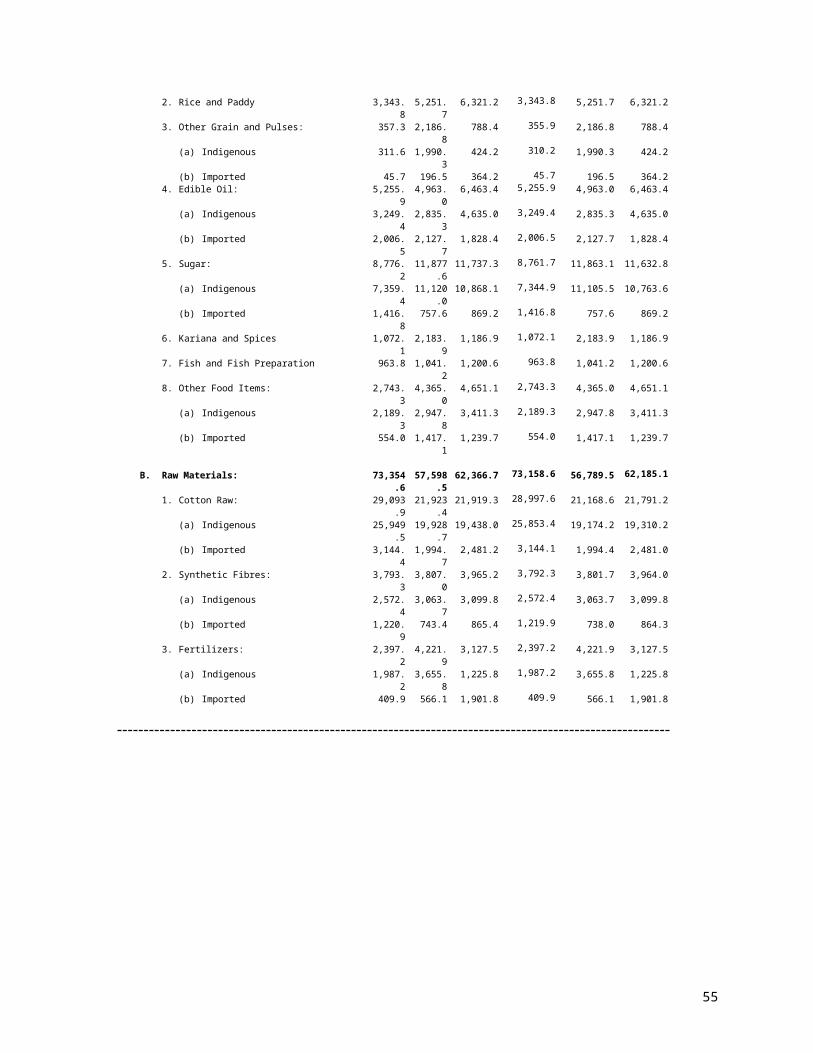
B. Raw Materials: 73,354.6 57,598.5 62,366.7 73,158.6 56,789.5 62,185.11. Cotton Raw: 29,093.9 21,923.4 21,919.3 28,997.6 21,168.6 21,791.2
(a) Indigenous 25,949.5 19,928.7 19,438.0 25,853.4 19,174.2 19,310.2(b) Imported 3,144.4 1,994.7 2,481.2 3,144.1 1,994.4 2,481.0
2. Synthetic Fibres: 3,793.3 3,807.0 3,965.2 3,792.3 3,801.7 3,964.0(a) Indigenous 2,572.4 3,063.7 3,099.8 2,572.4 3,063.7 3,099.8(b) Imported 1,220.9 743.4 865.4 1,219.9 738.0 864.3
3. Fertilizers: 2,397.2 4,221.9 3,127.5 2,397.2 4,221.9 3,127.5(a) Indigenous 1,987.2 3,655.8 1,225.8 1,987.2 3,655.8 1,225.8(b) Imported 409.9 566.1 1,901.8 409.9 566.1 1,901.8
50
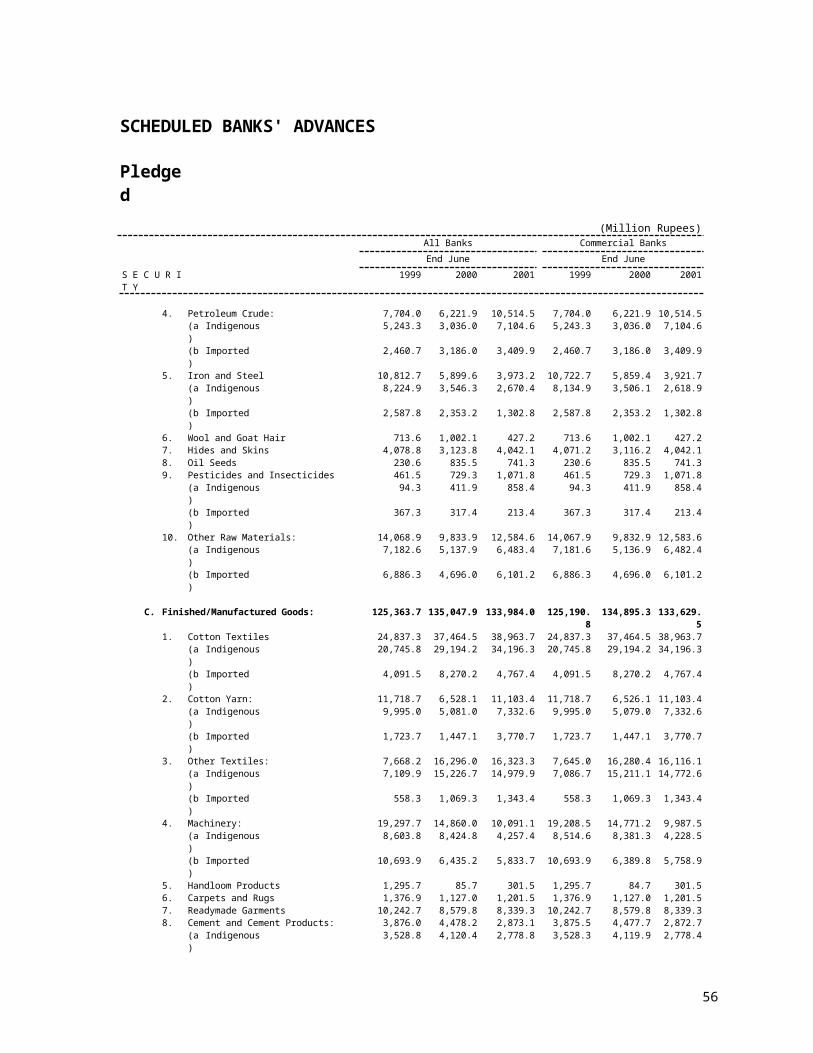
SCHEDULED BANKS' ADVANCES
Pledged
(Million Rupees)All Banks Commercial Banks
End June End June
S E C U R I T Y 1999 2000 2001 1999 2000 2001
4. Petroleum Crude: 7,704.0 6,221.9 10,514.5 7,704.0 6,221.9 10,514.5(a) Indigenous 5,243.3 3,036.0 7,104.6 5,243.3 3,036.0 7,104.6(b) Imported 2,460.7 3,186.0 3,409.9 2,460.7 3,186.0 3,409.9
5. Iron and Steel 10,812.7 5,899.6 3,973.2 10,722.7 5,859.4 3,921.7(a) Indigenous 8,224.9 3,546.3 2,670.4 8,134.9 3,506.1 2,618.9(b) Imported 2,587.8 2,353.2 1,302.8 2,587.8 2,353.2 1,302.8
6. Wool and Goat Hair 713.6 1,002.1 427.2 713.6 1,002.1 427.27. Hides and Skins 4,078.8 3,123.8 4,042.1 4,071.2 3,116.2 4,042.18. Oil Seeds 230.6 835.5 741.3 230.6 835.5 741.39. Pesticides and Insecticides 461.5 729.3 1,071.8 461.5 729.3 1,071.8
(a) Indigenous 94.3 411.9 858.4 94.3 411.9 858.4(b) Imported 367.3 317.4 213.4 367.3 317.4 213.4
10. Other Raw Materials: 14,068.9 9,833.9 12,584.6 14,067.9 9,832.9 12,583.6(a) Indigenous 7,182.6 5,137.9 6,483.4 7,181.6 5,136.9 6,482.4(b) Imported 6,886.3 4,696.0 6,101.2 6,886.3 4,696.0 6,101.2
C. Finished/Manufactured Goods: 125,363.7 135,047.9 133,984.0 125,190.8 134,895.3 133,629.51. Cotton Textiles 24,837.3 37,464.5 38,963.7 24,837.3 37,464.5 38,963.7
(a) Indigenous 20,745.8 29,194.2 34,196.3 20,745.8 29,194.2 34,196.3(b) Imported 4,091.5 8,270.2 4,767.4 4,091.5 8,270.2 4,767.4
2. Cotton Yarn: 11,718.7 6,528.1 11,103.4 11,718.7 6,526.1 11,103.4(a) Indigenous 9,995.0 5,081.0 7,332.6 9,995.0 5,079.0 7,332.6(b) Imported 1,723.7 1,447.1 3,770.7 1,723.7 1,447.1 3,770.7
3. Other Textiles: 7,668.2 16,296.0 16,323.3 7,645.0 16,280.4 16,116.1(a) Indigenous 7,109.9 15,226.7 14,979.9 7,086.7 15,211.1 14,772.6(b) Imported 558.3 1,069.3 1,343.4 558.3 1,069.3 1,343.4
4. Machinery: 19,297.7 14,860.0 10,091.1 19,208.5 14,771.2 9,987.5(a) Indigenous 8,603.8 8,424.8 4,257.4 8,514.6 8,381.3 4,228.5(b) Imported 10,693.9 6,435.2 5,833.7 10,693.9 6,389.8 5,758.9
5. Handloom Products 1,295.7 85.7 301.5 1,295.7 84.7 301.56. Carpets and Rugs 1,376.9 1,127.0 1,201.5 1,376.9 1,127.0 1,201.57. Readymade Garments 10,242.7 8,579.8 8,339.3 10,242.7 8,579.8 8,339.38. Cement and Cement Products: 3,876.0 4,478.2 2,873.1 3,875.5 4,477.7 2,872.7
(a) Indigenous 3,528.8 4,120.4 2,778.8 3,528.3 4,119.9 2,778.4(b) Imported 347.2 357.8 94.3 347.2 357.8 94.3
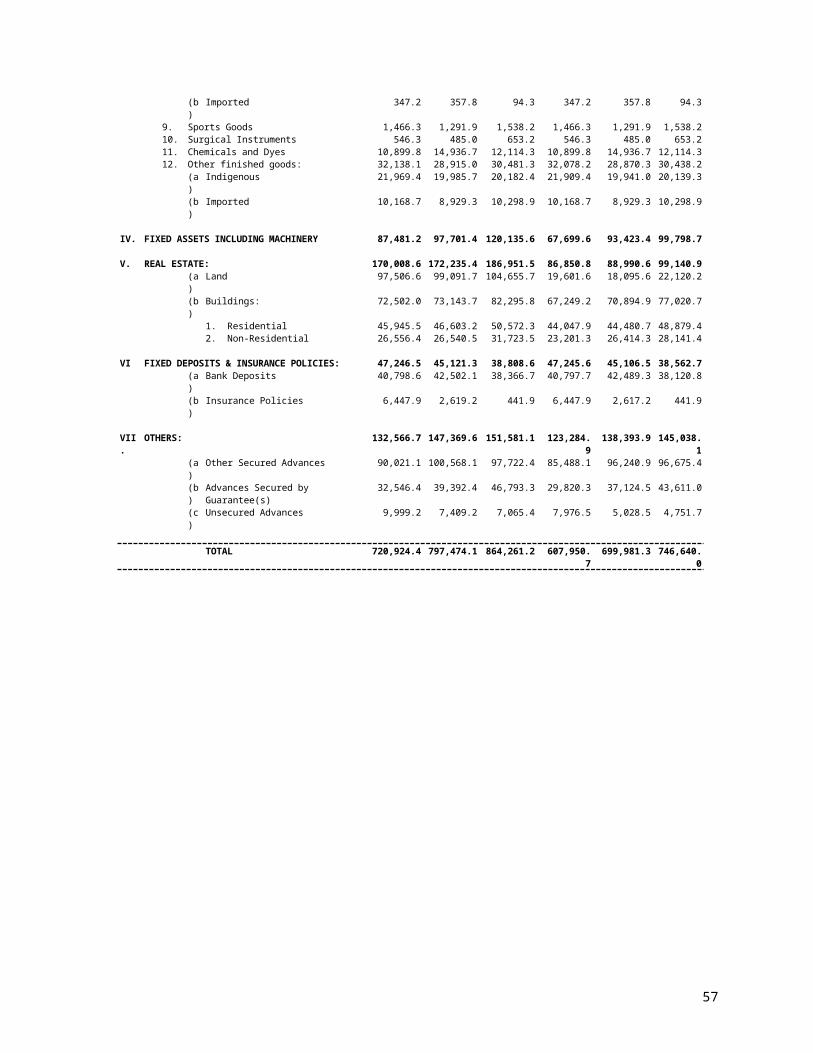
9. Sports Goods 1,466.3 1,291.9 1,538.2 1,466.3 1,291.9 1,538.210. Surgical Instruments 546.3 485.0 653.2 546.3 485.0 653.211. Chemicals and Dyes 10,899.8 14,936.7 12,114.3 10,899.8 14,936.7 12,114.312. Other finished goods: 32,138.1 28,915.0 30,481.3 32,078.2 28,870.3 30,438.2
(a) Indigenous 21,969.4 19,985.7 20,182.4 21,909.4 19,941.0 20,139.3(b) Imported 10,168.7 8,929.3 10,298.9 10,168.7 8,929.3 10,298.9
IV. FIXED ASSETS INCLUDING MACHINERY 87,481.2 97,701.4 120,135.6 67,699.6 93,423.4 99,798.7
V. REAL ESTATE: 170,008.6 172,235.4 186,951.5 86,850.8 88,990.6 99,140.9(a) Land 97,506.6 99,091.7 104,655.7 19,601.6 18,095.6 22,120.2(b) Buildings: 72,502.0 73,143.7 82,295.8 67,249.2 70,894.9 77,020.7
1. Residential 45,945.5 46,603.2 50,572.3 44,047.9 44,480.7 48,879.42. Non-Residential 26,556.4 26,540.5 31,723.5 23,201.3 26,414.3 28,141.4
VI FIXED DEPOSITS & INSURANCE POLICIES: 47,246.5 45,121.3 38,808.6 47,245.6 45,106.5 38,562.7(a) Bank Deposits 40,798.6 42,502.1 38,366.7 40,797.7 42,489.3 38,120.8(b) Insurance Policies 6,447.9 2,619.2 441.9 6,447.9 2,617.2 441.9
VII. OTHERS: 132,566.7 147,369.6 151,581.1 123,284.9 138,393.9 145,038.1(a) Other Secured Advances 90,021.1 100,568.1 97,722.4 85,488.1 96,240.9 96,675.4(b) Advances Secured by Guarantee(s) 32,546.4 39,392.4 46,793.3 29,820.3 37,124.5 43,611.0(c) Unsecured Advances 9,999.2 7,409.2 7,065.4 7,976.5 5,028.5 4,751.7
TOTAL 720,924.4 797,474.1 864,261.2 607,950.7 699,981.3 746,640.0
51
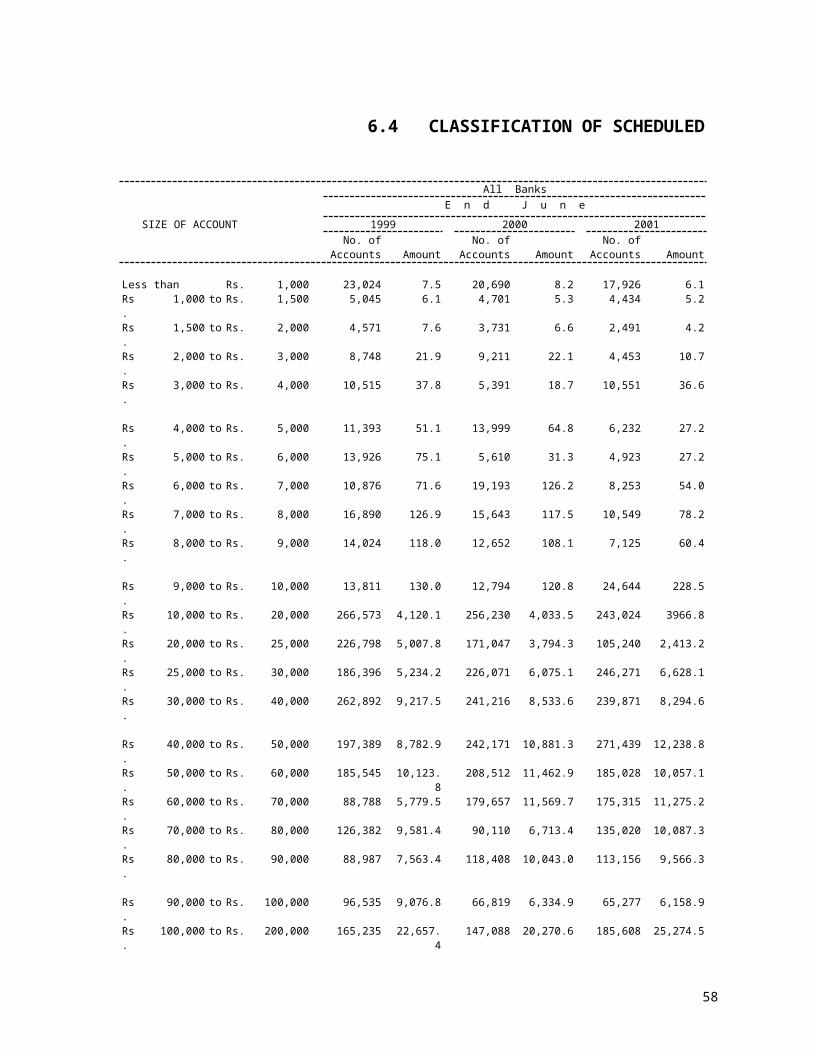
6.4 CLASSIFICATION OF SCHEDULED
All BanksE n d J u n e
SIZE OF ACCOUNT 1999 2000 2001No. of No. of No. of
Accounts Amount Accounts Amount Accounts Amount
Less than Rs. 1,000 23,024 7.5 20,690 8.2 17,926 6.1Rs. 1,000 to Rs. 1,500 5,045 6.1 4,701 5.3 4,434 5.2Rs. 1,500 to Rs. 2,000 4,571 7.6 3,731 6.6 2,491 4.2Rs. 2,000 to Rs. 3,000 8,748 21.9 9,211 22.1 4,453 10.7Rs. 3,000 to Rs. 4,000 10,515 37.8 5,391 18.7 10,551 36.6
Rs. 4,000 to Rs. 5,000 11,393 51.1 13,999 64.8 6,232 27.2Rs. 5,000 to Rs. 6,000 13,926 75.1 5,610 31.3 4,923 27.2Rs. 6,000 to Rs. 7,000 10,876 71.6 19,193 126.2 8,253 54.0Rs. 7,000 to Rs. 8,000 16,890 126.9 15,643 117.5 10,549 78.2Rs. 8,000 to Rs. 9,000 14,024 118.0 12,652 108.1 7,125 60.4
Rs. 9,000 to Rs. 10,000 13,811 130.0 12,794 120.8 24,644 228.5Rs. 10,000 to Rs. 20,000 266,573 4,120.1 256,230 4,033.5 243,024 3966.8Rs. 20,000 to Rs. 25,000 226,798 5,007.8 171,047 3,794.3 105,240 2,413.2Rs. 25,000 to Rs. 30,000 186,396 5,234.2 226,071 6,075.1 246,271 6,628.1Rs. 30,000 to Rs. 40,000 262,892 9,217.5 241,216 8,533.6 239,871 8,294.6
Rs. 40,000 to Rs. 50,000 197,389 8,782.9 242,171 10,881.3 271,439 12,238.8Rs. 50,000 to Rs. 60,000 185,545 10,123.8 208,512 11,462.9 185,028 10,057.1Rs. 60,000 to Rs. 70,000 88,788 5,779.5 179,657 11,569.7 175,315 11,275.2Rs. 70,000 to Rs. 80,000 126,382 9,581.4 90,110 6,713.4 135,020 10,087.3Rs. 80,000 to Rs. 90,000 88,987 7,563.4 118,408 10,043.0 113,156 9,566.3
Rs. 90,000 to Rs. 100,000 96,535 9,076.8 66,819 6,334.9 65,277 6,158.9Rs. 100,000 to Rs. 200,000 165,235 22,657.4 147,088 20,270.6 185,608 25,274.5Rs. 200,000 to Rs. 300,000 73,084 17,668.4 88,412 21,833.0 88,576 22,235.6Rs. 300,000 to Rs. 400,000 37,831 13,172.8 30,986 10,603.5 41,937 14,430.2Rs. 400,000 to Rs. 500,000 14,709 6,569.9 22,969 10,228.3 21,012 9,447.8
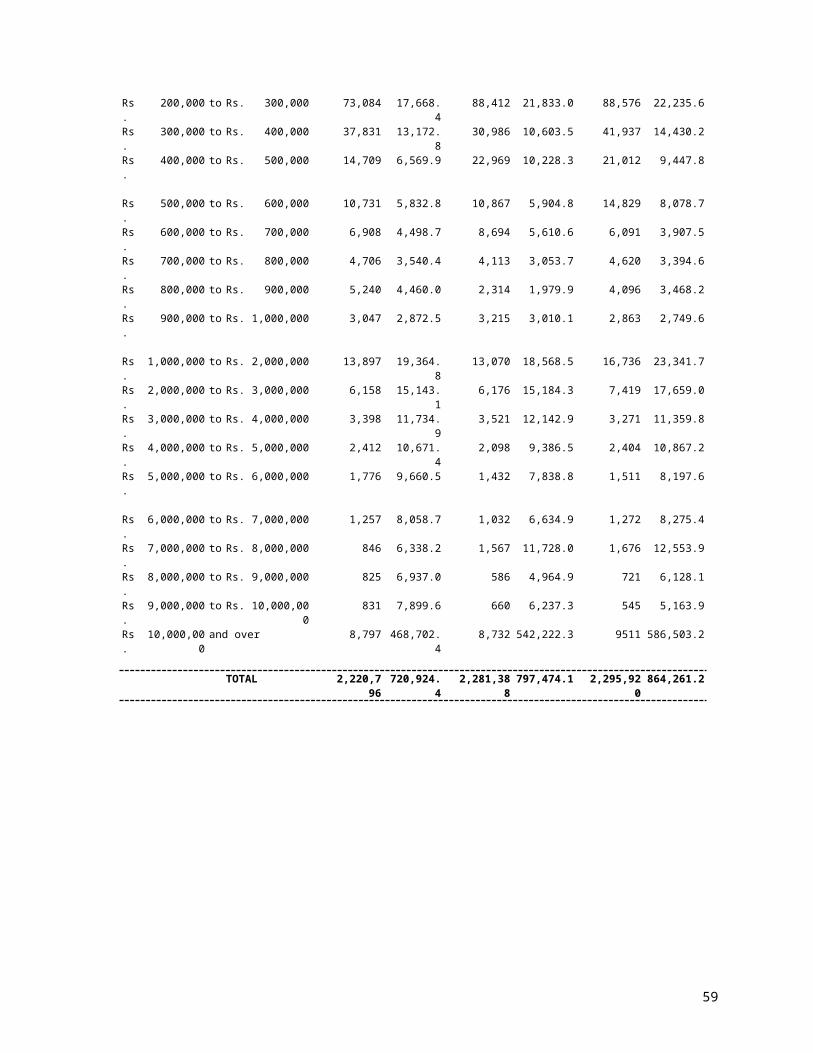
Rs. 500,000 to Rs. 600,000 10,731 5,832.8 10,867 5,904.8 14,829 8,078.7Rs. 600,000 to Rs. 700,000 6,908 4,498.7 8,694 5,610.6 6,091 3,907.5Rs. 700,000 to Rs. 800,000 4,706 3,540.4 4,113 3,053.7 4,620 3,394.6Rs. 800,000 to Rs. 900,000 5,240 4,460.0 2,314 1,979.9 4,096 3,468.2Rs. 900,000 to Rs. 1,000,000 3,047 2,872.5 3,215 3,010.1 2,863 2,749.6
Rs. 1,000,000 to Rs. 2,000,000 13,897 19,364.8 13,070 18,568.5 16,736 23,341.7Rs. 2,000,000 to Rs. 3,000,000 6,158 15,143.1 6,176 15,184.3 7,419 17,659.0Rs. 3,000,000 to Rs. 4,000,000 3,398 11,734.9 3,521 12,142.9 3,271 11,359.8Rs. 4,000,000 to Rs. 5,000,000 2,412 10,671.4 2,098 9,386.5 2,404 10,867.2Rs. 5,000,000 to Rs. 6,000,000 1,776 9,660.5 1,432 7,838.8 1,511 8,197.6
Rs. 6,000,000 to Rs. 7,000,000 1,257 8,058.7 1,032 6,634.9 1,272 8,275.4Rs. 7,000,000 to Rs. 8,000,000 846 6,338.2 1,567 11,728.0 1,676 12,553.9Rs. 8,000,000 to Rs. 9,000,000 825 6,937.0 586 4,964.9 721 6,128.1Rs. 9,000,000 to Rs. 10,000,000 831 7,899.6 660 6,237.3 545 5,163.9Rs. 10,000,000 and over 8,797 468,702.4 8,732 542,222.3 9511 586,503.2
TOTAL 2,220,796 720,924.4 2,281,388 797,474.1 2,295,920 864,261.2
52
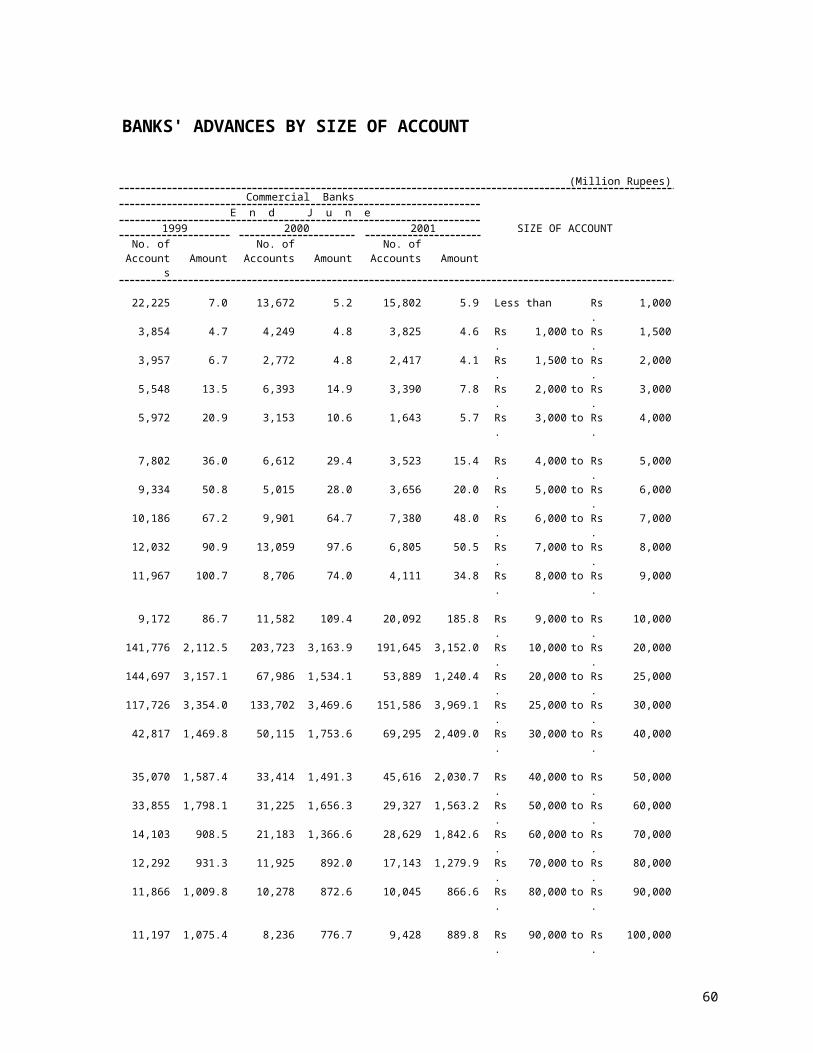
BANKS' ADVANCES BY SIZE OF ACCOUNT
(Million Rupees)Commercial BanksE n d J u n e
1999 2000 2001 SIZE OF ACCOUNTNo. of No. of No. of
Accounts Amount Accounts Amount Accounts Amount
22,225 7.0 13,672 5.2 15,802 5.9 Less than Rs. 1,0003,854 4.7 4,249 4.8 3,825 4.6 Rs. 1,000 to Rs. 1,5003,957 6.7 2,772 4.8 2,417 4.1 Rs. 1,500 to Rs. 2,0005,548 13.5 6,393 14.9 3,390 7.8 Rs. 2,000 to Rs. 3,0005,972 20.9 3,153 10.6 1,643 5.7 Rs. 3,000 to Rs. 4,000
7,802 36.0 6,612 29.4 3,523 15.4 Rs. 4,000 to Rs. 5,0009,334 50.8 5,015 28.0 3,656 20.0 Rs. 5,000 to Rs. 6,000
10,186 67.2 9,901 64.7 7,380 48.0 Rs. 6,000 to Rs. 7,00012,032 90.9 13,059 97.6 6,805 50.5 Rs. 7,000 to Rs. 8,00011,967 100.7 8,706 74.0 4,111 34.8 Rs. 8,000 to Rs. 9,000
9,172 86.7 11,582 109.4 20,092 185.8 Rs. 9,000 to Rs. 10,000141,776 2,112.5 203,723 3,163.9 191,645 3,152.0 Rs. 10,000 to Rs. 20,000144,697 3,157.1 67,986 1,534.1 53,889 1,240.4 Rs. 20,000 to Rs. 25,000117,726 3,354.0 133,702 3,469.6 151,586 3,969.1 Rs. 25,000 to Rs. 30,000
42,817 1,469.8 50,115 1,753.6 69,295 2,409.0 Rs. 30,000 to Rs. 40,000
35,070 1,587.4 33,414 1,491.3 45,616 2,030.7 Rs. 40,000 to Rs. 50,00033,855 1,798.1 31,225 1,656.3 29,327 1,563.2 Rs. 50,000 to Rs. 60,00014,103 908.5 21,183 1,366.6 28,629 1,842.6 Rs. 60,000 to Rs. 70,00012,292 931.3 11,925 892.0 17,143 1,279.9 Rs. 70,000 to Rs. 80,00011,866 1,009.8 10,278 872.6 10,045 866.6 Rs. 80,000 to Rs. 90,000
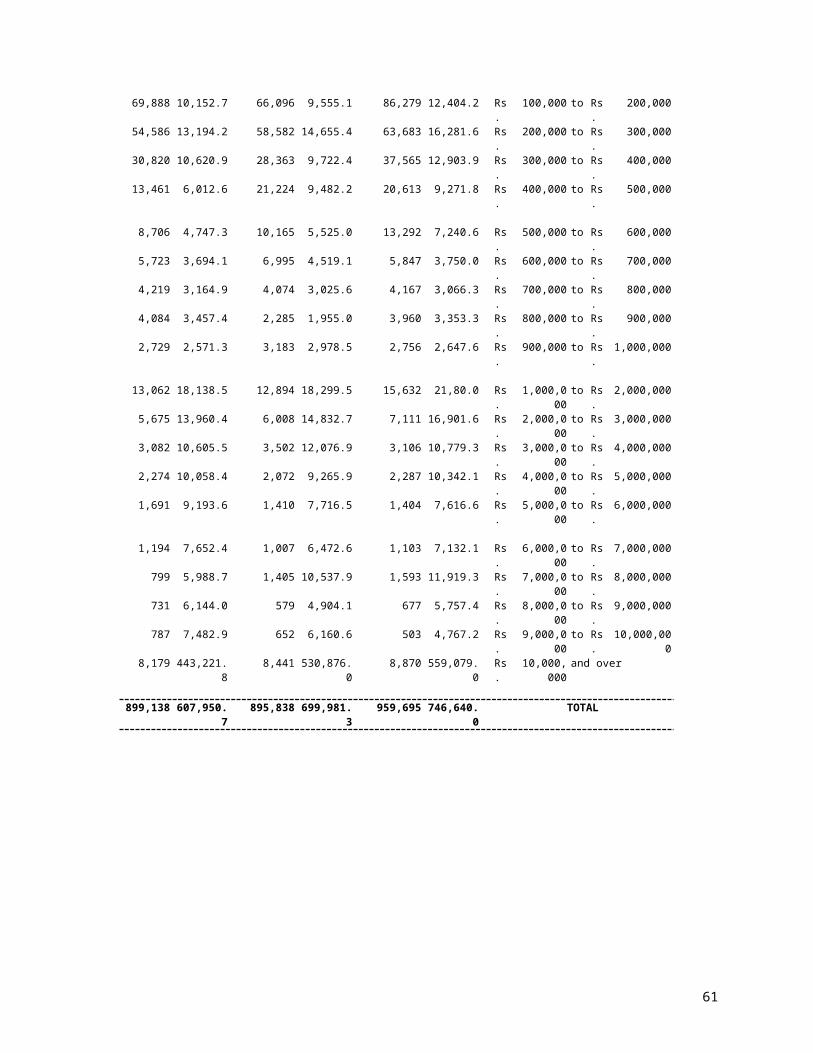
11,197 1,075.4 8,236 776.7 9,428 889.8 Rs. 90,000 to Rs. 100,00069,888 10,152.7 66,096 9,555.1 86,279 12,404.2 Rs. 100,000 to Rs. 200,00054,586 13,194.2 58,582 14,655.4 63,683 16,281.6 Rs. 200,000 to Rs. 300,00030,820 10,620.9 28,363 9,722.4 37,565 12,903.9 Rs. 300,000 to Rs. 400,00013,461 6,012.6 21,224 9,482.2 20,613 9,271.8 Rs. 400,000 to Rs. 500,000
8,706 4,747.3 10,165 5,525.0 13,292 7,240.6 Rs. 500,000 to Rs. 600,0005,723 3,694.1 6,995 4,519.1 5,847 3,750.0 Rs. 600,000 to Rs. 700,0004,219 3,164.9 4,074 3,025.6 4,167 3,066.3 Rs. 700,000 to Rs. 800,0004,084 3,457.4 2,285 1,955.0 3,960 3,353.3 Rs. 800,000 to Rs. 900,0002,729 2,571.3 3,183 2,978.5 2,756 2,647.6 Rs. 900,000 to Rs. 1,000,000
13,062 18,138.5 12,894 18,299.5 15,632 21,80.0 Rs. 1,000,000 to Rs. 2,000,0005,675 13,960.4 6,008 14,832.7 7,111 16,901.6 Rs. 2,000,000 to Rs. 3,000,0003,082 10,605.5 3,502 12,076.9 3,106 10,779.3 Rs. 3,000,000 to Rs. 4,000,0002,274 10,058.4 2,072 9,265.9 2,287 10,342.1 Rs. 4,000,000 to Rs. 5,000,0001,691 9,193.6 1,410 7,716.5 1,404 7,616.6 Rs. 5,000,000 to Rs. 6,000,000
1,194 7,652.4 1,007 6,472.6 1,103 7,132.1 Rs. 6,000,000 to Rs. 7,000,000799 5,988.7 1,405 10,537.9 1,593 11,919.3 Rs. 7,000,000 to Rs. 8,000,000731 6,144.0 579 4,904.1 677 5,757.4 Rs. 8,000,000 to Rs. 9,000,000787 7,482.9 652 6,160.6 503 4,767.2 Rs. 9,000,000 to Rs. 10,000,000
8,179 443,221.8 8,441 530,876.0 8,870 559,079.0 Rs. 10,000,000 and over
899,138 607,950.7 895,838 699,981.3 959,695 746,640.0 TOTAL
53
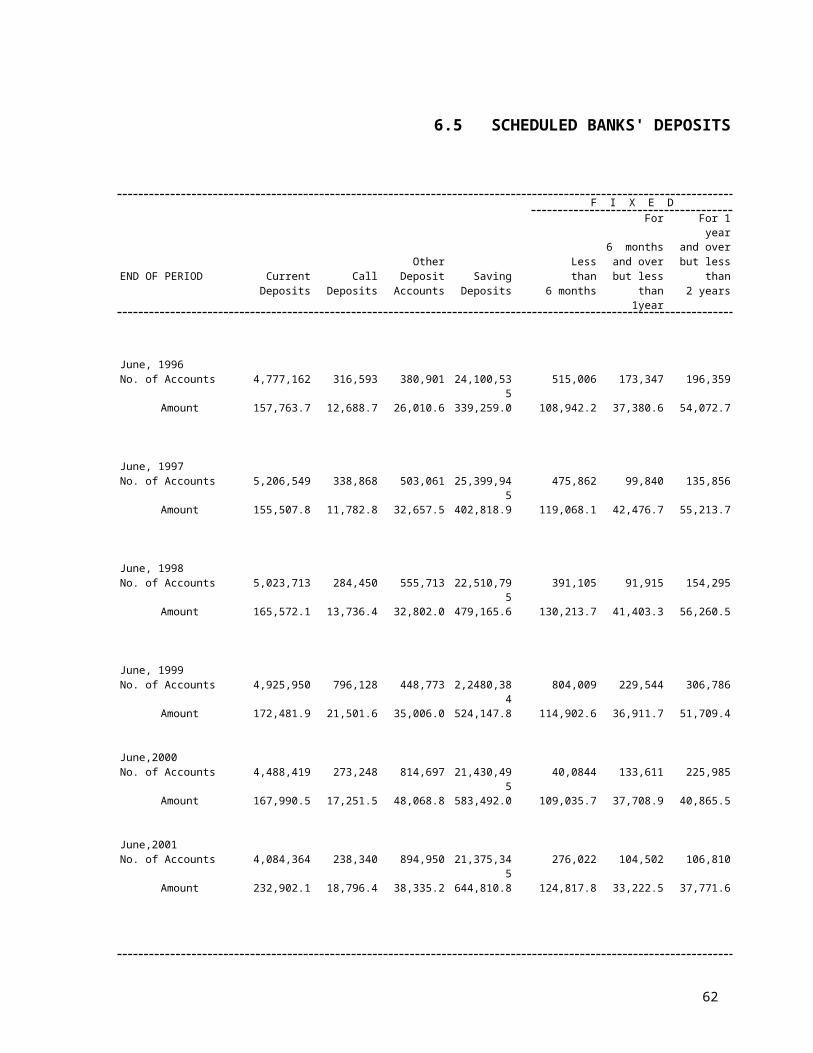
6.5 SCHEDULED BANKS' DEPOSITS
F I X E DFor For 1 year
6 months and overOther Less and over but less
END OF PERIOD Current Call Deposit Saving than but less thanDeposits Deposits Accounts Deposits 6 months than 1year 2 years
June, 1996No. of Accounts 4,777,162 316,593 380,901 24,100,535 515,006 173,347 196,359
Amount 157,763.7 12,688.7 26,010.6 339,259.0 108,942.2 37,380.6 54,072.7
June, 1997No. of Accounts 5,206,549 338,868 503,061 25,399,945 475,862 99,840 135,856
Amount 155,507.8 11,782.8 32,657.5 402,818.9 119,068.1 42,476.7 55,213.7
June, 1998No. of Accounts 5,023,713 284,450 555,713 22,510,795 391,105 91,915 154,295
Amount 165,572.1 13,736.4 32,802.0 479,165.6 130,213.7 41,403.3 56,260.5
June, 1999No. of Accounts 4,925,950 796,128 448,773 2,2480,384 804,009 229,544 306,786
Amount 172,481.9 21,501.6 35,006.0 524,147.8 114,902.6 36,911.7 51,709.4
June,2000No. of Accounts 4,488,419 273,248 814,697 21,430,495 40,0844 133,611 225,985
Amount 167,990.5 17,251.5 48,068.8 583,492.0 109,035.7 37,708.9 40,865.5
June,2001No. of Accounts 4,084,364 238,340 894,950 21,375,345 276,022 104,502 106,810
Amount 232,902.1 18,796.4 38,335.2 644,810.8 124,817.8 33,222.5 37,771.6
54
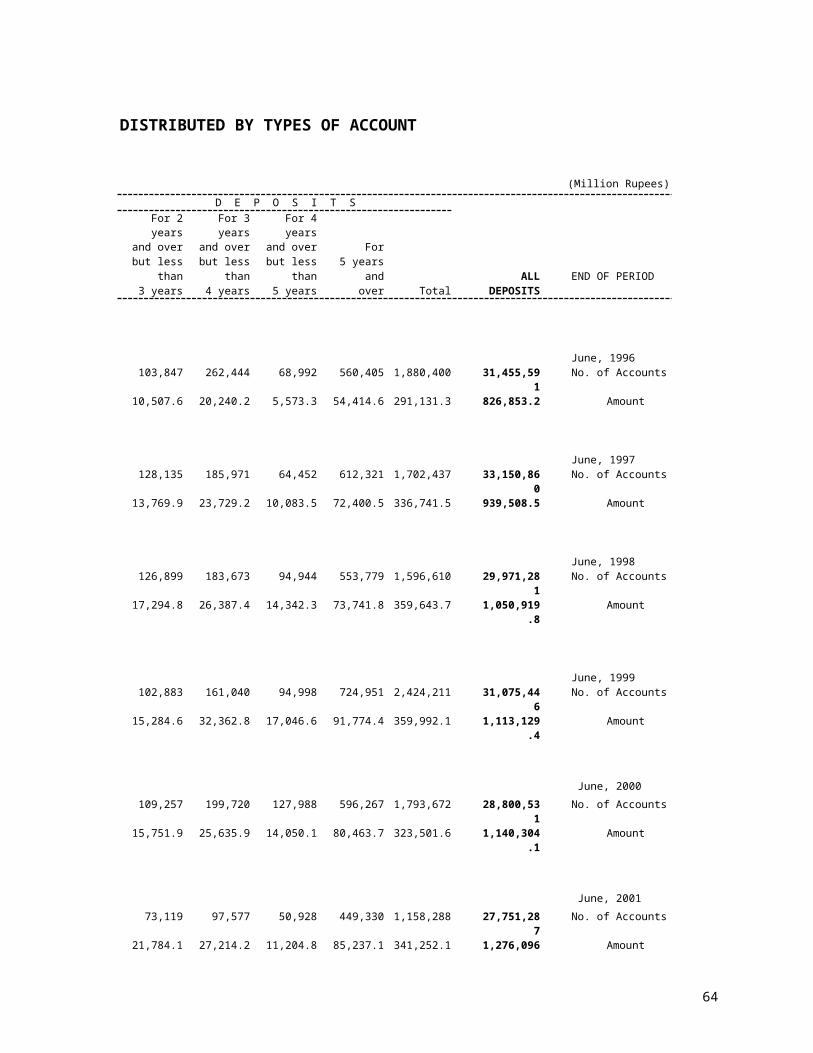
DISTRIBUTED BY TYPES OF ACCOUNT
(Million Rupees)
D E P O S I T SFor 2 years For 3 years For 4 years
and over and over and over Forbut less but less but less 5 years
than than than and ALL END OF PERIOD3 years 4 years 5 years over Total DEPOSITS
June, 1996103,847 262,444 68,992 560,405 1,880,400 31,455,591 No. of Accounts10,507.6 20,240.2 5,573.3 54,414.6 291,131.3 826,853.2 Amount
June, 1997128,135 185,971 64,452 612,321 1,702,437 33,150,860 No. of Accounts13,769.9 23,729.2 10,083.5 72,400.5 336,741.5 939,508.5 Amount
June, 1998126,899 183,673 94,944 553,779 1,596,610 29,971,281 No. of Accounts17,294.8 26,387.4 14,342.3 73,741.8 359,643.7 1,050,919.8 Amount
June, 1999102,883 161,040 94,998 724,951 2,424,211 31,075,446 No. of Accounts15,284.6 32,362.8 17,046.6 91,774.4 359,992.1 1,113,129.4 Amount
June, 2000
109,257 199,720 127,988 596,267 1,793,672 28,800,531 No. of Accounts15,751.9 25,635.9 14,050.1 80,463.7 323,501.6 1,140,304.1 Amount
June, 2001
73,119 97,577 50,928 449,330 1,158,288 27,751,287 No. of Accounts21,784.1 27,214.2 11,204.8 85,237.1 341,252.1 1,276,096.4 Amount
55
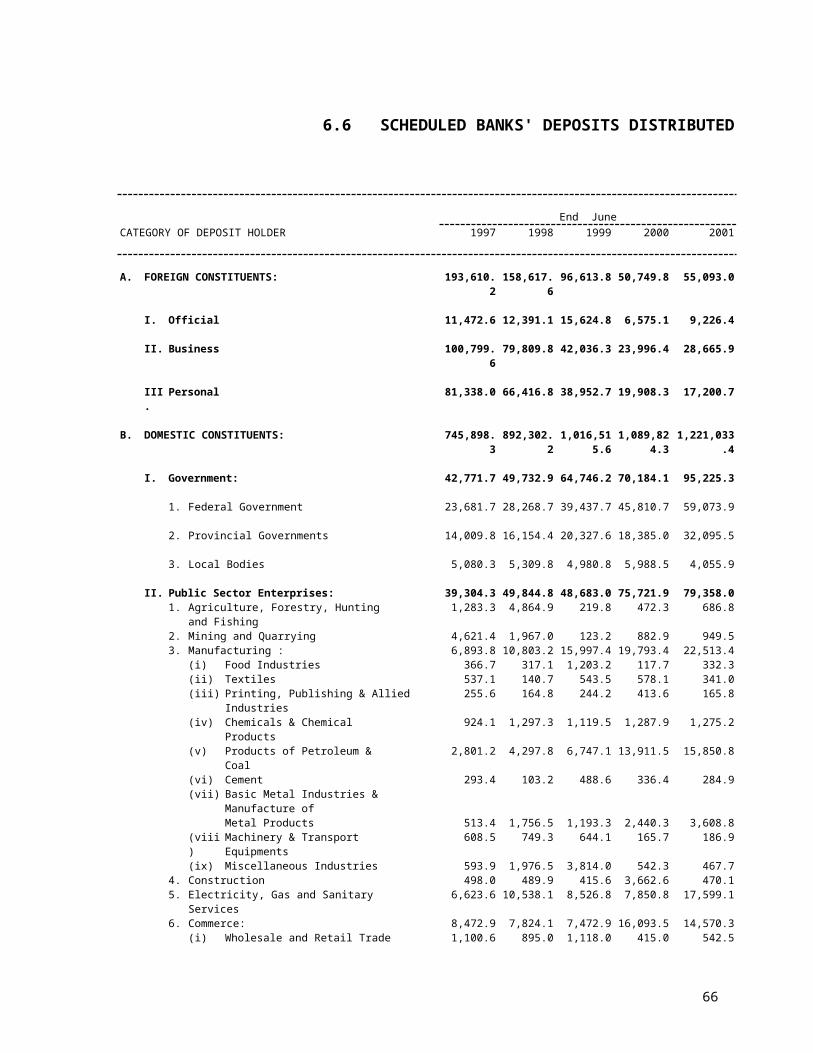
6.6 SCHEDULED BANKS' DEPOSITS DISTRIBUTED
End June
CATEGORY OF DEPOSIT HOLDER 1997 1998 1999 2000 2001
A. FOREIGN CONSTITUENTS: 193,610.2 158,617.6 96,613.8 50,749.8 55,093.0
I. Official 11,472.6 12,391.1 15,624.8 6,575.1 9,226.4
II. Business 100,799.6 79,809.8 42,036.3 23,996.4 28,665.9
III. Personal 81,338.0 66,416.8 38,952.7 19,908.3 17,200.7
B. DOMESTIC CONSTITUENTS: 745,898.3 892,302.2 1,016,515.6 1,089,824.3 1,221,033.4
I. Government: 42,771.7 49,732.9 64,746.2 70,184.1 95,225.3
1. Federal Government 23,681.7 28,268.7 39,437.7 45,810.7 59,073.9
2. Provincial Governments 14,009.8 16,154.4 20,327.6 18,385.0 32,095.5
3. Local Bodies 5,080.3 5,309.8 4,980.8 5,988.5 4,055.9
II. Public Sector Enterprises: 39,304.3 49,844.8 48,683.0 75,721.9 79,358.01. Agriculture, Forestry, Hunting and Fishing 1,283.3 4,864.9 219.8 472.3 686.82. Mining and Quarrying 4,621.4 1,967.0 123.2 882.9 949.53. Manufacturing : 6,893.8 10,803.2 15,997.4 19,793.4 22,513.4
(i) Food Industries 366.7 317.1 1,203.2 117.7 332.3(ii) Textiles 537.1 140.7 543.5 578.1 341.0(iii) Printing, Publishing & Allied Industries 255.6 164.8 244.2 413.6 165.8(iv) Chemicals & Chemical Products 924.1 1,297.3 1,119.5 1,287.9 1,275.2(v) Products of Petroleum & Coal 2,801.2 4,297.8 6,747.1 13,911.5 15,850.8(vi) Cement 293.4 103.2 488.6 336.4 284.9(vii) Basic Metal Industries & Manufacture of
Metal Products 513.4 1,756.5 1,193.3 2,440.3 3,608.8(viii) Machinery & Transport Equipments 608.5 749.3 644.1 165.7 186.9(ix) Miscellaneous Industries 593.9 1,976.5 3,814.0 542.3 467.7
4. Construction 498.0 489.9 415.6 3,662.6 470.15. Electricity, Gas and Sanitary Services 6,623.6 10,538.1 8,526.8 7,850.8 17,599.16. Commerce: 8,472.9 7,824.1 7,472.9 16,093.5 14,570.3
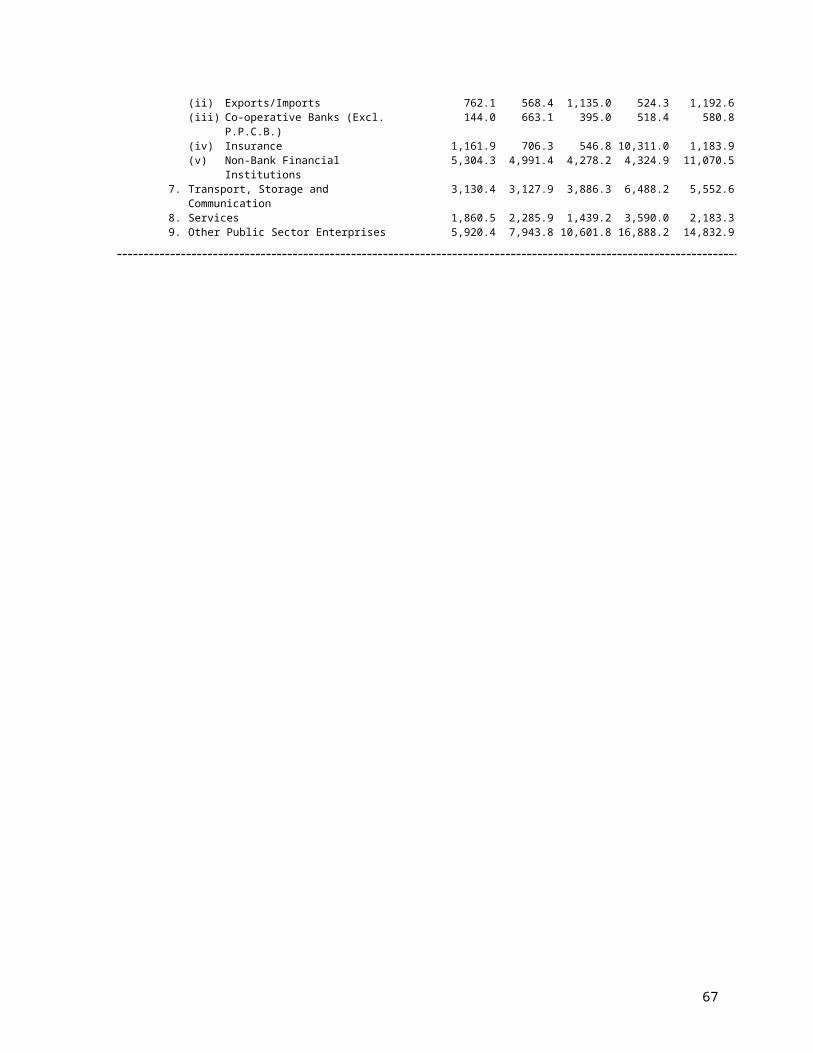
(i) Wholesale and Retail Trade 1,100.6 895.0 1,118.0 415.0 542.5(ii) Exports/Imports 762.1 568.4 1,135.0 524.3 1,192.6(iii) Co-operative Banks (Excl. P.P.C.B.) 144.0 663.1 395.0 518.4 580.8(iv) Insurance 1,161.9 706.3 546.8 10,311.0 1,183.9(v) Non-Bank Financial Institutions 5,304.3 4,991.4 4,278.2 4,324.9 11,070.5
7. Transport, Storage and Communication 3,130.4 3,127.9 3,886.3 6,488.2 5,552.68. Services 1,860.5 2,285.9 1,439.2 3,590.0 2,183.39. Other Public Sector Enterprises 5,920.4 7,943.8 10,601.8 16,888.2 14,832.9
56
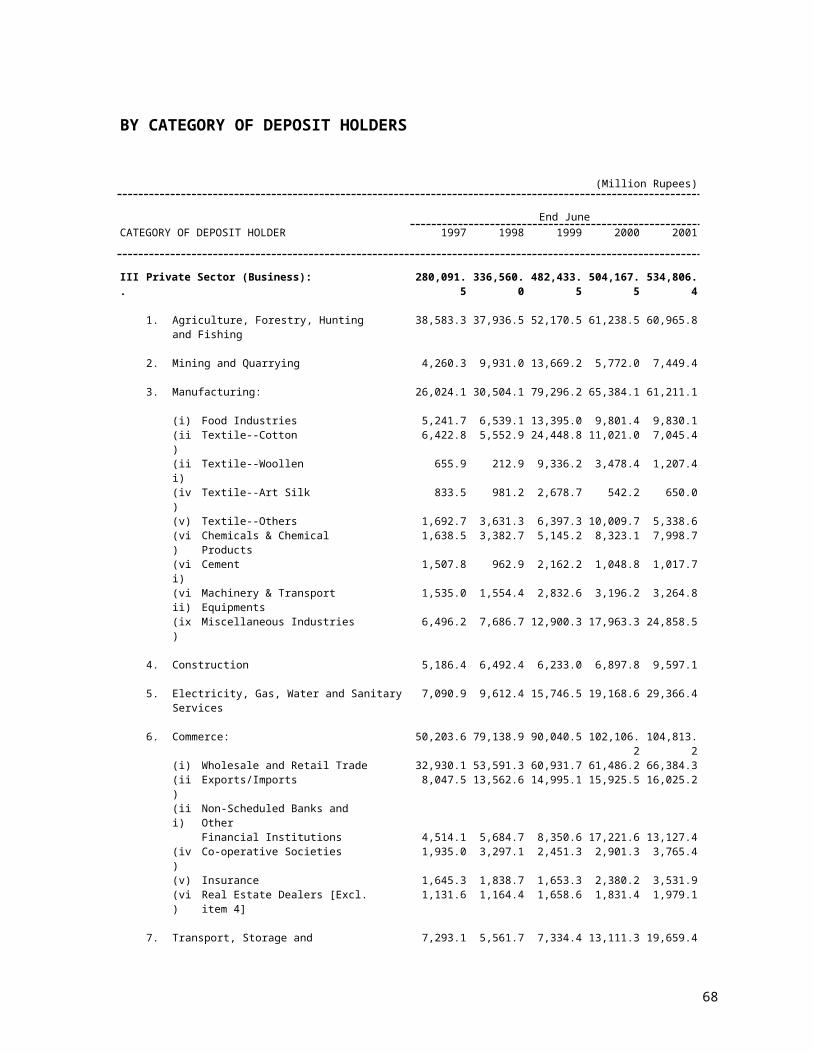
BY CATEGORY OF DEPOSIT HOLDERS
(Million Rupees)
End June
CATEGORY OF DEPOSIT HOLDER 1997 1998 1999 2000 2001
III. Private Sector (Business): 280,091.5 336,560.0 482,433.5 504,167.5 534,806.4
1. Agriculture, Forestry, Hunting and Fishing 38,583.3 37,936.5 52,170.5 61,238.5 60,965.8
2. Mining and Quarrying 4,260.3 9,931.0 13,669.2 5,772.0 7,449.4
3. Manufacturing: 26,024.1 30,504.1 79,296.2 65,384.1 61,211.1
(i) Food Industries 5,241.7 6,539.1 13,395.0 9,801.4 9,830.1(ii) Textile--Cotton 6,422.8 5,552.9 24,448.8 11,021.0 7,045.4(iii) Textile--Woollen 655.9 212.9 9,336.2 3,478.4 1,207.4(iv) Textile--Art Silk 833.5 981.2 2,678.7 542.2 650.0(v) Textile--Others 1,692.7 3,631.3 6,397.3 10,009.7 5,338.6(vi) Chemicals & Chemical Products 1,638.5 3,382.7 5,145.2 8,323.1 7,998.7(vii) Cement 1,507.8 962.9 2,162.2 1,048.8 1,017.7(viii) Machinery & Transport Equipments 1,535.0 1,554.4 2,832.6 3,196.2 3,264.8(ix) Miscellaneous Industries 6,496.2 7,686.7 12,900.3 17,963.3 24,858.5
4. Construction 5,186.4 6,492.4 6,233.0 6,897.8 9,597.1
5. Electricity, Gas, Water and Sanitary Services 7,090.9 9,612.4 15,746.5 19,168.6 29,366.4
6. Commerce: 50,203.6 79,138.9 90,040.5 102,106.2 104,813.2(i) Wholesale and Retail Trade 32,930.1 53,591.3 60,931.7 61,486.2 66,384.3(ii) Exports/Imports 8,047.5 13,562.6 14,995.1 15,925.5 16,025.2(iii) Non-Scheduled Banks and Other
Financial Institutions 4,514.1 5,684.7 8,350.6 17,221.6 13,127.4(iv) Co-operative Societies 1,935.0 3,297.1 2,451.3 2,901.3 3,765.4(v) Insurance 1,645.3 1,838.7 1,653.3 2,380.2 3,531.9(vi) Real Estate Dealers [Excl. item 4] 1,131.6 1,164.4 1,658.6 1,831.4 1,979.1
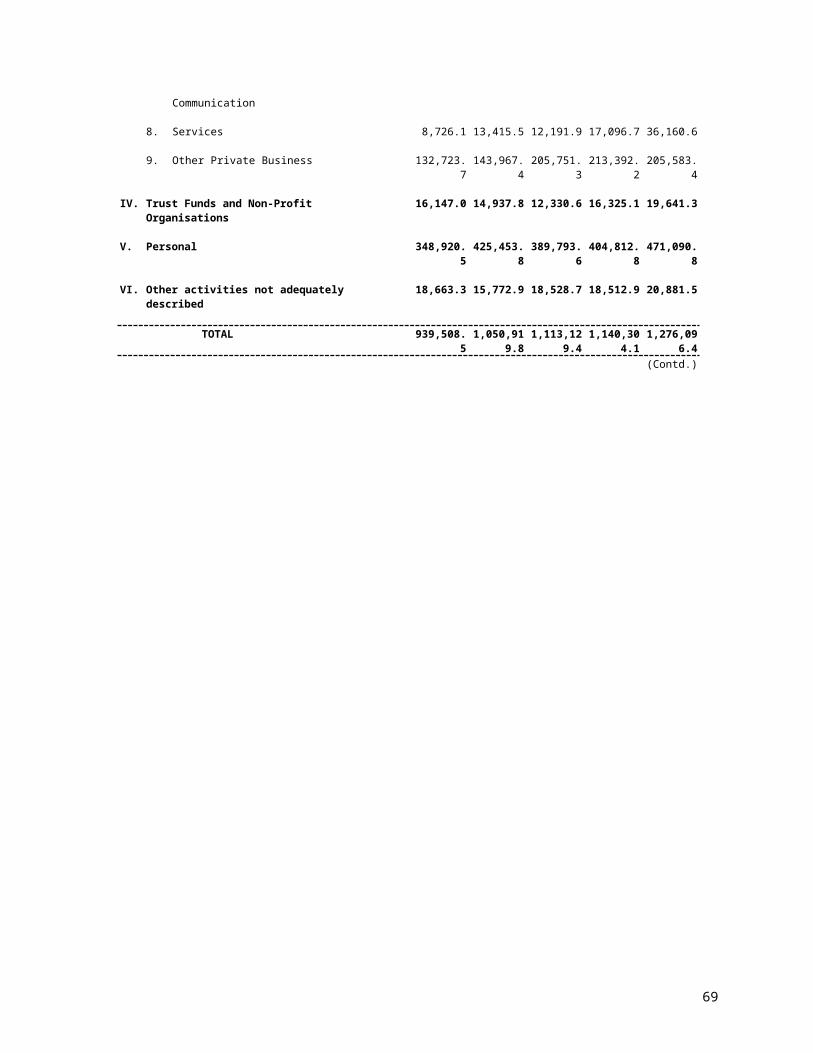
7. Transport, Storage and Communication 7,293.1 5,561.7 7,334.4 13,111.3 19,659.4
8. Services 8,726.1 13,415.5 12,191.9 17,096.7 36,160.6
9. Other Private Business 132,723.7 143,967.4 205,751.3 213,392.2 205,583.4
IV. Trust Funds and Non-Profit Organisations 16,147.0 14,937.8 12,330.6 16,325.1 19,641.3
V. Personal 348,920.5 425,453.8 389,793.6 404,812.8 471,090.8
VI. Other activities not adequately described 18,663.3 15,772.9 18,528.7 18,512.9 20,881.5
TOTAL 939,508.5 1,050,919.8 1,113,129.4 1,140,304.1 1,276,096.4(Contd.)
57
6.6 SCHEDULED BANKS' DEPOSITS DISTRIBUTED
E n d June2001
OtherCATEGORY OF DEPOSIT HOLDER All Current Call Deposit Saving Fixed
Deposits Deposits Deposits Accounts Deposits Deposits
A. FOREIGN CONSTITUENTS: 55,093.0 5,429.6 68.4 271.4 8,617.1 40,706.5
I. Official 9,226.4 1,577.0 37.8 181.0 968.3 6,462.3
II. Business 28,665.9 2,047.2 0.6 31.1 2,010.5 24,576.5
III. Personal 17,200.7 1,805.5 30.0 59.3 5,638.2 9,667.7
B. DOMESTIC CONSTITUENTS: 1,221,003.4 227,472.5 18,728.0 38,063.8 636,193.7 300,545.5
I. Government: 95,225.3 24,827.4 2,962.8 2,186.9 28,570.7 36,677.61. Federal Government 59,073.9 21,337.8 1,595.8 1,130.5 17,701.5 17,308.42. Provincial Governments 32,095.5 2,998.9 1,204.9 752.0 9,356.8 17,783.03. Local Bodies 4,055.9 490.7 162.1 304.4 1,512.4 1,586.2
II. Public Sector Enterprises: 79,358.0 9,906.0 2,133.4 1,043.9 39,837.6 26,437.11. Agriculture, Forestry, Hunting and Fishing 686.8 34.7 4.6 31.5 54.6 561.32. Mining and Quarrying 949.5 118.1 305.0 63.0 218.5 245.03. Manufacturing : 22,513.4 2,318.1 382.5 170.4 11,555.6 8,086.8
(i) Food Industries 332.3 109.1 100.1 9.4 62.8 51.0(ii) Textiles 341.0 313.3 0.1 - 19.8 7.8(iii) Printing, Publishing & Allied Industries 165.8 106.0 9.4 - 43.0 7.3(iv) Chemicals & Chemical Products 1,275.2 89.8 - 2.4 277.8 905.1(v) Products of Petroleum & Coal 15,850.8 1,048.1 190.0 31.6 10,970.5 3,610.6(vi) Cement 284.9 28.2 - 28.8 1.6 226.3(vii) Basic Metal Industries & Manufacture of
Metal Products 3,608.8 508.8 70.7 - 1.8 3,027.6(viii) Machinery & Transport Equipments 186.9 27.1 - 84.2 38.8 36.8(ix) Miscellaneous Industries 467.7 87.8 12.3 14.0 139.5 214.1
4. Construction 470.1 135.9 81.6 92.6 119.6 40.35. Electricity, Gas and Sanitary Services 17,599.1 3821.2 926.2 21.1 10,283.6 2,547.06. Commerce: 14,570.3 1,602.3 234.8 291.0 6,634.2 5,808.0
(i) Wholesale and Retail Trade 542.5 264.1 18.1 13.2 75.4 171.6(ii) Exports/Imports 1,192.6 156.5 0.6 6.3 454.4 574.7(iii) Co-operative Banks (Excl. P.P.C.B.) 580.8 5.1 - 260.8 106.1 208.8(iv) Insurance 1,183.9 746.9 4.4 5.0 305.0 122.6(v) Non-Bank Financial Institutions 11,070.5 429.7 211.7 5.6 5,693.2 4,730.2
7. Transport, Storage and Communication 5,552.6 264.2 0.5 13.6 770.1 4,504.38. Services 2,183.3 262.7 1.4 217.1 1,021.0 681.09. Other Public Sector Enterprises 14,832.9 1,348.7 197.0 143.5 9,180.4 111,439.7
58
BY CATEGORY OF DEPOSIT HOLDERS
(Concld.)
(Million Rupees)
E n d June 2001
OtherCATEGORY OF DEPOSIT HOLDER All Current Call Deposit Saving Fixed
Deposits Deposits Deposits Accounts Deposits Deposits
III. Private Sector (Business): 534,806.4 143,567.1 8,928.9 22,522.3 248,348.4 111,439.7
1. Agriculture, Forestry, Hunting and Fishing 60,965.8 5,773.2 215.3 1,798.6 44,143.3 9,035.4
2. Mining and Quarrying 7,449.4 1,469.9 126.8 339.4 4,211.2 1,302.1
3. Manufacturing: 61,211.1 16,985.8 2,376.2 1,799.8 22,140.9 17,908.3(i) Food Industries 9,830.1 3,551.9 192.8 314.3 4,140.4 1,630.9(ii) Textile-Cotton 7,045.4 2,672.5 223.1 350.1 3,043.4 756.4(iii) Textile-Woolen 1,207.4 336.1 2.2 11.2 762.5 95.5(iv) Textile-Art Silk 650.0 242.4 2.1 - 85.9 319.6(v) Textile-Others 5,338.6 2,979.9 140.5 185.5 1,161.2 871.6(vi) Chemicals & Chemical Products 7,998.7 1,485.8 971.3 89.0 3,169.4 2,283.2(vii) Cement 1,017.7 301.7 70.1 146.5 340.1 159.3(viii) Machinery & Transport Equipments 3,264.8 585.5 152.9 143.1 1,287.5 1,095.8(ix) Miscellaneous Industries 24,858.5 4,830.1 621.5 560.3 8,150.6 10,696.1
4. Construction 9,597.1 3,816.0 593.4 308.0 3,686.1 1,193.5
5. Electricity, Gas, Water and Sanitary Services 29,366.4 6,633.0 188.0 356.9 13,918.0 8,270.5
6. Commerce: 104,813.2 38,182.2 1,670.4 3,721.9 38,468.0 22,770.7(i) Wholesale and Retail Trade 66,384.3 26,594.2 1,008.9 2,718.4 27,529.0 8,533.8(ii) Exports/Imports 16,025.2 6,085.6 316.1 701.7 5,867.9 3,053.8(iii) Non-Scheduled Banks and Other
Financial Institutions 13,127.4 2,052.2 162.3 198.0 2,852.1 7,862.8(iv) Co-operative Societies 3,765.4 1,994.8 60.0 12.9 967.2 730.4(v) Insurance 3,531.9 917.1 107.1 58.0 746.6 1,703.1(vi) Real Estate Dealers [Excl. item 4] 1,979.1 538.2 16.01 32.9 505.1 886.9
7. Transport, Storage and Communication 19,659.4 5,591.7 316.2 222.6 5,780.6 7,748.3
8. Services 36,160.6 12,701.5 220.7 649.7 14,229.2 8,359.5
9. Other Private Business 205,583.4 52,413.8 3,221.9 13,325.3 101,770.9 34,851.4
IV. Trust Funds and Non-Profit Organisations 19,641.3 2,538.5 397.9 174.1 9,583.3 6,947.5
V. Personal 471,090.8 43,017.8 4,016.6 8,232.6 304,434.7 111,389.0VI. Other activities not adequately described 20,881.5 3,651.7 288.3 3,904.0 5,419.0 7,654.5
TOTAL 1,276,096.4 232,902.1 18,796.4 38,335.2 644,810.8 341,252.0
59
6.7 SCHEDULED BANKS' DEPOSITS
E n d J u n e1996 1997 1998
SIZE OF ACCOUNT No. of No. of No. ofAccounts Amount Accounts Amount Accounts Amount
Less than` Rs. 1,000 1,128,810 582.3 1,004,219 586.8 804,003 451.2Rs. 1,000 to Rs. 1,500 574,685 717.3 599,292 735.0 600,620 742.1Rs. 1,500 to Rs. 2,000 522,901 908.5 720,137 1,271.7 501,180 885.6Rs. 2,000 to Rs. 3,000 1,941,435 4,893.9 1,913,284 4,839.7 1,048,782 2,609.2Rs. 3,000 to Rs. 4,000 2,367,882 8,311.2 2,558,176 9,047.7 1,248,557 4,390.0
Rs. 4,000 to Rs. 5,000 2,907,512 13,138.0 2,930,666 13,241.1 1,797,538 8,117.0Rs. 5,000 to Rs. 6,000 2,676,312 14,668.8 2,926,561 16,118.4 2,019,422 11,199.3Rs. 6,000 to Rs. 7,000 2,825,417 18,307.0 2,727,890 17,691.4 2,071,285 13,473.2Rs. 7,000 to Rs. 8,000 2,177,623 16,321.5 2,425,850 18,214.9 2,011,637 15,112.2Rs. 8,000 to Rs. 9,000 1,978,472 16,803.0 2,254,999 19,090.2 2,088,366 17,754.2
Rs. 9,000 to Rs. 10,000 1,721,787 16,361.9 1,697,541 16,097.6 1,977,365 18,738.2Rs. 10,000 to Rs. 20,000 6,207,682 83,300.0 6,651,576 90,138.7 8,234,832 111,865.2Rs. 20,000 to Rs. 25,000 996,284 22,186.6 990,000 22,033.0 1,208,747 26,918.6Rs. 25,000 to Rs. 30,000 526,720 14,388.3 583,716 15,984.7 753,695 20,678.2Rs. 30,000 to Rs. 40,000 633,551 21,776.3 687,693 23,861.2 829,286 28,628.8
Rs. 40,000 to Rs. 50,000 364,578 16,259.9 412,658 18,341.7 485,372 21,666.0Rs. 50,000 to Rs. 60,000 269,845 14,705.9 282,294 15,431.1 274,956 15,102.8Rs. 60,000 to Rs. 70,000 172,197 11,122.6 179,578 11,624.2 206,293 13,372.4Rs. 70,000 to Rs. 80,000 144,832 10,829.6 175,362 13,075.6 177,724 13,234.6Rs. 80,000 to Rs. 90,000 146,714 12,537.7 118,579 10,041.5 125,734 10,642.7
Rs. 90,000 to Rs. 100,000 136,977 13,020.6 112,066 10,684.1 138,000 13,082.8Rs. 100,000 to Rs. 200,000 609,017 83,366.3 660,448 92,216.4 754,981 106,306.2Rs. 200,000 to Rs. 300,000 168,699 40,841.1 213,569 51,491.9 249,355 60,736.7Rs. 300,000 to Rs. 400,000 67,059 22,792.2 97,733 33,897.8 98,344 34,054.1Rs. 400,000 to Rs. 500,000 41,969 18,631.3 52,065 23,470.3 65,474 29,271.9
Rs. 500,000 to Rs. 600,000 30,444 16,624.6 26,086 14,213.8 35,781 19,447.4Rs. 600,000 to Rs. 700,000 16,441 10,700.5 29,079 18,800.0 26,525 17,278.7Rs. 700,000 to Rs. 800,000 12,035 8,980.1 15,258 11,404.2 14,711 11,012.8Rs. 800,000 to Rs. 900,000 14,436 12,317.8 12,219 10,323.6 15,536 13,083.5Rs. 900,000 to Rs. 1,000,000 7,398 7,021.4 9,821 9,296.1 13,329 12,621.7
Rs. 1,000,000 to Rs. 2,000,000 43,035 56,958.7 53,447 73,389.7 55,431 76,862.3Rs. 2,000,000 to Rs. 3,000,000 8,513 20,632.5 14,535 33,751.6 18,458 44,511.9Rs. 3,000,000 to Rs. 4,000,000 3,230 11,493.2 4,366 15,111.0 7,358 25,354.3Rs. 4,000,000 to Rs. 5,000,000 4,866 20,775.7 2,197 9,684.7 3,377 15,134.9Rs. 5,000,000 to Rs. 6,000,000 1,314 7,161.2 1,328 7,177.4 2,119 11,592.3
Rs. 6,000,000 to Rs. 7,000,000 637 4,068.7 1,822 11,777.3 823 5,312.8Rs. 7,000,000 to Rs. 8,000,000 496 3,718.1 630 4,805.2 788 5,894.3Rs. 8,000,000 to Rs. 9,000,000 461 3,875.8 591 5,019.5 587 5,002.0Rs. 9,000,000 to Rs. 10,000,000 466 4,352.8 260 2,463.7 460 4,338.7Rs. 10,000,000 and over 2,859 141,400.7 3,269 163,064.2 4,450 184,439.1
TOTAL 31,455,591 826,853.2 33,150,860 939,508.5 29,971,281 1,050,919.8
60
DISTRIBUTED BY SIZE OF ACCOUNT
(Million Rupees)
E n d J u n e1999 2000 2001
No. of No of No.of SIZE OF ACCOUNTAccounts Amount Accounts Amount Accounts Amount
769,597 466.9 909,562 547.4 869,244 510.5 Less than` Rs. 1,000 565,434 698.7 529,664 648.1 476,719 584.4 Rs. 1,000 to Rs. 1,500 428,576 752.7 411,157 714.9 317,750 552.2 Rs. 1,500 to Rs. 2,000 934,108 2,350.1 708,537 1,792.2 639,909 1,635.2 Rs. 2,000 to Rs. 3,000
1,215,632 4,259.2 907,610 3,181.6 758,370 2,663.8 Rs. 3,000 to Rs. 4,000
1,260,822 5,707.4 1,194,839 5,409.3 877,618 3,933.5 Rs. 4,000 to Rs. 5,000 1,695,252 9,343.9 1,312,603 7,234.8 1,077,417 5,935.4 Rs. 5,000 to Rs. 6,000 1,971,237 12,825.3 1,297,099 8,435.8 1,098,367 7,151.8 Rs. 6,000 to Rs. 7,000 1,939,921 14,539.5 1,489,059 11,194.0 1,166,886 8,743.5 Rs. 7,000 to Rs. 8,000 1,754,104 14,880.3 1,588,754 13,487.9 1,372,528 11,647.1 Rs. 8,000 to Rs. 9,000
1,880,741 17,839.9 1,529,834 14,560.6 1361,523 12,940.5 Rs. 9,000 to Rs. 10,000 9,589,269 130,126.8 9,332,460 130,641.1 8,842,127 127,085.4 Rs. 10,000 to Rs. 20,000 1,535,182 34,178.9 1,930,499 43,140.1 2,303,767 51,336.3 Rs. 20,000 to Rs. 25,000 1,174,537 31,530.2 1,159,898 31,686.3 1,364,194 37,321.1 Rs. 25,000 to Rs. 30,000 1,021,065 34,969.5 1,215,050 41,843.9 1,562,044 53,672.2 Rs. 30,000 to Rs. 40,000
579,301 25,961.8 653,930 29,192.6 746,297 33,394.1 Rs. 40,000 to Rs. 50,000 652,851 34,463.0 447,409 24,369.5 497,115 27,098.0 Rs. 50,000 to Rs. 60,000 282,257 18,211.3 307,174 19,870.9 374,946 24,323.7 Rs. 60,000 to Rs. 70,000 210,085 15,656.4 211,955 15,884.6 244,934 18,204.1 Rs. 70,000 to Rs. 80,000 178,544 15,146.4 176,410 14,926.9 196,547 16,770.8 Rs. 80,000 to Rs. 90,000
151,637 14,438.2 147,271 13,980.3 178,228 16,934.8 Rs. 90,000 to Rs. 100,000 728,668 101,169.3 788,321 109,006.5 798,767 111,595.5 Rs. 100,000 to Rs. 200,000 247,315 60,506.5 259,305 62,805.4 274,984 66,636.0 Rs. 200,000 to Rs. 300,000 105,194 35,806.5 102,038 35,193.4 112,619 38,703.8 Rs. 300,000 to Rs. 400,000
48,200 21,591.4 41,064 18,121.4 55,688 24,605.8 Rs. 400,000 to Rs. 500,000
26,551 14,574.5 29,344 15,965.1 40,256 21,868.8 Rs. 500,000 to Rs. 600,000 20,919 13,427.0 16,768 10,861.6 24,720 15,976.3 Rs. 600,000 to Rs. 700,000 15,927 11,873.9 17,999 13,489.1 22,981 17,157.1 Rs. 700,000 to Rs. 800,000 11,991 10,185.0 8,772 7,496.6 12,526 10,606.7 Rs. 800,000 to Rs. 900,000
8,625 8,154.3 8,663 8,262.3 10,501 9,945.0 Rs. 900,000 to Rs. 1,000,000
39,939 55,320.1 39,119 54,504.5 37,201 50,443.0 Rs. 1,000,000 to Rs. 2,000,000 14,448 34,895.3 11,658 27,931.5 12,401 30,701.1 Rs. 2,000,000 to Rs. 3,000,000
4,453 15,452.9 4,023 14,064.9 6,342 21,718.5 Rs. 3,000,000 to Rs. 4,000,000 3,149 14,017.2 2,427 10,770.6 2,842 12,605.1 Rs. 4,000,000 to Rs. 5,000,000 2,162 11,747.7 2,023 10,809.0 3,010 16,127.5 Rs. 5,000,000 to Rs. 6,000,000
1,317 8,569.4 1,179 7,677.3 1,391 8,907.1 Rs. 6,000,000 to Rs. 7,000,000 766 5,726.2 785 5,898.0 1,043 7,886.8 Rs. 7,000,000 to Rs. 8,000,000 672 5,710.9 809 6,909.0 660 5,559.2 Rs. 8,000,000 to Rs. 9,000,000 655 6,328.5 645 6,148.0 885 8,449.8 Rs. 9,000,000 to Rs. 10,000,000
4,343 239,726.7 4,815 281,647.1 5,940 334,165.3 Rs. 10,000,000 and over31,075,446 1,113,129.4 28,800,531 1,140,304.1 27,751,287 1,276,096.4 TOTAL
61
6.8 SCHEDULED BANKS' DEPOSITS DISTRIBUTEDALL
As on
D O M E S T I CFOREIGN Public Sector Private Sector
SIZE OF ACCOUNT CONSTITUENTS Government Enterprises (Business) Trust FundsNo of No. of No. of No. of No of
Accounts Amount Accounts Amount Accounts Amount Accounts Amount Accounts Amount
Less than Rs. 1,000 426 0.3 2,024 0.9 1,610 0.6 480,725 303.7 1,356 0.6Rs. 1,000 to Rs. 1,500 133 0.2 1,674 2.3 245 0.3 232,901 281.7 1,107 1.2Rs. 1,500 to Rs. 2,000 110 0.2 1,078 2.0 841 1.4 163,563 281.5 1,548 2.6Rs. 2,000 to Rs. 3,000 907 2.6 1,090 2.5 391 1.0 182,782 457.1 3,422 8.7Rs. 3,000 to Rs. 4,000 971 3.2 1,785 6.4 1,266 4.5 276,747 974.8 1,444 5.1
Rs. 4,000 to Rs. 5,000 56 0.3 3,563 16.1 1,422 6.6 353,560 1,589.0 2,415 11.0Rs. 5,000 to Rs. 6,000 152 0.8 6,790 38.0 1,525 8.2 469,256 2,590.5 1,803 9.8Rs. 6,000 to Rs. 7,000 660 4.2 5,075 33.5 2,956 19.3 466,039 3,027.8 1,495 9.5Rs. 7,000 to Rs. 8,000 122 0.9 3,904 29.3 3,852 29.2 476,410 3,574.7 1,165 8.6Rs. 8,000 to Rs. 9,000 481 4.1 4,575 38.9 351 3.0 712,166 6,061.3 1,389 12.1
Rs. 9,000 to Rs. 10,000 15 0.1 2,913 27.5 549 5.0 666,694 6,314.8 2,935 28.2Rs. 10,000 to Rs. 20,000 9,337 123.5 14,046 208.0 16,745 249.8 4,144,510 59,325.7 13,900 194.7Rs. 20,000 to Rs. 25,000 1,555 32.8 5,026 111.3 9,701 226.5 1,046,825 23,331.0 4,108 93.0Rs. 25,000 to Rs. 30,000 994 27.1 5,662 153.1 5,399 145.1 656,684 17,894.0 2,675 74.8Rs. 30,000 to Rs. 40,000 5,462 197.7 2,289 78.5 5,113 174.5 818,709 28,211.1 2,886 96.6
Rs. 40,000 to Rs. 50,000 5,945 267.6 3,605 160.0 9,708 455.5 390,712 17,510.0 4,179 186.7Rs. 50,000 to Rs. 60,000 672 35.9 3,707 206.5 2,486 140.3 271,586 14,794.9 2,042 110.5Rs. 60,000 to Rs. 70,000 1,645 104.4 4,234 279.8 1,428 90.7 163,821 10,601.9 1,734 115.9Rs. 70,000 to Rs. 80,000 916 67.6 2,974 226.7 518 39.5 112,528 8,416.1 886 65.4Rs. 80,000 to Rs. 90,000 731 61.7 2,274 194.2 1,415 117.3 96,939 8,297.3 997 85.6
Rs. 90,000 to Rs. 100,000 1,792 169.1 1,745 165.0 2,165 207.8 75,618 7,172.9 769 72.6Rs. 100,000 to Rs. 200,000 11,120 1,521.0 5,853 842.2 6,417 858.7 357,598 49,767.2 5,041 706.8Rs. 200,000 to Rs. 300,000 7,224 1,643.9 3,043 735.7 1,529 381.4 111,488 26,756.1 2,134 526.5Rs. 300,000 to Rs. 400,000 3,296 1,111.8 1,580 534.5 1,360 443.5 45,184 15,582.8 1,208 420.2Rs. 400,000 to Rs. 500,000 664 297.6 933 425.2 819 369.7 19,966 8,950.4 1,059 480.6
Rs. 500,000 to Rs. 600,000 715 374.2 1,115 611.5 377 207.0 17,604 9,590.1 607 330.0Rs. 600,000 to Rs. 700,000 258 164.8 705 453.7 286 178.7 11,412 7,291.5 188 125.5Rs. 700,000 to Rs. 800,000 2,368 1,748.3 700 526.3 371 272.9 8,128 6,106.6 381 281.7Rs. 800,000 to Rs. 900,000 131 111.7 456 383.5 357 301.8 5,126 4,345.7 221 190.0Rs. 900,000 to Rs. 1,000,000 72 68.7 232 219.0 176 170.7 3,816 3,601.1 271 257.4
Rs. 1,000,000 to Rs. 2,000,000 1,956 2,584.3 1,966 2,736.0 1,086 1,600.3 14,957 20,504.8 1,179 1,593.9Rs. 2,000,000 to Rs. 3,000,000 360 962.2 1,050 2,609.9 652 1,601.7 6,017 14,975.1 430 1,012.3Rs. 3,000,000 to Rs. 4,000,000 150 523.2 654 2,271.1 495 1,649.1 2,884 9,807.3 238 816.9Rs. 4,000,000 to Rs. 5,000,000 98 430.1 323 1,474.9 121 521.5 1,277 5,659.3 163 760.5Rs. 5,000,000 to Rs. 6,000,000 124 651.1 443 2,309.8 192 1,060.3 738 4,072.5 125 682.6
Rs. 6,000,000 to Rs. 7,000,000 14 87.1 402 2,561.1 81 527.9 447 2,864.7 130 852.2Rs. 7,000,000 to Rs. 8,000,000 47 354.5 109 820.9 89 683.6 556 4,213.4 76 583.0Rs. 8,000,000 to Rs. 9,000,000 7 59.2 88 738.3 85 709.2 248 2,101.9 17 139.5Rs. 9,000,000 to Rs. 10,000,000 0 0.0 455 4,440.7 25 233.3 322 2,991.5 4 37.0Rs. 10,000,000 and over 206 41,295.2 1,165 68,550.8 1,107 65,660.7 2,231 114,612.6 267 8,651.5
TOTAL 61,892 55,093.0 101,305 95,225.3 85,311 79,358.0 12,868,774 534,806.4 67,994 19,641.3
62

BY CATEGORY OF DEPOSIT HOLDERS AND SIZE OF ACCOUNTBANKS30th June, 2001
(Million Rupees)
C O N S T I T U E N T S
Personal Others Sub Total TOTAL SIZE OF ACCOUNTNo. of No of No.of No. of
Accounts Amount Accounts Amount Accounts Amount Accounts Amount
323,053 163.5 60,050 41.1 868,818 510.3 869,244 510.7 Less than Rs. 1,000183,353 228.5 57,306 70.2 476,586 584.2 476,719 584.4 Rs. 1,000 to Rs. 1,500127,756 226.3 22,854 38.1 317,640 551.9 317,750 552.1 Rs. 1,500 to Rs. 2,000413,450 1,069.8 37,867 93.6 639,002 1632.7 639,909 1,635.3 Rs. 2,000 to Rs. 3,000454,086 1,593.8 22,071 76.1 757,399 2660.7 758,370 2,663.9 Rs. 3,000 to Rs. 4,000
497,961 2,226.3 18,641 84.2 877,562 3933.2 877,618 3,933.5 Rs. 4,000 to Rs. 5,000578,933 3,185.7 18,958 102.3 1,077,265 5934.5 1,077,417 5,935.3 Rs. 5,000 to Rs. 6,000604,222 3,943.0 17,920 114.5 1,097,707 7147.6 1,098,367 7,151.8 Rs. 6,000 to Rs. 7,000669,133 5,009.6 12,300 91.2 1,166,764 8742.6 1,166,886 8,743.5 Rs. 7,000 to Rs. 8,000635,453 5,373.5 18,113 154.2 1,372,047 11643 1,372,528 11,647.1 Rs. 8,000 to Rs. 9,000
668,537 6,374.3 19,880 190.6 1,361,508 12940.4 1,361,523 12,940.5 Rs. 9,000 to Rs. 10,0004,567,055 65,879.6 76,534 1,104.1 8,832,790 126961.9 8,842,127 127,085.4 Rs. 10,000 to Rs. 20,0001,213,834 27,044.7 22,718 497.1 2,302,212 51303.6 2,303,767 51,336.4 Rs. 20,000 to Rs. 25,000
671,623 18,440.0 21,157 587.1 1,363,200 37294.1 1,364,194 37,321.2 Rs. 25,000 to Rs. 30,000699,390 23,943.8 28,195 970.1 1,556,582 53474.6 1,562,044 53,672.3 Rs. 30,000 to Rs. 40,000
316,464 14,115.1 15,684 699.1 740,352 33126.4 746,297 33,394.0 Rs. 40,000 to Rs. 50,000206,077 11,238.4 10,545 571.5 496,443 27062.1 497,115 27,098.0 Rs. 50,000 to Rs. 60,000195,894 12,728.0 6,190 402.9 373,301 24219.2 374,946 24,323.6 Rs. 60,000 to Rs. 70,000121,767 8,989.1 5,345 399.7 244,018 18136.5 244,934 18,204.1 Rs. 70,000 to Rs. 80,000
87,688 7,463.9 6,503 550.9 195,816 16709.2 196,547 16,770.9 Rs. 80,000 to Rs. 90,000
93,194 8,870.0 2,945 277.4 176,436 16765.7 178,228 16,934.8 Rs. 90,000 to Rs. 100,000393,951 55,267.1 18,787 2,632.5 787,647 110074.5 798,767 111,595.5 Rs. 100,000 to Rs. 200,000141,792 34,747.8 7,774 1,844.6 267,760 64992.1 274,984 66,636.0 Rs. 200,000 to Rs. 300,000
55,890 19,194.1 4,101 1,416.9 109,323 37592 112,619 38,703.8 Rs. 300,000 to Rs. 400,00030,177 13,161.3 2,070 920.9 55,024 24308.1 55,688 24,605.7 Rs. 400,000 to Rs. 500,000
18,867 10,223.5 971 532.6 39,541 21494.7 40,256 21,868.9 Rs. 500,000 to Rs. 600,00011,115 7,276.4 756 485.8 24,462 15811.6 24,720 15,976.4 Rs. 600,000 to Rs. 700,00010,583 7,886.5 450 334.7 20,613 15408.7 22,981 17,157.0 Rs. 700,000 to Rs. 800,000
5,948 5,029.5 287 244.5 12,395 10495 12,526 10,606.7 Rs. 800,000 to Rs. 900,0005,622 5,337.3 312 290.9 10,429 9876.4 10,501 9,945.1 Rs. 900,000 to Rs. 1,000,000
14,998 19,965.3 1,059 1,458.4 35,245 47858.7 37,201 50,443.0 Rs. 1,000,000 to Rs. 2,000,0003,732 9,169.5 160 370.3 12,041 29738.8 12,401 30,701.0 Rs. 2,000,000 to Rs. 3,000,0001,842 6,379.2 79 271.7 6,192 21195.3 6,342 21,718.5 Rs. 3,000,000 to Rs. 4,000,000
803 3,513.4 57 245.4 2,744 12175 2,842 12,605.1 Rs. 4,000,000 to Rs. 5,000,0001,344 7,115.0 44 236.2 2,886 15476.4 3,010 16,127.5 Rs. 5,000,000 to Rs. 6,000,000
299 1,894.8 18 119.3 1,377 8820 1,391 8,907.1 Rs. 6,000,000 to Rs. 7,000,000144 1,064.6 22 166.8 996 7532.3 1,043 7,886.8 Rs. 7,000,000 to Rs. 8,000,000207 1,742.6 8 68.4 653 5499.9 660 5,559.1 Rs. 8,000,000 to Rs. 9,000,000
68 644.3 11 102.9 885 8449.7 885 8,449.7 Rs. 9,000,000 to Rs. 10,000,000878 33,371.8 86 2,022.7 5,734 292870.1 5,940 334,165.3 Rs. 10,000,000 and over
14,027,183 471,090.8 538,828 20,881.5 27,689,395 1,221,003.4 27,751,287 1,276,096.4 TOTAL
63
6.9 WEIGHTED AVERAGE RATES OF RETURN ON DEPOSITS
(i) PLS & Interest Bearing – All Banks
(Percent per annum)
1997 1998 1999 2000 2001
Type of Deposit Jun. Dec. Jun. Dec. Jun. Dec. Jun. Dec. Jun.
I. Call Deposits 6.23 6.02 6.46 6.29 6.00 5.47 5.34 4.92 5.19(1.57) (2.73) (1.61) (1.61) (2.37) (2.05) (1.87) (1.70) (1.87)
II. Saving Deposits 7.36 7.32 7.42 7.36 6.90 6.25 5.75 5.56 5.71(53.61) (54.17) (56.20) (56.07) (57.87) (58.47) (63.13) (62.42) (64.17)
III. Term or Fixed Deposits(a) Less than 3 months 7.93 7.59 7.02 7.93 7.28 6.95 6.62 6.96 7.06
(6.84) (5.43) (6.94) (7.97) (5.91) (6.31) (6.65) (7.92) (7.80)(b) 3 months and over but less than 6 months 7.25 7.18 7.27 7.34 7.29 7.19 7.17 7.37 7.37
(9.01) (8.80) (8.34) (7.66) (6.79) (7.01) (5.15) (4.40) (4.62)(c) 6 months and over but less than 1 year 7.78 8.63 8.50 9.15 8.80 8.73 7.37 7.55 8.12
(5.65) (5.54) (4.86) (4.50) (4.08) (3.78) (4.08) (4.37) (3.31)(d) 1 year and over but less than 2 years 8.30 8.65 8.79 9.03 9.37 8.45 7.76 8.24 8.19
(7.35) (7.33) (6.60) (5.88) (5.71) (5.60) (4.42) (3.91) (3.76)(e) 2 years and over but less than 3 years 10.38 10.62 10.12 10.55 9.92 9.33 9.01 7.79 7.99
(1.83) (2.07) (2.03) (2.38) (1.69) (1.58) (1.70) (2.28) (2.17)(f) 3 years and over but less than 4 years 12.41 12.32 12.14 11.79 10.06 9.28 8.73 8.94 8.35
(3.16) (2.90) (3.09) (2.66) (3.57) (2.99) (2.77) (2.64) (2.71)(g) 4 years and over but less than 5 years 13.08 13.35 13.12 12.08 12.30 11.01 9.49 9.27 9.12
(1.34) (1.57) (1.68) (2.01) (1.88) (1.64) (1.52) (1.40) (1.11)
(h) 5 years and over 14.90 14.80 14.02 13.80 12.31 11.21 10.35 10.03 9.99(9.64) (9.46) (8.65) (9.26) (10.13) (10.58) (8.71) (8.96) (8.48)
IV. Overall
(i) Excluding current & other deposits 8.49 8.47 8.38 8.45 7.96 7.30 6.62 6.52 6.58
(ii) Including current & other deposits 6.80 6.38 6.81 6.69 6.49 5.83 5.47 5.39 5.27
Note : Figures in parentheses represent as percentage of total deposits(excluding current & other deposits )PLS : Profit and Loss Sharing (Contd.)
64

6.9 WEIGHTED AVERAGE RATES OF RETURN ON DEPOSITS
(ii) Profit & Loss Sharing – All Banks
(Percent per annum)
1997 1998 1999 2000 2001
Type of Deposit Jun. Dec. Jun. Dec. Jun. Dec. Jun. Dec. Jun.
I. Call Deposits 6.65 6.70 6..90 6.97 6.36 5.89 5.60 5.18 5.47(1.77) (3.48) (1.76) (1.62) (2.18) (1.84) (1.84) (1.59) (1.72)
II. Saving Deposits 7.97 8.12 8.14 8.17 7.56 6.77 6.11 5.93 6.13(59.76) (58.81) (61.08) (59.83) (59.18) (59.46) (63.64) (63.06) (65.77)
III. Term or Fixed Deposits(a) Less than 3 months 9.27 8.82 8.38 9.65 8.32 7.95 7.11 7.80 8.12
(6.42) (4.48) (4.98) (6.81) (5.80) (5.50) (6.52) (7.08) (6.78)(b) 3 months and over but less than 6 months 10.18 10.38 10.55 10.67 9.50 8.57 8.04 8.35 8.39
(3.75) (3.54) (3.83) (4.05) (4.63) (5.80) (4.65) (3.78) (4.09)(c) 6 months and over but less than 1 year 10.86 11.66 11.34 11.49 10.02 9.40 8.27 8.39 8.80
(2.88) (3.50) (3.47) (3.88) (4.01) (4.13) (3.51) (3.94) (3.25)(d) 1 year and over but less than 2 years 11.55 11.79 11.69 12.14 10.85 9.78 8.70 8.56 8.88
(4.05) (4.55) (4.53) (4.16) (5.45) (4.97) (3.99) (4.33) (3.69)(e) 2 years and over but less than 3 years 12.10 12.21 11.82 12.10 11.06 10.09 9.31 8.75 8.99
(1.81) (1.89) (1.96) (2.45) (1.69) (1.68) (1.96) (2.02) (1.83)(f) 3 years and over but less than 4 years 13.09 13.18 12.98 12.96 11.39 10.22 9.35 9.08 9.04
(4.28) (3.83) (4.12) (3.08) (3.44) (2.95) (2.78) (3.08) (2.54)(g) 4 years and over but less than 5 years 13.61 13.71 13.67 13.44 13.05 11.15 9.69 9.37 9.44
(1.87) (2.33) (2.41) (2.29) (2.15) (2.03) (1.71) (1.64) (1.17)
(h) 5 years and over 15.42 15.34 14.79 14.57 12.93 11.61 10.59 10.07 10.04(13.41) (13.59) (11.86) (11.83) (11.47) (11.64) (9.40) (9.48) (9.16)
IV. Overall
(i) Excluding current & other deposits 9.74 9.85 9.69 9.77 8.87 7.99 7.07 6.95 7.06
(ii) Including current & other deposits 7.20 6.77 7.54 7.48 7.16 6.43 5.92 5.84 5.74
Note : Figures in parentheses represent as percentage of total deposits(excluding current & other deposits ) (Contd.)
65
6.9 WEIGHTED AVERAGE RATES OF RETURN ON DEPOSITS
(iii) Interest Bearing – All Banks(Concld.)
(Percent per annum)
1997 1998 1999 2000 2001
Type of Deposit Jun. Dec. Jun. Dec. Jun. Dec. Jun. Dec. Jun.
I. Call Deposits 5.09 3.15 5.47 4.84 5.21 4.52 4.42 4.07 4.35(1.20) (1.43) (1.35) (1.58) (2.93) (2.75) (1.98) (2.17) (2.52)
II. Saving Deposits 5.80 5.57 5.84 5.28 4.78 4.34 4.30 3.89 3.62(42.31) (46.14) (47.83) (48.26) (54.03) (55.13) (61.21) (59.63) (57.12)
III. Term or Fixed Deposits(a) Less than 3 months 5.86 6.25 5.89 5.58 4.42 4.92 4.89 4.74 4.47
(7.60) (7.07) (10.32) (10.38) (6.21) (9.05) (7.15) (11.57) (12.30)(b) 3 months and over but less than 6 months 6.17 6.08 5.94 5.50 5.00 4.74 4.99 5.10 4.70
(18.67) (17.90) (16.08) (15.15) (13.16) (11.07) (7.05) (7.09) (6.93)(c) 6 months and over but less than 1 year 6.26 6.62 6.16 5.89 5.40 5.12 5.44 5.29 5.39
(10.76) (9.08) (7.23) (5.79) (4.26) (2.59) (6.24) (6.26) (3.57)(d) 1 year and over but less than 2 years 6.50 6.61 6.56 6.19 5.68 5.55 5.43 5.38 5.45
(13.42) (12.15) (10.15) (9.44) (6.48) (7.73) (6.04) (2.07) (4.07)(e) 2 years and over but less than 3 years 7.33 7.59 7.43 7.02 6.56 5.97 5.94 5.41 5.79
(1.87) (2.39) (2.14) (2.24) (1.69) (1.26) (0.73) (3.47) (3.65)(f) 3 years and over but less than 4 years 7.55 7.89 7.67 7.64 6.66 6.31 6.35 6.28 6.10
(1.09) (1.28) (1.33) (1.80) (3.97) (3.13) (2.75) (0.69) (3.44)(g) 4 years and over but less than 5 years 8.21 7.82 7.88 7.58 7.94 7.84 7.86 7.29 7.27
(0.37) (0.26) (0.44) (1.43) (1.09) (0.30) (0.81) (0.38) (0.90)
(h) 5 years and over 10.16 9.33 9.01 8.96 8.92 8.96 8.91 9.79 9.55(2.70) (2.30) (3.13) (3.93) (6.18) (7.00) (6.04) (6.67) (5.50)
IV. Overall
(i) Excluding current & other deposits 6.18 6.07 6.12 5.72 5.28 4.97 4.91 4.67 4.48
(ii) Including current & other deposits 5.85 5.48 5.41 4.89 4.45 4.03 4.00 3.76 3.49
Note : Figures in parentheses represent as percentage of total deposits(excluding current & other deposits )
66
6.10 WEIGHTED AVERAGE RATES OF RETURN ON ADVANCES
(Percent per annum)Stock
AS AT THE Precious Exchange Real Financial TOTALEND OF Metals Securities Merchandise Machinery Estate Obligations Others ADVANCES
I. INTEREST BEARING & ISLAMIC MODES OF FINANCING - ALL BANKS
1997 Jun. 11.65 16.51 15.92 14.00 12.45 15.89 13.60 14.55Dec. 12.41 16.37 15.14 14.72 13.70 15.36 14.46 14.71
1998 Jun. 15.43 16.58 15.94 16.32 14.69 15.31 15.59 15.64Dec. 14.51 16.24 15.88 15.78 14.09 15.24 15.72 15.42
1999 Jun. 11.35 15.65 15.08 15.63 13.79 14.50 14.95 14.80Dec. 11.14 14.40 14.81 15.20 13.58 13.85 14.68 14.46
2000 Jun. 10.68 13.15 13.49 14.24 13.04 13.44 13.79 13.52Dec. 11.29 13.51 13.50 14.43 12.97 13.18 13.88 13.55
2001 Jun. 11.14 13.48 13.40 14.42 13.28 13.73 13.87 13.61
II. INTEREST BEARING - ALL BANKS
1997 Jun. 11.55 15.35 13.21 14.44 12.73 13.95 13.15 13.53Dec. 12.25 13.20 13.79 15.35 13.11 12.35 12.59 13.72
1998 Jun. 14.47 16.38 14.84 16.12 16.23 16.32 16.49 16.09Dec. 13.75 15.17 14.52 15.48 14.19 15.76 15.53 15.00
1999 Jun. 13.39 14.15 13.89 15.19 14.08 14.95 14.29 14.47Dec. 11.41 13.79 14.56 14.17 13.75 13.14 14.07 14.09
2000 Jun. 11.10 13.76 13.67 13.15 12.23 13.65 13.34 13.25Dec. 11.53 13.57 12.88 13.82 12.90 13.49 12.93 13.08
2001 Jun. 11.75 13.54 13.69 13.50 12.84 13.07 12.05 13.07
III. ISLAMIC MODES OF FINANCING-ALL BANKS
1997 Jun. 11.68 16.57 16.01 13.87 12.42 15.99 13.64 14.65Dec. 12.47 16.77 15.19 14.58 13.75 15.44 14.68 14.79
1998 Jun. 15.87 16.61 15.97 16.39 14.50 15.21 15.45 15.59Dec. 15.05 16.32 15.94 15.85 14.08 15.20 15.76 15.47
1999 Jun. 11.27 15.69 15.12 15.75 13.76 14.49 15.00 14.82Dec. 10.91 14.42 14.82 15.41 13.57 13.89 14.74 14.49
2000 Jun. 10.61 13.12 13.48 14.31 13.08 13.42 13.83 13.54Dec. 11.24 13.51 13.54 14.48 12.97 13.15 14.01 13.59
2001 Jun. 11.02 13.47 13.39 14.53 13.31 13.84 14.03 13.65
67
6.11 DISTRIBUTION OF OFFICES OF SEVERAL CLASSESOF SCHEDULED BANKS BY POPULATION
(End June)2000 2001
POPULATION Total Average Total Average
No of Pakistani Foreign Scheduled Population No. of Pakistani Foreign Scheduled Population
Places Banks Banks Banks per office Places Banks Banks Banks per office
Over 5,000,000 2 1,292 55 1,347 10,692 2 1,207 57 1,264 11,394
1,000,000 to 5,000,000 5 712 9 721 9,591 5 679 9 688 10,051
500,000 to 1,000,000 3 392 11 403 5,142 3 378 11 389 5,327
200,000 to 500,000 13 600 3 603 6,377 13 569 3 572 6,722
100,000 to 200,000 28 391 - 391 9,707 28 382 - 382 9,935
75,000 to 100,000 16 244 - 244 6,565 16 227 - 227 7,056
50,000 to 75,000 44 355 - 355 5,656 44 340 - 340 5,905
25,000 to 50,000 119 670 - 670 6,305 119 647 - 647 6,529
15,000 to 25,000 102 366 - 366 5,677 102 340 - 340 6,111
10,000 to 15,000 84 208 - 208 5,201 84 114 - 114 9,489
Less than 10,000 47,655 2,641 - 2,641 34,633 47,655 2,389 - 2,389 37,189
TOTAL 48,071 7,871 78* 7,949 48,071 7,272 80* 7,352Note :- Distribution is based in accordance with population census of 1998 Data pertaining to groups having paopulation less than 10,000 are not available* Excluding Indian Banks branches vested in custodian of enemy property since September 1965
68
6.12 LIST OF SCHEDULED BANKS OPERATING IN PAKISTANAS ON 30TH JUNE, 2001
PAKISTANI BANKS FOREIGN BANKS
Nationalized Commercial Banks1. National Bank of Pakistan 1. ABN AMRO Bank NV
2. Habib Bank Ltd. 2. Al- Baraka Islamic Bank BSC (EC)
3. United Bank Ltd. 3. American Express Bank Ltd.
4. First Women Bank Ltd. 4. Bank of Ceylon
5. Citi Bank NA
Privatized Banks 6. Credit Agricole Indosuez
1. Allied Bank of Pakistan Ltd. 7. Deutsche Bank AG
2. Muslim Commercial Bank Ltd 8. Doha Bank
9. Emirates Bank International Ltd. PJSC
Specialized Banks 10. Habib Bank AG Zurich
1. Agricultural Development Bank 11. International Finance Investment
of Pakistan ( ADBP ) and Commerce Bank Ltd.
2. Industrial Development 12. Mashreq Bank PSC
Bank of Pakistan ( IDBP ) 13. Oman International Bank SAOG
3. Federal Bank for Co-operatives 14. Rupali Bank Ltd.
4. Punjab Provincial Co-operative 15. Societe Generale, The French
Bank Ltd. ( PPCB ) and International Bank
16. Standard Chartered Bank
Private Banks 17. Standard Chartered Grindlays Bank Ltd.
1. Askari Commercial Bank Ltd. 18. The Bank of Tokyo-Mitsubishi Ltd.
2. Bank Al-Falah Ltd. 19. The Hong Kong & Shanghai
3. Bank Al-Habib Ltd. Banking Corporation Ltd.
4. Bolan Bank Ltd.
5. Faysal Bank Ltd.
6. Gulf Commercial Bank Ltd.
7. Metropolitan Bank Ltd
8. Platinum Commercial Bank Ltd.
9. Prime Commercial Bank Ltd.
10. Prudential Commercial Bank Ltd.
11. Soneri Bank Ltd.
12. The Bank of Khyber
13. The Bank of Punjab
14. Union Bank Ltd.
69