christopher john ashall - ljmu research onlineresearchonline.ljmu.ac.uk/5454/1/2017ashallphd.pdf ·...
TRANSCRIPT

LUMINOSITY DISTRIBUTIONS AND
ABUNDANCE TOMOGRAPHY
MODELLING OF TYPE IA SUPERNOVAE
Christopher John Ashall
A thesis submitted in partial fulfillment of the requirementsof Liverpool John Moores University for the degree of
Doctor of Philosophy
23rd Janurary 2017

Abstract
I present an investigation into Type Ia Supernovae (SNe Ia). The aim of this inves-
tigation is to explain the physics and diversity of SNe Ia, motivated by the fact that,
although SNe Ia are known to come from a thermonuclear explosion of a C+O Chan-
drasekhar mass (Ch-mass) White Dwarf (WD), their exact explosion scenario is one
of debate, and their full diversity is not fully understood. As SNe Ia are used as cos-
mological distance probes, understanding their explosions and progenitors systems in
more detail could have important consequences.
To examine the diversity of SNe Ia, I first present a large sample analysis of theirB
and V - band light curves, separated by host galaxy type. A new method for calculating
host galaxy extinction is implemented and the width luminosity relation (WLR) is
examined. After correction for host galaxy extinction, ‘normal’ SNe Ia (∆m15(B) <
1.6 mag) fill a larger parameter space in the WLR than previously suggested. Even
excluding fast declining SNe, ‘normal’ (MB < −18 mag) SNe Ia from Star forming (S-
F) and passive galaxies are distinct. This may indicate that various progenitor channels
are prevalent in different galaxy types. Furthermore, it was also confirmed that sub-
luminous SNe Ia tend to favour passive galaxies, which implies that this subset of SNe
Ia come from an older progenitor system. There was a lack of transition SNe Ia in the
dataset used in this project. These are SNe Ia with a luminosity between normal and
sub-luminous SNe Ia. Understanding transitional SNe Ia is important in determining
1

2
whether sub-luminous SNe Ia are a totally different population.
With the aim of understanding how normal SNe explode, I first turn my attention
to SN 2014J. SN 2014J was the closest type Ia in the last 410 years, and it was a once
in a life time opportunity to study. Therefore, a detailed spectroscopic and photometric
analysis and abundance stratification modelling of SN 2014J is presented. SN 2014J is
a spectroscopically normal type Ia SN with a B band decline rate of 0.95 mag, before
correction for extinction. It was located in the dusty starburst galaxy M82, and does
not follow the average Galactic extinction law of Rv = 3.1.
With the knowledge about the diversity of SNe Ia and the ability to carry out de-
tailed modelling, SN 1986G was next chosen to be modelled. SN 1986G sits in an
interesting area of parameter space in the WLR. It is located in the ‘gap’ between nor-
mal and sub-luminous SNe Ia. It has been theorised that sub-luminous SNe Ia come
from a different progenitor system than standard SNe Ia. Therefore, understanding SN
properties in this ‘gap’ is important for determining at which point SNe Ia properties
begin to diverge from the normal scenario. A full abundance tomography modelling of
SN 1986G was carried out. It was found that this SN is a low energy Chandrasekhar
mass explosion. It had 70% of the energy of a standard W7 model. These findings
raise the possibility that only SNe Ia with very large decline rates deviate from a Chan-
drasekhar mass.

3
It’s the little things that people do which makes the dif-ference. My little thing is understanding the Universe. - C.Ashall 2016
There is no passion in playing small, in settling for a lifethat is less than the one you are capable of living. - C. Ashall2016
I always wonder why birds stay in the same place whenthey can fly anywhere on the earth. Then I ask my self thesame thing. - Harun Yahya

Acknowledgements
First of all I would like to thank my supervisor Paolo Mazzali, without his great guid-
ance and help I would not have been able to complete this thesis. I would also like to
thank my parents, without their help in life I would not be where I am today. They have
always been supportive and helped me with my studies. I am also giving a big thank
you to my girlfriend Sophia, she has helped me throughout the whole of my PhD, and
she was a good listener I needed some one. Thank you to my second supervisor Phil
James who has helped me with my work, and helped me improve my poor english.
Finally I would like to thank all of my PhD friends who helped me get through this
process. I thoroughly enjoyed all of our political and philosophical debates.
4

List of Publications
Luminosity distributions of Type Ia supernovae, Ashall, C.; Mazzali, P.; Sasdelli, M.;
Prentice, S. J., MNRAS, 460, 3529A - 08, 2016
Photometric and spectroscopic observations, and abundance tomography modelling
of the Type Ia supernova SN 2014J located in M82, Ashall, C.; Mazzali, P.; Bersier,
D.; Hachinger, S.; Phillips, M.; Percival, S.; James, P.; Maguire, K., MNRAS, 445,
4427A - 12, 2014
Abundance stratification in Type Ia supernovae - V. SN 1986G bridging the gap be-
tween normal and subluminous SNe Ia, Ashall, C,; Mazzali,P.; Pian,E.; James,P.; MN-
RAS, 463, 1891A, 2016
A very luminous magnetar-powered supernova associated with an ultra-long -ray burst,
Greiner, Jochen; Mazzali, Paolo A.; Kann, D. Alexander; Krhler, Thomas; Pian, Elena;
Prentice, Simon; Olivares E., Felipe; Rossi, Andrea; Klose, Sylvio; Taubenberger, Ste-
fan; Knust, Fabian; Afonso, Paulo M. J.; Ashall, Chris; et al., Nature, 523,189G 07,
2015- Contribution: Magnetar light curve modelling.
5

6
Breaking the colour-reddening degeneracy in Type Ia supernovae, Sasdelli, Michele;
Ishida, E. E. O.; Hillebrandt, W.; Ashall, C.; Mazzali, P. A.; Prentice, S. J., MNRAS,
460, 373S 07, 2016 - Contribution: Advising on how to deal with photometry and
providing data for k-corrections of SN 2011fe.
The Superluminous Transient ASASSN-15lh as a Tidal Disruption Event from a Kerr
Black Hole, Leloudas, G.; Fraser, M.; Stone, N. C.; van Velzen, S.; Jonker, P. G.; Ar-
cavi, I.; Fremling, C.; Maund, J. R.; Smartt, S. J.; Kruhler, T.; Miller-Jones, J. C. A.;
Vreeswijk, P. M.; Gal-Yam, A.; Mazzali, P. A.; De Cia, A.; Howell, D. A.; Inserra, C.;
Patat, F.; de Ugarte Postigo, A.; Yaron, O.; Ashall, C.; et al.,, arXiv:1609.02927, in
press with Nature astronomy-Contribution: Providing data and taking observations.
Cartier, R.; Sullivan, M.; Firth, R.; Pignata, G.; Mazzali, P.; Maguire, K.; Childress,
M. J.; Arcavi, I.; Ashall, C.; et al., Early observations of the nearby type Ia supernova
SN 2015F, In press with MNRAS, 464, 4476V, 2017- Contribution: Providing data,
taking observations and giving advice on the science of spectral formation.
SN 2009ip at late times - an interacting transient at +2 years, Fraser, Morgan; Kotak,
Rubina; Pastorello, Andrea; Jerkstrand, Anders; Smartt, Stephen J.; Chen, Ting-Wan;
Childress, Michael; Gilmore, Gerard; Inserra, Cosimo; Kankare, Erkki; Margheim,
Steve; Mattila, Seppo; Valenti, Stefano; Ashall, Christopher; et al., MNRAS, 453,
3886F- 11, 2015 -Contribution: Providing data and taking observations.
Supernova 2013fc in a circumnuclear ring of a luminous infrared galaxy: the big
brother of SN 1998S,,Kangas, T.; Mattila, S.; Kankare, E.; Lundqvist, P.; Visnen,
P.; Childress, M.; Pignata, G.; McCully, C.; Valenti, S.; Vink, J.; Pastorello, A.; Elias-

7
Rosa, N.; Fraser, M.; Gal-Yam, A.; Kotak, R.; Kotilainen, J. K.; Smartt, S. J.; Galbany,
L.; Harmanen, J.; Howell, D. A.; Inserra, C.; Marion, G. H.; Quimby, R. M.; Silver-
man, J. M.; Szalai, T.; Wheeler, J. C.; Ashall, C.; et al., MNRAS, 456, 323K- 02, 2016
-Contribution: Providing data and taking observations.
PESSTO: survey description and products from the first data release by the Public ESO
Spectroscopic Survey of Transient Object, Smartt, S. J.; Valenti, S.; Fraser, M.; Inserra,
C.; Young, D. R.; Sullivan, M.; Pastorello, A.; Benetti, S.; Gal-Yam, A.; Knapic, C.;
Molinaro, M.; Smareglia, R.; Smith, K. W.; Taubenberger, S.; Yaron, O.; Anderson,
J. P.; Ashall, C.; et al., , MNRAS, 579, 40S- 07, 2015 -Contribution: Providing com-
ments on science.

Contents
Abstract 1
Acknowledgements 4
List of Publications 5
1 Introduction 23
1.1 SN classification . . . . . . . . . . . . . . . . . . . . . . . . . . . . 24
1.2 SN Ia light curves . . . . . . . . . . . . . . . . . . . . . . . . . . . . 27
1.3 SN Ia progenitors . . . . . . . . . . . . . . . . . . . . . . . . . . . . 29
1.3.1 Single Degenerate scenario . . . . . . . . . . . . . . . . . . . 31
1.3.2 Double Degenerate (DD) scenario . . . . . . . . . . . . . . . 34
1.3.3 Triple system collision . . . . . . . . . . . . . . . . . . . . . 34
1.4 Nucleosynthesis . . . . . . . . . . . . . . . . . . . . . . . . . . . . . 35
1.5 SN Ia by host type . . . . . . . . . . . . . . . . . . . . . . . . . . . . 36
1.6 SN Ia by sub types . . . . . . . . . . . . . . . . . . . . . . . . . . . 38
1.7 SN Ia spectra . . . . . . . . . . . . . . . . . . . . . . . . . . . . . . 39
1.7.1 Photosperic phase . . . . . . . . . . . . . . . . . . . . . . . . 39
1.7.2 Nebular phase . . . . . . . . . . . . . . . . . . . . . . . . . . 41
1.8 SN Ia UV data . . . . . . . . . . . . . . . . . . . . . . . . . . . . . . 43
8

CONTENTS 9
1.9 Outline of thesis . . . . . . . . . . . . . . . . . . . . . . . . . . . . . 44
2 Luminosity Distributions of SNe Ia 45
2.1 Preface . . . . . . . . . . . . . . . . . . . . . . . . . . . . . . . . . 45
2.2 Previous studies . . . . . . . . . . . . . . . . . . . . . . . . . . . . . 46
2.3 Data & Method . . . . . . . . . . . . . . . . . . . . . . . . . . . . . 48
2.4 Quality of LC spline fit . . . . . . . . . . . . . . . . . . . . . . . . . 54
2.5 Luminosity Distribution . . . . . . . . . . . . . . . . . . . . . . . . . 56
2.5.1 B and V luminosity distributions . . . . . . . . . . . . . . . 56
2.5.2 Width Luminosity Relation . . . . . . . . . . . . . . . . . . . 59
2.6 Correction for host galaxy extinction . . . . . . . . . . . . . . . . . . 62
2.6.1 Luminosity Distribution . . . . . . . . . . . . . . . . . . . . 65
2.6.2 Host galaxy extinction . . . . . . . . . . . . . . . . . . . . . 65
2.6.3 LD by host galaxy type . . . . . . . . . . . . . . . . . . . . . 68
2.6.4 WLR after extinction correction . . . . . . . . . . . . . . . . 70
2.7 Full luminosity distribution . . . . . . . . . . . . . . . . . . . . . . . 72
2.8 SNe Ia from young and old stellar populations . . . . . . . . . . . . . 76
2.9 Discussion . . . . . . . . . . . . . . . . . . . . . . . . . . . . . . . . 80
2.9.1 Errors and significance of results. . . . . . . . . . . . . . . . 85
2.10 Conclusions . . . . . . . . . . . . . . . . . . . . . . . . . . . . . . . 86
3 Radiative transfer 89
3.1 Preface . . . . . . . . . . . . . . . . . . . . . . . . . . . . . . . . . 89
3.2 Radiative Transfer Theory . . . . . . . . . . . . . . . . . . . . . . . 89
3.3 Radiative Transfer in SN ejecta . . . . . . . . . . . . . . . . . . . . . 92
3.4 MC code . . . . . . . . . . . . . . . . . . . . . . . . . . . . . . . . . 93
3.5 Ionization and excitation . . . . . . . . . . . . . . . . . . . . . . . . 96

CONTENTS 10
3.6 Numerical technique . . . . . . . . . . . . . . . . . . . . . . . . . . 97
3.6.1 Photon branching . . . . . . . . . . . . . . . . . . . . . . . . 98
3.6.2 Random walk . . . . . . . . . . . . . . . . . . . . . . . . . . 99
3.7 Modelling procedure . . . . . . . . . . . . . . . . . . . . . . . . . . 102
3.7.1 Constraining the abundances . . . . . . . . . . . . . . . . . . 102
4 SN 2014J 104
4.1 Preface . . . . . . . . . . . . . . . . . . . . . . . . . . . . . . . . . 104
4.2 SN 2014J . . . . . . . . . . . . . . . . . . . . . . . . . . . . . . . . 104
4.3 Observations . . . . . . . . . . . . . . . . . . . . . . . . . . . . . . 105
4.4 Extinction . . . . . . . . . . . . . . . . . . . . . . . . . . . . . . . . 106
4.5 Photometry . . . . . . . . . . . . . . . . . . . . . . . . . . . . . . . 109
4.6 Spectroscopy . . . . . . . . . . . . . . . . . . . . . . . . . . . . . . 113
4.7 Models . . . . . . . . . . . . . . . . . . . . . . . . . . . . . . . . . 117
4.7.1 Day –8 . . . . . . . . . . . . . . . . . . . . . . . . . . . . . 118
4.7.2 Day –7 . . . . . . . . . . . . . . . . . . . . . . . . . . . . . 121
4.7.3 Day+0 . . . . . . . . . . . . . . . . . . . . . . . . . . . . . . 121
4.7.4 Day+1 . . . . . . . . . . . . . . . . . . . . . . . . . . . . . . 122
4.7.5 Day +2 . . . . . . . . . . . . . . . . . . . . . . . . . . . . . 122
4.7.6 Day +3 . . . . . . . . . . . . . . . . . . . . . . . . . . . . . 123
4.7.7 Day +4 . . . . . . . . . . . . . . . . . . . . . . . . . . . . . 123
4.7.8 Day +6 . . . . . . . . . . . . . . . . . . . . . . . . . . . . . 125
4.7.9 Day +8 . . . . . . . . . . . . . . . . . . . . . . . . . . . . . 125
4.7.10 Day +10 . . . . . . . . . . . . . . . . . . . . . . . . . . . . . 126
4.8 Abundance stratification . . . . . . . . . . . . . . . . . . . . . . . . 126
4.9 Work carried out after this . . . . . . . . . . . . . . . . . . . . . . . 128
4.10 Summary . . . . . . . . . . . . . . . . . . . . . . . . . . . . . . . . 129

CONTENTS 11
5 SN 1986G 131
5.1 Preface . . . . . . . . . . . . . . . . . . . . . . . . . . . . . . . . . 131
5.2 SN 1986G . . . . . . . . . . . . . . . . . . . . . . . . . . . . . . . . 132
5.3 Data . . . . . . . . . . . . . . . . . . . . . . . . . . . . . . . . . . . 135
5.4 Flux Calibration of spectra . . . . . . . . . . . . . . . . . . . . . . . 137
5.5 Modelling Techniques . . . . . . . . . . . . . . . . . . . . . . . . . 139
5.5.1 Photospheric phase modelling technique . . . . . . . . . . . . 139
5.5.2 Nebular Phase modelling technique . . . . . . . . . . . . . . 140
5.5.3 Light curve code . . . . . . . . . . . . . . . . . . . . . . . . 140
5.6 Photospheric models . . . . . . . . . . . . . . . . . . . . . . . . . . 142
5.6.1 Extinction and distance . . . . . . . . . . . . . . . . . . . . . 142
5.6.2 Density profiles . . . . . . . . . . . . . . . . . . . . . . . . . 143
5.6.3 Photospheric models . . . . . . . . . . . . . . . . . . . . . . 143
5.6.4 -3 days . . . . . . . . . . . . . . . . . . . . . . . . . . . . . 144
5.6.5 -2 days . . . . . . . . . . . . . . . . . . . . . . . . . . . . . 144
5.6.6 -1 days . . . . . . . . . . . . . . . . . . . . . . . . . . . . . 147
5.6.7 +0 days . . . . . . . . . . . . . . . . . . . . . . . . . . . . . 147
5.6.8 +1 days . . . . . . . . . . . . . . . . . . . . . . . . . . . . . 148
5.6.9 +2days . . . . . . . . . . . . . . . . . . . . . . . . . . . . . 148
5.7 Nebular phase models . . . . . . . . . . . . . . . . . . . . . . . . . . 149
5.8 Abundance tomography . . . . . . . . . . . . . . . . . . . . . . . . . 152
5.9 A consistent, reduced-energy model . . . . . . . . . . . . . . . . . . 157
5.9.1 Energy estimates . . . . . . . . . . . . . . . . . . . . . . . . 157
5.9.2 Photospheric-epoch models . . . . . . . . . . . . . . . . . . 159
5.9.3 Carbon . . . . . . . . . . . . . . . . . . . . . . . . . . . . . 159
5.9.4 Nebular-epoch model . . . . . . . . . . . . . . . . . . . . . . 163

CONTENTS 12
5.9.5 Abundance stratification . . . . . . . . . . . . . . . . . . . . 163
5.10 Bolometric Light curves . . . . . . . . . . . . . . . . . . . . . . . . 164
5.10.1 Observed light curve . . . . . . . . . . . . . . . . . . . . . . 164
5.10.2 Synthetic light curve . . . . . . . . . . . . . . . . . . . . . . 167
5.11 Conclusions . . . . . . . . . . . . . . . . . . . . . . . . . . . . . . . 169
6 Conclusions 172
6.1 Futurework . . . . . . . . . . . . . . . . . . . . . . . . . . . . . . . 174
Appendix 176

List of Figures
1.1 Magnitude phase diagram of transient objects (Kasliwal , 2015). . . . 24
1.2 The SN classification scheme (Turatto, 2003). . . . . . . . . . . . . . 25
1.3 Sketches of SN spectra at maximum light (Carroll & Ostlie, 2007). . . 26
1.4 The width luminsity relation first published in Phillips (1993). . . . . 30
1.5 Abundance distribution of the W7 explosion model in velocity and
mass space (Iwamoto et al., 1999). . . . . . . . . . . . . . . . . . . . 37
1.6 A plot showing how P-Cygni profiles are formed in SNe Ia (Kasen,
2016). . . . . . . . . . . . . . . . . . . . . . . . . . . . . . . . . . . 40
1.7 Diversity of maximum light spectra of SNe Ia. The spectra are plotted
from top to bottom in terms of light curve shape. It should be noted
that the spectrum of SN 2004eo was taken at +2 days compared to B
band maximum. Therefore it appears less luminous in the above plot. 42
1.8 A nebular spectrum and model of SN 2011fe (Mazzali et al., 2015). . 43
2.1 Redshift distribution of the SNe Ia used in this work. The bin sizes are
z=0.002. . . . . . . . . . . . . . . . . . . . . . . . . . . . . . . . . 49
13
LIST OF FIGURES 14
2.2 An example of the fitting procedure, the B-band light curve of SN
2000dn. The red points are the photometry and the shaded area is
the 1000 LCs derived from these photometry points, as explained in
section 2.1. . . . . . . . . . . . . . . . . . . . . . . . . . . . . . . . 54
2.3 The B band residuals between the SN photometry and LC spline fit, as
a function of time. Data from 46 randomly selected SNe are used. . . 55
2.4 The V band residuals between the SN photometry and LC spline fit, as
a function of time. Data from 46 randomly selected SNe are used. . . 55
2.5 The luminosity distributions and ∆m15 distributions of the SN sample
before correction for reddening. Top: The left plot is a distribution
of B-band absolute magnitude, and the right plot is the distribution of
∆m15(B). Bottom: The left plot is a distribution of V -band absolute
magnitude, and the right plot is the distribution of ∆m15(V ). In these
plots the SNe have not been corrected for host galaxy extinction. The
stars in two right hand panels are the Gaussians calculated from the
GMM tests. . . . . . . . . . . . . . . . . . . . . . . . . . . . . . . . 57
2.6 The B-band WLR before reddening correction. The black points are
SNe from S-F galaxies, the blue points are SNe from E galaxies, and
the red points are SNe Ia from S0 galaxies. The yellow line is the WLR
given in Phillips et al. (1999), and the red line is the relation given for
the subluminous tail from Taubenberger et al. (2008). . . . . . . . . . 60
2.7 Top: The WLR before reddening correction including only SNe with
(B − V )Bmax < 0.01. The blue line of best fit is a second order poly-
nomial. The yellow model is the line of best fit from Phillips et al.
(1999). Bottom: The residuals of the WLR above as a function of
∆m15(B). . . . . . . . . . . . . . . . . . . . . . . . . . . . . . . . 61

LIST OF FIGURES 15
2.8 Top: Left: The MB LD of the SN Ia from S-F galaxies, before and af-
ter correction for extinction. Right: compares the values of MB, again
before and after correction for extinction, for SNe from S-F galaxies.
Bottom: Left: The MB LD of the SNe Ia from passive galaxies, be-
fore and after correction for extinction. Right: MB, before and after
correction for extinction, for SNe from passive galaxies. . . . . . . . 66
2.9 Top: B-band luminosity distribution, corrected for host galaxy extinc-
tion. The bin sizes are 0.15 and 0.1 mag for the MB and ∆m15(B)
plots respectively. Bottom: V -band luminosity distribution, corrected
for host galaxy extinction. The bin sizes are 0.15 and 0.1 mag for the
MV and ∆m15(V ) plots respectively. The stars in the right hand panel
are the Gaussians calculated from the GMM tests. . . . . . . . . . . 67
2.10 SNe Ia separated by host galaxy type, after correction for host galaxy
extinction. Blue shows SNe Ia from S-F galaxies and green is SNe Ia
from passive galaxies. . . . . . . . . . . . . . . . . . . . . . . . . . . 69
2.11 MB vs MV for all SNe Ia in the sample. . . . . . . . . . . . . . . . . 70
2.12 The cumulative probability distributions for the samples used in the
K-S test. The green solid lines are SNe from passive galaxies, and the
blue dashed from SNe from S-F galaxies. . . . . . . . . . . . . . . . 71
2.13 The WLR corrected for host galaxy extinction. The black points are
SNe from S-F galaxies, the blue are points are SNe from elliptical
galaxies and the red points are SNe Ia from S0 galaxies. The green
point is SN2003cg. Top: B-band Bottom: V -band . . . . . . . . . . . 74

LIST OF FIGURES 16
2.14 The finalMB andMV luminosity distribution plots for the sample used
in this work. SNe Ia from passive galaxies with no known extinction
have been re-added to this distribution to increase the sample size. Top:
The left plot is the full MB luminosity distribution, the right plot is the
full MV luminosity distribution. The overlaid blue histograms are the
distributions of SNe from passive galaxies. Bottom: The left plot is the
full MB luminosity distribution separated by host galaxy type, and the
right plot is the full MV distribution separated by host galaxy type. . . 77
2.15 The final ∆m15(B) and ∆m15(V ) LD plots for the sample used in this
work. SNe Ia from passive galaxies with no known extinction have
been re-added to this distribution to increase the sample size. Top: The
left plot is the full ∆m15(B) LD, the right plot is the full ∆M15(V ) LD.
The overlaid blue histograms are the distributions of SNe from passive
galaxies. Bottom: The left plot is the full ∆m15(B) LD separated by
host galaxy type, and the right plot is the full ∆m15(V ) distribution
separated by host galaxy type. . . . . . . . . . . . . . . . . . . . . . 78
2.16 The B-band LD for SNe Ia from passive galaxies normalized, scaled
and subtracted from the LD of SNe Ia from S-F galaxies. The factor by
which the LD from passive galaxies has been normalized is presented
on the top of each plot. The blue bars in the bottom right panel are the
LD of SNe Ia from passive galaxies scaled to 15% of those from active
galaxies. . . . . . . . . . . . . . . . . . . . . . . . . . . . . . . . . . 81

LIST OF FIGURES 17
2.17 The V -band LD for SNe Ia from passive galaxies normalized, scaled
and subtracted from the LD of SNe Ia from S-F galaxies. The factor by
which the LD from passive galaxies has been normalized is presented
on the top of each plot. The blue bars in the bottom right panel are the
LD of SNe Ia from passive galaxies scaled to 15% of those from active
galaxies. . . . . . . . . . . . . . . . . . . . . . . . . . . . . . . . . . 82
3.1 Photon packets encounter line events or electron scattering during their
random walk within each shell (Mazzali, 2000). . . . . . . . . . . . . 101
4.1 Maximum light spectra of 2014J and SN 2011fe. . . . . . . . . . . . 108
4.2 Aperture photometry light curves, produced using LT data. SDSS g′r′i′
light curves are presented. The errors on the photometry appear to
be constant; this is due to the catalogue error on the zero point star
dominating. . . . . . . . . . . . . . . . . . . . . . . . . . . . . . . . 110
4.3 SIFTO SN 2014J light curve fits . . . . . . . . . . . . . . . . . . . . 111
4.4 Dependence of ∆m(B)15 on E(B − V ) for different values of RV , us-
ing SN 2011fe spectrophotometry and the Hsiao template. . . . . . . 112
4.5 All spectral observations of SN 2014J, LT and INT. The time is given
relative to rest-frame B-band maximum. The spectra have not been
corrected for reddening. There were no data collected between 5700-
5800 A for the LT observations and the two atmospheric absorption
lines have been removed. All of the plots have been offset by an arbi-
trary amount for the purpose of presentation. . . . . . . . . . . . . . . 115
4.6 A check of the flux calibration process of Feige34 back on to itsself.
The blue points are the catalogue data, ad the red the data from the
observations. . . . . . . . . . . . . . . . . . . . . . . . . . . . . . . 116

LIST OF FIGURES 18
4.7 An overview of the features of SN 2014J. This spectrum has been
dereddened and was taken at B-band maximum. . . . . . . . . . . . . 116
4.8 Modelled (blue) and observed spectra (green) of SN 2014J. Plot (a) is
from -4d, (b) is from -3d, (c) is +0d maximum, (d) is +1d and (e) is
+2d. All of the dates are relative to B-band maximum. All spectra have
been dereddened. The red spectrum at +1 d is from the INT. . . . . . 119
4.9 Modelled (blue) and observed spectra (green) of SN 2014J. Plot (a) is
from +3d, (b) is from +4d, (c) is +5d, (d) is +6d and (e) is +8d. All
of the dates are relative to B-band maximum. All spectra have been
dereddened. The red spectum of +4 d is from the INT. . . . . . . . . . 124
4.10 The abundance distribution of SN 2014J. The Ni/Co/Fe abundances
are given in terms of mass fractions of 56Ni (56Ni0) and stable Fe (Fe0)
at t = 0. In the spectral models no stable Ni or Co and no radioactive
Fe are assumed to be present. . . . . . . . . . . . . . . . . . . . . . . 128
5.1 The B band absolute magnitude of four SNe Ia which have a variety of
LC shapes. . . . . . . . . . . . . . . . . . . . . . . . . . . . . . . . . 135
5.2 The spectra of four SNe Ia at B band maximum. The SNe correspond
to the 4 SNe in Figure 5.1 . . . . . . . . . . . . . . . . . . . . . . . . 136
5.3 SN 1986G spectrum from 11th May. The back spectrum is the ori-
gional and the red is the spectrum after flux calibration.. The stars are
the center of the B and V bands. . . . . . . . . . . . . . . . . . . . . 139
5.4 One-zone models of SN 1986G at B band maximum, using a variety
of distance modulus and extinction values. The observed spectra are
in black and the modelled in blue. . . . . . . . . . . . . . . . . . . . 141

LIST OF FIGURES 19
5.5 The photospheric phase models of SN 1986G, where the spectra have
been shifted in flux by a constant for clarity. Models for both the W7
(blue solid) and Sub-Ch (red dashed) density profiles are shown. The
spectra have been corrected for extinction. . . . . . . . . . . . . . . 145
5.6 The nebular phase models of SN 1986G. The blue spectrum was ob-
tained using a W7 density profile and the green spectrum using the
Sub-Ch profile. The black line is the observed spectrum. The spectra
have been corrected for extinction. . . . . . . . . . . . . . . . . . . . 152
5.7 The abundance distribution of SN 1986G obtained with the W7 density
profile. . . . . . . . . . . . . . . . . . . . . . . . . . . . . . . . . . 155
5.8 The abundance distribution of SN 1986G obtained with the Sub-Ch
density profile. . . . . . . . . . . . . . . . . . . . . . . . . . . . . . 156
5.9 The W7, Sub-Ch and W7e0.7 density profiles as a function of velocity
at t=100 s after explosion. The vertical grey lines show the range in
values vph can take, for the -3 d to +2 d models. . . . . . . . . . . . . 158
5.10 One-zone models at -3 days relative to B band maximum. The syn-
thetic spectra were produced using the W7 (blue), W7e0.7 (green) and
Sub-Ch (red dashed) density profiles. The spectra have been corrected
for extinction. . . . . . . . . . . . . . . . . . . . . . . . . . . . . . . 160
5.11 The photospheric phase models of SN 1986G, calculated using the
W7e0.7 density profile. The blue line are the models and the black
line the observed spectra. The spectra have been corrected for extinction.161
5.12 Synthetic spectrum at -3 days produced using the W7e0.7 density pro-
file to constrain an upper limit on carbon. The blue line is the model
with 0% of C, the red dashed line with the 2% C and the green line
with 10% C at the photosphere. The black line is the observed spectra. 162

LIST OF FIGURES 20
5.13 The nebular phase models of SN 1986G. The green line is the model
calculated using the W7e0.7 density profile. The spectra have been
corrected for extinction. . . . . . . . . . . . . . . . . . . . . . . . . . 162
5.14 The abundance distribution of the ejecta of SN 1986G obtained using
the W7e0.7 density profile. . . . . . . . . . . . . . . . . . . . . . . . 165
5.15 The observed (blue dots) bolometric light curve with the upper (cyan
markers) and lower (red markers) limits. As well as the modelled LC
using the derived abundance distribution from the W7 (green), Sub-Ch
(red) and W7e0.7 (purple) density profiles. . . . . . . . . . . . . . . 170

List of Tables
2.1 Sources of the data. . . . . . . . . . . . . . . . . . . . . . . . . . . . 49
2.2 The reference of the 11 SNe Ia mentioned in Table 2.1. . . . . . . . . 50
2.3 Statistics of the data, not corrected for host galaxy extinction has been
applied. . . . . . . . . . . . . . . . . . . . . . . . . . . . . . . . . . 51
2.4 Statistics of data before correction for host galaxy extinction. The data
used in this table are a subset of the full sample. . . . . . . . . . . . . 72
2.5 Statistics of the data after correction for host galaxy extinction. . . . . 73
2.6 K-S tests for SNe with different types of host galaxies, after correction
for host galaxy extinction. . . . . . . . . . . . . . . . . . . . . . . . 73
2.7 Statistics of full LD. . . . . . . . . . . . . . . . . . . . . . . . . . . . 75
4.1 Log of spectroscopic observations of SN 2014J. . . . . . . . . . . . . 107
4.2 Log of the Si 6355A absorption line velocities. The resolution of the
spectra is ∼ 9A, this value has been used to calculate the error on the
velocity of the Si II line. . . . . . . . . . . . . . . . . . . . . . . . . 114
4.3 Input parameters and calculated converged temperature. . . . . . . . . 118
5.1 The ∆ M15(B) and absolute B band magnitude of the SNe Ia used in
Figures 5.1 and 5.2. . . . . . . . . . . . . . . . . . . . . . . . . . . . 135
5.2 The spectra of SN 1986G. . . . . . . . . . . . . . . . . . . . . . . . . 137
21

LIST OF TABLES 22
5.3 The B and V sythetic photometry (mspec) taken form the spectra, and
real photometry (mBphot) obtained from Phillips et al. (1987). . . . . 138
5.4 Synthetic photometry from the new spectra. . . . . . . . . . . . . . . 139
5.5 Published distances to SN 1986G. . . . . . . . . . . . . . . . . . . . 143
5.6 Input parameters and calculated converged black body temperatures
for models from the W7 and Sub-Ch density profiles. . . . . . . . . . 146
5.7 Integrated abundances from the full abundance tomography modelling
of SN 1986G. The errors on the masses are ±25%, except for 56Ni
which has an error of ±10%. . . . . . . . . . . . . . . . . . . . . . . 155
5.8 Integrated abundances for the W7e0.7 models. The errors on the masses
are ±25%, except for 56Ni which has an error of ±10%. . . . . . . . 164
6.1 The SNe used in the luminsity distribution study. The values have been
corrected for MW extinction but not host galaxy extinction. . . . . . . 177
6.2 The photometry of SN 2014J. The errors on the magnitudes do not
include the error on the standard star. . . . . . . . . . . . . . . . . . . 187

1. Introduction
Transient objects are important astrophysical events. They can be parameterised by
their maximum brightness and their time to peak (Kasliwal , 2015). This can be seen
in Figure 1.1, which is a phase diagram of transient objects in the Universe. Recently
more and more of this phase diagram has been explored, as recent surveys have higher
cadences and can probe to fainter magnitudes (e.g., Rau et al., 2009). Surprisingly
there have been objects discovered in almost all parts of it (e.g., Kasliwal et al., 2012).
Supernovae are a much studied class of transient event, as they are bright and have a
long enough rise time to be discovered by targeted surveys (Leaman et al., 2011). They
are the main producers of heavy elements in the Universe (Iwamoto et al., 1999). Type
Ia supernovae (SNe Ia) are of particular interest as they produce most of the iron group
elements (Iwamoto et al., 1999). They are also the best standardizable candles in the
cosmos, and were used in the discovery of the acceleration of the Universe (Riess et al.,
1998; Perlmutter et al., 1999). However, the exact nature of these events is unknown.
Understanding the progenitor scenario and explosion mechanism of SNe Ia is of great
importance if one wants to improve their use as standardizable candles.
23

CHAPTER 1. INTRODUCTION 24
Figure 1.1: Magnitude phase diagram of transient objects (Kasliwal , 2015).
1.1 SN classification
Supernovae are extremely energetic explosions, which typically have a kinetic energy
(K.E.) of ∼ 1051 erg, and they are either thermonuclear or core collapse. Supernovae
are classified by spectral type and photometric properties, more specifically early time
spectra. Therefore SN are classified on the chemical and physical properties of the
outermost layers of the exploding star. For a full review see Filippenko (1997). It was
first theorised that there were two types of SN, Type I and Type II. This was based on
their optical spectra, where type I SNe are defined by a lack of hydrogen. Type Ia SNe
were found to be a subset of Type I SNe. Type Ia SNe have a deep absorption trough
around 6150 A, which can be attributed to the Si II 6355 A line. The remaining type
I SNe are divided into two subclasses, type Ib and Ic. They differ with respect to the
presence of He I lines, with Ib SNe having He I features. In reality the subclassification
is more complicated than this, but for this work it is adequate to know that SNe Ia are

CHAPTER 1. INTRODUCTION 25
Figure 1.2: The SN classification scheme (Turatto, 2003).
intrinsically different from all other types of SN.
Type II SNe are characterised by the presence of H in their spectra. They avoid
early type galaxies and are associated with the core collapse of massive stars. There are
typically four subclasses of type II SNe, IIP, IIL, IIn and IIb. IIP SNe stop declining
shortly after optical maximum and show a plateau of 2-3 months, whereas IIL SNe
show a steep linear decline in their light curves after maximum light. SNe IIn have a
slow evolution and are dominated by strong Balmer emission lines. Type IIb SNe are
observationally a mixture of type Ib and II SNe, in the sense that they have hydrogen
lines at early times but show signs of Type Ib in their late-time spectra, in the form of
helium lines. Fig 1.2 visually represents the classification scheme of SNe, and Figure
1.3 presents an example of the different subtypes at maximum light. Turatto (2003)
present a more detailed explanation of this classification scheme.

CHAPTER 1. INTRODUCTION 26
Figure 1.3: Sketches of SN spectra at maximum light (Carroll & Ostlie, 2007).

CHAPTER 1. INTRODUCTION 27
1.2 SN Ia light curves
SN are often analysed using multi-band photometry. These photometry points are
known as light curves (LC), and it is these LCs which show the evolution of a SN as a
function of time. To first order all SNe Ia can be parameterised by their power source,
which is the amount of 56Ni in the ejecta (Arnett, 1982). 56Ni is the main product
of burning to nuclear statistical equilibrium (NSE) during the explosion (Colgate &
McKee, 1969). 56Ni is a radioactive isotope which follows the decay chain,
56Nit1/2=6.077d −→56 Cot1/2=77.27d −→56 Fe.
The 56Ni decay produces γ-rays due to its decays to 56Co caused by electron cap-
ture. The 56Co decays to stable 56Fe through electron capture (81%) or β-decay (19%).
The positrons from the β-decay deposit their K.E. in the ejecta and then annihilate with
electrons producing two photons of energy Eγ = mec2, which are therefore γ-rays.
The γ-rays from both forms of decay are thermalised and escape the ejecta as optical
or IR photons (Mazzali, 2000).
A SN Ia LC can be broken down into three sections: the rise to maximum light,
maximum light and post maximum light. At very early times the ejecta of the SN is
optically thick, therefore photons which are produced from the decay chain are trapped
and cannot escape immediately. As the ejecta becomes more transparent more photons
can be released and the LC rises. Arnett’s law states that the maximum of the LC is
reached when the released energy from the ejecta is balanced by the energy input from
the decay (Arnett, 1982). The time it takes for a SN Ia to reach maximum light is
usually between 15-21 days (Ganeshalingam et al., 2011). After maximum light the
envelope of the SN is dilute enough for the trapped photons to stream outwards, and
the energy input from the decay chain decreases due to the ongoing decay. The trapped
photons continue to escape after maximum light, with the emitted energy being larger
than the input energy. This occurs after ∼50 days past maximum light. After this the

CHAPTER 1. INTRODUCTION 28
light curve drops back level with the heating-cooling equilibrium, this is when the LC
is on the 56Co decay (Mazzali, 2000).
SNe Ia LCs can be summarised by two parameters, their absolute magnitude and
their stretch or decline rate, ∆m15(B). ∆m15(B) is the difference in the B-band mag-
nitude of the SN between maximum light and +15 days relative to maximum (Phillips,
1993; Phillips et al., 1999; Conley et al., 2008). This width-luminosity relationship
(WLR) was first found by Phillips (1993), see Figure 1.4. It is this relation that means
SNe Ia were found to be standardizable, and therefore good cosmological distance
indicators.
The variation in the maximum luminosity of a SNe Ia is, to first order, caused
by variation in the amount of 56Ni in the ejecta, and for a SNe Ia this can vary from
∼ 0.1M to ∼ 1.2M (Mazzali et al., 2007). As Arnett’s law states, the brightness of
a SN Ia is proportional to the mass of synthesised 56Ni, and the peak luminosity can be
approximated by
M(56Ni)
M= L× 1043 × (6.45× e
tp8.8 × e−
tp−111.3 )−1 (1.1)
(Stritzinger & Leibundgut, 2005), where L is the bolometric luminosity ay max-
imum and tp is the rise time of the SNe Ia. Theoretically the width of a SN Ia LC, τ ,
depends on kinetic energy of the explosion, EK (or K.E) (Mazzali et al., 2007). Most
SNe Ia are thought to come from a system close to the Chandrasekhar mass therefore
a range of masses is probably not the cause in the variation of SNe Ia peak luminosity1
(Nomoto, 1982). That leaves the EK and κ. However, EK is produced in almost equal
amounts by burning a given mass to nuclear statistical equilibrium (NSE), or by in-
complete burning to intermediate mass elements (IMEs) (Mazzali et al., 2001); given
1 It is thought that some SNe Ia may deviate from the Chandrasekhar mass, but this is probably only atthe extremes of the WLR

CHAPTER 1. INTRODUCTION 29
that NSE and IME make up to 1.3M of the ejecta. The EK of the ejecta can be given
by,
EK = [1.56M(56Ni) + 1.74M(stableNSE) + 1.24M(IME)− BE]× 1051]erg (1.2)
(Woosley et al., 2007), where BE is the binding energy of the White Dwarf (WD).
Therefore if the EK and Mej do not play the main role in the variation in LC shape,
then opacity must be the dominant factor.
SNe Ia are dominated by line opacity not continuum opacity. The photons in the
SNe Ia ejecta must first propagate through optically thick SN ejecta, through a random
walk process; in this region they will interact with spectral lines and free electrons un-
til they are redshifted (due to the expansion of the ejecta, relative to the rest frequency
of the photon) into a region of the spectrum where the opacity is low. SNe Ia opac-
ity is dominated by line opacity of low-ionization species, in particular low-excitation
ions of Fe-group elements (Mazzali et al., 2001). These Fe-group elements have many
more lines than the corresponding IMEs (by about a factor of 10). Therefore the aver-
age opacity is higher in regions where Fe-groups elements dominate, and hence SNe
with a higher Ni56/IME ratio have broader LCs (Mazzali et al., 2001). This can be
summarised by
τ ∝ M(NSE) + 0.1(M(IME)). (1.3)
1.3 SN Ia progenitors
It is currently accepted that SNe Ia are produced from a carbon/oxygen White Dwarf
(WD) in a binary system (e.g., Maoz et al., 2014). The three currently favoured pro-

CHAPTER 1. INTRODUCTION 30
Figure 1.4: The width luminsity relation first published in Phillips (1993).

CHAPTER 1. INTRODUCTION 31
genitor scenarios are single degenerate (SD), double degenerate (DD) and collisions of
C+O WDs in a triple system.
1.3.1 Single Degenerate scenario
In the SD scenario a C+O WD accretes material from a non-electron-degenerate com-
panion star (Nomoto et al., 1997). This can be through H accretion or He accretion.
Once the accretor reaches the Chandrasekhar mass (Ch-mass) thermonuclear runaway
can occur and a SNe Ia is produced. It should be noted that a thermonuclar run away
reaction can occur on the surface of the WD well before the Chandrasekhar mass .
SD H accretion
Single Degenerate H accretion: This scenario can consist of two stars with a zero age
main sequence (ZAMS) masses of > 3.5M and < 3.5M. The more massive star
reaches the red giant phase and a common envelope (CE) phase occurs. After the
common envelope phase the primary star burns its He and becomes a C+O WD. The
secondary star then donates H rich material to WD, and the Chandrasekhar mass can
be reached if the accretion is efficient (Ruiter et al., 2009, 2010). This is the ‘standard’
SD scenario.
SD explosions
After the WD reaches the Chandrasekhar mass the exact composition and central den-
sity of it is crucial in the outcome of the explosion. In terms of the explosion it has
been theorised that the flame front can propagate either supersonically (detonation)
or subsonically (deflagration) (Nomoto et al., 1984). However, pure detonations of
Chandrasekhar mass WDs burn at high efficiency, and produce almost only iron-group
elements (Arnett et al., 1971), whereas pure deflagrations have a lower kinetic energy

CHAPTER 1. INTRODUCTION 32
and a mixed abundance distribution which consists of a large amount of partially burnt
and unburnt material (Ropke et al., 2007).
Therefore, it has been theorised that SNe Ia come from a delayed detonation sce-
nario (Blinnikov & Khokhlov, 1986, 1987). This is one where the burning starts as
a deflagration and at a certain density it transitions to a detonation. This is known
as a deflagration-detonation-transition (DDT). The DDT happens after the star has
expanded due to the deflagration phase. This causes the detonation to run through
less dense material, which in turn makes more IMEs. Therefore the delayed detona-
tion models produce a larger K.E. and less mixing, which is in line with observations
(Stehle et al., 2005; Mazzali et al., 2007).
The delayed detonation model has been shown to produce the range and diversity
that SNe Ia have. One unknown factor in this scenario is the density at which the
DDT occurs, and the reason for this transition (Schmidt et al., 2010). It is usually
set depending on the physical conditions of the flame front. It has been demonstrated
that by changing the DDT the whole diversity of SNe Ia can be produced, including
1999by, a subluminous SNe Ia (Hoflich et al., 2002). Some secondary parameters
which can affect the explosion of the WD are variations in the initial carbon-to-oxygen
profile in the progenitor, and the central density in the WD exploding as a SNe Ia.
When the central density increases so does the binding energy, which translates to
small expansion velocities (Hoflich et al., 2002).
A fast deflagration explosion has also been shown to produce the observed prop-
erties of a normal SN Ia (Nomoto et al., 1984). The best example of this fast deflagra-
tion model is the W7 model. This model synthesises 0.5-0.6M 56Ni, and produces
1.3 × 1051 erg of K.E. (Nomoto et al., 1984). The W7 model is favoured by radiative
transfer modellers of SNe Ia (e.g., Ashall et al., 2014).
Another method which could pre-expand the star by a deflagration and then trans-

CHAPTER 1. INTRODUCTION 33
fer to a detonation is the pulsation scenario, although this is not currently popular.
This explosion is one where the deflagration is so slow that the burning first quenches
without making the transition to detonation (Hoeflich et al., 1995). This leaves the
WD expanding but bound. The WD will then experience a strong pulsation. During
the contraction of the WD, compression of the mixed layers of iron-peak and CO ele-
ments, which are formed at the dead deflagration front, give rise to a detonation. This
model can explain why the transition does not happen at high densities (Hoeflich et al.,
1995).
SD Sub-Chandrasekhar explosion
The Sub-Chandrasekhar mass (sub-Ch) explosion of a C+O WD is also a viable pro-
genitor scenario. WD masses in the scenario can range from 1-1.4 M. One of the
sub-Ch explosion scenarios is a C+O WD which accretes He from a He rich compan-
ion star. An edge-lit explosion on the WD can occur if a detonation is ignited in the
He shell (Livne & Arnett, 1995). V445 Puppis is the only known example of a He-
shell flash (Woudt et al., 2009). Other sub-Ch models are a carbon flash that triggers
a core detonation and the double detonation model. The double detonation model is
one where C+O WD accretes from a companion star and develops a helium-rich outer
shell. If the helium shell becomes massive enough it can become unstable and deto-
nate, and subsequently compression of the inward core by the propagating shocks may
produce a secondary carbon detonation which explodes the WD (Woosley & Weaver,
1986; Fink et al., 2007).
Sim et al. (2010) demonstrated that sub-Ch explosions can produce a range of Ni
masses from 0.3-0.8M, which is almost sufficient to cover the whole range of SNe
Ia luminosities. Sub-Ch explosion models can produce enough IMEs to synthetically
form a typical SNe Ia spectrum, without having to artificially transition a deflagration

CHAPTER 1. INTRODUCTION 34
to a detonation. The sub-Ch model has the advantage that it can provide a simple
physical parameter (the mass of the explosion WD) which can account for the range
and diversity of SNe Ia. The parameter also allows for a correlation between stellar
population and brightness. However, in this model the Mej ∝ MNi therefore the SNe
Ia do not follow the WLR, which is inconsistent with observations (e.g. Phillips et al.,
1999).
1.3.2 Double Degenerate (DD) scenario
In the DD scenario two WDs violently merge after losing orbital angular momentum
through the emission of gravitational waves (Iben & Tutukov, 1984). The DD scenario
is favoured by some as it matches population synthesis studies (Ruiter et al., 2010).
It also agrees with delay time studies (Maoz et al., 2010). Furthermore, it has been
argued that a lack of hydrogen in the nebular phase spectra of SNe Ia favours a DD
scenario, as swept-out hydrogen would be a sign of a non-degenerate companion star
(Maguire et al., 2016).
It should be noted that non-violent mergers are thought not to lead to thermonu-
clear explosions, because these mergers would leave behind the more massive WD with
a hot envelope, made up of material from the less massive WD. Fast accretion from
the envelope would then turn the C+O WD into a O-Ne WD, which would collapse to
a neutron star (Nomoto & Kondo, 1991).
1.3.3 Triple system collision
Finally, the collision scenario is the head-on collision of two C+O WDs in a triple
system (Rosswog et al., 2009; Dong et al., 2015). When the two WDs collide they
both detonate. The sum of both of the WDs should be larger than the Chandrasekhar
mass. It has been hypothesised that these SNe Ia occur at such a rate to explain all of

CHAPTER 1. INTRODUCTION 35
the SNe Ia (Katz & Dong, 2012). Furthermore, double-peaked nebular lines could be
an observational trait of this progenitor scenario. Dong et al. (2015) found that 3 out
of 20 SNe Ia had these double peaks.
1.4 Nucleosynthesis
SNe Ia produce a large amount of metals. Nuclei up to the Fe group elements are
synthesised by fusion of C and O and by capture of α-particles. It has been theorised
that ∼55% of the Fe-group elements in the Cosmos come from SNe Ia, with almost
all of the rest of them coming from core collapse SNe (Iwamoto et al., 1999). A large
amount of SNe Ia ejecta consist of IMEs and C/O. But when SN rates are taken into
account core collapse SN contribute significantly more to IMEs and C/O abundances
in the Universe (Iwamoto et al., 1999) .
Depending on the peak temperature and peak density of the SNe Ia explosion there
will be different stages of nucleosythesis burning (Woosley et al., 1973). The burning
stages are explained below from the most to least dense.
Nuclear statistical equilibrium is reached with a high peak density (above 2 ×
108 g cm−3) and a high peak temperature (more than 5×10⁹ K). NSE is a rate equi-
librium where there is a balance between the production rate and the respective de-
struction rate (by photodissociation). For SNe Ia this is dominated by Fe-group ele-
ments. At large densities, electron capture decreases the electron fraction, which leads
to neutron-rich isotopes. Freeze out occurs when temperature and density decrease
(some back and forth reactions stop being balanced). The result depends on which
value falls low enough first, when the temperature is low enough normal freeze out
occurs. This is where temperatures are too low to produce more α particles, which are
important for building up heavier elements (i.e. the temperatures are too low to pro-

CHAPTER 1. INTRODUCTION 36
duce α particles by photodissociation). Conversely, for lower densities and a higher
temperature (T> 5× 10⁹ K) the conditions are different in NSE. 56Ni is the dominant
species produced, and neutron-rich nuclei are less common. α particles remain in high
abundance in this scenario. 12C and heavy nuclei are overabundant compared to a
normal NSE composition, this is as triple α processes occur at a larger rate.
Incomplete Si burning occurs if the peak temperature is between 4.5 and 5×10⁹ K.
In incomplete Si burning, two clusters of elements form, one with 28 < A < 45 and
the other A > 46. The result of this is roughly equal amounts of IMEs and Fe-group
elements. As the peak temperature decreases so does the abundance of the Fe group
elements. Iwamoto et al. (1999) state that the composition of the Fe group elements in
this zone is strongly dependent on metallicity.
If the peak temperature is more than 3.5×10⁹K and less than 4.5×10⁹K explosive
O burning occurs. This mostly makes IMEs (e.g. Si and S).
Figure 1.5 shows the abundance distribution in mass and velocity space for the
standard W7 explosion model. This model produces the correct kinetic energy and
abundances for a normal SNe Ia, and is therefore adopted as the standard explosion
scenario. This model is a Chandrasekhar mass fast deflagration explosion. It has a
kinetic energy of 1.3×1051erg. It is the standard model to use as a density distribution
for radiative transfer modelling of SNe Ia (Mazzali et al., 2014; Ashall et al., 2014,
2016).
1.5 SN Ia by host type
One way to separate SNe Ia is by host galaxy morphology. There have been many stud-
ies on SNe Ia differences depending on host galaxy type. It is known that faster declin-
ing and intrinsically dimmer SNe Ia are mostly found in passive galaxies (Hamuy et al.,

CHAPTER 1. INTRODUCTION 37
Figure 1.5: Abundance distribution of the W7 explosion model in velocity and mass space(Iwamoto et al., 1999).
1995, 1996). Peculiar sub-luminous 91bg-like SNe come from old stellar populations,
at least 10 Gyr old (Howell, 2001). Host stellar mass was also found to correlate with
SN luminosities; more massive galaxies tend to host SNe Ia which have lower stretch
(i.e. a larger rate of decline) than SNe in lower-mass galaxies (Sullivan et al., 2010).
It is possible that SNe Ia that occur in galaxies with different star formation, age and
dust properties may have intrinsically different luminosities (Rigault et al., 2013; Chil-
dress et al., 2013). It has also been shown that SNe Ia with a higher Si II 6355A line
velocity tend to explode in more massive galaxies (Pan et al., 2015). This is not dis-
similar from the result of Wang et al. (2013), who find that SNe Ia with high-velocity
ejecta are more concentrated in inner, brighter regions of their host galaxy. Maguire
et al. (2014) present a comparison of optical spectra with LC width information from
PTF, an untargeted transient survey. They find that on average SNe Ia with a broader
LC shape have a larger contribution from the high-velocity component relative to the

CHAPTER 1. INTRODUCTION 38
photospheric component in the Ca II NIR feature.
1.6 SN Ia by sub types
There are currently at least 6 subclasses of SNe Ia: ‘normal’, 91T-like, 02cx-like, 91bg-
like, ‘Super-Chandrasekhar’ and SNe Ia-CSM.
SN 91T-like events, named after SN 1991T, are peculiar and overluminous. Spec-
troscopically they are characterised at early times by the weakness or absence of Ca II
and Si II lines, and show very strong Si III lines. SN 1991T was ∼0.6 mag more lu-
minous than normal SNe Ia (Sasdelli et al., 2014). It has been hypothesised that 91T-
like events come from super-Chandrasekhar mass explosion mechanisms (Fisher et al.,
1999; Mazzali et al., 1995), but Sasdelli et al. (2014) find that a Chandrasekhar mass
explosion is more suited to SN 1991T.
SN 1991bg and SN 91bg-like events have low luminosity, rapidly declining light
curves, low ejecta velocities and a cool spectrum which is dominated by IMEs, as well
as particularly strong O I and Ti II lines. They are also unusually red and are under-
luminous by about ∼2 mag. The explosion mechanism of a 91bg-like SNe is a matter
of debate, with options including DD explosions of WDs, sub-Chandrasekhar mass
explosions triggered by detonation of the helium layer, or the collision of two WDs
(Hillebrandt & Niemeyer, 2000; Hoflich et al., 2002; Mazzali & Hachinger, 2012;
Dong et al., 2015).
SN 2002cx like events exhibit hot, SN 1991T-like pre-maximum spectra, a low,
91bg-like luminosity, a LC which is broad for its luminosity, and low expansion ve-
locities, roughly half of those of a normal SNe Ia (Li et al., 2003). These events are
thought to come from the deflagration of a C+O WD, which only experiences partial
burning that may (Sahu et al., 2008) or may not (Kromer et al., 2015) fully disrupt the

CHAPTER 1. INTRODUCTION 39
WD.
Super-Chandrasekhar SNe Ia are very luminous, which suggests a large 56Ni con-
tent and therefore a large ejected mass. They are thought to contain> 1.4M of ejecta,
and probably come from a DD scenario (Howell et al., 2006; Yamanaka et al., 2009).
However, they can also be explained by an ‘interacting scenario’, in which a SN Ia
interacts with a H-/He-poor circumstellar medium (Hachinger et al., 2012).
Finally, SNe Ia-CSM show strong interaction with multiple thin H-rich CSM shells
in the form of Hα emission and a black-body-like continuum (Hamuy et al., 2003;
Deng et al., 2004; Dilday et al., 2012; Silverman et al., 2013), and are probably SD
SN Ia.
1.7 SN Ia spectra
1.7.1 Photosperic phase
The early time spectra of SNe Ia are dominated by P-Cygni like profiles (Filippenko,
1997), see Figure 1.6. This is because the core is optically thick at early times, due to
line opacity of Fe-group elements (Mazzali, 2000). The radiation diffuses through the
central core, which contains mostly 56Ni, reaches the outer layers and escapes. As the
56Ni is in the inner core, the outer layers can be assumed to be in radiative equilibrium.
Therefore the outer layers just reprocess the flux coming from the inner layers (Maz-
zali, 2000). Hence, the outer layers leave P-Cygni like profiles (red emission + blue
absorption) on a smooth underlying spectrum.
Although SNe Ia are standardizable candles their spectra can vary considerably
as one looks down the WLR. Figure 1.7 demonstrates the diversity of SNe Ia spectra
at maximum light. From top to bottom is a luminosity and temperature evolution
(excluding SN 2002cx and SN 2003hv). As the luminosity decreases the Si II ratio

CHAPTER 1. INTRODUCTION 40
Figure 1.6: A plot showing how P-Cygni profiles are formed in SNe Ia (Kasen, 2016).

CHAPTER 1. INTRODUCTION 41
increases. This is due to the increase in recombination of Si III to Si II, which populates
the blue of the Si II lines, as this line is at a higher excitation level (Hachinger et al.,
2006). Furthermore, at the lowest luminosities the ∼4500A Ti II feature begins to
show. This feature is a good indication of a low luminosity SNe Ia (Ashall et al.,
2016). Some SNe Ia have been seen with high velocity features (HVF). A HVF is
defined as a feature which has a minimum which is greater than 6000 km s−1 faster
than the photospheric velocity. The most prominent HVFs for SNe Ia are Ca II H&K,
Si II λ6355 and Ca NIR triplet. HVF Ca II features are found in all SNe Ia except
subluminous ones (Silverman et al., 2015). HVFs of Si II λ6355 are significantly
rarer, and they tend to exist at the earliest epochs and mostly in objects with large
photospheric velocities, and stronger HVFs in λ6355 are seen in objects which lack
C II absorption at early times (Silverman et al., 2015). HVFs have been theorised to be
abundance or density enhancements. Abundance enhancements would imply an outer
region dominated by Si and Ca. Density enhancements may result from the sweeping
up of circumstellar material (CSM) by the highest velocity SN ejecta (Mazzali et al.,
2005). They are also thought to be related to geometrical effects, where the HVF has
a clumpy structure (Tanaka et al., 2006).
1.7.2 Nebular phase
At late times the SN ejecta is optically thin, therefore the inner part of the ejecta can
be explored. This phase in the SN explosion is known as the nebular phase. The inner
part of a SN ejecta is dominated by semi-forbidden and forbidden transitions (Axelrod,
1980). A normal SNe Ia nebular spectrum is dominated by∼4700A Fe III and∼5200A
Fe II features. Figure 1.8 is a nebular spectrum and model of SN 2011fe. This spectrum
presents most of the lines in a normal SN Ia spectrum. The nebular spectra provides
information about the central density of the exploding WD. For example, a high Fe III

CHAPTER 1. INTRODUCTION 42
3000 4000 5000 6000 7000 8000 9000 10000
Wavelength A
Flux A
rbit
rary
unit
s
SN1991T, ∆m15(B) =0.94
SN2011fe, ∆m15(B) =1.1
SN2002cx, ∆m15(B) =1.3
SN2004eo, ∆m15(B) =1.47
SN2003hv, ∆m15(B) =1.6
SN2011iv, ∆m15(B) =1.73
SN1896G, ∆m15(B) =1.8
SN1991bg, ∆m15(B) =1.93
Figure 1.7: Diversity of maximum light spectra of SNe Ia. The spectra are plotted from topto bottom in terms of light curve shape. It should be noted that the spectrum of SN 2004eowas taken at +2 days compared to B band maximum. Therefore it appears less luminous in theabove plot.

CHAPTER 1. INTRODUCTION 43
Figure 1.8: A nebular spectrum and model of SN 2011fe (Mazzali et al., 2015).
to Fe II ratio can imply a low central density, such as that seen in SN 2003hv (Mazzali
et al., 2008).
1.8 SN Ia UV data
Early UV spectra of SNe Ia contain important information about the metallicity of the
SN progenitors, as well as the outer layers of the explosion. To date there have been a
handful of detailed studies on SN Ia UV spectra. Studying the early ultraviolet (UV)
spectra of SNe Ia can let us infer information about the metallicity of the progenitor
system (Lentz et al., 2000; Sauer et al., 2008; Mazzali et al., 2014). Maguire et al.
(2012) studied individual spectra of 32 low redshift SNe Ia at maximum light. They
found that mean low redshift NUV(2900A < λ) spectrum has a depressed flux com-
pared to its intermediate redshift counterpart. Foley et al. (2016) presented the first
set of high signal-to-noise ratio of SNe Ia spectra which extend blue-ward of 2900A.
The Foley et al. (2016) sample go to 1800A . They present a sample of 10 SN which
span the majority of the parameter space of SN Ia optical diversity. They found that

CHAPTER 1. INTRODUCTION 44
the majority of the UV variance correlates with the optical light curve shape.
Other work has concentrated on taking high cadence UV spectra of individual SN,
such as SN 2011fe, 2014J and 2013dy. Mazzali et al. (2014, 2015) present 10 HST
near-UV to optical spectra of SN 2011fe. They perform spectral synthesis analysis,
and conclude, by using an ad-hoc density profile, that SN 2011fe was a relatively weak
explosion and had a stronger high velocity tail compared to a standard W7 explosion
model. They also conclude that the metallicity of the SN is half of the solar metallicity,
which Foley et al. (2016) agree with. Pan et al. (2015) present a high cadence data set
of SN 2013dy, spanning from 0.1 to 500 days after explosion, including 10 epochs of
HST UV-to-NIR spectra. SN 2013dy was a normal low velocity gradient SNe Ia with
a broad slow declining light curve. They also found that models for SN 2013dy are
in good agreement with a solar-metallicity standard W7 model explosion. Foley et
al. (2014) presented 10 epochs of observations of HST UV spectra of SN 2014J. SN
2014J was the closest SN Ia in possibly the last 410 years. It was located in M82 and
they argue that the peculiar extinction towards SN 2014J is caused by a combination
of dust reddening and scattering off circumstellar material.
1.9 Outline of thesis
The rest of this thesis will be presented in the following way. The next chapter will
present the project on SNe Ia light curves, separated by host galaxy morphology. The
following chapter will describe the theory of radiative transfer and the abundance to-
mography technique and method. The following chapter will present the project on SN
2014J. Modelling of SN 1986G will then be shown. Finally a general discussion and
conclusions will be presented.

2. Luminosity Distributions of SNe
Ia
2.1 Preface
To examine the diversity of SNe Ia I first present a large sample analysis of their
B and V - band light curves separated by host galaxy type. A dataset of 165 low
redshift, z <0.06, publicly available type Ia supernovae (SNe Ia) has been assem-
bled. Maximum light magnitude (MB and MV ) distributions of SNe Ia have been
produced to explore the diversity of parameter space that they can fill. Before cor-
rection for host galaxy extinction it is found that the mean MB and MV of SNe Ia are
−18.58± 0.07 mag and−18.72± 0.05 mag respectively. Host galaxy extinction is cor-
rected using a new method based on the SN spectrum. After correction, the mean val-
ues ofMB andMV of SNe Ia are−19.10 ± 0.06 and−19.10 ± 0.05 mag respectively.
After correction for host galaxy extinction, ‘normal’ SNe Ia (∆m15(B) < 1.6 mag)
fill a larger parameter space in the Width-Luminosity Relation (WLR) than previously
suggested, and there is evidence for luminous SNe Ia with large ∆m15(B). We find
a bimodal distribution in ∆m15(B), with a pronounced lack of transitional events at
∆m15(B)=1.6 mag. We confirm that faster, low-luminosity SNe tend to come from
passive galaxies. Dividing the sample by host galaxy type, SNe Ia from star-forming
45

CHAPTER 2. LUMINOSITY DISTRIBUTIONS OF SNE IA 46
(S-F) galaxies have a mean MB = −19.20 ± 0.05 mag, while SNe Ia from passive
galaxies have a mean MB = −18.57 ± 0.24 mag. Even excluding fast declining SNe,
‘normal’ (MB < −18 mag) SNe Ia from S-F and passive galaxies are distinct. In the
V -band, there is a difference of 0.4± 0.13 mag between the median (MV ) values of
the ‘normal’ SN Ia population from passive and S-F galaxies. This is consistent with
(∼ 15± 10)% of ‘normal’ SNe Ia from S-F galaxies coming from an old stellar popu-
lation. Work from this chapter of the thesis was published in Ashall et al. (2016). All
of the work in this chapter was carried out my myself, except calculating for the host
galaxy extinction which was calculated by Michele Sasdelli and the K-corecction code
which was written by Simon Prentice.
2.2 Previous studies
In modern times there has been a dramatic increase in SNe data, which means that
SNe Ia can be studied in more detail. The increase in available data has meant that
large sample studies can now be performed, allowing one to gain more information
about the variation in SNe Ia properties. A few studies have attempted to build the
luminosity functions (LF) of SNe Ia. Such information would be useful because it
would make it possible to quantify the incidence of different subtypes of SNe Ia, and
thus of their progenitor/explosion scenarios. Li et al. (2011) present a volume-limited
LF from LOSS, and find evidence for a difference in absolute magnitude between
SNe Ia when these are separated into host galaxy bins of E-Sa and Sb-Irr. However,
they do not correct for host galaxy extinction. Yasuda & Fukugita (2010) produce a
LF of low redshift SN discovered by SDSS-II supernova survey. They claim that the
occurrence of type Ia supernovae does not favour a particular type of galaxy, but is
predominantly dependent on the luminosity of the galaxy. They also claim that the rate

CHAPTER 2. LUMINOSITY DISTRIBUTIONS OF SNE IA 47
of SNe Ia is higher by 31±35% in late-type than in early-type galaxies. Hicken et al.
(2009) present a sample of 185 SNe Ia. They find that 91bg-like SNe Ia are distinct
from other SNe Ia in their colour and light curve shape-luminosity relation, and state
that they should be treated separately in light curve distance fitter training samples.
Although the use of SNe Ia as cosmological probes is well established, it is also
known that a few events do not follow the normal ‘rules’ of SNe Ia. For example,
PTF10ops (Maguire et al., 2011) was a sub-luminous SN Ia, but its LC had a normal
width. 02cx-like events can also be broad in LC shape and intrinsically dim. Tra-
ditional LC fitting methods find it difficult to differentiate between colour and host
galaxy extinction, so that, for example, a SN Ia which has a normal LC shape but is
intrinsically red may be mistaken for a SN which is normal but has more host galaxy
extinction. Furthermore, for cosmological purposes, traditional methods exclude any
intrinsically peculiar SNe Ia.
The objective of this project is to include as many peculiar SNe Ia as possible, and
hence examine their range and diversity. As there are many subclasses of SNe Ia, an
approach different from LC template fitting analysis is taken. This analysis makes as
few assumptions as possible so the intrinsic properties of these unusual SNe Ia can be
examined. This allows for the possibility that SNe with the same LC shape can have
intrinsically different properties. This is achieved by obtaining the distance to the SNe
first, from data that do not use the SN as distance indicator, rather than obtaining the
distance to the SNe from the LC shape and observed colour information. Although
this method is possibly less accurate, it allows us to explore the full parameter space
of SNe Ia, and is better at treating peculiar SNe Ia. Furthermore, the method is unique
as host galaxy extinction is derived from the spectra rather than the photometry, which
helps to break the colour-reddening degeneracy (Sasdelli et al., 2016), see Section
2.4.6. Because the observed sample cannot be controlled it is not possible to build a

CHAPTER 2. LUMINOSITY DISTRIBUTIONS OF SNE IA 48
LF, but only a LD, which is however useful as all SNe used here are nearby, suggesting
that the sample should be reasonably complete.
A large sample analysis is carried out, which primarily focuses on SN Ia LC prop-
erties, separated by host galaxy type. In section 2.3 the data and methods used in
this work are presented. Section 2.4 discusses the quality of the data fit. Section 2.5
presents the observed SN Ia luminosity distributions and discusses the Width Lumi-
nosity Relation. In Section 2.6 the data are corrected for host galaxy extinction, and
separated by host galaxy type. In Section 2.7 the full luminosity distribution is pre-
sented. Section 2.8 attempts to separate the distributions of SNe Ia from young and old
stellar systems. The main discussion is provided in Section 2.9, and a short summary
is presented in Section 2.10.
2.3 Data & Method
A dataset of 165 low redshift, z < 0.05, SNe Ia with publicly available data has been
assembled. Their redshift distribution is shown in Figure 2.1. The photometric data in
this work come from a variety of public sources, see Table 1. The mean redshift of the
sample is z = 0.019. When comparing SN Ia LCs and their derived parameters it is
essential that they have sufficient temporal coverage, as overinterpolating or incorrectly
extrapolating the data can cause incorrect results. All SNe in the data set used in this
work have good temporal coverage, at least 6 data points, from maximum to +15 days
and at least one pre-maximum data point. The data used in this work were published
in the standard Johnson-Cousin filter system, and no filter conversions were carried
out in this analysis. The B and V -band filters are used for the analysis as this is
where SNe Ia peak in flux; these bands are also historically the most often used, and
therefore the best sampled. Most of the optical lines are within theB and V passbands,

CHAPTER 2. LUMINOSITY DISTRIBUTIONS OF SNE IA 49
Figure 2.1: Redshift distribution of the SNe Ia used in this work. The bin sizes are z=0.002.
Table 2.1: Sources of the data.
Reference Number of SNe IaGaneshalingam et al. (2010) 102
Hicken et al. (2009) 24Hicken et al. (2012) 18Riess et al. (1999) 10Individual papersa 11
a See Table 2.2
therefore these bands are the best to study the diversity of SNe Ia. There is an obvious
bias in our sample caused by the fact that most data were obtained by magnitude-
limited surveys. However, as many SNe Ia as possible are used to avoid small sample
statistics. Because the data come from a range of sources it is not possible to carry out
completeness corrections, therefore in this work we produce luminosity distributions
(LD), which can show the diversity of SNe Ia, rather than luminosity functions (LF).
In order to avoid introducing any further biases, here it is not assumed that two

CHAPTER 2. LUMINOSITY DISTRIBUTIONS OF SNE IA 50
Table 2.2: The reference of the 11 SNe Ia mentioned in Table 2.1.
SNe name ReferenceSN 1986G Phillips et al. (1987)SN 1990N Lira et al. (1998)SN 1991bg Krisciunas et al. (2004)SN 1991T Krisciunas et al. (2004)SN 1998aq Riess et al. (2005)SN 2000ca Krisciunas et al. (2004)SN 2000E Valentini et al. (2003)SN 2001bt Krisciunas et al. (2004)SN 2001cz Krisciunas et al. (2004)SN 2001el Krisciunas et al. (2003)SN 2003du Anupama et al. (2005)
SNe Ia that have the same LC shape necessarily also have the same intrinsic luminosity
and colours (unlike, e.g., Riess et al., 1996). This is done by first finding an indepen-
dent distance to each SN and using that distance to determine the luminosity of the SN.
The distances were derived using the local velocity field model of Mould et al. (2000),
which takes into consideration the influence of the Virgo Cluster, the Great Attractor,
the Shapley Supercluster, and the CMB. To verify the reliability of the distance mea-
surements they were checked against Cepheid distances for 5 SNe Ia which occurred
in galaxies with Cepheid distance measurements. It was found that the distances to
the SNe Ia are consistent with the Cepheid distances (within 0.06 Mpc). The velocity
field model requires a value of H0. Cosmological parameters which are consistent with
Cepheid measurements are used, i.e. H0=73 km s−1 Mpc−1, Ωm = 0.27, ΩΛ = 0.73. It
should be noted that a change in H0 would cause a global shift in values, but it would
not directly affect the results in this work.
Before different SNe can be compared their photometry must be dereddened and
converted to rest frame. All SNe were corrected for foreground Galactic extinction
using the Schlafly & Finkbeiner (2011) map and assuming Rv = 3.1. In this chapter,
from this point forward all of the data has been corrected for MW extinction. Where

CHAPTER 2. LUMINOSITY DISTRIBUTIONS OF SNE IA 51
Table 2.3: Statistics of the data, not corrected for host galaxy extinction has been applied.
All S-F Passive E S0Amount of SNe 165 134 26 17 9
MB –18.58 ±0.07 –18.63 ±0.07 –18.29 ±0.21 –18.29 ±0.24 –18.30 ±0.39σMB 0.82 0.77 1.06 0.99 1.17
∆M15B 1.14 ±0.03 1.11 ±0.03 1.29 ±0.08 1.30 ±0.10 1.28 ±0.12σ∆M15B 0.32 0.30 0.39 0.40 0.35MV –18.72 ±0.05 –18.75 ±0.05 –18.52 ±0.15 –18.50 ±0.17 –18.56 ±0.29σMV 0.61 0.58 0.76 0.71 0.86
∆m15V 0.68 ±0.01 0.67 ±0.01 0.77 ±0.05 0.79 ±0.06 0.74 ±0.07σ∆m15V 0.18 0.16 0.25 0.25 0.22(B − V )1 0.11 ±0.02 0.11 ±0.02 0.17 ±0.06 0.16 ±0.07 0.20 ±0.10σ(B − V )a 0.25 0.24 0.29 0.29 0.29
any further discussion is made with regards to parameters with and without extinction,
this refers to host galaxy extinction. The data were converted to the rest frame and K-
corrections were applied. A time series of spectra of SN 2011fe (Mazzali et al., 2014)
were used as a template to calculate the K-corrections, the corrections were carried out
in accordance with Oke & Sandage (1968). Using SN 2011fe as a template is making
an assumption about the SED of the SN, however this affects the fluxes in our final
results by less than 5% in most cases. The K-corrections were applied to each SN at
the corresponding redshift and epoch, using both the B and V -bands.
Finding the host galaxy morphology of each SN in the dataset is integral to this
study. Host galaxy types were obtained from NED2. The dataset was separated into
two galaxy Hubble type bins, E-S0 (passive galaxies) and Sa-Irr (star forming (S-F)
galaxies). Only two bins were chosen to separate the sample, as the properties of the
stellar populations are different in each bin. Also, using more bins would significantly
decrease the sample in each bin. E+S0 galaxies have an older stellar population with
little or no star formation. Out of the sample of 165 SNe, 134 (82%) SNe are from
the Hubble Sa-Irr bin, 26 (13%) are from the E+S0 bin, of which 17 (10%) are from
2 NASA/IPAC Extragalactic Database (NED)

CHAPTER 2. LUMINOSITY DISTRIBUTIONS OF SNE IA 52
elliptical galaxies and 9 (5%) are from S0 galaxies. Finally, 5 SNe (3%) are from
galaxies whose host type could not be determined. Binning the SNe by host galaxy
type does not decrease the sample as much as distinguishing by star forming rates or
galaxy stellar mass.
133 (81%) of the SNe were classified as spectroscopically ‘normal’, 14 (9%) 91T
or 99aa-like, 14 (8%) as 91bg-like and 4 (2%) as 02cx-like. Comparing this to the rates
of SNe Ia from Li et al. (2011) (70% normal, 15% 91bg, 9% 91T, 5% 02cx) shows that
the public data set has a bias of too many ‘normal’ SNe Ia and fewer dimmer SNe.
The lack of 91-bg like events in the sample could be due to their short rise time, which
makes them harder to detect before maximum light. SNe without maximum light
information would be excluded from the sample in this work. Additionally, 91bg-
like SN are dimmer events and are therefore affected by Malmquist bias. This does
raise the issue that if one wants a true representation of the intrinsic properties of
SNe Ia, a very high cadence, deep and volume-limited survey is required, as well as
a lot of ground-based spectroscopic follow up, however this is not available. The
Large Synoptic Survey Telescope (LSST) which will come online in 2020 will provide
the cadence required for this (Ivezic, 2014). It should be noted that the host galaxy
subtraction from Li et al. (2011) excludes the central 2.4−3.2 arcsec region of the host
galaxies, so the true rate may differ from theirs.
SNe Ia photometry, to first order, can be analysed using two parameters, the de-
cline rate or stretch of the LC and the colour correction of the SNe. This is tradition-
ally done using LC template fitters, and is therefore based on existing assumptions,
data and templates. In reality SNe Ia are a far more diverse group than these LC fitters
can assume, as their spectra show. Therefore, no prior pre-existing LC fitter is used,
a different method of fitting the data is applied. In this section it is explained how the
photometry is fitted and how the errors are calculated. The LCs are produced by using

CHAPTER 2. LUMINOSITY DISTRIBUTIONS OF SNE IA 53
a smoothed cubic spline, implementing the PYTHON module UNIVARIANT SPLINE, on
the photometry which has been K-corrected and dereddened for foreground Galactic
extinction. These values are used as the final values of the apparent magnitude and
light curve shape, as measured by the parameter ∆m15(B), the difference in magni-
tude between maximum and +15 days (Phillips et al., 1999). This process was carried
out for both the B and V -bands. The two spline fits were subtracted to obtain the
B − V curve, and from this the colour at B maximum, (B − V )Bmax, was obtained.
The distance modulus was used to obtain the absolute magnitudes MB and MV of all
SNe in the sample.
To compute the errors on the apparent magnitude and ∆m15, all of the photo-
metric errors are treated as Gaussians. Each photometric point is randomly varied, in
accordance to the weighting of a Gaussian. From this new LCs are produced, using the
method discussed above. This was done 1000 times per SN, and the standard deviation
in the spread of values is taken as the errors on apparent magnitude and ∆m15(B).
As an example of this process, Figure 2.2 shows the photometry and fitted LCs for
SN 2000dn. The peak apparent magnitude for SN 2000dn is 16.63±0.03 mag and the
decline rate ∆m15(B) = 1.11 ± 0.07 mag. Only the LC up to 30 days past B-band
maximum is fitted, as late time photometry is not analysed in this work. The plot
demonstrates that there is a larger spread in values when the errors on the photometry
are larger. On the other hand, high cadence photometry reduces the errors. As SNe
are obtained from multiple sources it is not possible to distinguish between systematic
errors which could cause a global shift in the LC, and errors such as poor host galaxy
subtraction, which would affect the shape of the LC. Therefore the errors of the fits
could be overestimated if the errors on the photometry include systematics.

CHAPTER 2. LUMINOSITY DISTRIBUTIONS OF SNE IA 54
Figure 2.2: An example of the fitting procedure, theB-band light curve of SN 2000dn. The redpoints are the photometry and the shaded area is the 1000 LCs derived from these photometrypoints, as explained in section 2.1.
2.4 Quality of LC spline fit
In this section the quality of the spline LC fits are quantified. In Figure 2.3, in the B
band, the residuals between the SN data and fitted LC for 46 randomly selected SN
from the sample are plotted. The residuals in this plot are less than 0.05 mag for each
SN. These are significantly smaller than the errors, which were taken as the errors on
the photometric data. Such small residuals can be produced as the LC is only fitted until
20 days past maximum, and only SNe with very good temporal coverage are selected.
Figure 2.4 shows the same residuals using the V band, the residuals for these bands
are also less than 0.05 mag. The residuals in these plots are constant as a function of
time, therefore there are no systematic residuals with phase.

CHAPTER 2. LUMINOSITY DISTRIBUTIONS OF SNE IA 55
Figure 2.3: The B band residuals between the SN photometry and LC spline fit, as a functionof time. Data from 46 randomly selected SNe are used.
Figure 2.4: The V band residuals between the SN photometry and LC spline fit, as a functionof time. Data from 46 randomly selected SNe are used.

CHAPTER 2. LUMINOSITY DISTRIBUTIONS OF SNE IA 56
2.5 Luminosity Distribution
2.5.1 B and V luminosity distributions
The B-band absolute magnitude and decline rate distributions of the SNe in the sam-
ple before correction for reddening are shown in the top panels of Figure 2.5. The
bin sizes are 0.2 mag for MB and 0.1 mag for ∆m15(B). The mean B-band absolute
magnitude of the sample is MB = −18.58 ± 0.07 mag, and the sample ranges from
−19.8 to −15.6 mag. There is no definitive peak in absolute magnitude in this dis-
tribution, which is due to the missing correction for host galaxy extinction and to the
‘tail’ of sub-luminous SNe. The distribution in ∆m15(B) is bimodal, with two peaks
at 0.9 − 1.0 mag and 1.7 − 1.8 mag. A Gaussian-mixture modelling test (GMM; Mu-
ratov & Gnedin, 2010) was run to evaluate the likelihood that a bimodal distribution
is preferred over a unimodal one. It is found that for ∆m15(B) a bimodal distribu-
tion is preferred: the probability that the ∆m15(B) distribution is unimodal is less
than 0.1 per cent. The bimodal distributions was fitted by two Gaussians. Out of the
165 SNe Ia in the sample, the test places 135.3 ± 20.8 SNe (82 per cent) in a Gaus-
sian with mean decline rate ∆m15(B) = 1.034 ± 0.035 mag and standard deviation
0.207±0.032 mag, and 29.7±20.8 SNe (18 per cent) in a Gaussian with mean decline
rate 1.713 ± 0.131 mag and standard deviation 0.164±0.080 mag. 18% is more than
the fraction of 91bg-like SNe in the sample. The bimodal distribution could be due
to the presence of sub-Chandrasekhar mass events with large ∆m15(B) (e.g. Mazzali
& Hachinger, 2012; Mazzali et al., 2011), or to delayed-detonation explosions with a
range of transition densities from deflagration to detonation: Hoflich et al. (2002) find
that for a range of smoothly distributed transition densities there is a lack of SNe Ia
with 56Ni mass between 0.15 and 0.25M. This gap corresponds to the lack of SNe Ia
at ∆m15(B)=1.6 mag seen in Figure 2.5.

CHAPTER 2. LUMINOSITY DISTRIBUTIONS OF SNE IA 57
Figure 2.5: The luminosity distributions and ∆m15 distributions of the SN sample before cor-rection for reddening. Top: The left plot is a distribution of B-band absolute magnitude, andthe right plot is the distribution of ∆m15(B). Bottom: The left plot is a distribution of V -bandabsolute magnitude, and the right plot is the distribution of ∆m15(V ). In these plots the SNehave not been corrected for host galaxy extinction. The stars in two right hand panels are theGaussians calculated from the GMM tests.

CHAPTER 2. LUMINOSITY DISTRIBUTIONS OF SNE IA 58
SNe in the trough between the two peaks are typically classified as ‘transitional’,
with examples being SNe 2004eo (Pastorello et al., 2007) and 2012ht (Yamanaka et
al., 2014). Transitional SNe bridge the gap between ‘normal’ and 91bg-like SNe Ia.
The ejected 56Ni masses (MNi) of transitional SNe Ia lie near the lower limit of the MNi
distribution of normal SNe Ia. There is still a lack of published literature on transitional
SNe Ia. It is these objects which could help define whether 91-bg-like SNe Ia arise from
a separate population or there is a smooth distribution of properties SNe Ia. iPTF13ebh,
SN 1986G and SN 2003hv are all classified as transitional SNe Ia. None of these events
follow the normal paradigm of SNe Ia. SN 2003hv may have less mass in the inner
layers of the ejecta than Chandrasekhar mass density profiles predict: synthetic nebular
models were unable to produce the high Fe III/Fe II ratio in the optical spectrum along
with the low infrared flux using a W7 density profile (Leloudas et al., 2009), but a lower
mass yielded good results (Mazzali et al., 2011). SN 1986G was the first reported
SN of this type. It was spectroscopically similar to sub-luminous SNe, showing a
(weaker) Ti II feature, a large ratio of the Si II lines (Nugent et al., 1995; Hachinger et
al., 2006) and narrow unblended lines in the Fe∼4800 A feature (Phillips et al., 1987).
iPTF13ebh showed several strong NIR C I lines in the early time spectra, but no strong
C I lines in the optical (Hsiao et al., 2015).
It should be noted that Maguire et al. (2014) do not find a bimodal distribution in
∆m15 when they convert their values of stretch to ∆m15. This may indicate that the
double-peak distribution in ∆m15 could be a selection effect. However, it is unclear
how reliable the conversion from stretch to ∆m15(B) is. Furthermore, Maguire et
al. (2014) use data from a flux limited survey, and therefore the difference between
their distribution and ours could stem from the lack of observed SN 91bg-like events
in their sample. Burns et al. (2014) state that ∆m15(B) is an unreliable parameter
for fast declining SNe Ia with ∆m15(B) > 1.7 mag, because for these SNe there is a

CHAPTER 2. LUMINOSITY DISTRIBUTIONS OF SNE IA 59
degeneracy between LC shape and ∆m15(B). Here, however, ∆m15(B) is used only
to discriminate between normal and sub-luminous SNe Ia, which is sufficient for our
analysis.
The lower part of Figure 2.5 presents the V -band absolute magnitude and ∆m15(V )
distributions. Bin sizes are again 0.2 mag and 0.1 mag respectively. The mean MV
value is MV − 18.72±0.05 mag, while ¯∆m15(V ) = 0.68± 0.01 mag. There is no sta-
tistically significant evidence that the distribution in ∆m15(V ) is bimodal. Although
not statistically significant, a bimodal ∆m15(V ) distribution has been plotted in Fig-
ure 2.5 (bottom left panel). The two Gaussians have mean ∆m15(V ) of 0.642± 0.015
and 0.999±0.201 mag and standard deviations of 0.106±0.031 and 0.166±0.067 mag,
respectively.
The standard deviation in absolute magnitude, see Figure 2.5, is less in the V -band
(0.61 mag), than in the B-band (0.82 mag). This is partly caused by the fact that the
B-band is more affected by extinction. It could also be caused by some SNe Ia having
broad, a High Velocity Ca II feature at∼3800 A or different amount of line blanketing
in the UV, although the latter will not be the largest contributor to the difference.
2.5.2 Width Luminosity Relation
The WLR relationship was extended by Phillips et al. (1999) and then Taubenberger
et al. (2008) to include sub-luminous SNe Ia. Figure 2.6 shows this relation within the
context of this work. It is clear that there is an underlying correlation (‘The Phillips
Relation’) with some scatter. The relation from Phillips et al. (1999) is plotted in
Figure 2.6 to show this. SNe Ia with low luminosity but ∆m15(B) < 1.6 are likely to
be affected by host galaxy extinction, but the exact amount cannot be determined using
only this plot. Faster-declining SNe tend to come from passive galaxies and are less
affected by extinction. Therefore, the ‘tail’ in the WLR, which was first pointed out

CHAPTER 2. LUMINOSITY DISTRIBUTIONS OF SNE IA 60
Figure 2.6: The B-band WLR before reddening correction. The black points are SNe fromS-F galaxies, the blue points are SNe from E galaxies, and the red points are SNe Ia from S0galaxies. The yellow line is the WLR given in Phillips et al. (1999), and the red line is therelation given for the subluminous tail from Taubenberger et al. (2008).
by Taubenberger et al. (2008), is likely to be intrinsic, and not the effect of extinction.
Their relation for the subluminous tail is also plotted in Figure 2.6. Furthermore, there
is a dearth of SNe at ∆m15(B) ∼ 1.6 mag, where the SNe transition from ‘normal’
to sub-luminous. Interestingly this gap is where the two relations from Phillips et al.
(1999) and Taubenberger et al. (2008) meet.
To overcome the effect of extinction, one could select only SNe with a very small
colour term, (B−V )Bmax < 0.01, as they are thought to be less affected by host galaxy
extinction. The top panel in Figure 2.7 shows that the scatter in the WLR plot is indeed
reduced when only these SNe are selected. A second-order polynomial line of best fit
is obtained, shown as the blue line in Figure 2.7. This is given by,
MB = 0.252∆m15(B)2 − 0.015∆m15(B)− 19.31 (2.1)
However, this approach eliminates any intrinsically red or unusual SNe Ia. The
bottom plot in Figure 2.7 shows the residuals from this fit; the mean residual is 0.22 mag.
The reduced χ2 of the fit is 3.3. When compared to the fit from Phillips et al. (1999)

CHAPTER 2. LUMINOSITY DISTRIBUTIONS OF SNE IA 61
0.6 0.8 1.0 1.2 1.4 1.6 1.8 2.0 2.2
∆m(B)15
20
19
18
17
16
15
MB
0.6 0.8 1.0 1.2 1.4 1.6 1.8 2.0 2.2
∆m(B)15
1.0
0.5
0.0
0.5
1.0
1.5
Resi
dual (m
ag)
Figure 2.7: Top: The WLR before reddening correction including only SNe with(B − V )Bmax < 0.01. The blue line of best fit is a second order polynomial. The yellowmodel is the line of best fit from Phillips et al. (1999). Bottom: The residuals of the WLRabove as a function of ∆m15(B).

CHAPTER 2. LUMINOSITY DISTRIBUTIONS OF SNE IA 62
(yellow model in the top panel of Figure 2.7), a similar result is found, although the
fit is not as tight. The SN which sits clearly off the Phillips relation, with a value of
MB > −18 mag is SN 2008cm. SN 2008cm has been rejected in cosmological studies
for being an outlier (Rest et al., 2014). This demonstrates that LCs alone do not contain
enough information to differentiate between types of SNe Ia.
2.6 Correction for host galaxy extinction
The intrinsic colours of SNe Ia change over time because of the changing properties of
the ejecta. Normally, for less luminous SNe this change is over a shorter time scale than
for more luminous SNe. It is observationally difficult to distinguish between intrinsic
colour properties of a SNe and reddening due to dust between the SNe and the observer.
Determining this is central to the full understanding of the nature of SNe Ia, but it is
not trivial. Several studies tried to estimate SN Ia colour. The Lira law (Phillips et al.,
1999) found that the B − V colours of SNe Ia, at all decline rates, evolve in a nearly
identical way, from +30 to +90 days past V maximum. It has also been shown that
high- and normal-velocity (NV) SNe exhibit significant discrepancies in B − V and
B −R, but not in other colours (Mandel et al., 2014).
Spectral properties such as equivalent widths (EW) can be used as indicators to
attempt to distinguish between colour and host galaxy extinction. EWs are not affected
by extinction, and there are intrinsic relationships between the EW of certain lines and
the SN LC parameters, such as between EW(Si II 5972) and ∆m15(B) (Nugent et al.,
1995; Hachinger et al., 2006). When trying to obtain extinction from estimates of
reddening, it is important that the correct value of Rv (the ratio of total to selective
extinction) is used. In the Milky Way the average value of Rv is 3.1 (Cardelli et al.,
1989), but it varies depending on the region observed. For SNe Ia very low values of

CHAPTER 2. LUMINOSITY DISTRIBUTIONS OF SNE IA 63
Rv have sometimes been reported, ranging from 1.1 to 2.2 (Tripp, 1998; Kessler et al.,
2009; Guy et al., 2010; Folatelli et al., 2010). Chotard et al. (2011) derived a larger
value of Rv = 3.1, which is consistent with the MW value. Sasdelli et al. (2016)
used time-series of SNe Ia spectra in derivative space, which is not affected by poor
calibration, to explore host galaxy extinction, and found that Rv = 2.9 ± 0.3 fits the
data the best, and is also consistent with the MW value.
From the WLR in Figure 2.6, it is not possible to tell how much of the scatter is in-
trinsic and how much is due to extinction, since SNe Ia are not perfectly homogeneous.
For almost all astronomical data, correction for both Galactic and host extinction is im-
portant, especially when comparing objects. Sasdelli et al. (2014) attempted to break
the colour-reddening degeneracy using spectroscopic time series as predictor variables
of the intrinsic colour. They built a metric space for SNe Ia independent of extinction
using Principal Component Analysis (PCA). The intrinsic spectral evolution of the
SNe Ia is represented by a 5-dimensional feature space. This space does not include
dust extinction. Two intrinsically similar SNe with different extinction have similar
projections in this feature space. Sasdelli et al. (2014) use this feature space to predict
the B − V colour of SNe using a Partial Least Square regression (PLS). Only the in-
trinsic part of the B − V colour can be predicted by PLS. The difference between the
predicted intrinsic colour and the observedB−V colour can then be interpreted as due
to dust extinction. This yields estimates of E(B−V ) for the individual SNe. With this
host galaxy extinction information we can examine the intrinsic properties of SNe Ia.
In this section a correction for host galaxy extinction based on the method of Sas-
delli et al. (2016) is applied and the values of E(B−V ) are thus derived. This method
removes spectroscopically peculiar SNe Ia that are underrepresented in the data, and
therefore can bias our sample towards normal and luminous SNe Ia. Extinction is
corrected for using the CCM law (Cardelli et al., 1989) with RV = 2.9, and the ap-

CHAPTER 2. LUMINOSITY DISTRIBUTIONS OF SNE IA 64
proximation
∆m15(B)true = ∆m15(B)obs + 0.1× E(B − V ), (2.2)
to correct ∆m15(B) for extinction is used. ∆m15(V ) has not been corrected for
extinction as the effect is negligible in the V band (Phillips et al., 1999). This is as for
objects with a very large extinction the difference in observed and intrinsic V band flux
is less than that of theB band, and therefore the time of V band maximum changes by a
negligible amount. Which means the change in ∆m15(V ) is not affected byE(B−V ).
As the sample size is reduced in this section of the analysis, the main properties
of the SN sample must be verified before and after host galaxy extinction correction
is applied, in order to determine whether the reduced sample is selected randomly
from the larger one or it is biased towards normal SNe Ia by the selection process.
For the sample before correction, MB = −18.66 ± 0.07 mag, which is comparable to
−18.58 ± 0.07 mag from the larger uncorrected sample. The mean ∆m15(B) values
from the two samples are also similar, 1.14 ± 0.03 mag and 1.11 ± 0.03 mag for the
larger and smaller samples respectively. The mean MV values were also found to be
similar, −18.72± 0.05 mag and −18.77± 0.05 mag for the larger and smaller samples
respectively. Out of the 56 SNe Ia which were removed from the sample 2 were 91-bg
like, 4 were- 91T-like and 47 were normal SNe Ia. These SNe were rejected as they
had insufficient spectral coverage, so it is not possible to tell if they have a peculiar
spectral evolution. The other 3 of the 56 had be to removed from the sample for being
spectroscopically peculiar. These were 2005hk (a 2002cx like SN), 2004dt (a highly
polarised SN, Altavilla et al. (2007)) and 1999cl (a highly extinguished SN).
Figure 2.8 shows the amount of host extinction for each galaxy type derived with
the method of Sasdelli et al. (2016). The top left plot shows how the LD of SNe Ia
from S-F galaxies changes when host galaxy extinction is corrected for. The top-

CHAPTER 2. LUMINOSITY DISTRIBUTIONS OF SNE IA 65
right plot shows that there is a large difference between the values of MB before and
after extinction correction. If there was no correction for extinction all data points
would fall on a linear relation. This is however not the case: 67% of SNe Ia from S-F
galaxies are affected by detectable amounts of host galaxy extinction. The average
E(B−V ) of all SNe Ia from S-F host galaxies is 0.130± 0.023 mag. In contrast, only
43% of the SNe Ia from passive galaxies are affected by detectable amounts of host
galaxy extinction, as would be expected due to the lack of dust in early-type galaxies.
Their mean E(B − V ) = 0.040± 0.013 mag. Therefore on average SNe from passive
galaxies have almost negligible host galaxy extinction. The average change in absolute
B magnitude for SNe Ia from S-F galaxies is 0.50 mag, compared to 0.15 mag for SNe
from passive galaxies.
2.6.1 Luminosity Distribution
The top left panel of Figure 2.9 shows the MB distribution of the SNe after correction
for host galaxy extinction. The distribution has mean MB = −19.09 ± 0.06 mag and
a standard deviation σ(MB) = 0.62 mag. The LD consists of a ‘normal’ distribution
of SNe Ia and of a sub-luminous ‘tail’ comprising faster declining SNe Ia. A similar
result is found in the V -band (Figure 7, lower left), where the distribution has mean
MV = −19.10±0.05 mag and σ(MV ) = 0.52 mag. From Figure 2.9 it is apparent that
when corrected for extinction ‘normal’ SNe Ia lie within the range−20 > MB > −18,
and similarly for MV .
2.6.2 Host galaxy extinction
The right hand side of Figure 2.9 shows the distribution of decline rates. In theB band,
the distribution has a mean ∆m15(B) = 1.12 ± 0.03 mag and a standard deviation of
0.32. A bimodal distribution is still visible in ∆m15(B) showing a lack of ‘transi-

CHAPTER 2. LUMINOSITY DISTRIBUTIONS OF SNE IA 66
20 19 18 17 16MB
0
5
10
15
20
25
Num
ber
nocor
cor
212019181716MB no correction for host extinction
21
20
19
18
17
16MB c
orr
ect
ion f
or
host
exti
nct
ion
20 19 18 17 16MB
0
1
2
3
4
5
Num
ber
nocor
cor
212019181716MB no correction for host extinction
21
20
19
18
17
16MB co
rrect
ion f
or
host
exti
nct
ion
Figure 2.8: Top: Left: The MB LD of the SN Ia from S-F galaxies, before and after correc-tion for extinction. Right: compares the values of MB , again before and after correction forextinction, for SNe from S-F galaxies. Bottom: Left: The MB LD of the SNe Ia from passivegalaxies, before and after correction for extinction. Right: MB , before and after correction forextinction, for SNe from passive galaxies.

CHAPTER 2. LUMINOSITY DISTRIBUTIONS OF SNE IA 67
20 19 18 17 16MB
0
5
10
15
20
Num
ber
0.5 1.0 1.5 2.0∆M(B)15
0
5
10
15
20
Num
ber
20 19 18 17 16MV
0
5
10
15
20
25
Num
ber
0.0 0.5 1.0 1.5∆M(V)15
48
121620242832
Num
ber
Figure 2.9: Top: B-band luminosity distribution, corrected for host galaxy extinction. The binsizes are 0.15 and 0.1 mag for the MB and ∆m15(B) plots respectively. Bottom: V -bandluminosity distribution, corrected for host galaxy extinction. The bin sizes are 0.15 and 0.1mag for the MV and ∆m15(V ) plots respectively. The stars in the right hand panel are theGaussians calculated from the GMM tests.

CHAPTER 2. LUMINOSITY DISTRIBUTIONS OF SNE IA 68
tional’ objects. The gaussian mix modelling test was run on the ∆m15(B) now it has
been corrected for extinction. The likelihood that this sample came from a unimodal
distribution was less then 0.1%. A bimodal distribution is preferred. One which takes
the form of two Gaussians. The first with a mean of 1.020±0.022, a σ = 0.204±0.032
and contains 93±11.2 SNe Ia. The second distribution has a mean of 1.727±0.125, a
σ = 0.108±0.064 and contains 16±11.2 SNe Ia. In the V band it was found that there
is an 11% chance that the sample came from a unimodal distribution. Therefore, there
is no evidence that it is bimodal. If there were two gaussian distributions that formed
the set, the first would have a mean of 0.624±0.013, a σ = 0.115±0.019 and contain
91±16.3 SNe Ia. The second would have a mean of 1.037±0.221, a σ = 0.162±0.081
and contain 18±16.3 SNe Ia.
Table 2.5 contains the statistics of the SNe Ia sample when corrected for extinction.
2.6.3 LD by host galaxy type
The SNe were separated by host galaxy type, as discussed in Section 4.3. Figure
2.10 shows the luminosity distributions of SNe Ia separated by host galaxy type, af-
ter correction for extinction. In the B-band, SNe from S-F galaxies have MB =
−19.20± 0.05 mag, while SNe from passive galaxies have MB = −18.57± 0.24 mag,
which is 0.63±0.24 mag dimmer. In the V -band, SNe Ia from S-F galaxies have MV =
−19.19± 0.05 mag, while SNe from passive galaxies have MV = −18.71± 0.18 mag.
The difference in V -band average absolute magnitude is 0.48 ± 0.24 mag. Faster de-
clining SNe tend to favour passive galaxies, which is expected as sub-luminous SNe
tend to favour old stellar populations (Howell, 2001). The mean ∆m15(B) for SNe
from passive galaxies is 1.29 ± 0.10 mag, compared to 1.10 ± 0.03 mag for SNe Ia
from S-F galaxies. In Figure 2.10 it is aparent that some of the less luminous SNe Ia
are brighter in the V band than the B band. This is not an effect of binning the data.

CHAPTER 2. LUMINOSITY DISTRIBUTIONS OF SNE IA 69
Figure 2.10: SNe Ia separated by host galaxy type, after correction for host galaxy extinction.Blue shows SNe Ia from S-F galaxies and green is SNe Ia from passive galaxies.
It is infact due to sumluminous SNe Ia being instrinsically dimmer and cooler than
normal SNe Ia, and therefore peak in the V band. This is effect is seen at magnitudes
dimmer than MB less than –18 mag, see Figure 2.11.
K-S tests were run on the distributions from each host galaxy, see Table 5. The
probability that the MB samples come from the same parent distribution is less than
0.1%. There is marginal evidence for a difference between the ∆m15(B) distributions,
with a 12% probability that they came from the same parent sample. When these tests
were run on the V -band, it was found that the MV distributions had less than a 0.4%

CHAPTER 2. LUMINOSITY DISTRIBUTIONS OF SNE IA 70
21 20 19 18 17 16MB
21
20
19
18
17
16
MV
Figure 2.11: MB vs MV for all SNe Ia in the sample.
probability of coming from the same parent distribution. The cumulative probability
distributions of the samples used in the K-S tests can be found in Figure 2.12.
The mean colour term for SNe Ia, after correction for host galaxy extinction, is
−0.008 ± 0.013 mag. SNe Ia from S-F galaxies have an average (B − V )Bmax =
−0.025 ± 0.010 mag. This is 0.12 ± 0.06 mag bluer than for SNe Ia from passive
galaxies, which have an average colour term of 0.095±0.060 mag. This demonstrates
that SNe Ia from S-F galaxies are intrinsically bluer than those from passive galaxies.
2.6.4 WLR after extinction correction
Figure 2.13 shows the WLR of the SNe Ia in the sample after correction for host
galaxy extinction. There is a larger intrinsic scatter in this WLR compared to when
only SNe with (B − V )Bmax < 0.01 mag are used. This indicates that the parame-
ter space that SNe Ia can fill is much larger than originally thought. This is the result
of the breaking of the colour/extinction degeneracy by the method of Sasdelli et al.
(2016). The bulk of ‘normal’ SNe Ia lie in a MB range of ∼1.5 mag, rather than show-
ing a tight correlation between LC shape and absolute magnitude. Among SNe with

CHAPTER 2. LUMINOSITY DISTRIBUTIONS OF SNE IA 71
20191817MB
0.0
0.2
0.4
0.6
0.8
1.0
cum
ula
tive p
robabili
ty
17 18 19 20MV
0.0
0.2
0.4
0.6
0.8
1.0
cum
ula
tive p
robabili
ty
0.5 0.9 1.3 1.7∆M(B)15
0.0
0.2
0.4
0.6
0.8
1.0
cum
ula
tive p
robabili
ty
Figure 2.12: The cumulative probability distributions for the samples used in the K-S test.The green solid lines are SNe from passive galaxies, and the blue dashed from SNe from S-Fgalaxies.

CHAPTER 2. LUMINOSITY DISTRIBUTIONS OF SNE IA 72
Table 2.4: Statistics of data before correction for host galaxy extinction.The data used in this table are a subset of the full sample.
All S-F Passive E S0Amount of SNe 109 89 16 11 5
MB –18.66 ±0.07 –18.70 ±0.08 –18.42 ±0.23 –18.48 ±0.28 –18.29 ±0.43σMB 0.74 0.71 0.94 0.92 0.97
medianMB –18.85 ±0.09 –18.88 ±0.09 –18.80 ±0.29 –18.81 ±0.35 –18.71±0.54∆m15B 1.11 ±0.03 1.08 ±0.03 1.29 ±0.10 1.24 ±0.13 1.40±0.13σ∆m15B 0.32 0.29 0.39 0.42 0.30(B − V ) 0.097 ±0.022 0.095 ±0.025 0.132 ±0.062 0.104 ±0.070 0.193 ±0.118σ(B − V ) 0.233 0.233 0.247 0.234 0.263
median(B − V ) 0.040 ±0.03 0.040 ±0.03 0.039 ±0.08 0.030 ±0.09 0.077 ±0.15MV –18.77 ±0.05 –18.81 ±0.06 –18.60 ±0.17 –18.63 ±0.20 –18.53±0.31σMV 0.55 0.52 0.68 0.68 0.68
median MV –18.88 ±0.07 –18.90 ±0.07 –18.83 ±0.21 –18.86 ±0.26 –18.74±0.38∆m15V 0.67 ±0.02 0.65 ±0.02 0.80 ±0.06 0.79 ±0.09 0.82±0.08σ∆m15V 0.19 0.16 0.26 0.29 0.17
∆m15(B) >1.6 mag, the sub-luminous tail dominates. This is where transitional SNe,
with 1.6< ∆m15(B) <1.8 mag, and subluminous SNe Ia, with ∆m15(B) >1.8 mag,
are. These SNe Ia are far more diverse in properties than “normal” ones. In Figure 2.13
the highlighted green mark located well above the WLR is SN 2003cg. This is the SN
with the largest extinction, E(B − V )=1.026 mag. Elias-Rosa et al. (2006) find that
SN 2003cg has an anomalous extinction with Rv = 1.80±0.19 mag. SNe with very
high extinction may require a different reddening law, but this is the only case in our
sample for which this occurs. For more information on highly extinguished objects see
Sasdelli et al. (2016).
2.7 Full luminosity distribution
It is apparent that SNe Ia from passive galaxies suffer only from negligibly from host
galaxy extinction, with 57% of SNe Ia from passive galaxies having no detectable host
galaxy extinction. The mean E(B − V ) for SNe Ia from passive galaxies is 0.04 ±
0.013 mag. In this section the sample of 105 SNe Ia which could be corrected for

CHAPTER 2. LUMINOSITY DISTRIBUTIONS OF SNE IA 73
Table 2.5: Statistics of the data after correction for host galaxy extinction.
All S-F Passive E S0Amount of SNe 109 89 16 11 5
MB –19.09 ±0.06 –19.20 ±0.05 –18.57 ±0.24 –18.58 ±0.27 –18.56 ±0.47σMB 0.62 0.49 0.96 0.91 1.05
medianMB –19.22 ±0.07 –19.27 ±0.07 –18.80 ±0.30 –18.81 ±0.34 –18.73±0.59∆m15B 1.12 ±0.03 1.10 ±0.03 1.29 ±0.10 1.24 ±0.13 1.41 ±0.13σ∆m15B 0.32 0.29 0.39 0.42 0.30(B − V ) –0.008 ±0.013 –0.025 ±0.010 0.095 ±0.060 0.079 ±0.067 0.129 ±0.119(B − V ) 0.135 0.097 0.239 0.223 0.266
median(B − V ) –0.029 ±0.02 –0.034 ±0.01 –0.007 ±0.07 –0.019 ±0.08 0.004±0.15MV –19.10 ±0.05 –19.19 ±0.05 –18.71 ±0.18 –18.71 ±0.20 –18.73 ±0.34σMV 0.52 0.45 0.70 0.68 0.76
median MV –19.17 ±0.06 –19.23 ±0.06 –18.83 ±0.22 –18.86±0.26 –18.75±0.43∆m15V 0.67 ±0.02 0.65 ±0.02 0.80 ±0.07 0.79 ±0.087 0.82±0.08σ∆m15V 0.19 0.16 0.26 0.29 0.17E(B − V ) 0.114 ±0.019 0.130 ±0.023 0.040 ±0.013 0.026 ±0.013 0.070 ±0.026σE(B − V ) 0.20 0.21 0.05 0.04 0.06
Table 2.6: K-S tests for SNe with different types of host galaxies, after correction for hostgalaxy extinction.
Compared distributions Value used P valueSNe S-F vs SNe passive M(B) 0.001SNe S-F vs SNe passive ∆M(B)15 0.118SNe S-F vs SNe passive MV 0.004

CHAPTER 2. LUMINOSITY DISTRIBUTIONS OF SNE IA 74
Figure 2.13: The WLR corrected for host galaxy extinction. The black points are SNe fromS-F galaxies, the blue are points are SNe from elliptical galaxies and the red points are SNe Iafrom S0 galaxies. The green point is SN2003cg. Top: B-band Bottom: V -band
host galaxy extinction are used, and the 10 SNe Ia from passive galaxies for which
host galaxy extinction could not be derived are added back into the sample. This is
done to avoid small sample statistics. It is justified because it is reasonable to assume
that the SNe in passive galaxies have very little host extinction3. The new sample
sizes comprises then 115 SNe, of which 89 are from S-F galaxies and 26 from passive
galaxies. Figure 2.14 is the final SN Ia luminosity distribution. The mean absolute
magnitudes of the full sample are MB = −19.04 ± 0.07 mag and MV = −19.07 ±
0.06 mag. Figure 2.15 shows the final SNe Ia ∆m15 distributions.
Figure 2.14 is the LD plot of the SNe Ia, divided by host galaxy type. It can be
assumed that at least three different populations of SNe Ia are present in these plots:
a normal population of SNe Ia from S-F galaxies, which dominates the population of
3 The one exception is SN 1986G which was corrected for extinction of E(B − V )=0.65 mag (Nugentet al., 1995; Ashall et al., 2016). SNe 1986G is from an S0 galaxy, but sits in the dust lane in NGC5128.

CHAPTER 2. LUMINOSITY DISTRIBUTIONS OF SNE IA 75
Table 2.7: Statistics of full LD.
All S-F passiveAmount of SNe 115 89 26
MB –19.04 ±0.07 –19.20 ±0.05 –18.48 ±0.19σMB 0.70 0.49 0.98
medianMB –19.20 ±0.08 –19.27 ±0.07 –18.68 ±0.24MV –19.07 ±0.06 –19.19 ±0.05 –18.67 ±0.14σMV 0.57 0.45 0.72
medianMV –19.16 ±0.07 –19.24 ±0.06 –18.78 ±0.18MB
a –19.19 ±0.04 –19.24 ±0.04 –18.94 ±0.11σMB 0.43 0.40 0.47
medianMB –19.23 ±0.05 –19.27 ±0.05 –18.80 ±0.13MV
b –19.16 ±0.04 –19.22 ±0.04 –18.94 ±0.10σMV 0.43 0.41 0.46
medianMV –19.19 ±0.05 –19.25 ±0.06 –18.86 ±0.12
a MB < −18 magb MV < −18 mag
normal SNe, a normal population of SNe Ia from passive galaxies, and a subluminous
population, which is dominated by SNe in passive galaxies. The numbers of sublu-
minous SNe in S-F galaxies are too small to determine whether their population has
different properties with respect to that in passive galaxies.
The shape of the LD depends strongly on host type. The LDs of SNe Ia in S-F
galaxies have Gaussian shapes, with mean magnitudes MB = −19.20±0.05 mag and
MV = −19.19± 0.05 mag and standard deviations of 0.49 and 0.45 mag, respectively.
In passive galaxies the SN Ia LD is much wider: the mean magnitudes are MB =
−18.48±0.19= mag and MV = −18.67±0.14 mag, with standard deviations 0.72 mag
and 0.98 mag respectively.
To compare the distributions of ‘normal’ SNe Ia from the two different host galaxy
types the subluminous SNe Ia must be excluded. This is done by removing any SNe Ia
with MB and MV > −18.0 mag. These values are obtained by visual inspection of
the plots. It should be noted that the cut off is applied in terms of absolute magnitude

CHAPTER 2. LUMINOSITY DISTRIBUTIONS OF SNE IA 76
rather than decline rate, as fast declining SNe Ia can be both intrinsically bright and
intrinsically dim (Figure 2.13). If the 56Ni is located further out in ejecta it can cause
the SN Ia LC to be bright and fast.
When the subluminous population is removed, the distributions change. S-F galax-
ies have MB = −19.24±0.04 mag and MV = −19.22±0.05 mag, with median val-
ues MB = −19.27±0.05 mag and MV = −19.25±0.06 mag. For passive galaxies,
MB = −18.94 ± 0.11 mag, MV = −18.94±0.10 mag, with median values MB =
−18.80± 0.13 mag and MV = −18.86± 0.12 mag.
The photometric distributions of ‘normal’ SNe Ia depends on host galaxy types.
The differences between the mean values of MB and MV , in S-F and passive galax-
ies, are 0.30±0.11 mag and 0.28±0.11 mag respectively, and are 0.47±0.14 mag and
0.39±0.13 mag in the median values. These two separate distributions lead us to the
conclusion that within the ‘normal’ SNe Ia population, intrinsically dimmer SNe Ia are
more common from older stellar populations, confirming previous results (e.g. Sullivan
et al., 2006).
2.8 SNe Ia from young and old stellar populations
SNe Ia are thought to come from both young (< 400Myr) and old (> 2.4Gyr) stellar
populations (Brandt et al., 2010). Traditionally, faster declining SNe Ia are thought
to come from old stellar populations, and slower declining SNe Ia from young stellar
systems. In section 2.7 it has been stated that there are at least 3 populations of SNe Ia,
‘normal’ SNe from S-F, ‘normal’ SNe from passive galaxies and subluminous SNe.
As passive galaxies predominantly consist of old stars, it can be concluded that some
of the ‘normal’ SNe Ia must originate from old stellar systems. On the other hand, S-F
galaxies consist of both young and old stellar populations. Therefore they must contain

CHAPTER 2. LUMINOSITY DISTRIBUTIONS OF SNE IA 77
Figure 2.14: The final MB and MV luminosity distribution plots for the sample used in thiswork. SNe Ia from passive galaxies with no known extinction have been re-added to this distri-bution to increase the sample size. Top: The left plot is the fullMB luminosity distribution, theright plot is the full MV luminosity distribution. The overlaid blue histograms are the distribu-tions of SNe from passive galaxies. Bottom: The left plot is the fullMB luminosity distributionseparated by host galaxy type, and the right plot is the full MV distribution separated by hostgalaxy type.

CHAPTER 2. LUMINOSITY DISTRIBUTIONS OF SNE IA 78
Figure 2.15: The final ∆m15(B) and ∆m15(V ) LD plots for the sample used in this work.SNe Ia from passive galaxies with no known extinction have been re-added to this distributionto increase the sample size. Top: The left plot is the full ∆m15(B) LD, the right plot is thefull ∆M15(V ) LD. The overlaid blue histograms are the distributions of SNe from passivegalaxies. Bottom: The left plot is the full ∆m15(B) LD separated by host galaxy type, and theright plot is the full ∆m15(V ) distribution separated by host galaxy type.

CHAPTER 2. LUMINOSITY DISTRIBUTIONS OF SNE IA 79
SNe from both groups. In this section the fraction of SNe Ia from S-F galaxies which
are produced from old stellar populations are quantified. From this the LD of SNe Ia
from young stellar populations is produced.
The normalised LDs shown in Figure 2.14 are used to determine the fraction of
SNe Ia from young/old stellar populations. This is done by scaling the LD from pas-
sive galaxies and subtracting this distribution from SNe from S-F galaxies. It is known
that SNe Ia with MB > −18 mag are mostly from older stellar populations, so only
SNe Ia with MB < −18 mag are examined. Both LDs were divided into 20 bins with
similar size (0.2 mag); so that the LDs can be scaled and subtract from one another.
The passive LD are scaled to 10%, 20%, 30% and 40% with respect to the S-F LD and
subtracted it. The assumption is that the sample of passive SNe Ia is a fair representa-
tion of the intrinsic sample, i.e. that SNe from passive environments in S-F galaxies
have the same properties as SNe from passive galaxies. The scaled and subtracted S-F
LDs are shown in Figure 2.16, which shows that if the passive-like component exceeds
20 per cent of the total the subtraction is unrealistic as more than 50% of the bins are
negative. Therefore, in the B-band a value of (15 ± 10)% is selected as the optimum
scaling value to use in the LD subtractions, which suggests that this is the fraction of
‘normal’ SNe Ia in S-F galaxies which are from old stellar populations. The LD when
a scaling factor of 15% is used is shown in the bottom right panel in Figure 2.16, where
the “passive” component is also shown. In the remaining plots of Figure 2.16, the re-
sult of the subtraction are presented, i.e. the “young” component. The LD of SNe Ia
from young stellar systems is narrower than that of the whole sample. This effect is
seen in both the B and V bands. Figure 2.17 shows the V -band scaled and subtracted
LDs. The V -band results also suggest that (15 ± 10)% of ‘normal’ SNe Ia from S-
F galaxies are from old stellar populations. The bottom right panel in Figure 2.17
presents the V -band LD when a scaling factor of 15% is chosen. The blue bars over-

CHAPTER 2. LUMINOSITY DISTRIBUTIONS OF SNE IA 80
laid in this plot show the LD of SNe Ia from passive galaxies scaled to 15%. Therefore
it is concluded that there are photometrically 4 populations of SNe Ia: ‘normal’ ones
from S-F galaxies that come from young stellar systems, ‘normal’ SNe Ia from passive
galaxies, which come from an old population, ‘normal’ SNe Ia from S-F galaxies that
come from an old population, and subluminous SNe, which are thought to come from
old stellar systems.
If it is assumed that the sample is complete, and MB < −18 mag is used as the cut
off between subluminous and normal SNe Ia, the frequency of SNe Ia in our sample
can be quantified. Out of the 115 SNe Ia in Figure 2.14, 8 (7%) are subluminous. This
leaves 107 SNe Ia, of which 20 are ‘normal’ SNe Ia from passive galaxies (from an
old population), and 16 are ‘normal’ SNe Ia from S-F galaxies and which come from
an old population. Therefore, 32 (28%) of all SNe Ia are normal and come from an
old population, and 75 (65%) of SNe Ia are normal and come from a young stellar
population.
2.9 Discussion
The aim of this work was to explore the diversity of SN Ia LCs. Therefore, luminosity
distributions were built using as few prior assumptions as possible. The analysis does
not relied on any empirical LC fitting method, and used distances to the SNe derived
from independent methods. The mean values of ∆M15(B/V ) and MB/V were used in
the analysis as this is a good way to highlight outliers, which make up a small fraction
of the overall population. The analysis is presented both before and after applying a
correction for host galaxy extinction. Deriving the host galaxy extinction of SNe Ia is
a difficult task as it requires resolving the degeneracy between colour and extinction.
Although the method used for calculating the host galaxy extinction can resolve the

CHAPTER 2. LUMINOSITY DISTRIBUTIONS OF SNE IA 81
Figure 2.16: The B-band LD for SNe Ia from passive galaxies normalized, scaled and sub-tracted from the LD of SNe Ia from S-F galaxies. The factor by which the LD from passivegalaxies has been normalized is presented on the top of each plot. The blue bars in the bot-tom right panel are the LD of SNe Ia from passive galaxies scaled to 15% of those from activegalaxies.

CHAPTER 2. LUMINOSITY DISTRIBUTIONS OF SNE IA 82
21 20 19 18 17MV
0.2
0.0
0.2
0.4
0.6
0.8
1.0
Norm
aliz
ed f
ract
ion
0%
21 20 19 18 17MV
0.2
0.0
0.2
0.4
0.6
0.8
1.0
Norm
aliz
ed f
ract
ion
10%
21 20 19 18 17MV
0.2
0.0
0.2
0.4
0.6
0.8
1.0
Norm
aliz
ed f
ract
ion
20%
21 20 19 18 17MV
0.2
0.0
0.2
0.4
0.6
0.8
1.0
Norm
aliz
ed f
ract
ion
30%
21 20 19 18 17MV
0.2
0.0
0.2
0.4
0.6
0.8
1.0
Norm
aliz
ed f
ract
ion
40%
21 20 19 18 17MV
0.2
0.0
0.2
0.4
0.6
0.8
1.0N
orm
aliz
ed f
ract
ion
15%
Figure 2.17: The V -band LD for SNe Ia from passive galaxies normalized, scaled and sub-tracted from the LD of SNe Ia from S-F galaxies. The factor by which the LD from passivegalaxies has been normalized is presented on the top of each plot. The blue bars in the bot-tom right panel are the LD of SNe Ia from passive galaxies scaled to 15% of those from activegalaxies.

CHAPTER 2. LUMINOSITY DISTRIBUTIONS OF SNE IA 83
colour-extinction degeneracy, it does remove the intrinsically unusual SNe, as there are
not enough unreddened spectral matches. Only a subset of the SNe can be corrected for
extinction, and some peculiar SNe may not pass this cut. Therefore, the true diversity
of SNe Ia may be underrepresented in the corrected sample.
Before correction for host galaxy extinction, our sample includes 165 SNe Ia, 134
of which are from S-F galaxies, 26 from passive galaxies and 5 from host galaxies
whose type could not be determined. The average MB and MV for the sample are
−18.58±0.07 mag and −18.72±0.05 mag, respectively. The average ∆m15(B) and
∆m15(V ) values for the sample are 1.14±0.03 mag and 0.68±0.01 mag.
A bimodal distribution in ∆m15(B) (Figure 2.5) is found, with a lack of transi-
tional SNe. Transitional SNe such as 1986G, 2003hv and iPTF13ebh all have unique
properties, and can hold information about potential differences between progenitor
channels of sub-luminous and normal SNe Ia. If it is not a selection effect, the lack of
transitional SNe could suggest that SNe Ia may come from multiple populations, with
different LC properties, which only cross in ∆m15(B) at their extremes.
Correcting the data for host galaxy extinction reduces the sample size to 109
SNe Ia, 89 of which are from S-F galaxies, 16 from passive galaxies and 5 from
host galaxies whose type could not be determined. The smaller sample is compara-
ble to the larger sample in most relevant parameters. SNe Ia from S-F galaxies suf-
fer from much larger host extinction than those from passive galaxies: 67% of the
SNe Ia from S-F galaxies are affected by detectable host galaxy extinction, whose
the average value is E(B − V )=0.130±0.023 mag. In contrast, only 43% of the
SNe Ia from passive galaxies are affected by detectable extinction, with averageE(B−
V ) = 0.04±0.013 mag. When corrected for host galaxy extinction, the mean MB=-
19.09±0.06 mag and MV =-19.10±0.05 mag. In theB-band SNe from passive galaxies
were found to be 0.63±0.25 mag less luminous on average than SNe in S-F galaxies.

CHAPTER 2. LUMINOSITY DISTRIBUTIONS OF SNE IA 84
In the V -band, the difference is 0.48±0.19 mag.
The WLR is one of the underlying foundations in SN Ia cosmology. It is driven by
Ni mass, opacity and ejecta mass. A strong correlation between ∆m15(B) and absolute
magnitude is found for normal SNe, when only SNe which have a small observed
colour term are selected. The WLR in this study is similar to that of Phillips et al.
(1999). However, after correcting for host galaxy extinction the spread of properties
increases, as shown in Figure 2.13. Furthermore, correcting for reddening leads to the
removal of some of the more unusual SNe Ia, and so the true parameter space SNe Ia
can fill in the WLR diagram is probably even larger.
K-S tests were run on the sample after correction for extinction. The probability
that MB values for SNe Ia from passive and S-F galaxies come from the same parent
distribution was found to be < 0.1%. In the case of MV the probability is < 0.4%.
The likelihood that the ∆m15(B) samples come from the same parent distributions is
'12%.
SNe Ia in passive galaxies for which the extinction could not be derived were
reintroduced to the extinction-corrected sample. As only 43% of the SNe Ia from
passive galaxies were affected by detectable host galaxy extinction, and this average
extinction was very small, it is assumed that the reintroduced sample has negligible
host extinction. When the final LD is separated by host galaxy type, it is found that
there are three main populations of SNe Ia: ‘normal’ SNe Ia in S-F galaxies, ‘normal’
SNe Ia in passive galaxies and sub-luminous SNe Ia. Normal SNe Ia in S-F galax-
ies were found to have a median MB=–19.27±0.05 mag and MV =–19.25±0.06 mag.
Normal (MB < −18) SNe Ia in passive galaxies have median MB=–18.80±0.13 mag
andMV =–18.86±0.12 mag. The difference hints at differences in properties of normal
SNe Ia depending on host galaxy type, as shown in Figure 2.14. SNe Ia in S-F galaxies
appear to be a much more uniform sample: their distribution is similar to a Gaussian,

CHAPTER 2. LUMINOSITY DISTRIBUTIONS OF SNE IA 85
whereas SNe Ia in passive galaxies appear to be far more diverse.
In the final section of the analysis the LDs for SNe Ia from passive and S-F galax-
ies are normalised. In order to quantify the fraction of ‘normal’ SNe Ia which come
from old stellar systems in S-F galaxies I scaled the LD of SNe Ia from passive galax-
ies to represent different fractions of the full S-F LD and subtracted it from the full
S-F LD. It is found that (15± 10)% of ‘normal’ SNe Ia from S-F galaxies are likely to
come from old stellar systems.
In order fully to explore the range in parameter space that SNe Ia can fill one
would need to obtain a large sample LF, in both redshift and volume, which is out
of the scope of our study. Yasuda & Fukugita (2010) produced a LF, however they
removed any peculiar SNe Ia and did not break the colour-reddening degeneracy. Li et
al. (2011) produced a volume-limited LF, but did not correct for host galaxy extinction.
As transitional objects appear to be rare, a large sample survey would have to
operate continuously for many years to produce a comprehensive LF of SNe Ia. In
the years of LSST and large high cadence surveys, along with robotic telescopes on
multiple sites (LCOGT), this will be possible. It will then be possible to know the
variance of SN Ia properties and place tighter constraints on the progenitor systems.
2.9.1 Errors and significance of results.
Through out this chapter the errors on the values of MB and MV were calculated by
propagating the errors on the distance, host galaxy extinction and photometry. This
was done using the following equation:
errMB/V =√errE(B − V )2 + (errB/V )2 + errdist2 (2.3)
where B/V changes depending on which filter band you are using. Where

CHAPTER 2. LUMINOSITY DISTRIBUTIONS OF SNE IA 86
errdist2 ≈ (5 errdd ln(10)
)2, the error on the distance is errd, the error on the photometry is
B or V and the error on the extinction is errE(B − V ).
In this chapter a number of comparisons are made between SNe Ia from different
host galaxy types. Most noticeably that SNe Ia from passive galaxies suffer from
significantly less extinction that those from S-F galaxies, and that SNe Ia from S-F
and passive galaxies are distinct. Although, it is apparent from the plots that this is
true, the significance of these results should be discussed. In astrophysics it is normal
to use standard deviation to compare if samples are different. In this chapter I have
provided the standard deviations of the samples in the tables. As most of the analysis
in the chapter uses the mean, errors next to values in the text are given as the standard
errors on the mean. The fact that SNe Ia from S-F galaxies on average suffer from
significantly more host galaxy extinction than those from passive galaxies is a three
standard errors result. However, this fact is not only based on knowledge from the data
in this paper. It is commonly accepted that passive galaxies produce far less dust than
S-F galaxies. Therefore it is also a physically sensible result.
Although, some of the results in this chapter are not at the 5 sigma level they are
still worth discussing. It is known that SNe Ia are very similar therefore any differences
would not be expected to be at this level. Furthermore, two distributions which come
from physically different channels but sit in a similar area of parameter space would
not have a difference of 3 or 5 sigma but will merit discussion. With this in mind the
results from this chapter are interesting and deserve scientific discussion.
2.10 Conclusions
This work takes a different approach to normal SN Ia LC analysis. It makes as few
assumptions as possible about the SNe, so two SNe Ia with a similar LC shape can have

CHAPTER 2. LUMINOSITY DISTRIBUTIONS OF SNE IA 87
different properties. This way it is possible to explore the diversity of SNe Ia. SNe Ia
are studied by first independently obtaining the distance to each one then calculating
its properties, MB, ∆m15(B), MV and ∆m15(V ). This allowed the parameter space
that SNe Ia can fill to be seen.
Previous results that SNe in passive galaxies tend to decline more rapidly, with an
average ∆m15(B) = 1.29± 0.08 mag, compared to ∆m15(B) = 1.11± 0.03 mag for
SNe in S-F galaxies, are confirmed. This is partly due to the presence of sub-luminous
SNe Ia, which are mostly found in older stellar populations. Our method confirms that
SNe with small observed (B−V )Bmax < 0.01 mag follow the WLR, with some scatter.
However, when a larger sample of SNe are corrected for host galaxy extinction the
scatter in the WLR increases. It is found that the range in MB of normal SNe Ia in the
WLR is ∼1.5 mag. This suggests that (intrinsically) SNe Ia can fill a large parameter
space on the WLR. The distribution in ∆m15(B) was found to be bimodal, with a
lack of transitional SNe. More data from transitional SNe can hold the key to fully
understanding the explosion mechanisms of the faint end of the ‘normal’ SNe on the
WLR.
There is evidence for differences in parameters for SNe Ia from different host
galaxies. SNe Ia in passive galaxies are more likely to be peculiar than those in
S-F galaxies. These peculiarities could be central in the debate on different pro-
genitor systems or populations. It is found that there are three main populations of
SNe Ia: normal SNe Ia in S-F galaxies, normal SNe Ia in passive galaxies and sub-
luminous SNe Ia. Normal (MV < −18mag) SNe from passive galaxies have a median
MV =–18.86±0.12 mag, while those from S-F galaxies have a median
MV =–19.25±0.06 mag. Finally, it is found that (15 ± 10)% of ‘normal’ SNe Ia from
S-F galaxies are likely to come from old stellar systems.
SNe Ia are, although “standardisable”, not an extremely homogeneous group of

CHAPTER 2. LUMINOSITY DISTRIBUTIONS OF SNE IA 88
objects. There are unusual events which could possibly result from diverse progenitor
scenarios. Previous results that sub-luminous SNe favour passive galaxies were con-
firmed, and the questions about the nature of ‘normal’ SNe Ia from passive galaxies
ere raised. The key to examining these differences further could be through finding a
convincing method to calculate host galaxy extinction on unusual SNe Ia, and with this
it will be possible to put tighter constraints on the parameter space SNe Ia can fill.

3. How to model a SN
3.1 Preface
In astrophysics advances are often made when data have been discovered that seems
unusual or intriguing, and theoretical models are produced to explain these observa-
tions. These models are often developed and adapted in order to explain the diversity
of what is observed. Radiative transfer models simulate the propagation of photons in
a medium, and predict the radiation which should occur from the theoretical models. If
this prediction matches the observations it is said that the theory is correct. Therefore
radiative transfer modelling is a very important part of astrophysics, as it can couple
the theory and observations.
This section will give an overview on the basics of radiative transfer and how to
model a SN. For a full detailed understanding of the theory and the code used here see
Mihalas (1978); Mazzali & Lucy (1993); Lucy (1999); Mazzali (2000); Stehle et al.
(2005).
3.2 Radiative Transfer Theory
Specific intensity, Iv(~r, n, t), is one of the fundamental quantities in all problems in-
volving radiation. It is defined at a position ~r travelling in a direction n at time t, as the
89

CHAPTER 3. RADIATIVE TRANSFER 90
amount of energy dE, per unit frequency interval dv, passing though a unit area dA
oriented normal to the beam, into a solid angle dΩ, in a time interval between t and t
+dt:
dE = Iv(r, n, t) dA cos θ dv dΩ dt (3.1)
The angle between the normal of the reference surface dA and the direction n is
denoted as θ.
Spectral features are the imprint matter leaves on a beam of radiation. There are
two ways radiation can interact with matter, by absorption or emission. The emission
coefficient jv describes the emission of radiation, whereas the absorption coefficient
kv = κv + σv (3.2)
gives the loss of radiation due to absorption, kv, and scattering out of the beam, σv,
and hence is a measure of the overall attenuation of the radiation. The radiative transfer
equation for radiation of frequency v, can be obtained by combining the changes in
intensity of a radiation beam along the path ds:
∂Iv(~r, n)
∂s= −kvIv + jv (3.3)
It can be seen from this equation that the coefficients depend on the frequency v
as well as the state of the material, such as the temperature, pressure or composition of
the material. If the beam passes through a non-emitting layer (jv=0), the intensity after
passing though the traversing layer of thickness s is related to the incident radiation
by:
Iv = Iv,0 e−τv (3.4)

CHAPTER 3. RADIATIVE TRANSFER 91
where τv is the, dimensionless, optical depth of the transmitting layer:
τv =
∫ s
0
kvds (3.5)
Using the optical depth the radiation transfer equation can be written as :
∂Iv(~r, n)
∂τv= −Iv +
jvkv
= −Iv + Sv (3.6)
where Sv is the source function, which is the ratio of emission to absorption co-
efficients. If an atmosphere is in thermodynamic equilibrium the source function is a
universal function of v which depends only on the local temperature T. In this case it
can be described by a blackbody function:
Sv = Bv(T ) =2hv3
c2
1
ehvkT − 1
(3.7)
In a purely scattering atmosphere the source function becomes equal to the mean
intensity Jv, which is the intensity integrated over all incident directions.
Jv(~r) =1
4π
∮Iv(~r, n)dΩ (3.8)
In this case the source function depends on the distant point where the radiation
was originally emitted, and not the local temperature. Even in a purely scattering
envelope the equation couples different directions n together and becomes a nonlocal
problem. Generally, both Sv and τv depend on Iv in a complicated way, including
knowledge about the excitation and ionisation state of the gas. The radiative transfer
equation is coupled to the equations of statistical equilibrium (Mihalas, 1978).

CHAPTER 3. RADIATIVE TRANSFER 92
3.3 Radiative Transfer in SN ejecta
This section will describe the basics of radiative transfer in SN ejecta, and one way
to numerically solve the problem using a Monte Carlo (MC) approach. For the exact
details of the theory and method of modelling SN one should read Mihalas (1978);
Mazzali & Lucy (1993); Lucy (1999); Mazzali (2000); Stehle et al. (2005).
At early times a SN is in the ‘photospheric’ phase. This is because the ejecta is
dense enough to emit continuum radiation within the ejecta itself. The point at which
the continuum optical depth reaches unity gives rise to an effective photosphere. The
continuum radiation must traverse the fraction of the envelope above the photosphere,
and interact with the expanding gas. This is where the early time SN spectra are
formed. This justifies using the Sucher-Schwarzschild approximation, and makes it
sensible to only calculate the radiative transfer above a predefined photosphere, which
in the case of a SN can be a black body. (At early times a SNe Ia’s photosphere can
be idealised as an infinitely thin layer, above which no continuum is formed. In the
case of SNe Ia, continuum opacities are small compared to the effects of line blanket-
ing. Therefore, the photosphere we talk about with respect to SNe Ia is actually a line
dominated pseudo photosphere.)
A SN can be thought of as a spherical homologous expansion, where the radius
and velocity of the ejecta is proportional to the expansion velocity of the ejecta as a
fixed time from explosion: r = v × texp, where r is the radius, v is the photospheric
velocity and texp is the time from explosion. This also means the density at a co-moving
point scales with t3exp. A density structure is required to carry out a radiative transfer
calculation. The density of a SNe Ia is normally very steep, and for the purpose of
this work for now it can be assumed that the W7 density profile (Nomoto et al., 1984)
was used, unless it is stated otherwise. This template density profile, which can be
expressed as a function of velocity ρ(v), can be rescaled to different epochs, because

CHAPTER 3. RADIATIVE TRANSFER 93
of the homologous expansion. Once the density has been determined the ejecta can be
split into 10-20 shells in which the radiation transport calculations can take place.
Due to the large velocity gradient in a SN ejecta a single photon can interact with
many spectral lines, due to the progressive redshift of the photons in the co-moving
frame, as the photon scatters in the differentially expanding envelope. This Doppler
overlapping makes a connection between different parts of the SN envelope. In the
UV this line overlapping is so large that it constitutes a source of continuum opacity
known as line blocking.
Furthermore, due to the large velocity gradient in SNe using the Sobolev approx-
imation is justified for SN modelling. The basic idea of the Sobelov approximation is
that a photon emitted from a photosphere only interacts with a line in a small region
of the atmosphere where the photon is Doppler shifted (due to the expansion of the
photosphere) into resonance with the line. Since the source function can be assumed
to be constant over this small resonance region, the solution of the radiative transfer
equation is greatly simplified (Kasen et al., 2002). This means that a photon with a
specific radial position with a specific frequency can only be absorbed by a single line
with which it is in resonance. This is a good approximation as the resonance region
of a line is so small compared to the length scale over which the physical properties
change, due to the large velocities. Therefore a photon packet with rest frequency v
will interact with lines of progressively lower frequency, regardless of its direction of
motion, as v ∝ r.
3.4 MC code
In this section the MC code will be discussed. Using a MC approach to SN radiative
transfer has the advantages thats it is quick and robust and still reasonably accurate.

CHAPTER 3. RADIATIVE TRANSFER 94
Due to the speed of the code it is good for detailed studies of many SN.
One of the assumptions which is made in this code is that the conditions remain
constant during one calculation. The MC code only uses the momentary luminosity
of the SN, which is a result of time-dependent photon diffusion, and does not attempt
to determine the photon diffusion time and photospheric properties. This is valid as-
sumption as the diffusion time through the reversing layer is small.
With a given density, split into shells, the MC procedure can begin. First the tem-
perature must be known before occupation number calculations can be performed. In
the case of a SN, redshifts and backscattering (photon packets re-entering the photo-
sphere and increasing the temperature) cause the radiation to change with radius. To
take this into account a simplified radiation equilibrium equation is adopted.
The mean energy of a photon in a black body radiation field is given by:
x =hv
kT(3.9)
with x=3.832. The radiation temperature is computed after the frequency moment
is obtained from:
v =
∫∞0vJvdv∫∞
0Jvdv
(3.10)
The temperature is obtained by iterating between the occupation numbers and the
radiation field obtained, using the most recent value of TR (radiation temperature) until
convergence in obtained. The electron temperature is defined to be
Te(r) = 0.9TR(r), (3.11)
to simulate approximately the radiative control of the electron temperature. This is
only a crude assumption and the real temperature structure depends on the ionisation
regime. A detailed analysis performed in NLTE and taking into account the physical

CHAPTER 3. RADIATIVE TRANSFER 95
processes coupling the kinetic temperature to the radiation field may be more accurate.
The iteration procedure is started with TR(r) = Teff , where the effective temperature
Teff is given by the photospheric radius Rph and the luminosity is given by
L = 4πR2phσT
4eff (3.12)
The effect of viewing a finite photosphere and of the progressive degradation of
the radiation upon its interaction with the envelope matter is such that J(r) falls below
B(TR(r)). This allows us to compute an equivalent dilution factor (Mihalas, 1978):
J = WB(Teff ) = Wσ
πT 4R. (3.13)
The MC code adopts a purely scattering envelope in terms of interaction with
electrons, and line absorptions are treating in a photon branching scheme. If an electron
is in a excited state u all downward transitions from from u → l are considered. This
is very important for modelling the UV part of a SN spectrum, as most of the flux
here is made via reverse fluorescence. Conversely it is equally as important for making
the optical part of the spectrum, as most of the flux here is made via fluorescence.
This will be discussed further in section 5.6.1. In the code only line transitions and
electron scattering occurs as the Sucher-Schwarzschild approximation is used, and no
continuum formation occurs above the photosphere.
The attenuation of a beam of radiation in the envelope over a distance s is given
by
Iv(s) = Iv(0)exp[−(τe + τL)] (3.14)
where τe is the integrated electron scattering optical depth and τL is the integrated
line optical depth.

CHAPTER 3. RADIATIVE TRANSFER 96
As v ∝ r, dv/dr ≡ v/r. Therefore, the optical depth of a single line is given by:
τl = κρλr
v, (3.15)
where
κρ =πe2
mecnlfli (3.16)
and e is the electron charge, me is the electron rest mass, nl is the population of
the lower level of the line transition, and flu is the oscillator strength of the transition.
3.5 Ionization and excitation
The ionization and excitation of the envelope of gas is required to compute the line
optical depths. Usually this would mean solving simultaneously the coupled equations
of statistical equilibrium and radiative transfer. However, for none minor species this is
computationally expensive and would require a large number of photoionization rates
and an iteration process between radiation field and occupation number.1 The code
used for this project uses a modified nebular approximation to treat ionization and
excitation. This nebular approximation has the advantage that it can be computed at
almost LTE cost. The basic idea of this is to fit the actual radiation field, Jv, with a
function including two fit parameters W (equivalent dilution factor) and TR (radiation
temperature). A subset of levels for each atom is then considered, either metastable
states which are connected to the ground state (via higher lying transitions), or normal
states which are connected to the ground state or meta stable state via a single permitted
transition. Approximating the system of the ground state 1 and a normal excited state
1 The MC code can do this for H and He, however these are not needed in this project and will not bediscussed further.

CHAPTER 3. RADIATIVE TRANSFER 97
as a two level atom, and neglecting stimulated emission as well as collisional processes,
the occupation number for normal excited states u can be obtained:
nun1
= W × gug1
e−hv1u/kBTR (3.17)
and for the metastable states m one calculates, considering an appropriate three
level atom:
nmn1
= W × gmg1
e−hv1m/kBTR (3.18)
which equals an LTE excitation pattern at TR.
Ionisation can be calculated by an equation similar to the Saha-Boltzman equation.
A basic form of this can be derived assuming a diluted blackbody radiation field and a
negligible influence of collisions. The nebular ionisation approximation which is used
in this version of the code is:
nen1,j+1
n1,j
=2g1,j+1
g1,j
×Wζ
(δ +W
(1
ζ− 1
))×√TeTR×(
2πmkTRh2
)3/2
× e−hvT(1j)kBTR
(3.19)
The factor ζ(δ +W
(1ζ− 1)
)has been added here compared to Mihalas (1978)
in order to account for ionisation from the recombination to excited states, and for a
modified field at UV wavelengths. For further details see Mazzali et al. (1993).
3.6 Numerical technique
As the basic physics in the code has been described above, the numerical technique and
code itself will now be explained. The code requires as input, the time from explosion
texp, the photospheric velocity vph, the bolometric (emergent) luminosity L, as well as

CHAPTER 3. RADIATIVE TRANSFER 98
the chemical composition of the ejecta. The code divides the SN ejecta into a number
of shells, between 15-20, whose thickness increases as a function of radius.
The code makes use of an extensive line list of 500 000 lines. From this line list
a set of lines are selected during the first temperature iteration. The lines selected de-
pend on the abundances and the temperature in the SN ejecta. After the main lines are
determined the temperature structure can be calculated, as described above. This is
done by running through a series of MC experiments, until convergence to the appro-
priate radiative equilibrium is reached. It should be noted that both TB and TR(r) are
calculated with this method. After interactions with lines and electrons, photons can
re-enter the photosphere, in a process called back warming. This can cause the TB to
be higher than Teff , as TB has to be large enough to match the required input luminos-
ity. Furthermore, it leads to an increased temperature gradient immediately above the
photosphere.
3.6.1 Photon branching
An important part of the MC code is the inclusion of photon branching. Photon branch-
ing allows photon packet emitted through downward transitions to make big jumps in
wavelength . All permitted decays are allowed and given a weighting, the most likely
of these decays is then selected. This means that photons do not have to be re-emitted
at the same frequency that they are absorbed, meaning they can make large jumps. As
lines are the main source of opacity in a SN envelope, they can effectively block regions
of the spectrum. This is known as line blocking. Line blocking is especially strong in
the UV part of a SN spectra, where there are so many lines are various velocities they
act as a source of opacity and no photons emitted from the photosphere can escape.
Photons can only escape if they reach a line free region. The next available window
is always the next one to the red, in the co-moving frequency of the photon. To reach

CHAPTER 3. RADIATIVE TRANSFER 99
this window the photon has to undergo many scattering events, and has a high prob-
ability of reentering the photosphere. However, with branching the photon can make
big jumps in frequency during one single event. The reprocessing of flux from the UV
to the red, and then the escape of the photons, makes the optical part of a SN spectrum.
It should also be noted that to properly model the UV part of a SN spectrum photon
branching is required. This is because photon branching allows reverse fluorescence
to take place, where blue and UV photons are generated by downward decays to low
lying levels in the outer part of the envelope. This means the UV photons are produced
far above the photosphere, and therefore have less ejecta to propagate through before
they escape the envelope. UV photons at the photosphere face too large an optical
depth to be able to escape without first being redshifted to optical wavelengths.
3.6.2 Random walk
Now that the inputs are known, the line list is built and the temperature is determined,
the real MC calculation can take place. The random walk of a number of photon
packets are followed through the SN envelope. The photospheric luminosity is divided
evenly between N packets, so that each packet has the same initial energy ε0 = L/N ,
and each packet contains a number of photons nv where ε = nvhv. Using packets
with the same energy is very useful in a MC simulation, as it leads to good sampling
in the wavelength regime where most of the energy is. It is also very useful in photon
branching where large jumps in frequency can happen but the energy of the packet can
be conserved, as the number of photons in each packet can change.
The frequency of each packet in each bin is assigned randomly from a number
generator, and the direction of emission is also assigned randomly as a direction cosine.
The event histories of the packets are then followed as they propagate through a random
walk process in the ejecta. Photon packets have two fates: they either re-enter the

CHAPTER 3. RADIATIVE TRANSFER 100
photosphere or escape the envelope, and either way they can undergo line interaction
or electron scattering.
The main part of the code determines what happens next: does the packet en-
counter a line interaction or a scattering event before it crosses either the inner or outer
border of the shell where the physical conditions change. The direction of ejection
must be used to calculate the distance the packet must travel to reach the outer edge
of the first shell. A random optical depth is selected τR = 1 − ln(z), where z is a
random number between 0 and 1. Two possible events can occur, electron scattering
and line interaction. Electron scattering occurs with a probability that is linear with
radius, since it is assumed that the electron density is constant in each shell, whereas
line opacity occurs at a specific point in a packet’s trajectory, where the frequency of
the packet is the same as the resonance frequency of a spectral line. A packet emitted
from the photosphere can only interact with lines which are at a longer wavelength
than itsself, due to the expanding nature of the ejecta. The energy packet encounters
an electron optical depth τe during its flight. The path length se the photon can travel
freely before τe becomes equal to τR is calculated using τe = σTne(i)se where ne(i)
is the electron density of the ith shell, and σT is the Thomson electron cross section.
If se is less than the distance needed to exit the shell, the packet may undergo electron
scattering in the next shell. After this the distance of the line encounter sl needs to
be compared to se. This can be calculated at the packet’s co-moving frequency at the
resonance point v′ = v[1− µ(v/c)], using the Doppler formula with v ∝ r.
Finally se and sl are compared to the distance of the edge of the shell ssh, and
the smallest of these values decides what happens next. If the packet is closest to the
edge of the shell, it enters the next shell with the new physical conditions and a new
optical depth calculation must begin. If electron scattering occurs next a new random
direction is assigned to the packet and the MC experiment starts again. If the photon

CHAPTER 3. RADIATIVE TRANSFER 101
Figure 3.1: Photon packets encounter line events or electron scattering during their randomwalk within each shell (Mazzali, 2000).
encounters a line event, the downwards transition has to be chosen. The probability of
spontaneous decay to a particular level i is then:
pji =Ajiβjihvji∑iAjiβjihvji
(3.20)
The factor hvji is introduced as energy packets are used in the MC experiment.
Figure 3.1 shows how photon packets react when they encounter a line or scattering
event, before they escape the shell.
Typically about 50 000 photon packets are used in the MC calculation. Once the
propagation of each packet is followed through the ejecta the final spectrum must be
formed. The spectrum is formed by calculating the formal integral for the emergent
intensity. A full explanation of this can be found in Lucy (1999).

CHAPTER 3. RADIATIVE TRANSFER 102
3.7 Modelling procedure
The aim of producing synthetic models of SNe is to compare them with observations.
The normal process of modelling a time series of spectra involves producing synthetic
spectra starting with the earliest epoch. This is done by setting the distance and ex-
tinction to the SN, then determining the bolometric luminosity of the ejecta and the
photospheric velocity. A typical abundance distribution is assumed and a synthetic
spectrum of the first epoch is produced. Usually 2 or 3 synthetic shells are placed
above the photosphere of the first observed spectrum, in order to produce a stratified
abundance distribution at higher velocities, and to avoid wrong elements been seen at
high velocities in the synthetic spectra. The abundances above the photosphere are var-
ied to produce the best fit to the observed spectrum. Once an acceptable fit is obtained
the next spectrum is modelled using the same procedure, and only the abundances in-
side the previous photosphere are modified. Abundances in the outer layers can affect
the synthetic spectra at later epochs. If this is the case iteration is required on the abun-
dances of the elements in the outer layers. Once the modelling procedure is complete,
physical properties about the SN ejecta can be obtained, including the abundance dis-
tribution in velocity space. This technique is known as ‘abundance tomography’, it was
first published in Stehle et al. (2005). Abundances given in this work have an error of
±25%, and photospheric velocities have an error of ±15%. A detail analysis of errors
using the ‘abundance tomography’ method was carried out in Mazzali et al. (2008).
The error on the 56Ni mass is ±10%, as it is constrained though multiple methods.
3.7.1 Constraining the abundances
In the abundance tomography process all of the main elemental abundances (Ca, Mg,
Si, S, C, Ti, Cr, Fe, Ni) are constrained by the data. The default abundance is oxygen.

CHAPTER 3. RADIATIVE TRANSFER 103
If all of the other features in the spectra are matched, in both depth and velocity, but
the total abundance in the shell is not unity the remaining mass will be put as oxygen.
Therefore, in some cases if the oxygen feature is fit poorly, (i.e. it is too strong) it could
be an indication that there is too much mass above the photosphere. However, this is
not a problem found in this thesis.
One assumption in the models is that there is smooth mixing of elements through-
out the ejecta. For example if there are two synthetic spectra at 12000 kms−1 and
8000 kms−1, and if at 12000 kms−1 the Si abundance is 10% and at 8000 kms−1 the
Si 30%, the assumption is made that the Si abundance at 10000 kms−1 will be 20%.
This is a fair assumption as most explosion models show elements smoothly mixed
throughout the ejecta. The only times there will be a significant jump in abundance
values in the abundance tomography models is when the synthetic spectra become sig-
nificantly worse if the smooth mixing assumption is assumed.

4. SN 2014J
4.1 Preface
One way to understand the link between subluminous SNe Ia and normal SNe Ia is
through radiative transfer modelling. Therefore, the second project in this thesis was
to observe and model SN 2014J. This SN is a close and interesting object, and was used
as a good test for modelling a normal SN Ia. This section presents spectroscopic and
photometric observations and abundance tomography modelling of this SN. Work from
this section has been published in Ashall et al. (2014). All of the work in this chapter
was carried out my myself, except for the observations and reduction of the INT spectra
which were performed by Phil James and Sue Percival respectivly. Furthermore, the
SIFTO fitting in the work was carried out my Kate Magure, and the study into the effect
of Rv on ∆m15(B) was carried out my Mark Phillips.
4.2 SN 2014J
SN 2014J was discovered on 2014/01/21.810 (Fossey et al., 2014). It is located in
M82, which makes it the closest SN Ia in at least the last 28 years and possibly the last
410 years, depending on distance estimates. SN 2014J is a spectroscopically normal
SN Ia, with high-velocity features. There have been many studies into SN 2014J which
104

CHAPTER 4. SN 2014J 105
confirm it as a normal SN Ia (Ashall et al., 2014; Goobar et al., 2014; Amanullah et al.,
2014; Kelly et al., 2014; Marion et al., 2015; Foley et al., 2014; Brown et al., 2015).
Photometric and spectroscopic observations of SN 2014J were obtained, and abun-
dance stratification models were produced. As technology has dramatically improved
in recent times, this SN gives us a unique opportunity to intensely observe, analyse
and model a SN Ia with modern techniques. SN 2014J is located at RA=9:55:42
Dec=69:40:26.0 (J2000), and is in M82 which is at a distance of 3.77±0.66 Mpc.
This value was obtained from the mean distance from NED, from 2 methods, PNLF
(Planetary Nebula Luminosity Function) and TRGB (Tip of the Red Giant Branch).
However, it should be noted that Foley et al. (2014) derive a distance of 3.3 Mpc. M82
is known for having a large amount of star formation; hence it has a large amount of
dust (Hutton et al., 2014). Because of this, SN 2014J is highly and unusually reddened.
It does not follow the average galactic reddening law of RV =3.1. Detailed investiga-
tions into the host galaxy extinction were produced by Amanullah et al. (2014) and
Foley et al. (2014). With our modelling approach, the published extinction values are
optimised by deciding which values produce the best-fits of SN 2014J from the spectra.
4.3 Observations
Photometric and spectroscopic observations of SN 2014J were carried out with the
Liverpool Telescope (LT). The LT is a 2.0 metre fully robotic telescope located at
Observatorio del Roque de los Muchachos (ORM) on La Palma. 10 spectra were
obtained using FRODOspec, a multipurpose integral-field unit spectrograph, at -8 d to
+10 d relative to B-band maximum, see table 4.1. FRODOSpec consists of blue and
red arms which cover 3900-5700 A and 5800-9400 A respectively. The FRODOSpec
pipelines were used to reduce the spectra, the first one L1 performs bias subtraction,

CHAPTER 4. SN 2014J 106
overscan trimming and CCD flat fielding, and the second, L2, includes production of
sky subtracted row stacked spectra which is specific to FRODOSpec (Barnsley et al.,
2012). No host galaxy subtraction was performed with the spectra, as no images were
available. However, the sky subtraction routine in the FRODOSpec pipeline removes
most of the flux from M82, meaning that any flux which has not been subtracted should
be negligible.
Photometric observations were obtained using IO:O, an optical imaging camera
which has a field of view (FOV) of 10 arcmin2. Three filters were used to obtain
the light curves of the SN, SDSS g′r′i′. The IO:O pipeline, which consists of bias
subtraction, trimming of the overscan regions and flat fielding, carried out the data
reduction.
There are also two spectra at the 2.5m Isaac Newton Telescope (INT), located at
ORM on La Palma. The Intermediate Dispersion Spectrograph (IDS) is a long- slit
spectrograph on the INT. The IDS was used with a set up of R1200Y grating and
RED+2 camera.
4.4 Extinction
The foreground Galactic extinction of SN 2014J is E(B − V )=0.05 mag (RV =3.1)
(Amanullah et al., 2014; Foley et al., 2014). Due to the large amount of star forma-
tion and therefore dust in M82 SN 2014J is highly and unusually reddened; it does
not follow the average Galactic extinction law of Rv=3.1. Detailed investigations into
the extinction of SN 2014J have been carried out by Foley et al. (2014) and Amanul-
lah et al. (2014). Foley et al. (2014) present HST spectroscopic and photometric data,
and attempt to derive the correct extinction of SN 2014J. Their preferred model is one
with variable extinction where E(B−V ) changes by 0.4 mag one month after B-band

CHAPTER 4. SN 2014J 107
Table 4.1: Log of spectroscopic observations of SN 2014J.
Epoch MJD a Phaseb Exp time Instrument(d) (s)
2014-01-26 56684.12 –8 500 FRODOSpec2014-01-27 56685.12 –7 500 FRODOSpec2014-02-03 56692.01 +0 600 FRODOSpec2014-02-04 56692.90 +1 600 FRODOSpec2014-02-04 56693.13 +1 3×120 INT2014-02-05 56693.89 +2 600 FRODOSpec2014-02-06 56694.96 +3 600 FRODOSpec2014-02-07 56695.89 +4 500 FRODOSpec2014-02-07 56696.13 +4 3×120 INT2014-02-08 56696.92 +5 500 FROSOspec2014-02-09 56697.97 +6 500 FRODOSpec2014-02-11 56699.88 +8 500 FRODOSpec2014-02-13 56701.877 +10 500 FRODOSpec
a Observation in MJD dateb Relative to B-band maximum
maximum, and was determined by minimising the residuals between the spectra of
SN 2011fe and SN 2014J. This approach uses a two-component circumstellar scatter-
ing and dust reddening model. They also analyse the extinction using other methods
such as the colour excess. The values obtained for the colour excess using the CCM
law (Cardelli et al., 1989) by Foley et al. (2014) were E(B − V )=1.24±0.1 mag and
RV =1.44±0.06.
Amanullah et al. (2014) use HST photometric data to explore the extinction of
SN 2014J by comparing it to SN 2011fe. They use a variety of extinction laws, and
state that the best values are found using a power law extinction, with an RV =1.4±0.1
and p = −2.1 ± 0.1. Using the FTZ reddening law (Fitzpatrick & Massa, 1999)
between –5 to +35 d relative to B-band maximum Amanullah et al. (2014) found an
E(B − V )=1.29±0.02 mag and an RV of 1.3±0.1 with a χ2/dof = 3.3. It should be
noted that the FTZ and CCM law are the same over the wavelengths used in this study.

CHAPTER 4. SN 2014J 108
Figure 4.1: Maximum light spectra of 2014J and SN 2011fe.
However, the comparison between SN 2014J and SN 2011fe may not be the best
way to determine the extinction law as they have different values of ∆m15(B). SN
2011fe has a ∆m15(B) as high a 1.21 mag where as SN 2014J has a value of 0.95 mag,
or 1.08 ±0.03 mag when correct for extinction. One can force SN 2014J to have the
same LC shape as SN 2014J. However, one is then a circular argument where extinction
values are adopted to produce the appropriate decline rate. Furthermore, when the B-
band maximum spectra are compared, Fig 4.1, it is found that there is a difference
in the Fe ∼ 4800 A feature, which demonstrates a higher intrinsic temperature and
different ionisation.
Due to the high quality of data used in Amanullah et al. (2014) and Foley et al.
(2014) to calculate the extinction towards SN 2014J, no host galaxy extinction is de-
rived in this work. The values used in this analysis are E(B − V )=1.2 with RV =1.38.
These are adopted by optimising the published extinction values, colour excess and
FTZ law from, which produce the modelled best-fits of SN 2014J from the spectra. It
should be noted that the attenuation of the flux in B and V is similar with the values
of Amanullah et al. (2014) and Foley et al. (2014).

CHAPTER 4. SN 2014J 109
4.5 Photometry
SDSS g′r′i′ light curves were produced, see Figure 4.2. Photometric reduction was
carried out using the IRAF1 package DAOPHOT. Instrumental magnitudes of SN 2014J
and stars within the field were obtained. In order to produce the calibrated magnitudes
of the supernova, the colour terms and zero points were required. For the g′r′i′ filters,
the colour terms were obtained by using the standard star images, taken on the same
night as the observations, and comparing their instrumental magnitudes to the APASS
catalogue magnitudes2. IO:O typically requires an exposure time of over 10 s for good
photometry, due to the amount of time it takes for the shutter to open and close. The
typical exposure time in the photometric images was 2 s. Therefore stars at the edge
of the FOV will be exposed for a shorter period of time than ones in the centre of the
field. To overcome this, the zero points were calculated using a single star, RA=9:55:35
Dec=69:38:55 (J2000), close to SN 2014J. This star is a G type star and shows no sign
of being a variable star. This star was obsevered four times over the course of a
month for the APASS catalogue. it was also observed for the Tycho-2 catalogue (Høg
et al., 2000). The magnitudes obatined with the Tycho-2 and APASS catalogues were
within 0.03 mag in the B band and 0.02’ mag in the V band. This is less than the
errors on the photometry. The main source of error in the photometry was calculating
the zero points; if the calibration star was saturated the magnitude was ignored. As
there are not pre-explosion images of M82 using the LT, the host galaxy has not been
subtracted from the photometry. To calculate how much this host galaxy flux affects
the photometry the SDSS images of M82 were used. Aperture photometry was carried
out, using the same aperture size as the LT images, on the location of the SN pre-
1 IRAF is distributed by the National Optical Astronomy Observatories, which are operated by theAssociation of Universities for Research in Astronomy, Inc., under cooperative agreement with theNational Science Foundation.
2 http://www.aavso.org/apass

CHAPTER 4. SN 2014J 110
0 5 10 15 20 25 30 35 40 45MJD (+5.668e4 days)
9
10
11
12
13
14
Magnit
ude
i'+1
r'
g'
Figure 4.2: Aperture photometry light curves, produced using LT data. SDSS g′r′i′ light curvesare presented. The errors on the photometry appear to be constant; this is due to the catalogueerror on the zero point star dominating.
explosion and a standard star in the FOV. From this I found that the highest value the
photometry can deviate by, owing to the missing host galaxy subtraction, is 8% in the
i′-band, 5% in the r′-band and 5% in the g′-band.
SN 2014J was observed at an almost daily cadence from MJD 56684.12 to 56720.83.
g′r′i′ light curves were produced (Figure 4.2). There was a gap in observations between
13th Feb 2014 and 21st Feb 2014, due to poor weather conditions on La Palma. g′-band
maximum occurred on 03-Feb, which is consistent with the maximum in the B pass-
bands (Tsvetkov et al., 2014). It was found that g′-band maximum was 11.42±0.09
mag, r′-band maximum was 10.16±0.03 mag and i′-band maximum was 10.20±0.05
mag. The distance modulus used for M82 was taken from NED, µ=27.86 mag. There-
fore, at maximum, SN 2014J had an absolute g′-band magnitude of -16.44 mag, an

CHAPTER 4. SN 2014J 111
Figure 4.3: SIFTO SN 2014J light curve fits
r′-band magnitude of –17.68 mag and an i′-band magnitude of –17.66 mag, before
correction for extinction.
Foley et al. (2014) and Marion et al. (2015) have published photometric and
spectroscopic observations of SN 2014J. They report ∆m15(B) to be 1.01 and 1.08
mag respectivly when corrected for host galaxy extinction, and Foley et al. (2014)
report 1.95±0.02 mag when not corrected for host galaxy extinction. We analysed
the LT SDSS g′ and r′-band photometry with the SiFTO (Conley et al., 2008) light
curve fitter to obtain the stretch, V-band maximum and tBmax, see Figure 4.3. Us-
ing the g′ and r′ bands we obtained a stretch of 1.083±0.06, which corresponds to
a ∆m15(B)=0.88±0.08 using the relation from Conley et al. (2008). However using
only the r′ band light curve produces a stretch of 1.035±0.08 and therefore a ∆m15(B)
of 0.95±0.12. When corrected for host galaxy extinction, E(B − V )=1.2 (RV =1.38),
using the relation from
Phillips et al. (1999), the B-band decline rate is found to be 1.00±0.06 or 1.07±0.08
for g′ and r′ bands and r′ band respectively. These decline rates are consistent with
those of Foley et al. (2014). However the correction of Phillips et al. (1999) for ob-
taining “reddening-free” ∆m15 values from the observed values was derived assuming

CHAPTER 4. SN 2014J 112
0.0 0.5 1.0 1.5 2.0E(B-V)
0.90
0.95
1.00
1.05
1.10
∆m
15(B
)
SN2011fe, RV
= 3.1
SN2011fe, RV
= 1.4
Hsiao, Rv = 3.1
Hsiao, Rv = 1.4
Phillips et al. (1999)
Figure 4.4: Dependence of ∆m(B)15 onE(B − V ) for different values of RV , using SN 2011fespectrophotometry and the Hsiao template.
an RV = 3.1. To check the sensitivity of this correction to RV , we carried out our own
calculation of the effect of dust reddening on ∆m15(B) for RV =3.1 and RV =1.4 us-
ing the published optical spectrophotometry of SN 2011fe (Pereira et al., 2013) and
the Hsiao SN Ia spectral template (Hsiao et al., 2007). The spectra were reddened
for values of E(B − V )=0.0-2.0 using the IRAF DEREDDEN task, which implements
the CCM law. Synthetic magnitudes were calculated using the Bessell (1990) B pass-
band, and the B-band decline rate was measured for each value of E(B − V ). Figure
4.4 shows the results, including a comparison with the approximate relation given by
Phillips et al. (1999). As is seen, the effect on ∆m15(B) of changing the value of RV
from 3.1 to 1.4 is small. For E(B − V )=1.2 and RV =1.38 application of these calcula-
tions to our SIFTO-measured decline rates gives ∆m15(B)=0.98±0.08 for the g′ and
r′ bands, and or 1.05±0.12 when for the r′ band, when the 2011fe spectra were used;
and ∆m15(B)=0.95±0.08 or 1.02±0.12 using the Hsiao template. Foley et al. (2014)
state that the V-band maximum was 10.61±0.05, whereas our fitting obtains this to be
10.66±0.02. We obtain a tBmax which is consistent with the values found by Foley et
al. (2014).

CHAPTER 4. SN 2014J 113
4.6 Spectroscopy
The LT data spectroscopic reduction was done in two halves, corresponding to the blue
and red arms of FRODOSpec. Each spectrum was manually searched through to select
fibres which had signal. An appropriate top threshold was applied, to ensure cosmic
rays were not affecting the spectrum. The signals from these fibres were combined;
the spectra were formed using the ONEDSPEC IRAF package. The SN spectra were
calibrated in flux using spectra of Feige34. The accuracy of the flux calibration process
was confirmed by a successful calibration of the star back onto itself. This was done by
running the calibration process on the observations of the standard star, and checking
this against the IRAF data for the star, see Figure 4.6. The INT data were reduced using
the STARLINK software (Disney & Wallace, 1982). The spectrophotometric standard
used to reduce the INT data was Feige66.
A full plot of a SN 2014J spectrum with the main absorption lines labelled is
found in Figure 4.7 and the early time spectral evolution of SN 2014J is plotted in
Figure 4.5. The spectra have a very strong Si II 6355 A absorption line. They also
have high velocity features at early epochs; the main high velocity feature is exhibited
by the Ca II IR triplet around ∼7900 A. Furthermore, at even earlier times up to –12d
Goobar et al. (2014) have found a strong high velocity feature of Si II 6355 A. Figure
4.5 demonstrates the extent of the reddening, which means that the flux in the blue arm
is extremely suppressed. The evolution of the Si II 6355 A line can be seen in Table
4.2. As expected, as the photosphere recedes, the velocity of the ejecta decreases and
hence the wavelength of the absorption line increases, although this may not always
be apparent over smaller intervals. This is due to the resolution of the spectra and the
errors on the velocity. The velocity gradient from the Si II 6355 A line between +0 to
+9d relative to B-band maximum is 58.8 km s−1 day−1. This makes SN 2014J a Low
Velocity Gradient (LVG) SN Ia (Benetti et al., 2005). It can be seen in the LT post

CHAPTER 4. SN 2014J 114
Table 4.2: Log of the Si 6355A absorption line velocities. Theresolution of the spectra is ∼ 9A, this value has been used tocalculate the error on the velocity of the Si II line.
Epoch MJDa Phaseb velocityc
(d) (d) (kms−1)2014-01-26 56684.12 –8 12973±4242014-01-27 56685.12 –7 12643±4242014-02-03 56692.01 +0 11758±4242014-02-04 56692.9 +1 11697±4242014-02-05 56693.89 +2 11686±4242014-02-06 56694.96 +3 11552±4242014-02-07 56695.89 +4 11640±4242014-02-08 56696.89 +5 11412±4242014-02-09 56697.97 +6 11529±4242014-02-11 56709.87 +8 11408±4242014-02-13 56701.877 +10 11228±424
a Modified Julian Day numberb relative to B-band maximum (days)c velocity of the Si 6355A absorption line
maximum spectra at +6, +8 and +10d that P-Cygni re-emission redwards of the Si II
6355 A absoption has a flat top, which is also visible in the HST data at +11.3 d (Foley
et al., 2014).
By using the correlation between the ratio of the depth of the silicon lines, 5972
and 6355 A, and absolute magnitude and therefore ∆m15(B) (Nugent et al., 1995) a
photometry-independent approximation for the ∆m15(B) of SN 2014J can be obtained.
The INT spectra from +1d are used to do this, as the INT data cover the 5972 A feature.
The value derived is ∆m15(B)=1.11±0.02, which is consistent with the values found
by Marion et al. (2015) and Foley et al. (2014). Furthermore it is possible to use the
EW of the Si II 5972 A to estimate the ∆m15(B) (Hachinger et al., 2006). Using this
method ∆m15(B) was found to be 1.27±0.15.

CHAPTER 4. SN 2014J 115
4000 5000 6000 7000 8000 9000 10000
Wavelength [Å]
1.5
1.0
0.5
0.0
0.5
1.0
1.5
Rela
tive f
lux [Fλ +
off
set]
SiII
SiIISII
FeII S
iII
MgII
CrI
I
OII
CaII
t=-8d
t=-7d
t=+0d
t=+1d
t=+1d INT
t=+2d
t=+3d
t=+4d
t=+4d INT
t=+6d
t=+8d
t=+10d
Figure 4.5: All spectral observations of SN 2014J, LT and INT. The time is given relativeto rest-frame B-band maximum. The spectra have not been corrected for reddening. Therewere no data collected between 5700-5800 A for the LT observations and the two atmosphericabsorption lines have been removed. All of the plots have been offset by an arbitrary amountfor the purpose of presentation.

CHAPTER 4. SN 2014J 116
4000 5000 6000 7000 8000 9000
wavelength [A]
0.0
0.5
1.0
1.5
2.0
2.5
3.0
3.5
4.0
Flux [
10−
13ergs−
1cm
−2
A−
1]
Figure 4.6: A check of the flux calibration process of Feige34 back on to itsself. The bluepoints are the catalogue data, ad the red the data from the observations.
Figure 4.7: An overview of the features of SN 2014J. This spectrum has been dereddened andwas taken at B-band maximum.

CHAPTER 4. SN 2014J 117
4.7 Models
Ten epochs of LT data have been modelled using the abundance tomography technique.
All of the spectra have been dereddened using the CCM law. A host galaxy extinction
of E(B − V )=1.2 mag (RV =1.38) is used. These values are where the model produce
the best fits, and are also consistent with the values of Amanullah et al. (2014) and Fo-
ley et al. (2014). The MC radiative transfer code is successful at modelling a variety of
SN, therefore the models of SN 2014J are a good indication that the derived reddening
values are correct. One-shell models were produced with different values of E(B-V),
and it was found that if this value was increased the input luminosity of the model had
to be increased. This meant there was too much flux in the model and it peaked in the
UV rather than the optical.
The time since explosion is one of the input parameters needed for the modelling pro-
cess, therefore the rise time of SN 2014J is needed. There are pre-discovery images of
SN 2014J, in which it first appears at Jan. 14.75 UT (Zheng et al., 2014) which gives
it a bolometric rise time of ∼20 days. The main input parameters can be found Table
4.3.
Choosing a reasonable density profile is important in producing a physically meaning-
ful and well-fitting model. The density distribution chosen for SN 2014J is the W7
model (Nomoto et al., 1984). The W7 model was selected as SN 2004eo, SN 2003du
and SN 2002bo can all be reasonably modelled with this density profile. Therefore
I can see if there is continuity in results. A higher density can lead to enhanced ab-
sorption lines, therefore it is important to select the appropriate one for the explosion.
The most marked effects of the density on photospheric spectra occur at the earliest
epochs, when the density of the outermost layers strongly modulates (e.g. the UV flux
(Mazzali et al., 2014)). Therefore, moderate deviations in the outer density profile will
not affect the results obtained from the regions explored in this work, as the modelling

CHAPTER 4. SN 2014J 118
Table 4.3: Input parameters and calculated converged tempera-ture.
Epoch a Epoch b Velocity Bol. Lum TemptB texp vph TBB(d) (d) (km s−1) log(L) (K)-8 12 12300 9.295 10200-7 13 11990 9.408 10100+0 20 9480 9.455 9200+1 21 8970 9.46 9000+2 22 8440 9.43 8900+3 23 7930 9.39 8800+4 24 7480 9.355 8600+6 26 6500 9.32 8400+8 28 5450 9.250 8100+10 30 4400 9.22 7800
a Relative to B-band maximumb Days after the explosion
begins at an epoch of –8 days relative to B-band maximum.
The main limitations of the analysis concern the high velocity outer layers of the ejecta,
the extinction values, the distance to SN 2014J and the lack of UV data.
This section will analyse each epoch of the models and observations. In the models the
iron-group content is parameterised in terms of two quantities, Fe and 56Ni at the time
t = 0. This gives us the abundance of Fe, 56Co and 56Ni at any point of time, assum-
ing that the abundances of directly-synthesised Co and Ni are negligible. It should be
noted that any Fe discussed in this section is stable iron.
4.7.1 Day –8
The first spectrum was observed 8 days before B-band maximum, texp= 12 days, see
Figure 4.8. As this spectrum is before B-band maximum it has a high photospheric
velocity, vph=12300 km s−1, the effective temperature is 10200 K and the bolometric
luminosity is 109.295L. The strongest photospheric absorption lines, which are indi-

CHAPTER 4. SN 2014J 119
Figure 4.8: Modelled (blue) and observed spectra (green) of SN 2014J. Plot (a) is from -4d,(b) is from -3d, (c) is +0d maximum, (d) is +1d and (e) is +2d. All of the dates are relative toB-band maximum. All spectra have been dereddened. The red spectrum at +1 d is from theINT.

CHAPTER 4. SN 2014J 120
cated in Figure 4.7 , are dominant from the beginning of the time series to at least a
week after maximum.
There are strong Si II 6355 A, S II 5454 A and 5640 A features. Due to this the
model requires a photospheric abundance of 12% Si and 9% S by mass, with 13%
Mg to produce the Mg II 4481 A line. The Mg II 4481 A line is the dominant line
in the 4300 A feature. The O abundance is 60% and the Ca is 1%. There are strong
Ca II features in this modelled spectrum, including a large absorption line in the H&K
feature in the near UV (3934, 3968 A). This absorption line is produced by the models
in a strength consistent with the HST data (Foley et al., 2014). Although this NUV Ca
line region is not covered our observations, the Ca II IR triplet is present from which Ca
abundances can be inferred. The photospheric Ca II IR triplet is modelled successfully,
but there is no attempt to model the high velocity feature. An iron abundance of 4%
is required to produce the Fe III 5150 A absorption line. The 56Ni abundance is at
0%, because the ejecta at this epoch are still in the high velocity outer layers of the
photosphere. Ti+Cr are at a photospheric abundance of 0.3% by mass. There is a low
abundance of C at this high velocity as there are no C spectral features in the optical
data, suggesting that all the carbon may be in earlier time spectra, although Marion et
al. (2015) do find C I at 1.0693 µm. However, if is added into the models it is found
that the C feature is stronger than observed . Therefore the C found in the NIR must be
due to a very small abundance. There is a small absorption line in the optical observed
at ∼6200 A, where one would expect C, however this line is too narrow and probably
not a C feature. The model at this epoch produces a particularly good match for the Fe
II/Mg II 4200 A, S II 5640 A and Si II 6355 A features.

CHAPTER 4. SN 2014J 121
4.7.2 Day –7
The second spectrum was taken –7d from B-band maximum, texp= 13 days. The lumi-
nosity at this epoch is 109.408 L and vph=11990 km s−1. There is very little variation
between the first two epochs as they are only taken 1 day apart. The main chemical
changes from the previous epoch are that Si has increased to a photospheric mass abun-
dance of 15% and S to 10%. The 56Ni has also increased to 3%. The ∼4200 A feature
is predominantly Mg II 4481 A with smaller contributions from Fe III 4419 A. The Mg
abundance is 10% and the O abundance has decreased to 56%. The Si III 4550 A line
is successfully modelled, and this is the last FRODOSpec spectrum with a prominent
Si III feature.
4.7.3 Day+0
The third spectrum was taken on the night of B-band maximum, texp= 20 days, as is
shown in Figure 4.8. The luminosity is 109.455 L and photospheric velocity vph=9480
km s−1. The Si and S abundances have increased relative to the previous epoch to
photospheric mass abundances of 17% and 12% respectively, and the 56Ni has stayed
constant at 3%. 56Fe has also increased by 2% to 6%. Conversely, the Mg and O
abundances have decreased to 5% and 55% respectively. There is now a notable excess
in flux in the red side of the spectrum due to the black body approximation. The B-
band modelled absolute unreddened magnitude is –18.79. At this epoch the modelled
Si III 4550 A absorption line is not as strong as the previous epochs. Furthermore,
in the previous spectrum the 4800 A feature which have dominant Si II 5056 A and
Fe II 5169 A absorption lines are merged into one, whereas at this epoch they have
two distinct minima. Ca absorption is now more prominent in both the model and the
observations, and is seen in the Ca II IR triplet at ∼8200 A .

CHAPTER 4. SN 2014J 122
4.7.4 Day+1
The next spectrum in the series was observed on +1 d relative to B-band maximum,
texp= 21 days. It has a luminosity of 109.460 L and a photospheric velocity of vph=8970
km s−1. This spectrum is at maximum bolometric luminosity, which is consistent with
it being between B-band and V-band maximum. Although the INT and LT spectra
differ slightly, predominantly in the red side of the spectrum, the main absorption
lines in the blue side of the optical are similar between the spectra. Due to this, the
abundances obtained in our analysis would not change if just the INT or LT spectra
were modeled. The abundances derived from this spectrum are very similar to the
previous epoch; the Si decreases to 15%, the S to 10% the O to 57%. 56Ni has increased
to 11% and 56Fe is constant at 6%. The effective temperature at this epoch is 9000 K,
which is 200 K lower than the previous spectrum. The Mg abundance has decreased
to 0%. The S II 5454 A feature is not as strong in the model as the observed spectrum,
however increasing S abundance would enhance the S II 5640 A line. There is excess
strength of O I and Mg II at 7773 A and 7896 A which could be an indication that there
is excess mass at this velocity. This feature occurs in most of the epochs in the model,
and is more dominant in late time spectra.
4.7.5 Day +2
The fifth spectrum was observed on texp= 22 d, see Figure 4.8. Its luminosity is 109.430
L and photospheric velocity is vph=8440 km s−1. The effective temperature is 8900
K. The abundances at this epoch are very similar to the previous one, except for 56Ni
which begins to increase dramatically to 36%, and S which decreases to 4%; Si and
O also decrease to 10% and 43% respectively. At this epoch Ca stays constant at 2%.
The B-band unreddened modelled absolute magnitude of this spectra is –18.85. At

CHAPTER 4. SN 2014J 123
this epoch the ∼4200 A feature is still dominated by the Fe III 4419 A and Mg II 4481
A lines.
4.7.6 Day +3
The next spectrum was observed on texp= 23 days, refer to Figure 4.9. The luminosity
at this epoch is 109.390 L, the photospheric velocity is vph=7930 km s−1, the effective
temperature is 7900 K and the B-band modelled absolute magnitude is –18.62 mag.
The modelled S II 5640 A feature is stronger than the observed one; this is a problem
which consistently occurs in the model. To make the S II the same strength as the
observed one it would require the abundance of S to be reduced in the early-epoch
models. However the early-time spectra rather than the late time ones were chosen to
be fit, as these can lead us to more information about the high velocity abundances.
At this epoch the O has a photospheric abundance of 0%. The Si and S have also
decreased to an abundance of 4% and 2% by mass respectively. The Fe II 4420 A and
Si II 6355 A lines are modelled successfully. The wide deep absorption line at 8200 A
is the Ca II IR triplet absorption line, and the calcium abundance has been reduced to
1% to decrease the strength of this line. At this epoch 56Ni begins to dominate and is
at 88%.
4.7.7 Day +4
The spectrum from +4 d has a luminosity of 109.345 L and photospheric velocity of
vph=7480 km s−1. There is a similar discrepancy between the INT and LT data as in the
+1 d plot, however once again this does not affect the abundances obtained from our
fits. From this epoch the absorption lines are beginning to be stronger than the observed
ones. This includes, the modelled Fe/Mg 4300 A and Fe 4800A features, which are
produced by dominant Fe III 4419 A and Fe II 5018 A absorption lines. However,

CHAPTER 4. SN 2014J 124
Figure 4.9: Modelled (blue) and observed spectra (green) of SN 2014J. Plot (a) is from +3d,(b) is from +4d, (c) is +5d, (d) is +6d and (e) is +8d. All of the dates are relative to B-bandmaximum. All spectra have been dereddened. The red spectum of +4 d is from the INT.

CHAPTER 4. SN 2014J 125
to refine this fit requires the abundances of these lines at high velocity epochs to be
reduced, affecting the early time spectra. Therefore, it can be suggested that the excess
absorption could be due to too much mass at vph=7480 km s−1. Part of the excess in
strength of the 56Fe lines could also be due to the decay of 56Ni. Due to this excess
strength in Fe, its photospheric abundance has been reduced to 0.1%. The Si and S
abundances have decreased to 0%, and the 56Ni is at 99%. The effective temperature
at this epoch is 8600 K.
4.7.8 Day +6
The eighth spectrum was taken 26 days after explosion. It has a luminosity of 109.32
L, a photospheric velocity of vph=6500 km s−1 and an effective temperature of 8400 K.
The 56Ni photospheric abundance is at 99%. The Fe II 4340 A, S II 5606 A and Fe
III 4419 A absorption lines are much deeper in the model than the observations. The
unreddened modelled B and V magnitudes are 9.5 mag and 9.1 mag respectively.
4.7.9 Day +8
The next spectrum has a luminosity of 109.250 L and photospheric velocity is vph=5950
km s−1. The 56Ni abundance has stayed constant. The difference between the model
and observation becomes larger, as shown by the Fe II 4549 A line in the 4800 A
feature. At this epoch there is a significant amount of 56Ni above the photosphere.
Therefore it is not unexpected that the difference between the models and observed
spectra begins to increase.

CHAPTER 4. SN 2014J 126
4.7.10 Day +10
The final epoch that was modelled is from +10 d from B-band maximum. It has a
luminosity of 109.22 L, a photospheric velocity of vph=5450 km s−1 and an effective
temperature of 7800 K. At this epoch there is no Si or S abundance, and the 56Ni abun-
dance is the most dominant, at almost 100%. The Ca abundance has now decreased to
0%.
4.8 Abundance stratification
An abundance stratification distribution plot for the photospheric layers of the ejecta
is shown in Figure 4.10. This plot demonstrates how the abundances of SN 2014J de-
velop at early times, from –8 d to +10 d. The abundance distributions of the outermost
layers can not be fully determined in the ejecta as I do not have spectra before –8d.
The abundances in the outer shell are slightly unusual, in that there is no carbon abun-
dance. This implies that if any C is present in the ejecta it had to be at the very highest
velocities. The other notable abundance is Fe which begins at 0.1% and rises to 6%. I
have attempted to increase this, but doing so dramatically strengthens the Fe 4800 A
feature at all epochs. Therefore the initial abundances of the outer shell, which has a
velocity of 14800 km s−1, are Si 10%, O 78%, S 4%, 56Ni 0%, Mg 7%, C 0.0%, 56Fe
0.1%, with heavier elements making up the remaining abundance.
At high velocities, between 8440-14800 km s−1, there is a large oxygen abundance
which starts at 78%. The Si distribution starts at 10% due to the strong Si II 6355 A
feature, and it increases to 17% at 9480 km s−1 before decreasing to 0% at 7480 km
s−1. Sulphur also follows a similar distribution with respect to velocity, although it
always has a smaller abundance than Si. The sulphur distribution starts at 3.5% before
peaking at 12%. The basic abundance evolution of the ejecta involves O dominating

CHAPTER 4. SN 2014J 127
followed by the IME and then by the heavy elements. In the abundance distribution
plot, Figure 4.10, the Fe starts at 0.1% and rises to 6%. In Figure 4.10 the IME el-
ements are significant at high velocities. From this it can be inferred that the lighter
elements may be at even higher velocities. Therefore earlier spectra are needed to gain
information about these lighter elements. As expected from a normal SN Ia explosion
56Ni dominates the abundance. This happens between 8440-7930 km s−1, where the
56Ni goes from a photospheric mass fraction of 36% to 83%. The Ti+Cr abundances
stay at a constant level throughout the whole explosion at 0.3%. Calcium starts at 2%
at 12300 km s−1 and it decreases to 1% at 5450 km s−1.
The integrated abundances of the most important elements in the photospheric
ejecta, which is at a velocity above 4400 km s−1, are M(Mg)=0.07 M, M(Fe)=0.03
M, M(O)=0.40M, M(S)=0.058M, M(Si)=0.09M and M(56Ni)=0.47M. When
the nebular phase spectra are available the 56Ni could increase to a total integrated
abundance of 0.72 M. The final total integrated abundances can be confirmed when
late time spectra of SN 2014J are observed. Due to ground based telescopes not being
able to observe the UV part of the spectra, the iron group element abundances of SN
2014J I have given here are subject to 20% uncertainty, which nebular modelling will
allow us to approve upon.
SN 2011fe and SN 2014J are apparently photometrically similar. SN 2011fe has
been used to determine the extinction of SN 2014J (Amanullah et al., 2014), and it
has also been modelled using the same MC radiative transfer code (Mazzali et al.,
2014). The total 56Ni abundance of SN 2011fe (Mazzali et al., 2014) and SN 2014J are
very similar (0.4-0.7 M and 0.47-0.72 M respectively, the large range is due to not
knowing abundance distribution in the nebular phase) Furthermore, the abundances in
the photospheric region of the SN 2011fe ejecta are remarkably similar to those of SN
2014J. Changing the density profile in the models is not likely to qualitatively affect

CHAPTER 4. SN 2014J 128
0.01
0.1
1
10
100
0 0.2 0.4 0.6 0.8 1 1.2 1.4
mas
s fra
ctio
n [%
]
enclosed mass [Msun]
velocity [km/s]2500 5000 7500 10000 12500 15000 17500
SN 2014J(6m=0.95)
CO
MgSiS
CaTi+Cr
Fe056Ni0
Figure 4.10: The abundance distribution of SN 2014J. The Ni/Co/Fe abundances are given interms of mass fractions of 56Ni (56Ni0) and stable Fe (Fe0) at t = 0. In the spectral models nostable Ni or Co and no radioactive Fe are assumed to be present.
the abundance pattern in the regions of the ejecta explored by the spectra.
4.9 Work carried out after this
Since I have carried out this project on SN 2014J a number of other papers have been
published on it. These include high resolution and high cadence optical photometry
and spectroscopy. Jack et al. (2015) found that spectra show several very sharp Na
ID doublet absorption components. This was interpreted as M82 have interesting sub-
structures. Graham et al. (2015) found that the spectra of SN 2014J shows several
of the common diffuse interstellar bands. There have also been mid-IR observations.
Telesco et al. (2015) obained the first ever mid-IR time series of a SNe Ia. They found a
56Ni mass of 0.6, which is in line with my work, and also agree that this explosion was
from a Ch-mass WD. Srivastav et al. (2016) present both NIR and optical observations

CHAPTER 4. SN 2014J 129
of SN 2014J. They also conclude that this SNe has a 56Ni mass of 0.6 and a ∆m15(B)
of 1.08 mag. Furthermore, they claim that the low Fe ratio in the nebular spectra of
SN 2014J hints towards clumpiness in the ejecta. However, Porter et al. (2015) present
spectropolarimetric observations of SNe 2014J and conclude that the ejecta showed
no asymmetry. Bikmaev et al. (2015) presented nebular observations of SN 2014J,
they conclude that the location of the SNe Ia must have been of solar metallically,
due to the Fe abundance. This is not dissimilar from the conclusions drawn from my
work. Vallely et al. (2016) performed a synthetic spectral analysis on SN 2014J, using
SNY++. They claimed that there was no oxygen in the ejecta of SN 2014J. This is
clearly wrong, and their results were contaminated by atmospheric absorption lines.
The HST spectra of SN 2014J published by Foley et al. (2014) show a clear oxygen
absorption profile. Furthermore, Vallely et al. (2016) claim that there is no Fe in the
ejecta before 23 days past maximum light, this is also an erroneous results. It is the
first time this has ever been claimed, as it disagrees with all SNe Ia models.
4.10 Summary
Photometric and spectroscopic observation of SN 2014J, the closest SN Ia in at least
the last 28 years are presented. The observations were obtained with the LT and INT.
SDSS g′r′i′ light curves and a spectral time series evolution over 12 epochs from –8d to
+10d , relative to B-band maximum, are presented. All of the spectra were calibrated
in flux, and atmospheric absorption lines were removed. The spectra show a very deep
Si II 6355 A line and a Ca high velocity feature at ∼7900 A. The ∆m15(B) of SN
2014J is 0.88±0.08 or 0.95±0.12 using the g′ and r′-band or r′-band respectively, and
by fitting them through SIFTO. When correcting for reddening this produced values
of ∆m15(B)=0.98±0.08 or 1.05±0.12, respectively, using the SN 2011fe spectra, and

CHAPTER 4. SN 2014J 130
∆m15(B)=0.95±0.08 or 1.02±0.12 for the Hsiao template.
SN 2014J is a highly reddened SN Ia which does not follow the conventional
Galactic reddening law (RV =3.1). I adopt the CCM law with a foreground galac-
tic value of E(B − V )=0.05 (RV =3.1) and host galaxy extinction of E(B − V )=1.2
(RV =1.38).
SN 2011fe and SN 2014J were found to have a comparable Ni masses, 0.4-0.7M
and 0.47-0.72 M respectively, when modelled using the same MC radiative transfer
code. However, due to their different in uncorrected decline rate I could expect these
values to change. This could be revealed with the use of the UV data and the nebular
spectra.
The spectra were modelled at 10 epochs, before and after B-band maximum, in-
ferring a best-fit abundance stratification. As one would expect, at higher velocities
(12400 km s−1) there is a large abundance of oxygen. As the photosphere recedes
(8440 km s−1) the IME elements dominate, Si and S. Then at low velocities the ra-
dioactive Ni dominates below 8000 km s−1. This leads to the prediction that the char-
acteristic line width of the iron emission line in the nebular spectra (Mazzali et al.,
1998) will be in the order of 8000 km s−1 .
Synthetic spectra reproduce the spectral evolution of SN 2014J, and the final in-
tegrated abundances of SN 2014J are M(Mg)=0.07 M, M(Fe)=0.03 M, M(O)=0.40
M, M(S)=0.05 M, M(Si)=0.09 M and M(56Ni)=0.47-0.72 M. Our results are
consistent with the current understanding of SN Ia reddening and early time abundance
distribution. The observations and modelling in this work are of particular significance
because of the close proximity of SN 2014J. Furthermore, SN 2014J is the typical ex-
ample of a normal SN Ia, making our models a good basis for studying further objects.

5. SN 1986G
5.1 Preface
SN 1986G ‘bridges the gap’ between normal and sub luminous type Ia supernova. With
the knowledge that transitional SNe Ia are interesting and the ability to model a SNe
Ia, the data of SN 1986G was modelled. The abundance tomography technique is used
to determine the abundance distribution of the elements in the ejecta. SN 1986G was
found to be a low energy Chandrasekhar mass explosion. Its kinetic energy was 70%
of the standard W7 model (0.9×1051 erg). Oxygen dominates the ejecta from the out-
ermost layers down to ∼ 9000 kms−1 , intermediate mass elements (IME) dominate
from ∼ 9000 kms−1 to ∼ 3500 kms−1 with Ni and Fe dominating the inner layers <∼
3500 kms−1. The final masses of the main elements in the ejecta were found to be,
O=0.33M, IME=0.69M, stable NSE=0.21M, 56Ni=0.14M. An upper limit on
the carbon mass is set at C=0.02M. The spectra of SN 1986G consist almost ex-
clusively of singly ionised species. SN 1986G can be thought of as a low luminosity
extension of the main population of SN Ia, with a large deflagration phase that pro-
duced more IMEs than a standard SN Ia. Work from this project was published in
Ashall et al. (2016). All of the early time spectral modelling, as well as the work
on abundance distrubitions, was carried out by myself. Paolo Mazzali modeled the
nebular spectra and produced the sythetic lightcurves, and Elena Pian calculated the
131

CHAPTER 5. SN 1986G 132
observed bolometric light curve.
5.2 SN 1986G
SN 1986G was the first object to lead to the questioning of Type Ia Supernovae as stan-
dard candles (Phillips et al., 1987). Its light curve was faster and dimmer than all of the
previously discovered SNe Ia. It had a rapidly declining light curve at early phases and
slow expansion velocities compared to a normal SN Ia (Phillips et al., 1987; Cristiani
et al., 1992). SN 1986G was located in NGC 5128, also known as Centaurs A, which
is at a distance of 3.42±0.18 Mpc (Ferrarese et al., 2007). This made it one of the
closest SNe Ia ever discovered, until SN 2014J (Ashall et al., 2014). SN 1986G was
observationally red, with a (B−V )Bmax=0.88±0.03 mag. This could be interpreted as
SN 1986G suffering form a large amount of extinction. However, SNe Ia suffer from
a colour/extinction degeneracy. Recently, for normal SNe Ia, this colour/extinction de-
generacy has been overcome (Sasdelli et al., 2016). For unusual SNe Ia this degeneracy
still remains an issue, and values of host galaxy extinction can be very uncertain.
SN 1986G is a “transitional” SN Ia. “Transitional” in this case refers to SNe Ia
that bridge the gap between 91bg-like and normal SNe Ia (Ashall et al., 2016). Fig-
ure 5.1 presents the B-band absolute magnitude light curves of four SNe Ia with a
variety of decline rates, ∆M15(B) (2011fe, 2004eo, 1986G and 2005bl). SN 2011fe
was a stereotypical normal SNe Ia with ∆M15(B)=1.1±0.05 mag, a broad LC shape,
and a normal spectrum, see Figure 5.2. SN 2004eo had ∆M15(B)=1.47±0.07 mag, it
was slightly less luminous than SN 2011fe, and had normal spectra. SN 1986G had
∆M15(B)=1.81±0.07 mag, a narrow LC and a cooler spectrum. SN 2005bl was a
91bg-like SN, with ∆M15(B)=1.93±0.1 mag. SN 1986G sits half-way between nor-
mal and subluminous SNe Ia.

CHAPTER 5. SN 1986G 133
The environment of SN 1986G is highly unusual and merits some discussion. The
host system is the peculiar radio galaxy NGC 5128 which is generally classified in
terms of its optical morphology as a lenticular or elliptical galaxy. This implies a dom-
inant old stellar population, but this may well be misleading, as SN 1986G occurred in
the middle of the strong dust lane which gives NGC 5128 its peculiar appearance, but
well offset from the active galactic nucleus. The dust lane is generally considered to
be the result of a merger with a smaller gas-rich galaxy (Baade & Minkowski, 1954;
Tubbs, 1980), and it is associated with substantial ongoing star formation, which is
indicated by strong, extended clumpy Hα emission throughout most of the dust lane
(see e.g., Bland et al., 1987). Anderson et al. (2015) found the location of SN 1986G
to be associated with detectable Hα emission, even though it is not coincident with
a bright H II region, so there is clearly a young stellar population in the immediate
vicinity. Transitional SNe Ia are often found in peculiar galaxy environments, and this
is clearly the case with SN 1986G.
Figure 5.2 shows the spectroscopic differences between these SNe Ia. All spectra
have been corrected for host galaxy extinction. A strong ∼4450 A Ti II feature is an
indicator of a subluminous SN Ia. SN 1986G is one of the few SNe Ia with an interme-
diate strength Ti II feature. Furthermore, the ratio of the Si II features (∼5970 A and
6355 A ) is a good temperature indicator (Nugent et al., 1995; Hachinger et al., 2006).
It is however an indirect temperature indicator, as it results from the saturation of the
Si II λ 6355 line. Si II becomes more abundant with respect to Si III at lower lumi-
nosities and temperatures, so that the Si II λ5970 line becomes stronger with respect
to the Si λ6355 line. SN 1986G had a larger Si II ratio compared to normal SNe Ia, but
one not as strong as a 91bg-like SN Ia. Therefore it is a transitional object. SN 1986G
is the only published SNe Ia with these properties and good observational data, which
demonstrates that these objects must be rare. SN 2011iv may also be classified as a

CHAPTER 5. SN 1986G 134
transitional SN because of its rapidly evolving LC, but it was spectroscopically normal
(Foley et al., 2012).
A detailed theoretical understanding of SN 1986G should help to determine the re-
lationship between 91bg-like and normal SNe Ia. This can be done by examining a time
series of spectra and analysing their evolution. Normal SNe Ia show properties that are
matched by delayed detonation explosions, and can be modelled using the W7 density
profile, which is similar to most delayed detonation models except in the outermost
layers (Stehle et al., 2005; Mazzali et al., 2008; Ashall et al., 2014). SN 1991bg had
a low central density (Mazzali & Hachinger, 2012), which favours a merger scenario
in which the combined mass of the merging WDs is below the Chandrasekhar mass.
Similarly, the density distribution in SN 2003hv, which had ∆M15(B)=1.61 mag, indi-
cates a Sub-Chandrasekhar mass (Mazzali et al., 2011). Subluminous SNe Ia tend to
occur in old stellar populations and are at the end of the SNe Ia parameter space (Ashall
et al., 2016). Therefore, as it has been shown that 91bg-like SNe Ia could be the re-
sult of a different progenitors/explosion mechanism than normal SNe Ia. The question
is, at which point do SNe Ia begin to depart from the standard explosion models, and
what causes them to be different? The answer may be found by analysing individual
transitional SNe Ia in detail.
This project uses the abundance tomography technique to infer the properties of
SN 1986G. It starts with a summary of the data used (Section 5.3).The quality of the
flux calibration of the spectra is then presented (Section 5.4), followed by a descrip-
tion of the modelling technique (Section 5.5). Photospheric-phase models are then
presented in Section 5.6, while Section 5.7 discusses nebular-phase models. After this
the full abundance tomography is carried out (Section 5.8). In Section 5.9 the results
are re-evaluates and a modified density profile is used to improve the fits. A synthetic
light curve is presented in Section 5.10 and compared to the bolometric light curve of

CHAPTER 5. SN 1986G 135
20 10 0 10 20 30 40 50Time realtive to maximum (days)
20
19
18
17
16
15
14
13
Abso
lute
Magnit
ude (
Mag)
SN 2011fe
SN 2004eo
SN 1986G
SN 2005bl
Figure 5.1: The B band absolute magnitude of four SNe Ia which have a variety of LC shapes.
Table 5.1: The ∆ M15(B) and absolute B band magnitude of the SNe Ia used in Figures 5.1and 5.2.
SN ∆M15(B) MB ReferencesSN 2011fe 1.1±0.05 mag -18.99 Munari et al. (2013)SN 2004eo 1.47±0.07 mag -18.65 Pastorello et al. (2007)SN 1986G 1.81±0.07 mag -17.76 Phillips et al. (1987); Taubenberger et al. (2008)SN 2005bl 1.93±0.1 mag -16.45 Taubenberger et al. (2008)
SN 1986G computed from the available photometry. Finally, the results are discussed
and conclusions are drawn in Section 5.11.
5.3 Data
Abundance tomography modelling requires a time-series of spectra. The data in this
work come from a variety of sources, which are listed in Table 5.2. Six spectra pub-
lished by Cristiani et al. (1992) were used for the photospheric phase models. These
spectra cover the range from −3 d to +2 d relative to B-band maximum. This is not
ideal as it only covers a small range in velocity space, but information about the outer

CHAPTER 5. SN 1986G 136
3000 4000 5000 6000 7000 8000 9000rest wavelength
A
Flux (A
rbit
ary
Unit
s)
SN 2011fe
SN 2004eo
SN 1986G
SN 2005bl
Figure 5.2: The spectra of four SNe Ia at B band maximum. The SNe correspond to the 4 SNein Figure 5.1
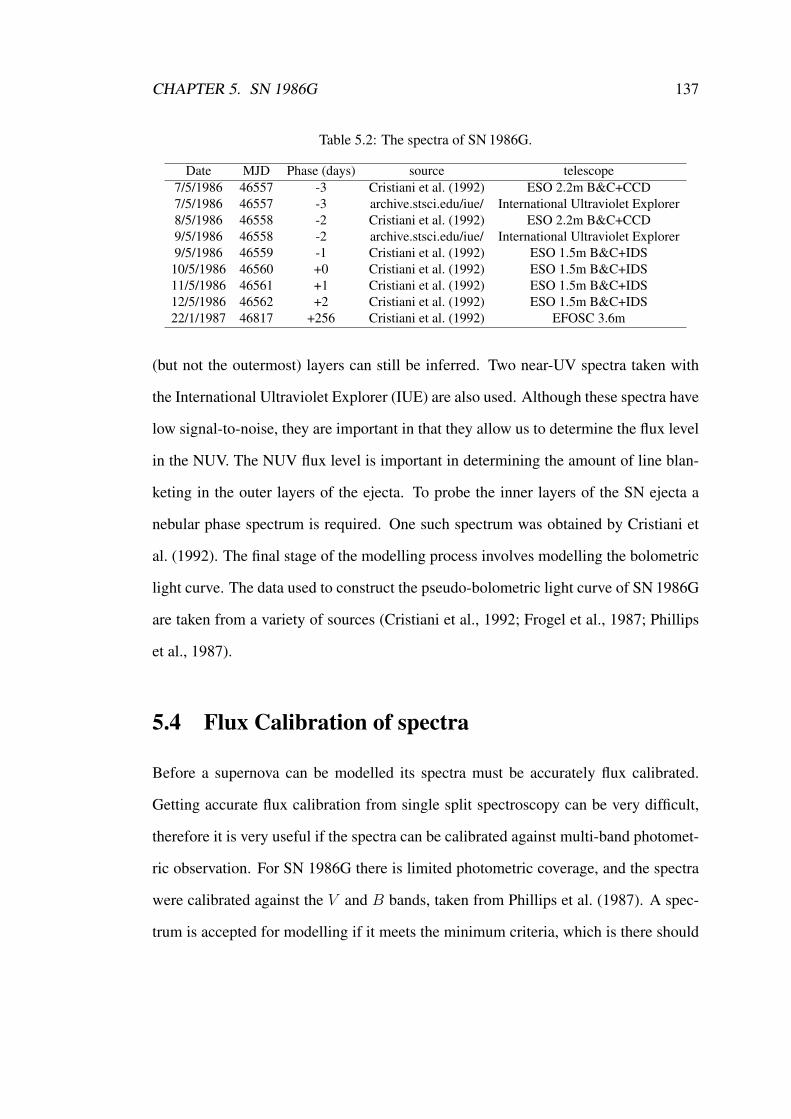
CHAPTER 5. SN 1986G 137
Table 5.2: The spectra of SN 1986G.
Date MJD Phase (days) source telescope7/5/1986 46557 -3 Cristiani et al. (1992) ESO 2.2m B&C+CCD7/5/1986 46557 -3 archive.stsci.edu/iue/ International Ultraviolet Explorer8/5/1986 46558 -2 Cristiani et al. (1992) ESO 2.2m B&C+CCD9/5/1986 46558 -2 archive.stsci.edu/iue/ International Ultraviolet Explorer9/5/1986 46559 -1 Cristiani et al. (1992) ESO 1.5m B&C+IDS
10/5/1986 46560 +0 Cristiani et al. (1992) ESO 1.5m B&C+IDS11/5/1986 46561 +1 Cristiani et al. (1992) ESO 1.5m B&C+IDS12/5/1986 46562 +2 Cristiani et al. (1992) ESO 1.5m B&C+IDS22/1/1987 46817 +256 Cristiani et al. (1992) EFOSC 3.6m
(but not the outermost) layers can still be inferred. Two near-UV spectra taken with
the International Ultraviolet Explorer (IUE) are also used. Although these spectra have
low signal-to-noise, they are important in that they allow us to determine the flux level
in the NUV. The NUV flux level is important in determining the amount of line blan-
keting in the outer layers of the ejecta. To probe the inner layers of the SN ejecta a
nebular phase spectrum is required. One such spectrum was obtained by Cristiani et
al. (1992). The final stage of the modelling process involves modelling the bolometric
light curve. The data used to construct the pseudo-bolometric light curve of SN 1986G
are taken from a variety of sources (Cristiani et al., 1992; Frogel et al., 1987; Phillips
et al., 1987).
5.4 Flux Calibration of spectra
Before a supernova can be modelled its spectra must be accurately flux calibrated.
Getting accurate flux calibration from single split spectroscopy can be very difficult,
therefore it is very useful if the spectra can be calibrated against multi-band photomet-
ric observation. For SN 1986G there is limited photometric coverage, and the spectra
were calibrated against the V and B bands, taken from Phillips et al. (1987). A spec-
trum is accepted for modelling if it meets the minimum criteria, which is there should

CHAPTER 5. SN 1986G 138
Table 5.3: The B and V sythetic photometry (mspec) taken form the spectra, and real photom-etry (mBphot) obtained from Phillips et al. (1987).
Date phase mBspec mVspec mBphot mVphot7th May -3 12.68 11.72 12.71 11.748th May -2 12.62 11.65 12.65 11.679th May -1 12.54 11.50 12.48 11.58
10th May 0 12.73 11.54 12.41 11.5311th May +1 12.52 11.38 12.51 11.4812th May +2 12.60 11.35 12.57 11.44
be a minimum accuracy level of 0.02 mag between synthetic photometry obtained from
the spectra and the real photometry, this equates to ∼1.8% in flux. The real and syn-
thetic photometry can be found in table 5.3 The original spectra are fitted through a
function, which is determined by fitting a line between the ratio in flux between B
and V photometric points obtained from the synthetic and observed photometry. The
function takes the form,
Fnew = Fold
(× ∆FV −∆FB
λV − λB(λ− λB) + FB
)(5.1)
where λB and λV are the effective wavelengths of the B and V passbands re-
spectively. Fnew is the correctly calibrated flux and Fold is the original flux from the
spectrum, and λ is the wavelength of the spectrum ( i.e. 3700-7100A). ∆Fψ from
equation 5.1 is given by,
∆Fψ = 10∆mψ−2.5 (5.2)
where ∆mψ is the difference in V or B band magnitude between the real pho-
tometry and synthetic photometry from the observed spectra, (e.g ∆mV = mVphot −
mVspec).
Figure 5.3 shows the spectrum at maximum before and after correction for flux
calibration, where it can be seen that the calibration correctly reduces the flux in the V

CHAPTER 5. SN 1986G 139
3500 4000 4500 5000 5500 6000 6500 7000 75000.0
0.2
0.4
0.6
0.8
1.0
1.2
1.4
1.6
1.81e−13
Figure 5.3: SN 1986G spectrum from 11th May. The back spectrum is the origional and thered is the spectrum after flux calibration.. The stars are the center of the B and V bands.
Table 5.4: Synthetic photometry from the new spectra.
Date phase newmBspec newmVspec7th May -3 12.70 11.748th May -2 12.65 11.679th May -1 12.49 11.58
10th May +0 12.43 11.5311th May +1 12.51 11.4812th May +2 12.57 11.45
passband, and increases it in the B-band.
5.5 Modelling Techniques
5.5.1 Photospheric phase modelling technique
The photospheric phase modelling technique is described in chapter 3.

CHAPTER 5. SN 1986G 140
5.5.2 Nebular Phase modelling technique
The nebular spectrum was modelled using a 1D NLTE code similar to Mazzali et al.
(2007). The code uses a Monte Carlo scheme to compute the propagation and deposi-
tion of the γ-rays, and positrons produced in the decay of 56Ni to 56Co and 56Fe, based
on an assumed density profile, such as W7, and an abundance distribution. In the outer
layers the abundances derived in the photospheric phase modelling are used, while in-
ner layers are filled with the abundances that lead to a best match with the observations
(Mazzali et al., 2007). The heating from the energy deposition is balanced by the cool-
ing from line emission. Given a fixed distance and extinction, the mass of synthesised
56Ni in the explosion can be computed. Using a fixed density profile allows the abun-
dance distribution in the inner layers to be determined. The ratio of the strongest [Fe II]
and [Fe III] lines is a good indicator of the late time ejecta abundances. This analysis
complements the early time spectra, and yields an abundance distribution throughout
the whole ejecta.
5.5.3 Light curve code
A Monte Carlo code is used, with a fixed density profile and derived abundance distri-
bution, to compute a synthetic bolometric light curve (Cappellaro et al., 1997; Mazzali
et al., 2001). The code computes the emission and propagation of γ-rays and positrons
as a function of time, and follows their propagation through the ejecta. When these
thermalize, optical photons are produces, whose diffusion is also followed with a Mon-
tecarlo scheme. The optical opacity is treated with a scheme which is based on the
number of effective lines as a function of abundance (Mazzali et al., 2001). This is a
good approximation, as line opacity dominates SNe Ia ejecta (Pauldrach et al., 1996)1.
1 The nebular phase modelling and bolometic LC calucations were carries out by P. Mazzali.

CHAPTER 5. SN 1986G 141
3000 4000 5000 6000 7000 8000 9000 10000
0.10.20.30.40.50.60.70.80.9
µ=27.41
3000 4000 5000 6000 7000 8000 9000 10000
0.10.20.30.40.50.60.70.80.9
µ=27.81
3000 4000 5000 6000 7000 8000 9000 10000
0.10.20.30.40.50.60.70.80.91.01.11.2 E
(B−V)=
0.5
5
µ=28.45
3000 4000 5000 6000 7000 8000 9000 10000
0.1
0.3
0.5
0.7
0.9
1.1
1.3
3000 4000 5000 6000 7000 8000 9000 10000
0.1
0.3
0.5
0.7
0.9
1.1
1.3
3000 4000 5000 6000 7000 8000 9000 10000
0.1
0.3
0.5
0.7
0.9
1.1
1.3 E(B−V)=
0.6
3000 4000 5000 6000 7000 8000 9000 10000
0.10.30.50.70.91.11.31.5
Flux [
10−
12ergs−
1cm
−2
A−
1]
3000 4000 5000 6000 7000 8000 9000 10000
0.10.30.50.70.91.11.31.5
3000 4000 5000 6000 7000 8000 9000 10000
0.10.30.50.70.91.11.31.5 E
(B−V)=
0.6
5
3000 4000 5000 6000 7000 8000 9000 10000
0.10.30.50.70.91.11.31.5
3000 4000 5000 6000 7000 8000 9000 10000
0.10.30.50.70.91.11.31.5
3000 4000 5000 6000 7000 8000 9000 10000
0.10.30.50.70.91.11.31.5 E
(B−V)=
0.7
4000 6000 8000 100000.10.30.50.70.91.11.31.5
4000 6000 8000 10000
wavelength [A]
0.10.30.50.70.91.11.31.5
4000 6000 8000 100000.10.30.50.70.91.11.31.5
E(B−V)=
0.7
5
Figure 5.4: One-zone models of SN 1986G at B band maximum, using a variety of distancemodulus and extinction values. The observed spectra are in black and the modelled in blue.

CHAPTER 5. SN 1986G 142
5.6 Photospheric models
5.6.1 Extinction and distance
The first step in modelling the photospheric spectra of a SN is to set the values for host
galaxy extinction and distance. Both of these values are very uncertain for SN 1986G.
A range of values have been published for the distance modulus of NGC 5128, ranging
from 27.41-28.45 mag (see table 5.5). A large range of extinction values have also
been quoted for SN 1986G, ranging from E(B − V )tot=0.6 to 0.9 mag (Nugent et
al., 1995; Phillips et al., 1987), including E(B − V )tot=0.78±0.07 mag with a non
standard Rv = 2.4 (Taubenberger et al., 2008). Therefore, the distance to the SN
and host galaxy extinction have been taken as free parameters. In the models there
is some degeneracy between the distance and the extinction to the SN (Sasdelli et al.,
2014). One-zone photospheric phase models of the spectrum atB band maximum were
produced, with fixed abundances, to determine the most likely range of parameters.
Figure 5.4 shows some of these one-zone models, at a range of distances from table 5.5.
Extinction values range from 0.5 to 0.9 mag and were varied by intervals of 0.05 mag.
The range of acceptable values was taken as E(B − V )tot=0.6-0.7 mag 2 and µ =
27.41 − 27.81 mag. For the modelling in this work a value of E(B − V )tot = 0.65 ±
0.5 mag and µ = 27.61 ± 0.4 mag were used, as these values yield the best fits. The
extinction is consistent with that of Nugent et al. (1995). The distance value is in
good agreement with the Cepheid distance from Ferrarese et al. (2007), who derive a
distance modulus of 27.67±0.12 mag. In the modelling process it is most important
to obtain the correct line ratios, line strengths, ionizations and velocities, as these are
independent of extinction and yield information about the SN. It is found that other
values of extinction and distance produce worse fits, even if the abundances are varied.
2 0.12 mag of this is from foreground galactic extinction (Schlafly & Finkbeiner, 2011)

CHAPTER 5. SN 1986G 143
Table 5.5: Published distances to SN 1986G.
Distance modulus (µ) Method Source28.45 ±0.8 Tully Fisher a
27.81±0.2 TRGB b
27.67±0.12 Cepheid c
27.41±0.04 Brightest Stars d
a Richter & Huchtmeier (1984)b Soria et al. (1996)c Ferrarese et al. (2007)d De Vaucouleurs (1980)
5.6.2 Density profiles
Initially, SN 1986G was modelled using two density profiles, W7 and a Sub-Ch mass
density profile. The W7 model was selected as SNe 2004eo, 2003du, 2002bo and
2014J can all be reasonably modelled with this density profile and variable amounts of
56Ni. The Sub-Ch mass density profile is an explosion with Ekin= 1.2× 1051 erg and a
total mass of 1.1M (Shigeyama et al., 1992). It has a larger density at high velocities
but contains less mass in the inner part of the ejecta compared to W7.
5.6.3 Photospheric models
The photospheric phase spectra of SN 1986G are dominated by lines of intermediate
mass elements, which is consistent with the low 56Ni mass and rapid LC decline of
the SN, and may indicate a stronger deflagration phase. This section discusses the
input parameters and the properties of the synthetic spectra at each epoch. Figure 5.5
presents the synthetic spectra for the photospheric phase of SN 1986G. For both the
W7 and Sub-Ch mass models a rise time to B band maximum of 18 days is adopted.
This is smaller than for normal SNe Ia (e.g., Mazzali et al., 1993), but is typical for a
SNe Ia with a fast LC shape. This is because the ejecta of a low-luminosity SN have a
smaller opacity and a shorter photon diffusion time as they contain less NSE material

CHAPTER 5. SN 1986G 144
(Mazzali et al., 2001). There is very little difference between the two density profiles
within the velocity range sampled by the photospheric models (7000-10000 kms−1).
The main differences are in the inner part of the ejecta, which is sampled by nebular
phase modelling.
Figure 5.5 shows the spectral evolution of SN 1986G between 3 days before and 2
days after B band maximum. The spectra are dominated by Si II, S II, Fe II, Mg II, Ti
II and Cr II lines. Ti II ∼4450 A is not typical of normal SNe Ia, where Ti is normally
doubly ionised. Most of the lines from Ti III are however in the UV, <3500 A.
5.6.4 -3 days
The top spectrum in Figure 5.5 was observed 3 days before B band maximum. The
synthetic spectrum has a photospheric velocity of 10000 km s−1, and bolometric lumi-
nosity of log10L=42.55 erg s−1. The converged temperature of the underlying black-
body is 8900 K for the W7 density profile and 9100 K for the Sub-Ch density profile.
The effective temperature (Teff ) is 8600 K for the W7 density profile and 8700 K for
the Sub-Ch density profile. For the W7 density profile the composition is dominated
by oxygen (61% by mass), but it also requires some unburnt carbon (2% by mass),
IME (Si 26%, S 6%, Ca 2%, Mg 2%), and traces of heavier metals (Ti+Cr 0.36% and
Fe 0.15%). Using the Sub-Ch density profile, the synthetic spectrum is dominated by
O (52% by mass), with 2% unburnt carbon. IME make up a large fraction of the ejecta
(Si 25%, S 15%, Mg 2%, Ca 2%), with the rest consisting of heavier elements (Ti 2%,
Cr 2.5%, Fe 0.08%).
5.6.5 -2 days
The second spectrum in Figure 5.5 was modelled at 16 days after explosion. There
is very little spectral evolution compared to the previous epoch. Using the W7 den-

CHAPTER 5. SN 1986G 145
3000 4000 5000 6000 7000 8000 9000 10000
wavelength [A]
0
1
2
3
4
5
6
Flux [
10−
12ergs−
1cm
−2
A−
1]
+C
ON
ST.
tB=-3 days
tB=-2 days
tB=-1 days
tB=+0 days
tB=+1 days
tB=+2 days
CII
SiII
SiIISII
FeII S
iII
TiII
MgII
SiII
TiII
CrI
I
CaII, SiII
CrI
I
TiII OII
CaII
W7
sub-Ch
Figure 5.5: The photospheric phase models of SN 1986G, where the spectra have been shiftedin flux by a constant for clarity. Models for both the W7 (blue solid) and Sub-Ch (red dashed)density profiles are shown. The spectra have been corrected for extinction.

CHAPTER 5. SN 1986G 146
Table 5.6: Input parameters and calculated converged black body temperatures for models fromthe W7 and Sub-Ch density profiles.
Epoch velocity Bol Lum Temperature velocity Bol Lum Temperaturetrise vph L TBB vph L TBBdays km s−1 logL K km s−1 log(L) K
W7 W7 W7 Sub-Ch Sub-Ch Sub-Ch15 10000 8.960 8900 10000 8.96 910016 9400 8.990 9100 9200 9.00 950017 8800 9.040 9500 8900 9.040 960018 8100 9.060 10000 8500 9.070 970019 7800 9.050 9700 7200 9.050 1030020 7600 9.050 9500 7000 9.050 10100
sity profile a photospheric velocity of 9500 kms−1 is required, as well as a bolometric
luminosity of log10L=42.57. The Teff at this epoch is 8700 K. This spectrum is domi-
nated by oxygen (61%), while IME make up 38% of the elements in this shell (Si 30%,
S 6%, Ca, 2%). The Ti, Cr and stable Fe abundances have all increased (Ti+Cr 1.1%,
Fe 0.2%), relative to the higher velocity spectrum. This is required as the Ti ∼4450 A
feature progressively gets stronger over time. The IUE spectrum has been used to set
the flux level in the UV and to constrain the Cr abundance.
The Sub-Ch density profile produces slightly different results. The effective tem-
perature at this epoch is 9200 K, and the photospheric velocity is 9200 km s−1. This
layer of the ejecta requires no carbon, and is dominated by oxygen (50%). In this shell
the S abundance drops to 5%, whereas the Si abundance increases to 35%. This is un-
usual for a SN Ia as one would expect S to propagate to slightly lower velocities than
Si as a consequence of the nucleosynthesis reaction chain described by Nomoto et al.
(1984). However, the S II feature at 5640A is fit almost perfectly by the model at this
epoch, and increasing the S abundance would worsen the fit. It should be noted that
in the abundance distributions of SNe 2004eo and 2011fe the S abundance does not
propagate as deep as that of Si (Mazzali et al., 2008, 2015). Using the Sub-Ch density
profile the abundances of Ti+Cr (8%) and Fe (1.3%) are higher than those needed for

CHAPTER 5. SN 1986G 147
the W7 model. The Ti +Cr abundance is required to be this high to fit the blue edge of
the 4200A feature. Without this high abundance there is no absorption at 4100A .
5.6.6 -1 days
The third spectrum in Figure 5.5 was taken at -1 day relative to B band maximum.
This spectrum was modelled as 17 days after explosion. The synthetic spectrum pro-
duced using the W7 density profile is a very good fit to the observed one. The fea-
ture at ∼ 4900A has resolved into separate Fe II lines, and the W7 density profile fits
all of these lines at the correct velocities. The photospheric velocity at this epoch is
8900 kms−1, with a bolometric luminosity of 1042.63 erg s−1 and a Teff of 9200 K. This
shell is still dominated by oxygen, however at this epoch the abundance of oxygen
is starting to decrease. The oxygen fraction is 50% by mass. The Si abundance has
increased to 35%, and that of Ti+Cr to 1.5%.
The Sub-Ch model has vph = 8900 kms−1 and a bolometric luminosity of log10L=42.60.
At this epoch oxygen still dominates at 44%, but IMEs also significantly contribute to
the spectrum (Si 37%, S 5%, Ca 2%). Relative to the previous epoch the Ti+Cr abun-
dance has decreased to 6.5%, but the Fe abundance has increased to 5%. The effective
temperature at this epoch is 9400 K.
5.6.7 +0 days
IMEs begin to dominate the ejecta at this epoch, which is at B band and bolometric
maximum. For the W7 model, the Si and S abundances are 65% and 13%, respec-
tively. This spectrum was computed with a photospheric velocity of 8100 kms−1 and
a bolometric luminosity of log10L=42.65. The effective temperature at this epoch is
9700 K, while the combined Ti+Cr abundance has increased to 1.8%.
The Sub-Ch model for this spectrum has a log10L=42.66 a vph = 8500 kms−1

CHAPTER 5. SN 1986G 148
and an effective temperature of 9600 K, the photospheric velocity has hardly changed
compared to the previous epoch. IMEs also begin to dominate the Sub-Ch model (Si
40%, S 5%, Ca 8%).
5.6.8 +1 days
This spectrum was observed at +1 day relative to B band maximum. The photospheric
velocity (7800 kms−1) has only slightly decreased (by 300 kms−1 ) compared to the
previous epoch. The model at the epoch has a luminosity of log10L=42.64. Because of
the small change in photospheric velocity from the previous epoch there is practically
no spectral evolution. Therefore the abundances have not changed significantly. The
effective temperature of this shell is 9600 K.
The Sub-Ch model at this epoch contains no S near the photosphere, although
there is still 34% of oxygen left in the ejecta. This may indicate that the Sub-Ch
density is not a good solution and cannot explain the mechanism and progenitor of
SN 1986G. There is an increase in Fe abundance at this epoch (7%), and the Ti+Cr
abundance is 4%. The effective temperature of the Sub-Ch model is 10200 K. The
model at the epoch has a luminosity of log10L=42.64, and a photospheric velocity of
7200 kms−1.
5.6.9 +2days
The last W7 photospheric model for the spectrum at +2 days (20 days from explosion).
It is shown in Figure 5.5. It has a vph=7600 km s−1, Teff=9300 K and log10L=42.62 erg s−1.
This shell has 75% Si and 10% S. The Ca at this epoch is 0.3%.
The final Sub-Ch model still has a large mass of oxygen (30%), but this epoch is
dominated by Si (56%). The Ti and Cr abundances have stayed constant, but the Fe
abundance has increased to 8%. The effective temperature at this epoch is 10100 K.

CHAPTER 5. SN 1986G 149
There are some doubly ionized species in the spectrum at this time, Fe III and Cr III
indicated by the features at ∼ 5000A and ∼3700A respectively. These doubly ion-
ized species correspond to the effective temperature increase, compared to the +1 days
model. The W7 model has fewer doubly ionized species.
At every epoch in the Sub-Ch model there is a deep Ti II absorption at ∼ 7300A.
This feature is not seen in the W7 models, nor in the observed spectrum, and it is
produced because the Sub-Ch model has more mass at high velocities. It is another
indication the Sub-Ch density profile is a poor solution compared to the W7 model.
However, apart from this feature, it could be argued that the Sub-Ch density profile
produces better fits. The full input parameters for the photospheric models can be
found in Table 5.6. The photospheric velocity of SN 1986G is lower than would be
expected for a normal SNe Ia. The photospheric phase models probe layers above
7000 km s−1 in velocity. The bolometric luminosity of the models peak at +0 days
compared to B band maximum, which is expected from a SN with a steep light curve.
5.7 Nebular phase models
A single nebular spectrum of SN 1986G is available, which was published by Cristiani
et al. (1992) and was obtained ∼ 256 days after maximum. The spectrum shows the
usual nebular SN Ia features, strong Fe II and Fe III lines in the blue and a mix of
Ca II and Fe II lines in the red. It is significantly affected by reddening, to the point
of showing self-absorption in the NaID line as well as a narrow Hα absorption in the
middle of a weak Fe II emission complex.
The abundance tomography experiment has been completed by modelling the neb-
ular spectrum using two different density distributions: the original W7 model and the
Sub-Ch model discussed above.

CHAPTER 5. SN 1986G 150
The nebular spectrum code which has been used in the past to model both SNe Ia
(e.g. Mazzali et al., 2015) and SNe Ib/c has been used (e.g. Mazzali et al., 2007, where
a more detailed description of the code can be found). The code computes the diffusion
and deposition of gamma-rays and positrons produced by the radioactive decay of 56Ni
and 56Co in the SN ejecta using gray opacities in a Monte Carlo scheme. The ensu-
ing collisional heating of the SN ejecta is then balanced by cooling via line emission,
following Axelrod (1980). The balance between radiation and gas properties is com-
puted in non-local thermodynamic equilibrium (NLTE). The abundances in the ejecta
were adjusted to optimise the fit, except at the velocities where abundances were de-
termined from early-time spectral modelling. These are regions with velocities above
7000 kms−1, which are not sampled by the nebular emission lines. A simple one-zone
fit to the spectrum yields a model line velocity of 5600 kms−1, which is also in line
with the fast evolution of the light curve of SN 1986G (Mazzali et al., 1998, 2007).
The two best-fit models are shown in Figure 5.6. Although the models are over-
all quite similar in the kind of emission lines that are predicted, there are significant
differences which can help us discriminate between them. The individual models are
discussed in turn.
The W7 model (dashed/blue line) produces a good match in particular to the blue
part of the spectrum. A 56Ni mass of 0.13 M is required. Because the inner region
in W7 is quite dense, material other than 56Ni must be used to fill it. Stable Fe-group
elements are produced in the centre of Chandrasekhar-mass explosions, and it is found
that a total mass of about 0.11M is required. This is dominated by stable Fe. Stable
Fe-group material is important as it acts only as a coolant, so its presence contributes
to balancing the heating from radioactive decay and to keeping the ionization ratio
(in particular Fe III/Fe II) close to the observed value. The mass included within a
velocity of 5600 kms−1 in W7 is ∼ 0.4M, and NSE material does not reach this

CHAPTER 5. SN 1986G 151
value. The remaining mass is attributed to intermediate-mass elements, in particular
Si, which leads to a strong predicted emission in the NIR, near 1.6µm. The line near
5900 A is predominantly NaID. The strong emission near 7300 A is well reproduced as
a combination of Fe II and Ca II with a minor contribution from Ni II . The narrowness
of the emission lines leads to the observed split between the two features. In fact, a hint
of a split can be seen even in the emission feature near 5200 A. This is due just to lines
separating out, as in, e.g., SN 2003hv (Mazzali et al., 2011), and not to double peaks
caused by the morphology of the explosion. Other Fe II lines are not well reproduced,
however. In particular, the feature near 6600 A is too weak in the model, while the
broad blend near 9000 A is too strong. These shortcomings are seen in most of the
SN Ia models produced with this code, but to a much lesser degree (e.g. Mazzali et al.,
2015). They may partially depend on uncertain collisional rates, and they indicate that
the 56Ni mass may be slightly overestimated. On the other hand, the extreme deviation
of the redder lines in SN 1986G may also indicate problems with the density structure
(see e.g. Mazzali et al., 2011), or issues with the red part of the observed spectrum.
Note that in a well-observed SN Ia like SN 2011fe the ratio of the Ca-Fe emission near
7300 A and that of the Fe complex near 9500 A is ∼ 1. In the spectrum of SN 1986G,
after correcting for reddening, the ratio is ∼ 2, but our model has a ratio of ∼ 1.
Unfortunately no other nebular spectrum is available of either SN 1986G or of SNe
that closely resemble it, so this cannot be verify.
The Sub-Ch model (green line) show in figure 5.6, has several problems, com-
pared to the W7 one. Primarily, the ionization of Fe is too high. This is shown by
the excessive strength of the emission near 4700 A when the model matches that at
5200 A. Note that the model displayed is reddened, which depresses the bluer feature
significantly. This behaviour was seen in a peculiar SN, SN 2003hv (Mazzali et al.,
2011), and was interpreted there to indicate low densities at low velocities, which is

CHAPTER 5. SN 1986G 152
4000 5000 6000 7000 8000 9000
wavelength [A]
0
1
2
3
4
5
Flux [
10−
16ergs−
1cm
−2
A−
1]
Figure 5.6: The nebular phase models of SN 1986G. The blue spectrum was obtained usinga W7 density profile and the green spectrum using the Sub-Ch profile. The black line is theobserved spectrum. The spectra have been corrected for extinction.
exactly what a Sub-Ch model predicts, and a consequent lack of stable NSE material,
leading to insufficient cooling and hence recombination. The Fe II lines in the red are
actually depressed relative to the line at 5200 A. The model contain an ejecta mass of
only ∼ 1M. Most of the missing mass is stable NSE material, the mass of which has
gone down to 0.1M, mostly stable Fe at intermediate velocities. Intermediate-mass
elements just above the 56Ni zone again lead to strong Si emission in the NIR. The
incorrect ratio of the optical Fe lines is a strong argument against this model, which is
not favoured.
5.8 Abundance tomography
Figures 5.7 and 5.8 show the abundance distributions of SN 1986G as a function of
velocity and enclosed mass. At velocities below 7000 kms−1 the nebular modelling
determines the distribution, and at velocities above 7000 kms−1 the photospheric mod-

CHAPTER 5. SN 1986G 153
els determine the distribution. Above∼12000 kms−1 certain aspects of the distribution
can be inferred, but this is where the results are most uncertain because early data are
not available. However, incorrect abundances in the outer layers can make it impossi-
ble to produce a good synthetic spectrum in the inner layers, so it can assumed that the
description of the outer layers is not completely unreasonable.
Figure 5.7 is the abundance distribution produced using the W7 density profile.
An upper limit to the abundance of carbon is set to a mass of 0.02M. All of this pro-
genitor carbon is at high velocities, >10000 kms−1. The outer layers of the ejecta are
dominated by oxygen, which is seen throughout the whole of the photospheric phase,
but the part of the observed spectra where the oxygen would expected to be, ∼7500 A,
was not observed. It is reasonable to infer a high oxygen abundance in SN 1986G,
because of its similarities with 91bg-like SNe, which show a strong oxygen feature.
Furthermore, the fact that carbon is detected in the spectra is a good indication that
oxygen will be present between layers where the carbon and IME dominate. The final
masses from the W7 abundance distribution can be found in Table 5.7. Masses have
been quoted to the second decimal place, but does not mean accuracy to this degree. It
is required as there are elements which do not have a mass greater than 0.1M. IMEs
dominate the abundance distribution of the SN at intermediate velocities. The S dis-
tribution follows the Si distribution at velocities down to ∼7000 kms−1, with a lower
ratio than traditionally would be expected. The typical ratio of Si to S is 3 to 1. The S
abundance drops to 0 at v ∼6000 kms−1. The enclosed mass range in which Si dom-
inates is from 0.75M to 0.19M. This is very different from SN 1991T, which sits
at the opposite end of the ‘Phillips Relation’, where Si dominates only in the enclosed
mass range of ∼1.05M to 1.07M (Sasdelli et al., 2014). The large amount of Si
in SN 1986G corresponds to a small amount of 56Ni being produced in the explosion
(Mazzali et al., 2007). This agrees with SN 1986G having a low luminosity and partial

CHAPTER 5. SN 1986G 154
burning. There is no evidence for mixing of 56Ni to high velocities for SN 1986G. A
56Ni mass of 0.13M is obtained from the abundance distribution. Most 56Ni is lo-
cated in the denser inner layers. At velocities between 1000 km s−1 and∼ 3500 km s−1
Fe and 56Ni dominate the ejecta. The innermost layers of the SN 1986G W7 density
profile model are dominated by stable Ni, and 56Ni is further out in the ejecta, between
an enclosed mass of ∼0.1 and ∼ 0.55M. This is consistent with the burning that a
fast deflagration such as that of a W7-like model predicts. The Ti+Cr abundances peak
in the velocity range 8000-9000 kms−1. Their combined integrated mass is of the order
of 0.01M.
The abundance distribution produced using the Sub-Ch density profile is dramati-
cally different from that of the W7 density profile, as shown in Figure 5.8. The total C
mass is 0.04M. There is evidence for carbon down to an enclosed mass of ∼0.7M.
The outer layers consist almost entirely of oxygen. The oxygen zone is large com-
pared to a normal SN Ia. Oxygen dominates down to 6000 km s−1, and is present
down to velocities as low as 4000 kms−1 with abundances of the order of 20%. Be-
tween 6000 km s−1 and 4000 km s−1 IMEs dominate, and NSE material dominates the
inner layers of the ejecta. The total amount of 56Ni in the ejecta of SN 1986G, assum-
ing a Sub-Ch density profile, is 0.11M. The abundance distributions produced using
the Sub-Ch model imply that this explosion scenario is not a valid one for SN 1986G.
Oxygen probes to deeper layers of the ejecta than sulphur, which is in direct conflict
with nucleosynthesis calculations and expected results. The zone where IMEs dom-
inate has an unusually small velocity range of 500 kms−1. Overall, the abundance
yields and distribution from the Sub-Ch model do not agree with nucleosynthesis and
explosion models.

CHAPTER 5. SN 1986G 155
0.01
0.1
1
10
100
0 0.2 0.4 0.6 0.8 1 1.2
ma
ss f
ract
ion
[%
]
enclosed mass [Msun]
velocity [km/s]2500 5000 7500 10000 12500 15000 17500
CO
MgSiS
CaTi+Cr
Fe0Ni
56Ni0
Figure 5.7: The abundance distribution of SN 1986G obtained with the W7 density profile.
Table 5.7: Integrated abundances from the full abundance tomography modelling of SN 1986G.The errors on the masses are ±25%, except for 56Ni which has an error of ±10%.
Element W7 Sub-ChM M
C 0.02 0.04O 0.49 0.51
Mg <0.01 <0.01Si 0.50 0.26S 0.05 0.04
Ca 0.02 0.01Ti+Cr 0.01 0.02
Fe 0.11 0.0956Ni 0.13 0.11Ni 0.04 0.01Mtot 1.38 1.11

CHAPTER 5. SN 1986G 156
0.01
0.1
1
10
100
0 0.2 0.4 0.6 0.8 1
ma
ss f
ract
ion
[%
]
enclosed mass [Msun]
velocity [km/s]2500 5000 7500 10000 12500
CO
MgSiS
CaTi+Cr
Fe0Ni
56Ni0
Figure 5.8: The abundance distribution of SN 1986G obtained with the Sub-Ch density profile.

CHAPTER 5. SN 1986G 157
5.9 A consistent, reduced-energy model
5.9.1 Energy estimates
With the integrated masses obtained form the abundance tomography modelling, the
kinetic energy of the explosion can be derived, using equation 1.2. It is found that the
Ekin of the explosion is 0.8 × 1051 erg, using the masses derived by the W7 density
profile model 3. The Ekin calculated from the abundances obtained using the W7 den-
sity profile is smaller than the value for the standard W7 explosion, which has Ekin
= 1.3×1051 erg. Therefore, there is a discrepancy between the input density profile
and the Ekin derived from the nucleosynthesis. This discrepancy is an issue if one
wants to solve the progenitor scenario and explosion mechanism of SN 1986G. For
the Sub-Ch density model, EBE = 0.21 × 1051 erg (Yoon & Langer, 2005), which
equates to a Ekin of 0.55 × 1051 erg (the Ekin of the Sub-Ch explosion model that we
used is 1.2 × 1051 erg), so again the model has a larger Ekin than that inferred from
nucleosynthesis.
Therefore an attempt is made to develop a density profile that both fits the spectra
and is consistent with nucleosynthesis. Given what is discussed above, this has to be a
low energy density profile. In this section such a profile will be built and tested. This
is done by scaling the W7 density profile to a lower Ekin using equations 5.3 and 5.4.
ρ′ = ρW7
( E ′
EW7
)− 32 ·( M ′
MW7
) 52
(5.3)
v′ = vW7
( E ′
EW7
) 12 ·( M ′
MW7
)− 12
(5.4)
In these equations ρ′ is the new density, ρW7 is the W7 density, E ′ is the energy
3 For a Chandrasekhar mass WD EBE = 0.46× 1051 erg.

CHAPTER 5. SN 1986G 158
5000 10000 15000 20000 25000
velocity km/s10-4
10-3
10-2
10-1
100
101
densi
ty [g/cm
−3] at
t=1
00
s
w7
Sub-Ch
W7e0.7
Figure 5.9: The W7, Sub-Ch and W7e0.7 density profiles as a function of velocity at t=100 safter explosion. The vertical grey lines show the range in values vph can take, for the -3 d to+2 d models.
of the new density profile, EW7 is the energy of the W7 density profile, M ′ is the mass
of the new density profile and MW7 is the mass of the W7 density profile, vW7 is the
velocity of the W7 density profile, and v′ is the velocity of the new profile.
The density profile was scaled keeping the mass at the Chandrasekhar mass and
scaling the energy to 70% of that of the W7 density profile to match the Ekin inferred
from the nucleosynthesis, and for convenience it is called W7e0.7. This rescaling has
been shown to work well for SN 2005bl. However, this SN was only modelled in the
photospheric phase (Hachinger et al., 2009), as late-time spectra were not available.
Therefore, placing the mass in the inner layers may not have been the perfect solution
(see Mazzali et al., 2011). In contrast, SN 1986G has good nebular data, so it is possible
to tell if this increase in central density can be a realistic solution.
Figure 5.9 shows the W7, Sub-Ch and W7e0.7 density profiles at t=100 s after
the explosion. Compared to W7, the Sub-Ch density profile has more mass at higher
velocities and a lower central density, whereas the W7e0.7 model has a higher central
density and less material at high velocities, and hence a smaller Ekin. To decrease the
energy in the W7 model, the mass which was removed from the high velocities was

CHAPTER 5. SN 1986G 159
redistributed to the inner part of the ejecta.
5.9.2 Photospheric-epoch models
Figure 5.10 shows the synthetic spectra produced with all three density profiles at
−3 days relative toB band maximum. The green line is the W7e0.7 model. This model
fits the data (black line) very well, the Si II line ratio is correct, and the sulphur and
Fe features are fit almost perfectly. The fact that the W7e0.7 density profile produces
a good fit is reason for the full abundance tomography analysis to be carried out using
the W7e0.7 density profile, with the aim of getting a consistent model.
The full photospheric models obtained with the new, W7e0.7, density structure
are presented in Figure 5.11. The models were remade using the same input param-
eters as those for the W7 model in Table 5.6. The only elements which changed in
abundance, in velocity space, were Ti+Cr, with their mass fraction increasing to ∼ 3%
at 8000 km s−1. In the W7e0.7 spectra, the ratio of the strongest Si II features (6355
and 5970 A) has improved and the Ti 4450 A feature fits significantly better. These
improvements could be caused by the bump in the density profile moving inwards in
velocity space. This causes there to be an increase in density closer to the photosphere.
This bump is still in the oxygen zone, but there is also an increase in the Si abundance.
The improvements are also due to a lack of material at high velocities. It is apparent
that a steeper density than the standard W7 model is required above 12500 kms−1.
5.9.3 Carbon
From Figure 5.5 it is apparent at -3 and -2 days that there is some C II in the spectra,
at∼ 6350A. As there are no observed spectra before -3 days it is not possible to put an
exact constraint on the amount of unburnt carbon in the ejecta, therefore the next part
of the analysis attempts to constrain an upper limit on the C abundance. The synthetic

CHAPTER 5. SN 1986G 160
3000 4000 5000 6000 7000 8000 9000
wavelength [A]
0.0
0.2
0.4
0.6
0.8
Flux [
10−
12ergs−
1cm
−2
A−
1]
Figure 5.10: One-zone models at -3 days relative to B band maximum. The synthetic spectrawere produced using the W7 (blue), W7e0.7 (green) and Sub-Ch (red dashed) density profiles.The spectra have been corrected for extinction.
spectra produced using the W7e0.7 density profile has 3 synthetic shells based above
the -3 days, 10000 kms−1, outer shell. The purpose of having these synthetic layers
is to produce a stratified abundance distribution. If the distribution is not stratified the
model spectra will produce a poor fit. Figure 5.12 shows the -3 day spectrum over a
wavelength range of 6200-6600 A, where unburnt carbon would be seen in the ejecta.
In order to produce the best fit of this C II feature the W7e0.7 model requires a carbon
abundance of 13% at 23000 kms−1, 10% at 17550 kms−1, 5% at 12000 kms−1 and 2%
at 10000 kms−1. Increasing the 12000 kms−1 layer to an abundance of 12% produces
the green line in Figure 5.12, and having zero carbon in the ejecta produces the blue
line in Figure 5.12, both of which yield a worse fit. When determining the best fit it
is important to only examine the spectra between 6300-6450A as this is where the C
II λ 6578 and λ 6582 lines will be seen, blue-ward of this is Si II absorption and red-
ward is continuum. The integrated carbon mass abundance from the best fit using the
W7e0.7 density profile is 0.02M.

CHAPTER 5. SN 1986G 161
3000 4000 5000 6000 7000 8000 9000 10000
wavelength [A]
0
1
2
3
4
5
6
Flux [
10−
12ergs−
1cm
−2
A−
1]
+C
ON
ST.
tB=-3 days
tB=-2 days
tB=-1 days
tB=+0 days
tB=+1 days
tB=+2 days
CII
SiII
SiIISII
FeII S
iII
TiII
MgII
SiII
TiII
CrI
I
CaII,
SiII
CrI
I
OII
CaII
Figure 5.11: The photospheric phase models of SN 1986G, calculated using the W7e0.7 densityprofile. The blue line are the models and the black line the observed spectra. The spectra havebeen corrected for extinction.

CHAPTER 5. SN 1986G 162
6200 6250 6300 6350 6400 6450 6500 6550 6600wavelength [
A]
0.36
0.38
0.40
0.42
0.44
0.46
Flux [
10−
12ergs−
1cm
−2
A−
1]
Figure 5.12: Synthetic spectrum at -3 days produced using the W7e0.7 density profile to con-strain an upper limit on carbon. The blue line is the model with 0% of C, the red dashed linewith the 2% C and the green line with 10% C at the photosphere. The black line is the observedspectra.
4000 5000 6000 7000 8000 9000
wavelength [A]
0.0
0.5
1.0
1.5
2.0
2.5
3.0
3.5
4.0
Flux [
10−
16ergs−
1cm
−2
A−
1]
Figure 5.13: The nebular phase models of SN 1986G. The green line is the model calculatedusing the W7e0.7 density profile. The spectra have been corrected for extinction.

CHAPTER 5. SN 1986G 163
5.9.4 Nebular-epoch model
A nebular phase model was produced using the W7e0.7 density. It is shown as a green
line in Fig. 5.13. This density profile has more mass at low velocity (∼ 0.50 M
within 5600 kms−1 as opposed to ∼ 0.40 for W7). The 56Ni mass is now ∼ 0.14
M, but the higher density at low velocities results in a larger mass of stable NSE
material, ∼ 0.21 M, most of which is stable Fe. This is in line with Mazzali et
al. (2007). The additional cooling provided by the stable NSE material leads to the
correct reproduction of the Fe II/Fe III line ratio in the blue, but it does not solve
the problem of the excessive Fe II emission in the red, where the synthetic spectrum
predicts excessively strong lines. As is argued above, there may be a problem with our
model, but also with the redder part of the observed spectrum itself. Nebular-epoch
observations of SN 1986G-like SNe are encouraged in order to assess the reality of the
red flux.
5.9.5 Abundance stratification
The abundance stratification of the W7e0.7 model can be seen in Figure 5.14. The
oxygen layer dominates the ejecta down to velocities of ∼ 9000 km s−1. IMEs dom-
inate the bulk of the ejecta at velocities between ∼ 9000 km s−1 and ∼ 3500 km s−1.
Below ∼ 3500 km s−1 NSE material dominates, with the ejecta consisting entirely of
stable Ni in the innermost 1000 km s−1. 56Ni is more evenly distributed than in the W7
model. The 56Ni abundance peaks at 40% in the velocity range 4000 − 6000 kms−1.
It is also seen in the ejecta down to a velocity of 1000 kms−1. In the models produced
using the W7 and Sub-Ch density profiles, oxygen probes to deeper layers of the ejecta
than sulphur, which is in direct conflict with SNe Ia nucleosynthesis calculations and
explosion models (Iwamoto et al., 1999). However, in the W7e0.7 model sulphur is re-

CHAPTER 5. SN 1986G 164
Table 5.8: Integrated abundances for the W7e0.7 models. The errors on the masses are ±25%,except for 56Ni which has an error of ±10%.
Element W7 E70%M
C 0.01O 0.33
Mg <0.01Si 0.58S 0.09
Ca 0.01Ti+Cr 0.01
Fe 0.1856Ni 0.14Ni 0.02Mtot 1.38
quired down to a velocity of∼4000 kms−1, and oxygen is only seen down to velocities
of ∼ 6000 kms−1, so the problem no longer exists.
The abundance distribution from the W7e0.7 model produces physically sensible
results, as well as good fits between the observed and synthetic spectra. The integrated
masses obtained using this density profile can be found in Table 5.8. The Ni mass
is 0.14M, with IMEs making up 0.69M and 0.34M of unburnt material. Using
equation 1.1 the kinetic energy of the ejecta can be calculated. The Ekin calculated
using this method is 0.97×1051 erg, which is consistent with the energy of the W7e0.7
density profile (0.9× 1051 erg).
5.10 Bolometric Light curves
5.10.1 Observed light curve
A bolometric light curve of SN 1986G in the range 3000-24000 A has been constructed,
using the optical and NIR photometry, and the well-monitored SN Ia 2004eo as a proxy.

CHAPTER 5. SN 1986G 165
0.01
0.1
1
10
100
0 0.2 0.4 0.6 0.8 1 1.2
ma
ss f
ract
ion
[%
]
enclosed mass [Msun]
velocity [km/s]2500 5000 7500 10000 12500 15000
CO
MgSiS
CaTi+Cr
Fe0Ni
56Ni0
Figure 5.14: The abundance distribution of the ejecta of SN 1986G obtained using the W7e0.7density profile.
CHAPTER 5. SN 1986G 166
As a first approach, the optical (UV B) and NIR (JHK) light curves of SN 1986G
are dereddened usingE(B−V )tot = 0.65 mag and the extinction curve of Cardelli et al.
(1989). These points are then splined with a time resolution of 1 day and constructed
daily spectral energy distributions in the above wavelength interval using the flux zero-
points of Fukugita et al. (1995). For each epoch, the flux between the U and K bands
is integrated after interpolating the flux between the central wavelengths of the filters,
and added at the blue and red boundaries of the interval the fluxes obtained by extrapo-
lating the spectrum with a flat power-law to 3000 and 24000 A, respectively. The final
bolometric LC is then resampled to the epochs of the actual V-band observations.
The lack of significant coverage in R and I bands (only a couple of points are
available in each of these bands) represents a serious drawback, because the interpo-
lation between V and J bands overestimates the R and I flux. Therefore, the final
bolometric LC must be considered as an upper limit to the “real” one (which I will
call ‘ULbol86G’). On the other hand, if I only integrate separately the flux in UBV
and in JHK filters over the 3000-6000 A and 10000-24000 A ranges, respectively, and
sum these two broad-band fluxes, I neglect completely the flux contribution in R and
I bands, so that the resulting bolometric LC must be considered as a lower limit of the
true one (‘LLbol86G’). Clearly, the real bolometric LC must be somewhere between
ULbol86G and LLbol86G.
To evaluate the necessary bolometric corrections in the most rigorous way possi-
ble and thus to obtain a reliable estimate of the bol LC of SN 1986G, SN Ia 2004eo
has been used, as it had good coverage in all bands between U and K (Pastorello et
al., 2007; Mazzali et al., 2008), as is a plausable analogue of SN 1986G. Since U and
JHK bands coverage for SN 2004eo is only available after maximum, the flux is re-
constructed in these bands before maximum assuming that the U − B, J − I , H − I
and K − I colours before maximum are constant and equal to the values they have at

CHAPTER 5. SN 1986G 167
maximum. The UBV RIJHK light curves of SN 2004eo, dereddened with E(B−V )
= 0.109, were splined with a time resolution of 1 day, and spectral energy distributions
were constructed and integrated over the range 3000-24000 A, as for SN 1986G. This
is the reference bolometric light curve, which will be called the ‘template’ bolometric
LC.
Two more bolometric light curves were constructed for SN2004eo in the same
wavelength intervals as ULbol86G and LLbol86G above, and ignoring the R and I
bands: first I interpolated the spectral flux between V and J - this will be called UL-
bol04eo - and then summed the spectral flux in the UBV filters (3000-6000A) and
in the JHK filters (10000-24000A). This bolometric LC will be called LLbol04eo.
Bolometric corrections for SN 2004eo with respect to the ‘template’ were computed
by simply differencing the template and its upper (ULbol04eo) and lower (LLbol04eo)
limits. Then, these differences were applied, with their signs, to the limits obtained
for SN 1986G, ULbol86G and LLbol86G, so that 2 ‘corrected’ bolometric LCs for
SN 1986G were obtained. The ‘real’ bolometric LC of SN 1986G was obtained by
averaging these 2 ‘corrected’ bolometric light curves 4.
5.10.2 Synthetic light curve
In the spirit of abundance tomography, the density distributions and the abundances
derived through synthetic spectra fitting are combined and a bolometric light curve is
computed, which is compared to the one constructed based on the observed SN pho-
tometry. A Monte Carlo code (Cappellaro et al., 1997) is used which computes the
emission of gamma-rays and positrons following the radioactive decay of 56Ni and
56Co and their deposition in the ejecta. The 56Ni distribution is derived from the spec-
tral fitting. Gamma ray deposition is computed with a grey opacity of 0.027 cm2 g−1,
4 The observed bolometric LC was computed by E. Pian.
CHAPTER 5. SN 1986G 168
and for positrons a grey opacity of 7 cm2 g−1 is used.
After deposition of the gamma-ray and positron energy, the resulting energy is
assumed to be thermalised and energy packets representing photons are then followed
as they propagate through the SN ejecta. The opacity they encounter is assumed to be
dominated by line opacity and is parametrised according to the relative abundances at
different depths according to the number of active lines as in Mazzali (2000):
κ = 0.25Ab(Fe− gp) + 0.025× (1− Ab(Fe− gp))
The results for the different models are shown in Figure 5.15 along with the obser-
vationally derived bolometric light curve. At peak, the Sub-Ch model (red/dot-dashed
line) reaches maximum within 12-13 days, which appears to be a short time compared
to the observed light curve. The early declining part of the light curve also happens
too early in this model, but then at epochs between 60 and 300 days this model follows
the data reasonably well, although it underestimates the luminosity because of the low
gamma ray depositions. At late times, the light curve matches the data at 275 days,
and is again too low later on, but at these epochs the observed light curve declines
unusually slowly.
Both Chandrasekhar-mass models, on the other hand, reach maximum after about
17-18 days, which is in line with the observed light curve and the results from spectro-
scopic modelling. These models also follow the early light curve decline quite well,
but then are more luminous than the observed light curve by almost a factor of 2 after
about day 60. At late times they finally rejoin the observed light curve, but they have
a different slope. Looking in more detail, the low-energy model (purple/continuous
line) is somewhat more luminous than the W7 model (green/dashed line) after day 60,
because of the enhanced gamma-ray deposition resulting from the higher densities in
the more slowly expanding ejecta. This difference is however quite small, such that
neither model can be favoured over the other. The indications for a low energy from

CHAPTER 5. SN 1986G 169
spectral fitting are therefore not disproved by the light curve model.
The real issue is the behaviour of the light curve, first after 60 days and then at late
times. The steep decline after day 60 is not in line with the behaviour of other SNe Ia,
(Mazzali et al., 2007, e.g. SN 2004eo), which suggests that the IR contribution is not
known. The range of possible corrections does in fact allow a much higher luminosity.
At the latest times the decline is quite slow, possibly indicating incorrect background
subtraction. The one point when spectra are available still suffers from the lack of IR
information. Again, observations of a modern 1986G-like SN Ia would be needed to
improve both the data coverage and the modelling results.
Overall, the results still indicate that a low-energy Chandrasekhar-mass model is
favoured over an undermassive model, which may come somewhat as a surprise given
that SN 1986G showed quite a rapidly evolving light curve. The rapid light curve
evolution is the result of the low opacity, as a consequence of the low NSE element
abundance (∼ 0.35M).
5.11 Conclusions
A full theoretical spectral analysis of SN 1986G has been performed, using the ‘abun-
dance tomography’ approach. SN 1986G bridges the gap between a normal and sub-
luminous SN Ia. It is found that the ejecta of SN 1986G have a low temperature and
are dominated by singly ionised IMEs. Three density profiles were tested, a stan-
dard Chandrasekhar mass fast deflagration (W7) density profile, a low energy Chan-
drasekhar mass deflagration (W7e0.7) density profile and a Sub-Chandrasekhar mass
detonation density profile (Sub-Ch).
The Sub-Ch models produce good photospheric phase synthetic spectra, but this
density profile can be ruled out owing to the unrealistic abundance distribution and

CHAPTER 5. SN 1986G 170
0 100 200 300 400
40
41
42
0 20 40 60 80
41.5
42
42.5
Figure 5.15: The observed (blue dots) bolometric light curve with the upper (cyan markers)and lower (red markers) limits. As well as the modelled LC using the derived abundancedistribution from the W7 (green), Sub-Ch (red) and W7e0.7 (purple) density profiles.
poor synthetic nebular spectra. Furthermore, the W7 density profile is found to not
be the ideal solution to explain the explosion of SN 1986G. There is no consistency
between theEkin implied by the density distribution (1.3×1051 erg) and that calculated
using the abundance distribution (0.8× 1051 erg).
It was found that a low energy W7 profile (W7e0.7) produced the best results. The
fact that the W7e0.7 model yields a sensible abundance distribution and a consistent
model demonstrates that any deviation from this mass should be minor. The final
integrated masses of the various elements that were obtained from the W7e0.7 model
are: O+C=0.34M, IME=0.69M, stable NSE=0.21M and 56Ni=0.14M. These
abundances produce a Ekin of 0.97 × 1051 erg, which is consistent with the energy of
the W7e0.7 density profile (0.9× 1051 erg).
In conclusion, SN 1986G is a low-energy Chandrasekhar mass explosion of a C+O
WD, which produced a small amount of 56Ni and a large amount of IMEs. The spectra
of SN 1986G show signs of progenitor C II as late as -3 days from B band maximum.

CHAPTER 5. SN 1986G 171
Although SN 1986G was a rapidly-declining SN Ia, there is no reason for it to deviate
from a Chandrasekhar mass explosion. SN 1986G may be classified as the extreme end
of the normal population of SNe Ia, rather than part of the sub-luminous population.
It is even more peculiar in properties than SN 2004eo. However, like SN 2004eo its
low luminosity can be interpreted as the explosion having a strong deflagration phase,
which unbinds the expansion of the star, reducing the density and therefore the effec-
tiveness of the successive supersonic burning phase. This led to the production of a
large fraction of IMEs (Mazzali et al., 2008).
These findings raise the possibility that only SNe Ia with very large decline rates
deviate from a Chandrasekhar mass. The uncertainties in the analysis lie in the value
of host galaxy extinction and the gaps in spectral coverage. However, SN 1986G is the
only SN Ia with properties falling in the gap between normal and subluminous SNe Ia
that also has a good time-series of spectra. Thus our analysis of SN 1986G explores an
important region in parameter space in the overall SNe Ia picture.

6. Conclusions
The aims of this thesis were to improve our understanding of SNe Ia physics and
explosions. This is motivated by the fact that, although SNe Ia are known to come from
a thermonuclear explosion of a C+O Chandrasekhar mass WD, their exact explosion
scenario is one of debate, and their full diversity is not fully understood.
To fully explore the optical diversity of SNe Ia a large sample study of B and
V band SN LC was performed. The SNe Ia were separated by host galaxy type. By
using a new method of calculating host galaxy extinction, it was found that ‘normal’
SNe Ia from passive galaxies are intrinsically fainter than those from S-F galaxies.
Furthermore, a bimodal distribution in ∆m15(B) was discovered. This bimodality
highlighted the lack of data for ‘transitional’ SN. This project also discovered that
only SNe Ia with a blue intrinsic colour follow the WLR. In reality SNe Ia as a class
are far more diverse objects. Interestingly it was found that SN from passive galaxies
are more likely to be unusual and not standard candles, and transitional objects tend
to favour passive galaxies. SNe Ia from S-F and passive galaxies were found to be
distinct. In the V -band, there is a difference of 0.4± 0.13 mag between the median
(peak MV ) values of the ‘normal’ SN Ia population from passive and S-F galaxies.
This is consistent with (∼ 15± 10)% of ‘normal’ SNe Ia from S-F galaxies coming
from an old stellar population. This project made it apparent that transitional SNe Ia
hold the key to understanding the link between subluminous SNe Ia and normal SNe
172

CHAPTER 6. CONCLUSIONS 173
Ia.
One way to understand this link could is through radiative transfer modelling.
Therefore the second project in this thesis was to observe and model SN 2014J. This
SN is a close and interesting object, and was used as a good test for modelling a
normal SNe Ia. SN 2014J was the closest SNe Ia in recent history. It was located in the
starburst galaxy M82. It was confirmed that SN 2014J suffered from a large amount of
host galaxy extinction, which did not follow the normal RV . The extinction parameters
of SN 2014J are RV =1.38 and E(B − V )=1.2. SN 2014J was a normal SNe Ia, with
a ∆m15(B) 1.05±0.12, when corrected for extinction. SN 2014J was found to have a
stratified abundance. It has unburnt material at the highest velocities followed by IME
and a NSE core, which consists of M(56Ni)=0.47-0.72 M.
With the knowledge that transitional SNe Ia are interesting and having the ability
to model a SNe Ia, the data of SN 1986G was modeled. SN 1986G is a low luminos-
ity transitional SNe Ia. It is also highly reddened. It is found that SN 1986G follows
a normal Milky-Way extinction law with an RV =3.1. A range of extinction and dis-
tance values were tested for this SN, and it was found that SN 1986G had an E(B −
V )=0.65±0.05 mag, and was located at a distance modulus of 27.61±0.4 mag. The
full abundance tomography analysis was performed with a selection of density pro-
files. SN 1986G was found to be a low energy Chandrasekhar mass explosion, which
had an energy 70% of the standard W7 model. The final masses of the main elements
in the ejecta were found to be, O=0.33M, IME=0.69M, stable NSE=0.21M,
56Ni=0.14M. An upper limit of the carbon mass is set at C=0.02M. SN 1986G
can be thought of as a low luminosity extension of the main population of SN Ia, with
a large deflagration phase that produced more IMEs than a standard SN Ia.
Overall, it can be concluded that SNe Ia from passive galaxies are less likely to
be ‘normal’, and understanding more about transitional SNe Ia will hold the key to

CHAPTER 6. CONCLUSIONS 174
determining if sub-luminous SNe Ia are a separate population. It may be the case that
only at very large decline rates does the mass of SNe Ia deviate from the Chandrasekhar
mass.
6.1 Futurework
In terms of SN 2014J a full abundance tomography analysis could be performed using
the HST spectra. I could also examine the nebular spectra of SN 2014J in more de-
tail, including measuring the FWHM of the Fe emission lines to see if it matches the
previous predictions. The photometry of SN 2014J could be improved, by using more
standard stars. To do this a function should be made to correct for the difference in
exposure times for the opening and closing of the shutter. This function could then be
re-applied to the the images and ‘standard’ photometry could be performed. A study
into the diffuse interstellar bands in the FRODOspec spectra could also be carried out.
The importance of selection effects in the sample used in chapter 2 should be
examined. Specifically, is there any ways to make the sample less bias. Furthermore,
the effects of using spectra which have host galaxy contamination to caulcate host
galaxy extinction needs to be quantified. For example, are there significant amounts
of spectra in the sample with host galaxy contanination, and is this significant for
caulctaing host galaxy extinction?
More recently work has been carried out on two SNe Ia (SN 2011iv and SN
2007on) both of which exploded in NGC 1404 (Gall et al., in prep). These SN are
a very good test case to examine the intrinsic differences between SN, as they are both
at the same distance. Furthermore, these SN are both transitional have very fast LCs
but appear intrinsically hot. It might be that these SNe hold the key to understanding
the diversity at the faint end of the SNe Ia population. Preliminary results form Gall

CHAPTER 6. CONCLUSIONS 175
et al., has shown that the difference in distance derived to these SN is 15% (Mpc),
when using modern luminosity vs colour and luminosity vs decline rate relation. This
is very interesting as it highlights the problems with improving the use of SNe Ia as
distance indicators. Interestingly, SN 2011iv sits above the standard WLR (even if sbv
or stretch is used instead of ∆m15B).
Future work which will be carried out in line with this research is a detailed study
into transitional SNe Ia. A full modelling analysis of SN 2011iv and SN 2007on should
be performed. Both of these SN are fast declining. Furthermore, SN 2011iv has early
HST spectra, so information can be inferred about the metallicity of the progenitor
system. Preliminary results from modelling SN 2011iv show that it is a low energy
Chandrasekhar mass explosion. The abundance stratification analysis found that there
was 56Ni locate further out in the ejecta. The high central density (due to the low
energy explosion) and the location of 56Ni in ejecta cause the light curve to be bright
but fast. These results are also inline with modern 1D delayed detonation models
(Hoflich private communication).
Preliminary results form modelling SN 2007on show that a standard 1D model
cannot work. The outer layer of SN 2007on can be modelled with a normal W7 density
profile, but the inner layers show a possible two component system, as found in the
double peak nebular lines.
A full analysis into SN 2011iv and SN 2007on will demonstrate the diversity of
SNe Ia, and show the importance of transitional SNe Ia. The fact that both exploded in
the same galaxy shows that the standard LC fitting method may not always be reliable.
If one wants to improve the accuracy of SNe Ia as cosmological distance indicators the
reason for their diversity must be understood in more detail.

Appendix
176

CH
APT
ER
6.C
ON
CL
USIO
NS
177
Table 6.1: The SNe used in the luminsity distribution study. The values have been corrected for MW extinction but not host galaxy extinction.
name mB ∆m15B mV ∆m15V Dist (Mpc) host type E(B-V)host (B − V )Bmax
SN1998de 17.385± 0.021 1.93± 0.11 16.728±0.009 1.17±0.03 66.3±4.6 S-F 0.60±0.03
SN1998dh 14.116± 0.004 0.77± 0.01 14.084±0.005 0.33±0.01 37.5±2.6 S-F 0.00±0.004 -0.0±0.01
SN1998dm 14.738± 0.017 0.90± 0.03 14.431±0.006 0.55±0.01 26.2±1.8 S-F 0.36±0.005 0.24±0.05
SN1998ef 14.925± 0.006 1.12± 0.02 14.936±0.009 0.62±0.02 71.4±5.0 S-F 0.0±0.004 -0.0±0.01
SN1998es 13.818± 0.021 0.92± 0.03 13.767±0.009 0.54±0.01 42.0±2.9 passive 0.14±0.005 0.03±0.03
SN1999aa 14.749± 0.009 0.88± 0.04 14.807±0.017 0.43±0.08 62.7±4.4 S-F 0.0±0.006 -0.0±0.01
SN1999ac 14.224± 0.006 0.90± 0.01 14.109±0.005 0.58±0.01 46.7±3.3 S-F 0.05±0.01
SN1999cl 14.935± 0.008 1.15± 0.02 13.786±0.012 0.65±0.03 14.0±1.0 S-F 1.14±0.02
SN1999cp 13.903± 0.006 1.10± 0.02 13.923±0.005 0.71±0.01 44.1±3.1 S-F 0.09±0.007 -0.0±0.01
SN1999da 16.630± 0.018 1.77± 0.05 16.055±0.007 1.15±0.04 57.6±4.0 passive 0.0±0.017 0.44±0.02
SN1999dk 14.857± 0.021 1.08± 0.05 14.784±0.007 0.67±0.02 59.6±4.2 S-F 0.05±0.07
SN1999dq 14.419± 0.005 0.96± 0.01 14.339±0.004 0.57±0.00 57.0±4.0 S-F 0.11±0.006 0.08±0.01
SN1999ej 15.415± 0.007 1.31± 0.04 15.433±0.006 0.77±0.03 55.3±3.9 S-F 0.00±0.005 -0.0±0.01
SN1999gp 15.992± 0.018 0.89± 0.07 15.955±0.006 0.52±0.02 107.±7.5 S-F 0.0±0.005 0.00±0.08
SN2000cn 16.610± 0.013 1.55± 0.04 16.480±0.010 0.95±0.02 102.±7.2 S-F 0.0±0.006 0.08±0.02

CH
APT
ER
6.C
ON
CL
USIO
NS
178
SN2000cu 15.966± 0.024 1.47± 0.06 15.972±0.013 0.76±0.06 88.9±6.2 S-F -0.0±0.02
SN2000cw 16.744± 0.117 1.24± 0.18 16.756±0.039 0.61±0.06 122.±8.5 S-F -0.0±0.03
SN2000cx 13.313± 0.004 0.69± 0.01 13.261±0.007 0.40±0.01 32.1±2.2 S-F 0.0±0.009 0.04±0.03
SN2000dk 15.448± 0.012 1.17± 0.05 15.427±0.008 0.75±0.02 70.2±4.9 passive 0.0±0.005 -0.0±0.03
SN2000dm 14.962± 0.014 1.67± 0.03 15.062±0.008 0.85±0.02 68.5±4.8 S-F 0.0±0.003 -0.0±0.01
SN2000dn 16.633± 0.029 1.11± 0.07 16.674±0.027 0.64±0.06 130.±9.2 S-F 0.00±0.008 -0.0±0.05
SN2000dr 16.190± 0.017 1.31± 0.12 15.959±0.008 0.82±0.03 75.5±5.3 S-F 0.12±0.02
SN2000fa 15.904± 0.017 1.01± 0.03 15.867±0.011 0.57±0.02 88.7±6.2 S-F 0.06±0.004 0.06±0.02
SN2001ay 16.733± 0.013 0.69± 0.06 16.720±0.010 0.57±0.03 132.±9.3 S-F 0.10±0.004 0.15±0.03
SN2001bf 14.787± 0.009 0.74± 0.02 14.795±0.005 0.42±0.02 70.3±4.9 S-F 0.03±0.008 -0.0±0.01
SN2001br 16.291± 0.015 1.43± 0.07 16.190±0.011 0.70±0.07 90.3±6.4 S-F 0.07±0.004 0.10±0.03
SN2001cj 15.846± 0.009 0.92± 0.04 15.963±0.010 0.53±0.03 107.±7.5 S-F -0.1±0.02
SN2001ck 16.769± 0.020 1.11± 0.08 16.788±0.015 0.65±0.06 150.±10.5 S-F -0.0±0.06
SN2001cp 15.705± 0.011 0.88± 0.03 15.732±0.008 0.55±0.02 100.±7.0 S-F 0.05±0.005 -0.0±0.05
SN2001da 15.531± 0.007 1.15± 0.03 15.354±0.004 0.59±0.02 69.6±4.9 S-F 0.25±0.005 0.15±0.01
SN2001dl 16.880± 0.017 0.94± 0.06 16.594±0.010 0.60±0.02 87.0±6.1 S-F 0.28±0.04
SN2001eh 16.684± 0.007 0.68± 0.05 16.718±0.005 0.36±0.02 149.±10.5 S-F 0.0±0.006 -0.0±0.02

CH
APT
ER
6.C
ON
CL
USIO
NS
179
SN2001E 16.830± 0.025 1.32± 0.12 16.302±0.015 0.73±0.06 87.5±6.1 S-F 0.51±0.06
SN2001en 15.123± 0.007 1.07± 0.02 15.080±0.007 0.67±0.02 63.9±4.5 S-F 0.01±0.01
SN2001ep 15.057± 0.005 0.86± 0.02 15.047±0.004 0.36±0.01 53.1±3.8 S-F 0.0±0.005 -0.0±0.01
SN2001fh 14.317± 0.029 0.91± 0.05 14.428±0.018 0.52±0.04 56.1±4.0 S-F 0.0±0.004 -0.1±0.03
SN2002bo 14.067± 0.007 1.04± 0.01 13.612±0.004 0.62±0.01 22.6±1.6 S-F 0.48±0.006 0.42±0.01
SN2002cd 15.782± 0.013 0.86± 0.05 15.116±0.007 0.54±0.02 46.4±3.3 S-F 0.56±0.007 0.63±0.03
SN2002cf 16.648± 0.026 1.83± 0.08 16.312±0.032 0.85±0.04 72.1±5.1 passive 0.20±0.03
SN2002cs 15.342± 0.006 0.50± 0.03 15.365±0.005 0.24±0.02 69.9±4.9 passive 0.0±0.011 -0.0±0.01
SN2002cu 16.225± 0.006 1.28± 0.03 16.151±0.005 0.76±0.01 101.±7.1 passive 0.0±0.007 0.04±0.01
SN2002de 16.705± 0.009 1.00± 0.04 16.641±0.006 0.56±0.03 122.±8.6 S-F 0.03±0.006 0.06±0.01
SN2002dj 13.954± 0.010 1.00± 0.02 13.864±0.007 0.59±0.01 38.4±2.7 passive 0.13±0.004 0.04±0.02
SN2002dl 16.002± 0.007 1.38± 0.03 15.761±0.007 0.93±0.02 67.8±4.7 S-F 0.0±0.008 0.21±0.01
SN2002dp 14.521± 0.005 0.81± 0.02 14.514±0.003 0.53±0.01 48.0±3.4 S-F 0.04±0.006 -0.0±0.01
SN2002eb 15.994± 0.005 1.00± 0.02 16.055±0.006 0.63±0.01 113.±7.9 S-F -0.0±0.01
SN2002ef 16.732± 0.009 0.94± 0.10 16.415±0.007 0.51±0.07 97.3±6.8 S-F 0.33±0.004 0.31±0.02
SN2002el 16.143± 0.016 1.31± 0.03 16.209±0.012 0.75±0.03 119.±8.4 S-F 0.02±0.02
SN2002er 14.179± 0.006 1.35± 0.02 14.028±0.005 0.80±0.01 42.4±3.0 S-F 0.09±0.004 0.07±0.01

CH
APT
ER
6.C
ON
CL
USIO
NS
180
SN2002fk 13.418± 0.004 0.70± 0.01 13.492±0.004 0.42±0.01 28.3±2.0 S-F 0.0±0.010 -0.1±0.01
SN2002ha 14.690± 0.004 1.38± 0.02 14.751±0.006 0.88±0.02 61.1±4.3 S-F 0.0±0.005 -0.1±0.01
SN2002he 16.461± 0.012 0.90± 0.03 16.389±0.012 0.65±0.02 103.±7.2 passive 0.0±0.005 0.03±0.03
SN2003cg 15.851± 0.010 1.02± 0.09 14.620±0.007 0.66±0.03 19.9±1.4 S-F 1.25±0.003 1.20±0.01
SN2003fa 16.659± 0.007 0.83± 0.01 16.703±0.009 0.54±0.01 171.±12.0 S-F 0.0±0.006 -0.0±0.02
SN2003gn 17.393± 0.019 1.20± 0.04 17.361±0.012 0.68±0.03 140.±9.9 S-F 0.14±0.008 0.02±0.03
SN2003gt 15.081± 0.005 0.89± 0.02 15.023±0.005 0.53±0.01 67.9±4.8 S-F 0.02±0.01
SN2003he 16.259± 0.007 0.91± 0.04 16.233±0.005 0.49±0.03 103.±7.2 S-F -0.0±0.01
SN2003W 15.937± 0.005 1.09± 0.03 15.759±0.013 0.63±0.03 87.6±6.1 S-F 0.12±0.01
SN2003Y 17.802± 0.020 1.67± 0.07 16.962±0.010 1.07±0.03 73.0±5.1 passive 0.08±0.017 0.71±0.04
SN2004as 16.977± 0.012 1.23± 0.08 16.900±0.016 0.64±0.04 134.±9.4 S-F 0.08±0.005 0.03±0.02
SN2004at 15.708± 0.013 1.08± 0.03 15.824±0.007 0.65±0.02 99.5±7.0 S-F 0.0±0.004 -0.1±0.01
SN2004br 15.497± 0.005 0.76± 0.04 15.518±0.009 0.54±0.03 93.9±6.6 passive -0.0±0.02
SN2004bv 14.022± 0.011 0.66± 0.03 13.902±0.008 0.43±0.01 47.4±3.3 S-F 0.09±0.03
SN2004bw 15.850± 0.010 1.23± 0.03 15.905±0.280 0.72±0.08 96.6±6.8 S-F -0.0±0.02
SN2004dt 15.415± 0.005 0.85± 0.01 15.342±0.006 0.49±0.01 78.5±5.5 S-F 0.01±0.01
SN2004ef 16.899± 0.009 1.33± 0.06 16.791±0.011 0.71±0.02 126.±8.9 S-F 0.09±0.004 0.06±0.01

CH
APT
ER
6.C
ON
CL
USIO
NS
181
SN2004eo 15.135± 0.008 1.23± 0.03 15.095±0.005 0.67±0.02 68.1±4.8 S-F 0.0±0.004 -0.0±0.01
SN2004fz 14.923± 0.007 1.27± 0.02 14.987±0.006 0.70±0.01 69.3±4.9 S-F 0.0±0.005 -0.1±0.01
SN2005bc 16.311± 0.048 1.18± 0.09 15.903±0.028 0.70±0.04 58.3±4.1 S-F 0.51±0.005 0.48±0.05
SN2005cc 16.690± 0.016 2.19± 0.10 16.262±0.011 0.86±0.05 38.9±2.7 S-F 0.41±0.02
SN2005cf 13.524± 0.004 0.82± 0.01 13.388±0.004 0.52±0.00 30.9±2.2 S-F 0.01±0.008 0.09±0.01
SN2005de 15.517± 0.006 1.02± 0.01 15.400±0.005 0.60±0.01 69.0±4.9 S-F 0.09±0.01
SN2005dm 18.424± 0.045 1.71± 0.18 17.228±0.01 1.32±0.03 67.0±4.7 S-F 1.13±0.06
SN2005el 14.983± 0.005 0.98± 0.03 15.041±0.005 0.63±0.02 60.4±4.2 S-F 0.0±0.003 -0.0±0.01
SN2005eq 16.263± 0.007 0.81± 0.03 16.242±0.008 0.51±0.02 116.±8.1 S-F 0.12±0.008 0.01±0.01
SN2005na 15.999± 0.013 1.29± 0.06 15.97±0.01 0.52±0.03 108.±7.6 S-F 0.0±0.005 -0.0±0.02
SN2006cp 15.905± 0.017 1.14± 0.07 15.845±0.017 0.58±0.03 99.3±7.0 S-F 0.11±0.005 0.05±0.02
SN2006dm 16.036± 0.015 1.44± 0.06 16.038±0.013 0.84±0.02 89.3±6.3 S-F -0.0±0.03
SN2006ef 15.564± 0.013 1.21± 0.04 15.543±0.008 0.67±0.03 71.3±5.0 passive 0.00±0.01
SN2006em 18.357± 0.01 1.43± 0.05 17.388±0.01 1.07±0.03 77.5±5.4 passive 0.90±0.04
SN2006en 16.843± 0.029 1.16± 0.07 16.820±0.01 1.0±0.03 130.±9.1 S-F 0.10±0.05
SN2006eu 17.445± 0.039 1.25± 0.17 16.954±0.024 0.65±0.05 100.±7.0 passive 0.49±0.07
SN2006gr 17.007± 0.028 0.85± 0.05 16.896±0.016 0.55±0.02 141.±9.9 S-F 0.06±0.005 0.14±0.05

CH
APT
ER
6.C
ON
CL
USIO
NS
182
SN2006le 14.888± 0.016 0.94± 0.03 14.955±0.009 0.60±0.01 72.4±5.1 S-F 0.0±0.004 -0.0±0.02
SN2006lf 14.262± 0.047 1.15± 0.15 14.200±0.019 0.81±0.03 54.2±3.8 S-F 0.01±0.003 0.00±0.03
SN2007af 13.191± 0.006 1.11± 0.02 13.135±0.005 0.68±0.02 27.6±1.9 S-F 0.10±0.004 0.01±0.01
SN2007au 16.596± 0.024 1.70± 0.07 16.408±0.01 0.82±0.03 86.1±6.0 passive 0.0±0.006 0.13±0.04
SN2007bc 15.846± 0.014 1.31± 0.04 15.914±0.009 0.68±0.02 92.3±6.5 S-F 0.0±0.007 -0.0±0.01
SN2007co 16.512± 0.008 1.04± 0.04 16.488±0.006 0.56±0.02 116.±8.2 passive 0.10±0.005 0.00±0.02
SN2007qe 16.048± 0.014 1.05± 0.04 16.002±0.010 0.56±0.01 81.1±5.7 passive 0.02±0.004 0.06±0.02
SN2008ar 16.300± 0.015 1.02± 0.07 16.321±0.020 0.53±0.03 115.±8.1 S-F 0.10±0.008 -0.0±0.04
SN2008ec 15.597± 0.007 1.29± 0.03 15.509±0.005 0.59±0.01 67.0±4.7 S-F -0.0±0.02
SN2002cr 14.276± 0.005 1.03± 0.02 14.205±0.005 0.66±0.01 44.1±3.1 S-F 0.02±0.008 0.04±0.01
SN2007ci 15.903± 0.020 1.78± 0.04 15.900±0.018 0.91±0.04 81.9±5.7 passive 0.0±0.005 -0.0±0.06
SN2007le 13.871± 0.031 1.06± 0.07 13.583±0.024 0.62±0.04 28.1±2.0 S-F 0.22±0.005 0.23±0.02
SN1999by 13.567± 0.005 1.84± 0.01 13.098±0.004 1.18±0.00 12.2±0.86 S-F 0.0±0.017 0.38±0.01
SN1997bp 13.904± 0.006 1.17± 0.02 13.732±0.005 0.70±0.01 36.5±2.6 S-F 0.10±0.01
SN1997dg 16.856± 0.017 1.31± 0.12 16.845±0.016 0.57±0.04 137.±9.7 S-F 0.00±0.02
SN1997do 14.367± 0.191 0.85± 0.17 14.34±0.028 0.00±0.03 44.3±3.1 S-F 0.0±0.005 -0.0±0.01
SN1997E 15.117± 0.008 1.51± 0.03 15.090±0.006 0.87±0.01 58.3±4.1 passive 0.00±0.005 0.00±0.01

CH
APT
ER
6.C
ON
CL
USIO
NS
183
SN1998ab 16.297± 0.053 1.60± 0.08 16.28±0.006 2.97±0.00 118.±8.3 S-F 0.15±0.006 0.15±0.02
SN1998V 15.125± 0.013 1.86± 0.02 15.123±0.007 0.81±0.03 78.7±5.5 S-F 0.03±0.003 0.02±0.01
SN1994ae 13.109± 0.144 0.85± 0.11 12.992±0.143 0.63±0.09 23.3±1.6 S-F 0.16±0.004 0.07±0.03
SN1994S 14.785± 0.123 0.98± 0.10 14.798±0.038 0.66±0.08 70.0±4.9 S-F 0.07±0.004 -0.0±0.05
SN1995ac 17.162± 0.021 0.57± 0.06 17.163±0.018 0.46±0.04 204.±14.3 S-F 0.0±0.008 -0.0±0.05
SN1995ak 16.047± 0.01 1.73± 0.05 15.957±0.054 0.95±0.08 90.4±6.3 S-F 0.01±0.07
SN1995al 13.328± 0.040 0.79± 0.12 13.215±0.024 0.65±0.06 26.5±1.9 S-F 0.11±0.004 0.09±0.05
SN1995bd 15.494± 0.016 0.86± 0.02 15.133±0.012 0.69±0.02 58.8±5.4 S-F 0.41±0.008 0.37±0.03
SN1995D 13.245± 0.025 0.99± 0.09 13.269±0.021 0.62±0.05 30.9±2.2 S-F 0.04±0.006 -0.0±0.05
SN1995E 16.724± 0.034 1.09± 0.14 16.023±0.027 0.62±0.09 50.9±3.6 S-F 0.79±0.003 0.69±0.06
SN1996bo 15.897± 0.012 1.19± 0.04 15.556±0.007 0.69±0.01 68.7±4.8 S-F 0.29±0.004 0.29±0.02
SN1996X 13.028± 0.023 1.28± 0.06 13.027±0.014 0.69±0.04 26.1±1.8 passive 0.00±0.003 -0.0±0.05
SN1986G 12.073± 0.010 1.65± 0.02 11.155±0.010 0.98±0.01 4.28±0.31 passive 0.78±0.04
SN1990N 12.683± 0.049 1.03± 0.08 12.657±0.062 0.62±0.09 13.9±1.0 S-F 0.02±0.02
SN1991bg 14.628± 0.01 1.93± 0.05 13.844±0.040 1.40±0.06 14.0±1.0 passive 0.08±0.014 0.70±0.10
SN1991T 11.619± 0.111 0.88± 0.11 11.453±0.160 0.58±0.08 13.5±0.9 S-F 0.17±0.007 0.15±0.02
SN1998aq 12.313± 0.241 1.01± 0.23 12.423±0.004 0.65±0.00 21.8±1.5 S-F 0.0±0.005 -0.1±0.03

CH
APT
ER
6.C
ON
CL
USIO
NS
184
SN1999ee 14.855± 0.005 0.90± 0.01 14.568±0.362 0.62±0.08 48.8±3.4 S-F 0.29±0.008 0.24±0.02
SN2000E 12.984± 0.009 0.89± 0.01 12.782±0.006 0.65±0.01 24.3±1.7 S-F 0.01±0.00
SN2001bt 15.251± 0.010 1.27± 0.03 15.056±0.006 0.71±0.01 64.7±4.5 S-F 0.15±0.04
SN2001cz 15.074± 0.008 0.92± 0.03 14.951±0.005 0.64±0.01 59.5±4.2 S-F 0.12±0.01
SN2001el 12.748± 0.006 1.15± 0.02 12.688±0.003 0.62±0.00 14.7±1.0 S-F 0.04±0.01
SN2003du 13.507± 0.011 0.92± 0.01 13.583±0.117 0.59±0.11 33.2±2.3 S-F 0.0±0.005 -0.2±0.04
SN2001fe 14.991± 0.207 1.39± 0.28 14.911±0.118 0.71±0.05 60.6±4.2 S-F 0.04±0.007 0.05±0.04
SN2002hu 16.616± 0.045 0.89± 0.19 16.720±0.011 0.56±0.03 120.±8.4 S-F 0.12±0.012 -0.0±0.03
SN2003kf 13.490± 0.112 0.93± 0.15 13.405±0.021 0.69±0.12 30.6±2.1 S-F 0.16±0.004 0.10±0.05
SN2005hc 17.381± 0.316 0.89± 0.21 17.453±0.158 0.62±0.03 184.±13.0 passive 0.0±0.005 -0.1±0.05
SN2005hk 15.822± 0.374 1.57± 0.46 15.701±0.067 0.82±0.18 52.3±3.7 S-F 0.02±0.02
SN2005iq 16.803± 0.392 1.09± 0.02 16.921±0.030 0.73±0.09 138.±9.7 S-F 0.0±0.003 -0.1±0.10
SN2005kc 15.660± 0.01 1.45± 0.05 15.375±0.144 0.87±0.09 62.8±4.4 S-F 0.33±0.004 0.28±0.05
SN2005lz 17.659± 0.01 0.57± 0.05 17.571±0.01 0.34±0.03 178.±12.5 S-F 0.19±0.008 0.05±0.04
SN2005mc 17.262± 0.055 1.78± 0.22 17.066±0.019 1.08±0.06 106.±7.4 S-F 0.11±0.006 0.17±0.04
SN2005ms 16.191± 0.01 0.66± 0.05 16.210±0.300 0.57±0.42 106.±7.5 S-F 0.01±0.03
SN2005mz 16.541± 0.179 1.75± 0.11 16.216±0.229 1.27±0.01 70.9±5.0 S-F 0.0±0.013 0.32±0.09

CH
APT
ER
6.C
ON
CL
USIO
NS
185
SN2006S 16.833± 0.203 0.87± 0.21 16.806±0.156 0.59±0.04 138.±9.7 S-F 0.16±0.006 0.08±0.04
SN2006ac 16.242± 0.467 1.20± 0.21 16.096±0.210 0.71±0.02 102.±7.2 S-F 0.20±0.005 0.13±0.05
SN2006ax 15.026± 0.01 1.05± 0.05 15.099±0.069 0.65±0.04 76.3±5.3 S-F 0.02±0.005 -0.0±0.03
SN2006az 16.484± 0.01 1.25± 0.05 16.570±0.075 0.72±0.04 132.±9.3 S-F 0.0±0.006 -0.1±0.05
SN2006bt 16.973± 0.185 0.99± 0.01 16.853±0.019 0.58±0.03 140.±9.9 S-F 0.09±0.005 0.15±0.04
SN2006cc 17.868± 0.01 0.91± 0.05 17.506±0.119 0.69±0.04 140.±9.8 S-F 0.12±0.010 0.39±0.05
SN2006cm 18.049± 0.01 1.04± 0.05 17.055±0.041 0.72±0.01 69.6±4.9 S-F 0.95±0.008 1.00±
SN2006qo 16.859± 0.01 1.03± 0.05 16.687±0.105 0.59±0.07 126.±8.9 S-F 0.20±
SN2006sr 16.206± 0.239 1.74± 0.26 16.20±0.017 0.0±0.03 97.5±6.8 S-F 0.04±0.004 0.04±0.05
SN2007F 15.890± 0.01 0.88± 0.05 15.920±0.099 0.61±0.09 103.±7.2 S-F 0.00±0.004 -0.0±
SN2007S 15.843± 0.01 0.86± 0.05 15.436±0.102 0.63±0.06 62.5±4.4 S-F 0.43±0.007 0.38±
SN2007ca 15.988± 0.01 0.86± 0.05 15.700±0.060 0.71±0.09 65.1±4.6 S-F 0.37±0.005 0.31±
SN2008bf 15.767± 0.01 1.00± 0.05 15.729±0.094 0.63±0.05 106.±7.4 passive 0.06±0.006 0.08±0.05
SN2007kk 16.948± 0.016 0.79± 0.12 16.874±0.012 0.70±0.04 165.±11.6 S-F 0.0±0.004 0.00±
SN2008Z 16.505± 0.020 0.62± 0.02 16.202±0.011 0.65±0.01 90.7±6.4 passive 0.03±0.008 0.12±0.03
SN2008cm 15.688± 0.044 1.35± 0.22 15.778±0.209 0.86±0.08 45.2±3.2 S-F -0.1±
SN2008gb 17.098± 0.024 1.23± 0.17 16.961±0.027 0.63±0.06 149.±10.5 S-F 0.07±0.11

CH
APT
ER
6.C
ON
CL
USIO
NS
186
SN2008gl 16.826± 0.014 0.97± 0.06 16.737±0.012 0.81±0.02 136.±9.6 passive 0.0±0.003 -0.0±
SN2008hm 15.636± 0.150 1.20± 0.18 15.609±0.016 0.61±0.03 79.7±5.6 S-F -0.0±0.10
SN2008hv 14.878± 0.226 1.18± 0.10 14.796±0.090 0.78±0.07 55.8±3.9 passive 0.11±0.003 0.07±
SN2009Y 14.672± 0.054 1.79± 0.15 14.723±0.008 0.92±0.01 41.1±2.9 S-F 0.0±0.006 -0.0±
SN2009al 16.288± 0.021 0.99± 0.04 16.105±0.015 0.53±0.02 97.6±6.8 passive 0.08±0.05
SN2009an 14.487± 0.133 1.40± 0.25 14.418±0.007 0.79±0.01 43.8±3.1 S-F 0.04±0.05
SN2009dc 15.079± 0.074 0.67± 0.13 15.041±0.006 0.32±0.01 96.1±6.7 passive -0.0±0.04
SN2009ig 13.466± 0.284 0.89± 0.10 13.364±0.01 0.59±0.03 34.7±2.4 S-F 0.09±
SN2009jr 16.364± 0.017 0.91± 0.08 15.859±0.011 0.67±0.03 71.7±5.0 S-F 0.46±
SN2009kq 14.521± 0.019 1.12± 0.20 14.480±0.006 0.67±0.01 51.8±3.6 passive 0.01±0.02
SN2009na 15.818± 0.014 0.98± 0.03 15.773±0.077 0.75±0.08 92.8±6.5 S-F 0.01±0.05
SN2010Y 14.997± 0.052 1.78± 0.14 14.969±0.008 0.92±0.01 49.6±3.5 passive -0.0±
SN2010ag 16.704± 0.031 0.99± 0.16 16.551±0.012 0.67±0.05 145.±10.2 S-F 0.07±0.09
SN2010ai 16.088± 0.217 1.31± 0.34 16.019±0.009 0.77±0.01 83.5±5.9 passive -0.0±

CHAPTER 6. CONCLUSIONS 187
Table 6.2: The photometry of SN 2014J. The errors on the magnitudes do not include the erroron the standard star.
MJD g r i
56684.1 11.67 ±0.001 10.44±0.001 10.26±0.00156685.1 11.59 ±0.001 10.37±0.001 10.21±0.00156685.9 11.52 ±0.004 10.34±0.002 10.21±0.00256688.9 11.43 ±0.001 10.20±0.001 10.20±0.00156689.9 11.41 ±0.001 10.19±0.001 10.25±0.00156692.0 11.43 ±0.001 10.16±0.001 -56692.9 11.43 ±0.001 10.18±0.001 10.34±0.00156693.8 11.46 ±0.001 10.19±0.001 10.38±0.00156694.9 11.47 ±0.001 10.25±0.001 10.42±0.00156695.8 11.50 ±0.001 10.27±0.001 10.46±0.00156696.8 11.52 ±0.001 10.31±0.001 -56697.9 11.56 ±0.001 10.40±0.001 10.61±0.00156698.8 11.60 ±0.001 - -56699.8 11.65 ±0.001 10.47±0.00156700.8 11.69 ±0.001 10.57±0.001 10.74±0.00156701.8 11.75 ±0.002 - -56709.8 12.29 ±0.002 10.91±0.001 10.89±0.00256710.8 12.31 ±0.002 - -56712.1 12.46 ±0.003 10.94±0.003 10.84±0.00256712.8 12.50 ±0.002 - -56713.8 12.55 ±0.002 10.91±0.001 10.72±0.00156714.8 12.67 ±0.002 10.93±0.001 10.76±0.00156715.8 12.72 ±0.004 11.01±0.002 10.72±0.00256716.8 12.81 ±0.004 - 10.68±0.00256717.8 12.90 ±0.004 - -56718.8 12.95 ±0.004 11.08±0.001 10.69±0.00256719.8 13.03 ±0.012 11.12±0.002 10.72±0.00256720.8 13.10 ±0.005 11.13±0.002 10.66±0.002

References
Altavilla, G., Stehle, M., Ruiz-Lapuente, P., et al. 2007, A&A, 475, 585
Amanullah, R., Goobar, A., Johansson, J., et al. 2014, ApJ, 788, L21
Anderson, J. P., James, P. A., Forster, F., et al. 2015, MNRAS, 448, 732
Anupama, G. C., Sahu, D. K., Deng, J., et al. 2005, ApJ, 631, L125
Ashall, C., Mazzali, P., Bersier, D., et al. 2014, MNRAS, 445, 4427
Ashall, C., Mazzali, P., Sasdelli, M., & Prentice, S. J. 2016, MNRAS, 460, 3529
Ashall, C., Mazzali, P. A., Pian, E., & James, P. A. 2016, MNRAS,
Arnett, W. D., Truran, J. W., & Woosley, S. E. 1971, ApJ, 165, 87
Arnett, W. D. 1982, ApJ, 253, 785
Axelrod T. S., 1980, PhD thesis, California Univ., Santa Cruz.
Baade, W., & Minkowski, R. 1954, ApJ, 119, 215
Barnsley, R. M., Smith, R. J., & Steele, I. A. 2012, A.N., 333, 101
Benetti, S., Cappellaro, E., Mazzali, P. A., et al. 2005, ApJ, 623, 1011
Bessell, M. S. 1990, PASP, 102, 1181
188

REFERENCES 189
Bikmaev, I. F., Chugai, N. N., Sunyaev, R. A., et al. 2015, Astronomy Letters, 41, 785
Bland, J., Taylor, K., & Atherton, P. D. 1987, MNRAS, 228, 595
Blinnikov, S. I., & Khokhlov, A. M. 1986, Soviet Astronomy Letters, 12, 131
Blinnikov, S. I., & Khokhlov, A. M. 1987, Soviet Astronomy Letters, 13, 364
Brandt, T. D., Tojeiro, R., Aubourg, E., et al. 2010, AJ, 140, 804
Brown, P. J., Smitka, M. T., Wang, L., et al. 2015, ApJ, 805, 74
Burns, C. R., Stritzinger, M., Phillips, M. M., et al. 2014, ApJ, 789, 32
Cappellaro, E., Mazzali, P. A., Benetti, S., et al. 1997, A&A, 328, 203
Cardelli, J. A., Clayton, G. C., & Mathis, J. S. 1989, ApJ, 345, 245
Carroll B. W., Ostlie D. A., 2007, Pearson Eduction, Inc.
Childress, M., Aldering, G., Antilogus, P., et al. 2013, ApJ, 770, 108
Chotard, N., Gangler, E., Aldering, G., et al. 2011, A&A, 529, L4
Colgate, S. A., & McKee, C. 1969, ApJ, 157, 623
Conley, A., Sullivan, M., Hsiao, E. Y., et al. 2008, ApJ, 681, 482-498
Cristiani, S., Cappellaro, E., Turatto, M., et al. 1992, A&A, 259, 63
Deng, J., Kawabata, K. S., Ohyama, Y., et al. 2004, ApJ, 605, L37
Dilday, B., Howell, D. A., Cenko, S. B., et al. 2012, Science, 337, 942
Disney, M. J., & Wallace, P. T. 1982, QJRAS, 23, 485
Dong, S., Katz, B., Kushnir, D., & Prieto, J. L. 2015, MNRAS, 454, L61

REFERENCES 190
Elias-Rosa, N., Benetti, S., Cappellaro, E., et al. 2006, MNRAS, 369, 1880
Ferrarese, L., Mould, J. R., Stetson, P. B., et al. 2007, ApJ, 654, 186
Filippenko, A. V. 1997, ARA&A, 35, 309
Fink, M., Hillebrandt, W., & Ropke, F. K. 2007, A&A, 476, 1133
Fisher, A., Branch, D., Hatano, K., & Baron, E. 1999, MNRAS, 304, 67
Fitzpatrick, E. L., & Massa, D. 1999, ApJ, 525, 1011
Folatelli, G., Phillips, M. M., Burns, C. R., et al. 2010, AJ, 139, 120
Foley, R. J., Kromer, M., Howie Marion, G., et al. 2012, ApJ, 753, L5
Foley, R. J., Fox, O. D., McCully, C., et al. 2014, MNRAS, 443, 2887
Foley, R. J., Pan, Y.-C., Brown, P., et al. 2016, MNRAS, 461, 1308
Fossey, S. J., Cooke, B., Pollack, G., Wilde, M., & Wright, T. 2014, CBET, 3792, 1
Frogel, J. A., Gregory, B., Kawara, K., et al. 1987, ApJ, 315, L129
Fukugita, M., Shimasaku, K., & Ichikawa, T. 1995, PASP, 107, 945
Ganeshalingam, M., Li, W., Filippenko, A. V., et al. 2010, ApJS, 190, 418
Ganeshalingam, M., Li, W., & Filippenko, A. V. 2011, MNRAS, 416, 2607
Goobar, A., Johansson, J., Amanullah, R., et al. 2014, ApJ, 784, L12
Graham, M. L., Valenti, S., Fulton, B. J., et al. 2015, ApJ, 801, 136
Guy, J., Sullivan, M., Conley, A., et al. 2010, A&A, 523, A7
Hachinger, S., Mazzali, P. A., & Benetti, S. 2006, MNRAS, 370, 299

REFERENCES 191
Hachinger, S., Mazzali, P. A., Taubenberger, S. 2009, MNRAS, 399, 1238
Hachinger, S., Mazzali, P. A., Taubenberger, S., et al. 2012, MNRAS, 427, 2057
Hamuy, M., Phillips, M. M., Maza, J., et al. 1995, AJ, 109, 1
Hamuy, M., Phillips, M. M., Suntzeff, N. B., et al. 1996, AJ, 112, 2408
Hamuy, M., Phillips, M. M., Suntzeff, N. B., et al. 2003, , 424, 651
Hicken, M., Challis, P., Jha, S., et al. 2009, ApJ, 700, 331
Hicken, M., Challis, P., Kirshner, R. P., et al. 2012, ApJS, 200, 12
Hillebrandt, W., & Niemeyer, J. C. 2000, ARA&A, 38, 191
Hoeflich, P., Khokhlov, A. M., & Wheeler, J. C. 1995, ApJ, 444, 831
Hoflich, P., Gerardy, C. L., Fesen, R. A., & Sakai, S. 2002, ApJ, 568, 791
Høg, E., Fabricius, C., Makarov, V. V., et al. 2000, A&A, 355, L27
Howell, D. A. 2001, ApJ, 554, L193
Howell, D. A., Sullivan, M., Nugent, P. E., et al. 2006, , 443, 308
Hsiao, E. Y., Conley, A., Howell, D. A., et al. 2007, ApJ, 663, 1187
Hsiao, E. Y., Burns, C. R., Contreras, C., et al. 2015, A&A, 578, A9
Hutton, S., Ferreras, I., Wu, K., et al. 2014, MNRAS, 440, 150
Iben, I., Jr., & Tutukov, A. V. 1984, ApJS, 54, 335
Iwamoto, K., Brachwitz, F., Nomoto, K., et al. 1999, ApJS, 125, 439
Ivezic, Z. 2014, American Astronomical Society Meeting Abstracts #223, 223, 317.03

REFERENCES 192
Jack, D., Mittag, M., Schroder, K.-P., et al. 2015, MNRAS, 451, 4104
Kasen D., 2016, P-Cygni Profile, http://supernova.lbl.gov/ dnkasen/
Kasen, D., Branch, D., Baron, E., & Jeffery, D. 2002, ApJ, 565, 380
Katz, B., & Dong, S. 2012, arXiv:1211.4584
Kasliwal, M. M., Kulkarni, S. R., Gal-Yam, A., et al. 2012, ApJ, 755, 161
Kasliwal, M. 2015, Boutiques & Experiments, Caltech
Kelly, P. L., Fox, O. D., Filippenko, A. V., et al. 2014, ApJ, 790, 3
Kessler, R., Becker, A. C., Cinabro, D., et al. 2009, ApJS, 185, 32
Krisciunas, K., Suntzeff, N. B., Candia, P., et al. 2003, AJ, 125, 166
Krisciunas, K., Phillips, M. M., Suntzeff, N. B., et al. 2004, AJ, 127, 1664
Krisciunas, K., Suntzeff, N. B., Phillips, M. M., et al. 2004, AJ, 128, 3034
Kromer, M., Ohlmann, S. T., Pakmor, R., et al. 2015, MNRAS, 450, 3045
Leaman, J., Li, W., Chornock, R., & Filippenko, A. V. 2011, MNRAS, 412, 1419
Leloudas, G., Stritzinger, M. D., Sollerman, J., et al. 2009, A&A, 505, 265
Lentz, E. J., Baron, E., Branch, D., Hauschildt, P. H. 2000, ApJ, 530, 966
Li, W., Filippenko, A. V., Chornock, R., et al. 2003, PASP, 115, 453
Li, W., Leaman, J., Chornock, R., et al. 2011, VizieR Online Data Catalog, 741,
Lira, P., Suntzeff, N. B., Phillips, M. M., et al. 1998, AJ, 115, 234
Livne, E., & Arnett, D. 1995, ApJ, 452, 62

REFERENCES 193
Lucy, L. B. 1999, A&A, 345, 211
Maguire, K., Sullivan, M., Thomas, R. C., et al. 2011, MNRAS, 418, 747
Maguire, K., Sullivan, M., Ellis, R. S., et al. 2012, MNRAS, 426, 2359
Maguire, K., Sullivan, M., Pan, Y.-C., et al. 2014, MNRAS, 444, 3258
Maguire, K., Taubenberger, S., Sullivan, M. 2016, MNRAS, 457, 3254
Mandel, K. S., Foley, R. J., & Kirshner, R. P. 2014, ApJ, 797, 75
Maoz, D., Sharon, K., & Gal-Yam, A. 2010, ApJ, 722, 1879
Marion, G. H., Sand, D. J., Hsiao, E. Y., et al. 2015, ApJ, 798, 39
Mazzali, P. A., & Lucy, L. B. 1993, A&A, 279, 447
Mazzali, P. A., Lucy, L. B., Danziger, I. J., et al. 1993, A&A, 269, 423
Mazzali, P. A., Danziger, I. J., & Turatto, M. 1995, A&A, 297, 509
Mazzali, P. A., Cappellaro, E., Danziger, I. 1998, ApJ, 499, L49
Mazzali, P. A. 2000, A&A, 363, 705
Mazzali, P. A., Nomoto, K., Cappellaro, E., et al. 2001, ApJ, 547, 988
Mazzali, P. A., Benetti, S., Altavilla, G., et al. 2005, ApJ, 623, L37
Mazzali, P. A., Ropke, F. K., Benetti, S., & Hillebrandt, W. 2007, Science, 315, 825
Mazzali, P. A., Foley, R. J., Deng, J., et al. 2007, ApJ, 661, 892
Mazzali, P. A., Sauer, D. N. 2008, MNRAS, 386, 1897
Mazzali, P. A., Maurer, I., Stritzinger, M., et al. 2011, MNRAS, 416, 881

REFERENCES 194
Mazzali, P. A., & Hachinger, S. 2012, MNRAS, 424, 2926
Mazzali, P. A., Sullivan, M., Hachinger, S., et al. 2014, MNRAS, 439, 1959
Mazzali, P. A., Sullivan, M., Filippenko, A. V., et al. 2015, MNRAS, 450, 2631
Mihalas D., 1978, Stellar atmospheres 2nd edition
Mould, J. R., Huchra, J. P., Freedman, W. L., et al. 2000, ApJ, 529, 786
Maoz, D., Mannucci, F., & Nelemans, G. 2014, ARA&A, 52, 107
Munari, U., Henden, A., Belligoli, R., et al. 2013, , 20, 30
Muratov, A. L., & Gnedin, O. Y. 2010, ApJ, 718, 1266
Nomoto, K. 1982, ApJ, 257, 780
Nomoto, K., & Kondo, Y. 1991, ApJ, 367, L19
Nomoto, K., Thielemann, F.-K., & Yokoi, K. 1984, ApJ, 286, 644
Nomoto, K., Iwamoto, K., & Kishimoto, N. 1997, Science, 276, 1378
Nugent, P., Phillips, M. 1995, ApJ, 455, L147
Oke, J. B., & Sandage, A. 1968, ApJ, 154, 21
Pan, Y.-C., Sullivan, M., Maguire, K., et al. 2015, MNRAS, 446, 354
Pan, Y.-C., Foley, R. J., Kromer, M., et al. 2015, MNRAS, 452, 4307
Pastorello, A., Mazzali, P. A., Pignata, G., et al. 2007, MNRAS, 377, 1531
Pauldrach, A. W. A., Duschinger, M., Mazzali, P. A., et al. 1996, A&A, 312, 525
Pereira, R., Thomas, R. C., Aldering, G., et al. 2013, A&A, 554, A27

REFERENCES 195
Perlmutter, S., Aldering, G., Goldhaber, G., et al. 1999, ApJ, 517, 565
Phillips, M. M. 1993, ApJ, 413, L105
Phillips, M. M., Phillips, A. C., Heathcote, S. R., et al. 1987, PASP, 99, 592
Phillips, M. M., Lira, P., Suntzeff, N. B., et al. 1999, AJ, 118, 1766
Porter, A. L., Leising, M. D., Milne, P., et al. 2015, American Astronomical Society
Meeting Abstracts, 225, 450.04
Rau, A., Kulkarni, S. R., Law, N. M., et al. 2009, PASP, 121, 1334
Rest, A., Scolnic, D., Foley, R. J., et al. 2014, ApJ, 795, 44
Richter, O.-G., & Huchtmeier, W. K. 1984, A&A, 132, 253
Riess, A. G., Press, W. H., & Kirshner, R. P. 1996, ApJ, 473, 88
Riess, A. G., Filippenko, A. V., Challis, P., et al. 1998, AJ, 116, 1009
Riess, A. G., Kirshner, R. P., Schmidt, B. P., et al. 1999, AJ, 117, 707
Riess, A. G., Li, W., Stetson, P. B., et al. 2005, BAAS, 37, 180.10
Rigault, M., Copin, Y., Aldering, G., et al. 2013, A&A, 560, A66
Ropke, F. K., Hillebrandt, W., Schmidt, W., et al. 2007, ApJ, 668, 1132
Rosswog, S., Kasen, D., Guillochon, J., & Ramirez-Ruiz, E. 2009, ApJ, 705, L128
Ruiter, A. J., Belczynski, K., & Fryer, C. 2009, ApJ, 699, 2026
Ruiter, A. J., Belczynski, K., Benacquista, M. 2010, ApJ, 717, 1006
Sahu, D. K., Tanaka, M., Anupama, G. C., et al. 2008, ApJ, 680, 580-592

REFERENCES 196
Sasdelli, M., Mazzali, P. A., Pian, E., et al. 2014, MNRAS, 445, 711
Sasdelli, M., Ishida, E. E. O., Hillebrandt, W., et al. 2016, MNRAS, 460, 373
Sauer, D. N., Mazzali, P. A., Blondin, S., et al. 2008, MNRAS, 391, 1605
Schlafly, E. F., & Finkbeiner, D. P. 2011, ApJ, 737, 103
Schmidt, W., Ciaraldi-Schoolmann, F., Niemeyer, J. C., Ropke, F. K., & Hillebrandt,
W. 2010, ApJ, 710, 1683
Shigeyama, T., Nomoto, K., Yamaoka, H., & Thielemann, F.-K. 1992, ApJ, 386, L13
Silverman, J. M., Nugent, P. E., Gal-Yam, A., et al. 2013, ApJS, 207, 3
Silverman, J. M., Vinko, J., Marion, G. H., et al. 2015, MNRAS, 451, 1973
Sim, S. A., Ropke, F. K., Hillebrandt, W., et al. 2010, ApJ, 714, L52
Soria, R., Mould, J. R., Watson, A. M., et al. 1996, ApJ, 465, 79
Stehle, M., Mazzali, P. A., Benetti, S., & Hillebrandt, W. 2005, MNRAS, 360, 1231
Srivastav, S., Ninan, J. P., Kumar, B., et al. 2016, MNRAS, 457, 1000
Stritzinger, M., & Leibundgut, B. 2005, A&A, 431, 423
Sullivan, M., Le Borgne, D., Pritchet, C. J., et al. 2006, ApJ, 648, 868
Sullivan, M., Conley, A., Howell, D. A., et al. 2010, MNRAS, 406, 782
Tanaka, M., Mazzali, P. A., Maeda, K., & Nomoto, K. 2006, ApJ, 645, 470
Taubenberger, S., Hachinger, S., Pignata, G., et al. 2008, MNRAS, 385, 75
Telesco, C. M., Hoflich, P., Li, D., et al. 2015, ApJ, 798, 93

REFERENCES 197
Tripp, R. 1998, A&A, 331, 815
Tsvetkov, D. Y., Metlov, V. G., Shugarov, S. Y., Tarasova, T. N. 2014, CAOSP, 44, 67
Tubbs, A. D. 1980, ApJ, 241, 969
Turatto, M. 2003, Supernovae and Gamma-Ray Bursters, 598, 21
Valentini, G., Di Carlo, E., Massi, F., et al. 2003, ApJ, 595, 779
Vallely, P., Moreno-Raya, M. E., Baron, E., et al. 2016, MNRAS, 460, 1614
Wang, X., Wang, L., Filippenko, A. V., Zhang, T., & Zhao, X. 2013, Science, 340, 170
Woosley, S. E., & Weaver, T. A. 1986, ARA&A, 24, 205
Woosley, S. E., Arnett, W. D., & Clayton, D. D. 1973, ApJS, 26, 231
Woosley, S. E., Kasen, D., Blinnikov, S., & Sorokina, E. 2007, ApJ, 662, 487
Woudt, P. A., Steeghs, D., Karovska, M., et al. 2009, ApJ, 706, 738
Yamanaka, M., Kawabata, K. S., Kinugasa, K., et al. 2009, ApJ, 707, L118
Yamanaka, M., Maeda, K., Kawabata, M., et al. 2014, ApJ, 782, L35
Yasuda, N., & Fukugita, M. 2010, AJ, 139, 39
Yoon, S.-C., & Langer, N. 2005, A&A, 435, 967
Zheng, W., Shivvers, I., Filippenko, A. V., et al. 2014, ApJ, 783, L24
De Vaucouleurs, G. 1980, ApJ, 240, L93