chromonic liquid crystalline phases liquid crystalskessler/lydon.pdf · liquid crystals publication...
TRANSCRIPT

This article was downloaded by: [University of Arizona]On: 19 September 2013, At: 21:32Publisher: Taylor & FrancisInforma Ltd Registered in England and Wales Registered Number: 1072954 Registered office: Mortimer House,37-41 Mortimer Street, London W1T 3JH, UK
Liquid CrystalsPublication details, including instructions for authors and subscription information:http://www.tandfonline.com/loi/tlct20
Chromonic liquid crystalline phasesJohn Lydon aa Faculty of Biological Sciences, University of Leeds, Leeds, UKPublished online: 22 Nov 2011.
To cite this article: John Lydon (2011) Chromonic liquid crystalline phases, Liquid Crystals, 38:11-12, 1663-1681, DOI:10.1080/02678292.2011.614720
To link to this article: http://dx.doi.org/10.1080/02678292.2011.614720
PLEASE SCROLL DOWN FOR ARTICLE
Taylor & Francis makes every effort to ensure the accuracy of all the information (the “Content”) containedin the publications on our platform. However, Taylor & Francis, our agents, and our licensors make norepresentations or warranties whatsoever as to the accuracy, completeness, or suitability for any purpose of theContent. Any opinions and views expressed in this publication are the opinions and views of the authors, andare not the views of or endorsed by Taylor & Francis. The accuracy of the Content should not be relied upon andshould be independently verified with primary sources of information. Taylor and Francis shall not be liable forany losses, actions, claims, proceedings, demands, costs, expenses, damages, and other liabilities whatsoeveror howsoever caused arising directly or indirectly in connection with, in relation to or arising out of the use ofthe Content.
This article may be used for research, teaching, and private study purposes. Any substantial or systematicreproduction, redistribution, reselling, loan, sub-licensing, systematic supply, or distribution in anyform to anyone is expressly forbidden. Terms & Conditions of access and use can be found at http://www.tandfonline.com/page/terms-and-conditions

Liquid Crystals,Vol. 38, Nos. 11–12, November–December 2011, 1663–1681
INVITED TOPICAL REVIEW
Chromonic liquid crystalline phases
John Lydon*
Faculty of Biological Sciences, University of Leeds, Leeds, UK
(Received 3 June 2011; final version received 5 August 2011)
Chromonic systems are lyotropic mesophases formed by soluble aromatic compounds. The basic structural unitsin these systems are stacks of molecules (rather than individual molecules or micellar assemblies). There are twocommon chromonic phases: a more dilute phase consisting of a nematic array of columns (the N phase) and a moreconcentrated phase in which the columns lie in a hexagonal array (the M phase). Chromonic phases are formedby a range of compounds, including drugs, dyes and nucleic acids, typically with three or four fused aromaticrings. They have distinctive optical textures and characteristic multi-peritectic phase diagrams (in contrast to themulti-eutectic phase diagrams of conventional amphiphiles). Many commercial dyes have proved to be chromonic,but the ability to form liquid crystalline phases has been incidental to their use. However, recent studies have shownthat the combination of self-ordering, ease of alignment, sensitivity to changing conditions and additives, coupledwith their optical and electro-optical properties, gives these systems unique and potentially valuable properties.It is expected that these will lead to a new generation of applications. It is predicted that there will be increasedemphasis on the development of a range of sophisticated devices, either produced from, or actually incorporatingchromonic phases. These include polarisers, optical compensators, light-harvesting devices, and biosensors formedical diagnosis.
Keywords: liquid crystals; chromonic phases; dyes; organic electronics; biosensors
1. Introduction
1.1 Early historyThe history of chromonic phases has been charted ina number of reviews over the last 20 years [1–6]. Thestory falls into three parts. The first consists of isolatedreports of novel patterns of liquid crystalline phase for-mation, dating from 1915 when Sandquist describedwhat we would now recognise as the unmistakeableoptical texture, of a chromonic N phase, in aqueoussolutions of a phenanthrene sulphonic acid [7]. Laterreports, mainly in the dye literature, by Balaban andKing [8], Gaubert [9], Jelley [10] and Scheibe [11] pic-tured molecules aggregated like ‘piles of pennies’ or‘stacks of cards’. The second phase concerned thedetailed study of the anti-asthmatic drug, disodiumcromoglycate (DSCG) (Figure 1) using mainly a com-bination of optical and X-ray diffraction techniques[12–20]. At this stage there were many misconceptionsabout the structures of the mesophases, as modelswere sought to explain them in terms of more famil-iar systems – and there were misleading references inthe literature to discotic nematics, smectic patterns ofassembly and to the formation of micelles. The finalphase was the realisation that chromonic phases areactually widespread amongst drugs, dyes, nucleic acidsand similar water-soluble, aromatic compounds and
*Email: [email protected]
that they have a characteristic distinctive pattern ofstructures and properties.
The investigation of the mesophases of DSCGforms a key part of the story and the development (andthe development of this drug by Altounyan is itself anepic story of medical research) [12, 13]. The drug wasmarketed in large quantities by Fisons (under the tradenames INTAL (from inhibition to allergy) in Britainand Chromolyn in the USA. When it was discoveredthat this compound formed two novel liquid crys-talline phases with water, it seemed that the presenceof what appeared to be unique medical propertiestogether with what appeared to be unique mesogenicproperties might be significant. We now appreciatethat neither of these was unique, but at that time, it wassuspected that knowledge of the mesophase structuresmight throw some light on the mode of action [14].Fisons therefore commissioned a detailed study by theMcCrone Research Institute in London, which soughthelp from Norman Hartshorne (one of the most seniorBritish optical microscopists of the time). The opti-cal textures (Figure 2), phase diagram (Figure 3) andX-ray diffraction patterns were investigated [15–19].Hartshorne noted the characteristic nematic schlierentexture of the more dilute mesophase and accordinglylabelled it the N phase. He also noted that the more
ISSN 0267-8292 print/ISSN 1366-5855 online© 2011 Taylor & Francishttp://dx.doi.org/10.1080/02678292.2011.614720http://www.tandfonline.com
Dow
nloa
ded
by [
Uni
vers
ity o
f A
rizo
na]
at 2
1:32
19
Sept
embe
r 20
13
1664 J. Lydon
O
O O
O
O O
CO2O2C
CH2CHH2C
OH
Na+Na+
DSCG
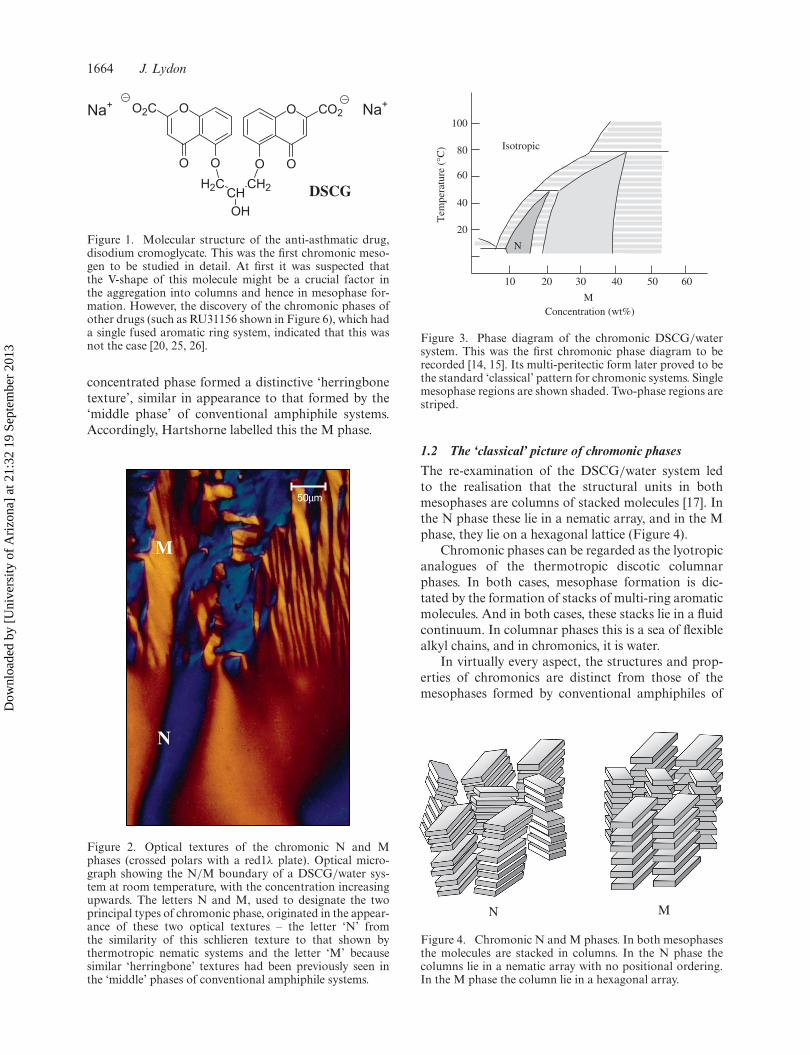
Figure 1. Molecular structure of the anti-asthmatic drug,disodium cromoglycate. This was the first chromonic meso-gen to be studied in detail. At first it was suspected thatthe V-shape of this molecule might be a crucial factor inthe aggregation into columns and hence in mesophase for-mation. However, the discovery of the chromonic phases ofother drugs (such as RU31156 shown in Figure 6), which hada single fused aromatic ring system, indicated that this wasnot the case [20, 25, 26].
concentrated phase formed a distinctive ‘herringbonetexture’, similar in appearance to that formed by the‘middle phase’ of conventional amphiphile systems.Accordingly, Hartshorne labelled this the M phase.
N
50μm
M
Figure 2. Optical textures of the chromonic N and Mphases (crossed polars with a red1λ plate). Optical micro-graph showing the N/M boundary of a DSCG/water sys-tem at room temperature, with the concentration increasingupwards. The letters N and M, used to designate the twoprincipal types of chromonic phase, originated in the appear-ance of these two optical textures – the letter ‘N’ fromthe similarity of this schlieren texture to that shown bythermotropic nematic systems and the letter ‘M’ becausesimilar ‘herringbone’ textures had been previously seen inthe ‘middle’ phases of conventional amphiphile systems.
Isotropic
M
N
10 20 30 40 50 60
100
80
60
40
20
Concentration (wt%)
Tem
pera
ture
(°C
)
Figure 3. Phase diagram of the chromonic DSCG/watersystem. This was the first chromonic phase diagram to berecorded [14, 15]. Its multi-peritectic form later proved to bethe standard ‘classical’ pattern for chromonic systems. Singlemesophase regions are shown shaded. Two-phase regions arestriped.
1.2 The ‘classical’ picture of chromonic phasesThe re-examination of the DSCG/water system ledto the realisation that the structural units in bothmesophases are columns of stacked molecules [17]. Inthe N phase these lie in a nematic array, and in the Mphase, they lie on a hexagonal lattice (Figure 4).
Chromonic phases can be regarded as the lyotropicanalogues of the thermotropic discotic columnarphases. In both cases, mesophase formation is dic-tated by the formation of stacks of multi-ring aromaticmolecules. And in both cases, these stacks lie in a fluidcontinuum. In columnar phases this is a sea of flexiblealkyl chains, and in chromonics, it is water.
In virtually every aspect, the structures and prop-erties of chromonics are distinct from those of themesophases formed by conventional amphiphiles of
N M
Figure 4. Chromonic N and M phases. In both mesophasesthe molecules are stacked in columns. In the N phase thecolumns lie in a nematic array with no positional ordering.In the M phase the column lie in a hexagonal array.
Dow
nloa
ded
by [
Uni
vers
ity o
f A
rizo
na]
at 2
1:32
19
Sept
embe
r 20
13
Liquid Crystals 1665
the soap/detergent/phospholipid type. The moleculeshave rigid cores rather than flexible aliphatic chains.The molecules are not ‘polar’ (in the sense that thesolubilising groups are not confined to a specifichydrophilic end but occur around the periphery of themolecules). There is no chromonic analogue of thecritical micelle concentration. Chromonic moleculesbegin to aggregate even in very dilute solution andcolumns of increasing length form as the solution isconcentrated. And there is no analogue of the Krafftpoint (the temperature at which alkyl chains becometoo rigid to allow micelle formation).
The thermodynamic driving force for the for-mation of chromonic stacks appears to be signif-icantly different to that which causes conventionalamphiphile molecules to cluster together in micelles.Measurements of thermodynamic parameters indicatethat it is enthalpic rather than entropic. In terms ofthe molecular interactions, this seems to imply thatthere is a significant force of attraction between theπ-orbitals of the aromatic rings of adjacent molecules,and that it is not simply the interactions between watermolecules which force the solute molecules to segre-gate. Calculations of the energy involved in stackingone ring on top of another suggest values of the orderof 5–10 kBT. This would appear to be a reasonablevalue. Clearly it must be larger than kBT otherwise anyaggregates would be shaken apart by thermal motion.On the other hand, the temperatures of the mesophase→ isotropic transitions indicate that it can not be verymuch greater.
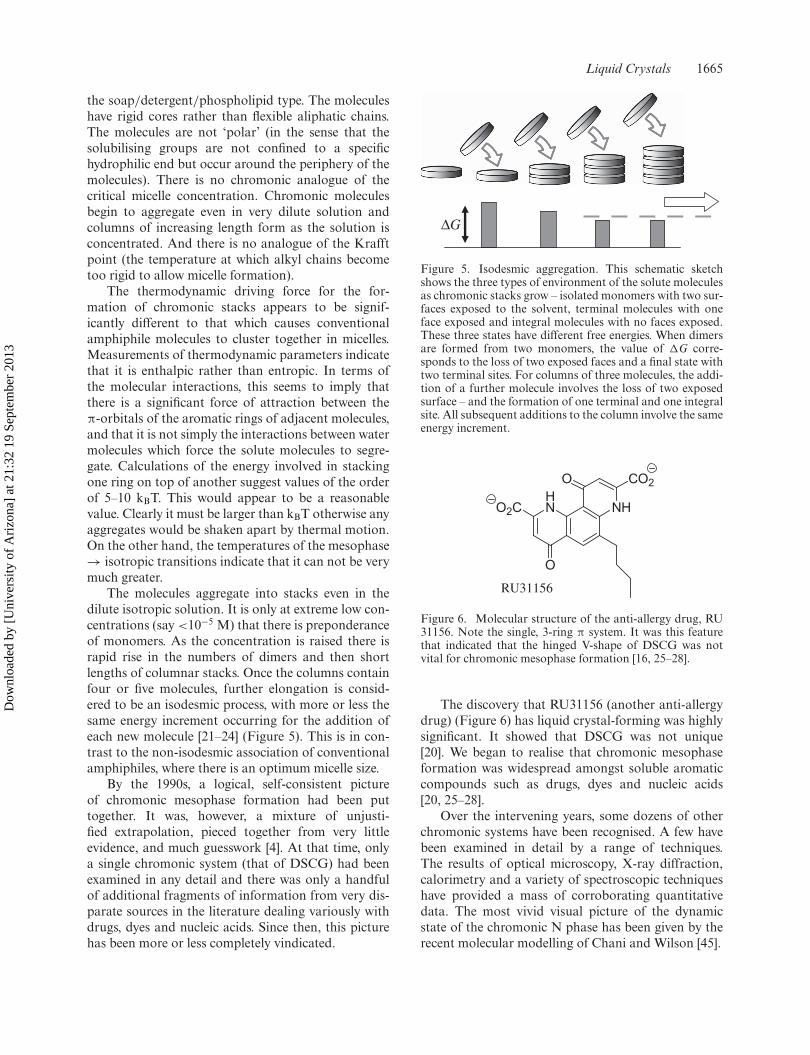
The molecules aggregate into stacks even in thedilute isotropic solution. It is only at extreme low con-centrations (say <10−5 M) that there is preponderanceof monomers. As the concentration is raised there israpid rise in the numbers of dimers and then shortlengths of columnar stacks. Once the columns containfour or five molecules, further elongation is consid-ered to be an isodesmic process, with more or less thesame energy increment occurring for the addition ofeach new molecule [21–24] (Figure 5). This is in con-trast to the non-isodesmic association of conventionalamphiphiles, where there is an optimum micelle size.
By the 1990s, a logical, self-consistent pictureof chromonic mesophase formation had been puttogether. It was, however, a mixture of unjusti-fied extrapolation, pieced together from very littleevidence, and much guesswork [4]. At that time, onlya single chromonic system (that of DSCG) had beenexamined in any detail and there was only a handfulof additional fragments of information from very dis-parate sources in the literature dealing variously withdrugs, dyes and nucleic acids. Since then, this picturehas been more or less completely vindicated.
ΔG
Figure 5. Isodesmic aggregation. This schematic sketchshows the three types of environment of the solute moleculesas chromonic stacks grow – isolated monomers with two sur-faces exposed to the solvent, terminal molecules with oneface exposed and integral molecules with no faces exposed.These three states have different free energies. When dimersare formed from two monomers, the value of �G corre-sponds to the loss of two exposed faces and a final state withtwo terminal sites. For columns of three molecules, the addi-tion of a further molecule involves the loss of two exposedsurface – and the formation of one terminal and one integralsite. All subsequent additions to the column involve the sameenergy increment.
HN
O
O2C NH
O CO2
RU31156
Figure 6. Molecular structure of the anti-allergy drug, RU31156. Note the single, 3-ring π system. It was this featurethat indicated that the hinged V-shape of DSCG was notvital for chromonic mesophase formation [16, 25–28].
The discovery that RU31156 (another anti-allergydrug) (Figure 6) has liquid crystal-forming was highlysignificant. It showed that DSCG was not unique[20]. We began to realise that chromonic mesophaseformation was widespread amongst soluble aromaticcompounds such as drugs, dyes and nucleic acids[20, 25–28].
Over the intervening years, some dozens of otherchromonic systems have been recognised. A few havebeen examined in detail by a range of techniques.The results of optical microscopy, X-ray diffraction,calorimetry and a variety of spectroscopic techniqueshave provided a mass of corroborating quantitativedata. The most vivid visual picture of the dynamicstate of the chromonic N phase has been given by therecent molecular modelling of Chani and Wilson [45].
Dow
nloa
ded
by [
Uni
vers
ity o
f A
rizo
na]
at 2
1:32
19
Sept
embe
r 20
13
1666 J. Lydon
Liquid crystal phases exist in a precarious statebetween the fluid chaos of the isotropic liquid andthe brittle rigidity of the crystalline solid. The balancebetween the forces attempting to create order and thethermal motion attempting to disrupt it can easily bedisturbed – as expressed elegantly in the sub-title ofPeter Collings book Liquid Crystals - Nature’s deli-cate phase of matter [31]. This sensitivity shows itselfin the response to changes of temperature, concentra-tion, electric and magnetic fields, and to the additionof small quantities of solutes.
The later history of chromonic phases is chartedin the sequence of reviews over the last 20 years [1–5].
In addition to these, an anecdotal, personal account ofthe early days (when the separate strands of drugs, dyesand nucleic acid were first drawn together) was pre-sented as the Ben Sturgeon Memorial Lecture at TheBritish Liquid Crystal Society meeting at York in 2003and was later published in Liquid Crystals Today [6].
2. The characterisation of chromonic phases
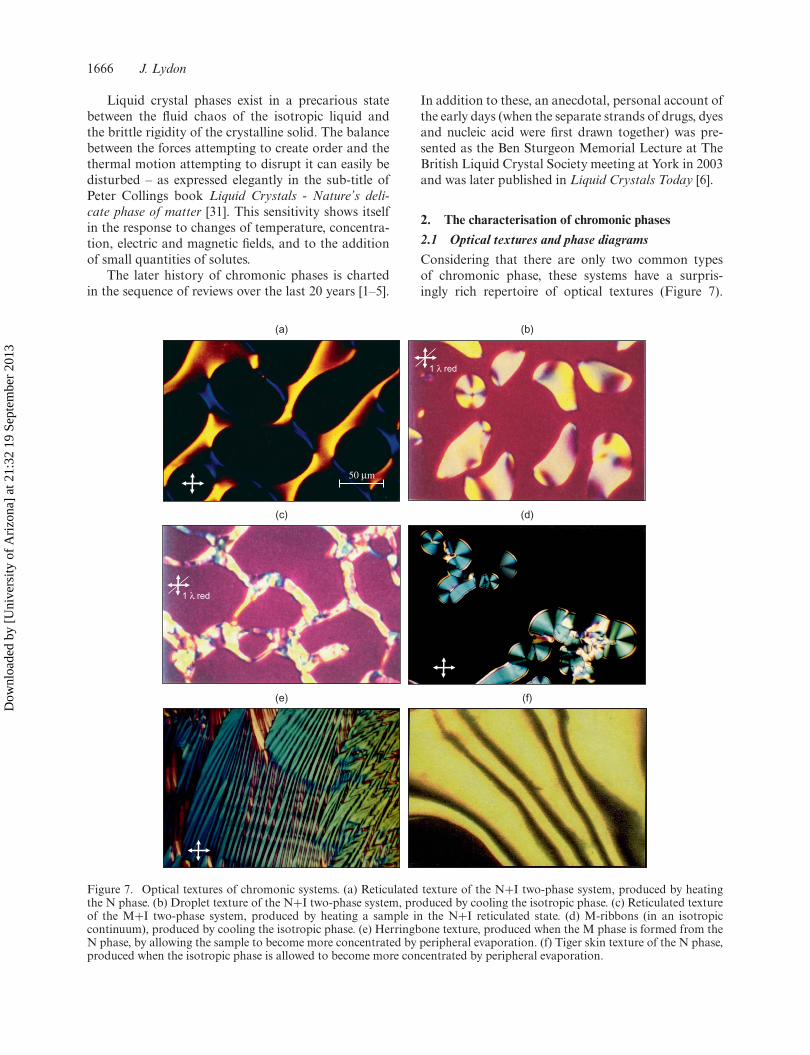
2.1 Optical textures and phase diagramsConsidering that there are only two common typesof chromonic phase, these systems have a surpris-ingly rich repertoire of optical textures (Figure 7).
50 μm
1 λ red
(a) (b)
1 λ red
(c) (d)
(e) (f)
Figure 7. Optical textures of chromonic systems. (a) Reticulated texture of the N+I two-phase system, produced by heatingthe N phase. (b) Droplet texture of the N+I two-phase system, produced by cooling the isotropic phase. (c) Reticulated textureof the M+I two-phase system, produced by heating a sample in the N+I reticulated state. (d) M-ribbons (in an isotropiccontinuum), produced by cooling the isotropic phase. (e) Herringbone texture, produced when the M phase is formed from theN phase, by allowing the sample to become more concentrated by peripheral evaporation. (f) Tiger skin texture of the N phase,produced when the isotropic phase is allowed to become more concentrated by peripheral evaporation.
Dow
nloa
ded
by [
Uni
vers
ity o
f A
rizo
na]
at 2
1:32
19
Sept
embe
r 20
13

Liquid Crystals 1667
In particular, the appearances of the two-phase,N+I and M+I mixtures are highly characteristic anddepend on the way in which they were produced.Samples produced by heating usually have a differentoptical texture to those produced by cooling, and sam-ples produced by concentrating are usually radicallydifferent in appearance to those produced by dilution[1–6, 15, 17, 20, 25–30].
Unoriented samples of the N phase show the famil-iar nematic schlieren texture. Sometimes this phasedevelops a regular wavy distortion, giving a patternof equally-spaced diffuse bands of the ‘tiger skin tex-ture’ (Figure 8). The bulk M phase usually has agrainier appearance, presumably indicating distinctbreaks in alignment in the director field resultingfrom the increased stiffness of the phase. If a sam-ple in the N phase is heated, causing it to pass intothe N+I region on the phase diagram, islands ofisotropic phase develop, giving the characteristic retic-ulated texture. If the same phase change is carriedout in the reverse direction, nematic droplets appearin the isotropic continuum. The curvature of the N/Iinterface has opposite signs in these two instances,presumably implying that the surface tension at thenematic/isotropic boundary must be relatively low. Ifthe M phase is grown by allowing a sample of N phase,to become concentrated by peripheral evaporation,it usually develops a highly patterned ‘herringbone’texture [15–17] (Figure 8). If, however, the M phaseis produced directly from the isotropic solution bycooling, it emerges as birefringent ribbons (Figure 9).
Figure 8. Herringbone and tiger skin textures. Thesestylised sketches show the director field patterns responsi-ble for the herringbone texture of the M phase (upper) andthe tiger skin texture of the N phase (lower). Both of thesefeatures are paramorphotic. They arise from the buckling ofthe material as the columns attempt to lengthen in a con-fined space. The more brittle M phase cracks, but the moreflexible N phase bends. The shaded backgrounds depict theappearance of the samples as seen between crossed polars.Note the alternating pattern of sharp-edged domains for theherringbone pattern and the sinusoidal variation of intensityacross the tiger skin banding.
Crossed Polars
Figure 9. M ribbons. Birefringent worm-like ribbons ofhighly ordered M-phase appear when a concentratedisotropic solution is cooled. These grow until they reach thesurfaces of the slide and cover slip.
In some cases, the boundary between N and Mphases is very distinct but in others, there is a gradualchange in texture with no clear borderline. Thisimplies that the phase transition is only weakly firstorder or perhaps even second order. In such cases, thecombined N/M system has been provisionally termeda P phase [3–6, 33, 34]. A possible explanation for thisbehaviour has been offered in terms of the shape ofthe cross-section of the columnar aggregates. It is sug-gested that systems which show P-type behaviour havecolumns with an approximately circular cross-section.This would allow the molecules to rotate about theirshort axes more freely and there would be a lessabrupt change in rotational motion at the N/M tran-sition. In contrast, systems that showed conventionalN/M behaviour probably have plank-like molecules,giving blade-like stacks, and the change from M to Nphase involves a significant change in the regime ofrotational motion of molecules about the column axis.At present, there is insufficient evidence to confirmthis hypothesis, but recent studies of some chromonicdyes with phthalocyanine cores (Figure 14) appear tosupport it.
Dow
nloa
ded
by [
Uni
vers
ity o
f A
rizo
na]
at 2
1:32
19
Sept
embe
r 20
13

1668 J. Lydon
2.2 X-ray diffraction patternsThere are two major features in the X-ray diffractionpatterns of chromonic N and M phases (Figure 10);a high-angle reflection corresponding to the stackingrepeat distance of 3.4 Å and low-angle, reflectionsfrom the column-to-column spacings, typically in the30–50 Å range [1–6, 14, 15, 17, 20, 25, 26–28].
The usual experimental geometry involves alignedsamples held in capillary tubes, with the mesophasedirector (parallel to the column axes) lying parallel tothe axis of the tube, and with the X-ray beam incidentnormally. In this configuration, the high-angle reflec-tions, corresponding to the stacking repeat distance of3.4 Å, appear on the vertical axis of the diffractionpattern and the small-angle reflections, correspondingto the inter-column spacings, appear on the equator.There is a noticeable broadening of the axial reflec-tion as the temperature is raised and the length ofthe columns decreases. However, the position of thecentre of the peak does not vary significantly withtemperature or concentration, or from compound toanother. Because of the range of inter-column spacings
M
N
Figure 10. X-ray diffraction patterns of the chromonic Nand M phases. In these two sketches, the edge-on view ofthe molecular discs, drawn on the left, corresponds to thealignment of the diffraction pattern shown in the centre. Thesketches on the right shown the structure viewed down thecolumn axes. The sample, as a whole, is taken to have arandom orientation of domains about the director, givingoverall rotational symmetry around the director.
a cb
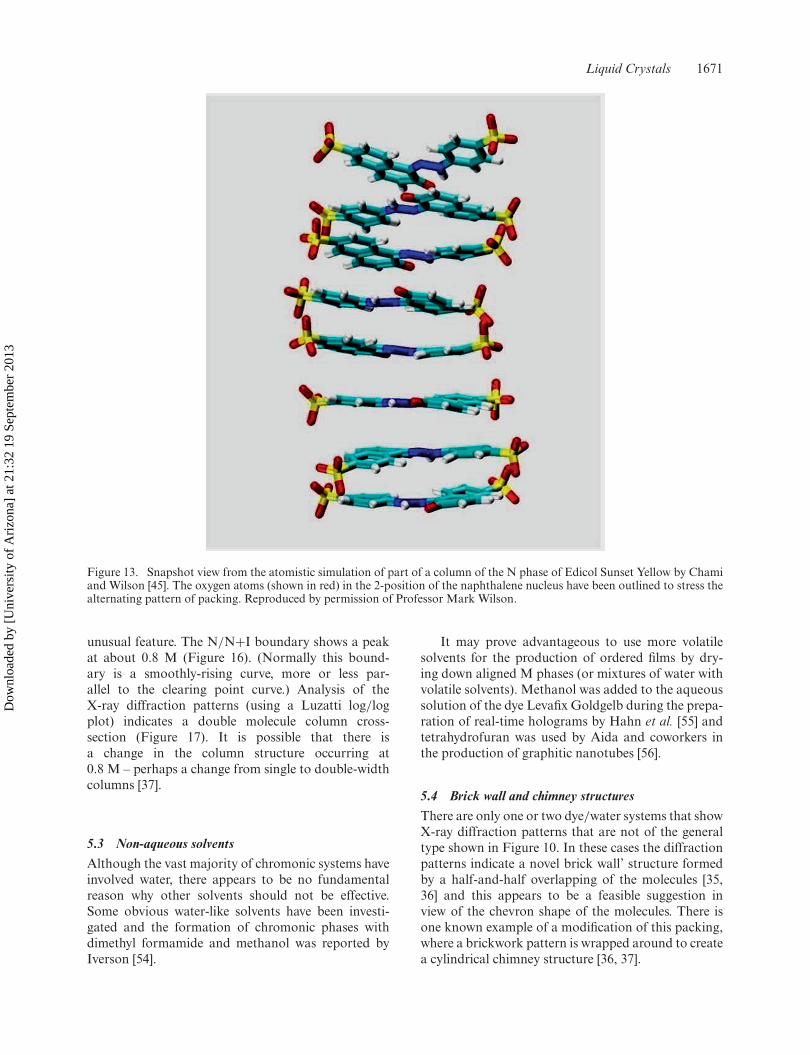
Figure 11. Molecular stacking patterns in chromonic sys-tems. (a) Representation of a simple one-on-one stacking ofmolecules within a column, with both end-to-end and side-to-side disorder. (b) An ordered single-molecule column withalternating head-to-tail stacking. The computer modellingof Chami and Wilson shows stacking of this type in the Nphase of Sunset Yellow [45] (Figure 13 ) and there are diffusereflections in the X-ray diffraction pattern compatible with astructure of this type [24, 33]. (c) A helical stack assembledfrom chiral molecules [61].
in the N phase, there is a broad, diffuse equatoriallow-angle axial reflection. In the M phase pattern, thisis replaced by two moderately sharp reflections corre-sponding to spacings in the ratio 1:1/
√3 – characteris-tic indications of a hexagonal lattice. A third reflectioncorresponding to the 1/
√7 spacing can sometimes bedetected as a very small peak in a diffractometer trace,but is generally too weak to be seen in diffractionphotographs.
Diffraction patterns of this type were first recordedfor the N and M phases of the drug DSCG [15, 20] andpatterns with a similar appearance have been foundfor virtually all chromonic systems subsequently stud-ied; the exceptions being chromonic systems where themolecules are thought to aggregate with the brick walland chimney structures [34–36].
In a small number of cases, enough X-ray dataare available to indicate the way in which theinter-column spacing changes with composition. TheLuzatti log/log plot of this data has a gradient ofapproximately 0.5 indicating that (to a first approx-imation) as the phases are diluted they swell in twodimensions (i.e. in directions normal to the columnaxes). The plot also gives a value for the cross-sectionalarea of the columns. In most (but not all) cases thisappears to be more or less the same as the area ofa single molecules, (see figure 11) but there are indi-cations of double molecule columns for the Bordeauxdye and of multiple molecule columns for DSCG itself[37]. Note also the double-width column structure ofBordeaux dye shown in Figure 17. In addition to thesestrong axial and equatorial features, some mesophasesgive weak off-axial reflections which may also relateto structure within the columns. These reflections arevery weak, presumably due to the high level of thermaldisorder in these systems.
Dow
nloa
ded
by [
Uni
vers
ity o
f A
rizo
na]
at 2
1:32
19
Sept
embe
r 20
13

Liquid Crystals 1669
2.3 SpectroscopyThe picture of chromonic phases inferred from opti-cal and X-ray diffraction studies has in general beensupported and quantified by spectroscopic studies[30, 35, 36, 38–41]. For aligned N phase samples,NMR has indicated a relatively high order parame-ter, but polarised infrared (IR) spectroscopy suggestsa significantly lower level of ordering. Since the twotechniques are not measuring the same parameter, thisdisparity is not surprising. NMR is largely measur-ing the degree of parallel alignment of the columns,whereas IR is measuring the order parameter for indi-vidual molecules.
2.4 Aggregation numbersIn the 1950s, osmotic pressure studies of solutions ofpurines and pyrimidines (the bases present in DNAand RNA) suggested that these molecules aggregatein columns in a progressive fashion where the addi-tion of a further molecule to a stack always involvessame free energy increment [42]. This means that thereis a progressive increase in the length of the columns asthe concentration is raised or the temperature is low-ered. This is very much in contrast with the pattern ofmicelle formation in conventional amphiphile systemswhere, at a particular concentration and temperature,there is an optimum micelle structure and there is anenergy cost involved in either adding or subtractingmolecules. The suggestion that an isodesmic patternof molecular aggregation may be a common featureamongst chromonic systems has been supported by anumber of subsequent investigations [21–24] and esti-mates for the free energy increment when a molecule isadded to a stack usually lie in the 5–10 kBT range.
Many techniques have been used to study the stateof aggregation of chromonic phases. These includeFourier transform infrared (FTIR), static and dynamiclight scattering, small angle neutron scattering, cryo-transmission electron microscopy and rheology [2].Values for the aggregation number in chromonicmesophases range from tens to hundreds. From lightscattering and viscosity measurements for DSCG,Nastishim et al. [21, 22] estimated that, in a 14%solution at 23oC the average number of moleculesin a column was about 25 and at 25oC it was 50.These values are consistent with estimates from X-raydiffraction measurements.
3. Computer modelling
X-rays and optics give information which is essentiallytime- and space-averaged. Their results are expressedas static parameters such as refractive indices, order
parameters and electron density maps, and we canonly infer the dynamic state of the system from thisindirect evidence. In contrast, recent advances in com-puter modelling have shown, in a most vivid fashion,the way in which the battle is played out betweenthe chaotic thermal motion and the intermolecu-lar forces which are attempting to create long-rangeorder. Two recent publications, with radically differentapproaches, are outlined below. The first is a coarse-grained modelling which treats the molecules simply asshort cylinders. The second is a fully atomistic simula-tion which attempts to take into account every inter-and intra-molecular interaction.
Kuriabova et al. [44] carried out a ‘minimalistic’coarse-grained modelling of an abstracted mesophasesystem consisting of sticky-ended cylinders. Theseunits are pictured as interacting laterally by simplehard-core excluded-volume collisions, but they are ableto stack and bind end-to-end. Monte Carlo simula-tions and analytic theory were used to explore theway in which they assemble, giving flexible linearaggregates. As one would expect, this treatment pre-dicted a density threshold at which the aggregatesspontaneously aligned, forming a nematic array (cor-responding to the chromonic N phase) – and at higherconcentrations, a further transition gives a hexagonalarray (corresponding to the M phase). This is a syn-ergistic process with aggregation favouring alignmentand conversely, alignment favouring aggregation.
The pattern of self-assembly was modelled for arange of end-to-end binding energies and for three val-ues of the cylinder length/diameter (L/D) aspect ratio(0.5, 1 and 2). Chromonic molecules in general havelength/diameter aspect ratios considerably less than0.5, and one would therefore expect that it is onlythe first of these figures which would appear to beof relevance. The resulting phase diagram for L/D =0.5 is shown in Figure 12. Bearing in mind the levelto which the molecular shapes and interactions havebeen simplified, this shows a remarkable qualitativelevel of correspondence with those actually observedfor chromonic systems.
Chami and Wilson have carried out an atomisticsimulation study of the N phase of the chromonic fooddye, Edicol Sunset Yellow [45] (Figure 13). This gives aremarkable direct picture of the dynamic state of themesophase. Every feature of the structure is mobile.The ricochets of the thermal motion can be seen asmolecules constantly jostle against their neighbours.Over a longer time scale, there is the slow randomaggregation of molecules as they become assembled incolumns. It is clear that the columns are close to theedge of their stability range and they are constantlybending, breaking and reforming. Here and there,individual molecules leave and rejoin the column –
Dow
nloa
ded
by [
Uni
vers
ity o
f A
rizo
na]
at 2
1:32
19
Sept
embe
r 20
13

1670 J. Lydon
I
0
5
10
0.2 0.3 0.4 0.5 0.6
N
M D
L
Aspect ratio of structural units(L/D) = 0.5
Volume fraction
E/k
BT
Figure 12. Phase diagram given by the coarse-grainedcomputer modelling of a system of sticky-ended cylindersRedrawn from Kuriabova et al. [44]. To stress the correspon-dence with actual chromonic temperature/concentrationphase diagrams (as shown in Figures 3 and 16) the graphshown here has been redrawn with the Y axes inverted(and with the columnar hexagonal phase designated as achromonic M, rather than a columnar C). The quantitiesplotted along both axes are dimensionless. The x-axis is thevolume fraction occupied by the cylinders and is obviouslyanalogous to the solute concentration in a chromonic sys-tem. The quantity plotted on the y-axis requires rather moreexplanation. This is the ratio of the energy of the end-to-end stacking (E) and the energy of the thermal motion,expressed as kBT. It therefore varies as 1/T and inverting theaxis produces a phase diagram resembling the conventionaltemperature/concentration type.
sometimes turning over before they are re-inserted.However, in spite of this, they maintain a distinctblade-like column envelope and there is a noticeabletendency for molecules to stack in a head-to-tail pat-tern (in confirmation of the pattern inferred from theX-ray diffraction photographs).
This simulation gives a vivid picture of the dynamicnature of the N phase. It makes it clear that it is notpossible to comprehend liquid crystalline ‘structure’in terms of static parameters. Macroscopic parame-ters have to be redefined – temperature becomes theamplitude of the thermal motion, bend twist and splayelastic constants become abstract time-averaged con-structs. At the molecular level, the ‘structure’ of amesophase is a time-averaged concept.
4. The molecular requirements of chromonicmesogens
Some dozens of chromonic compounds have beensynthesised over the last 20 years (Figure 14). Theseinclude xanthone derivatives [46], benzopurpurin 4B[47], phthalocyanine and porphyrin derivatives [48],Levafix Goldgelb [49], Violet 20 [50], Direct blue 67[51, 52] and Blue 27 [21, 53]. They all follow the sameoverall molecular pattern of a planar multi-ring systemwith solublising groups around the edges. But there isconsiderable variation in size and shape. Chromonicaromatic systems range from with those with two rings
to those with at least 13, and they vary from the vir-tually circular discs of phthalocyanine compounds toextended laths, four or five times as long as they arewide. Some have all of the parts of the π-bonded sys-tem joined in a single fused aromatic unit and somehave separate aromatic ring systems linked by C=C orN=N groups.
These new chromonic compounds all appear tohave the ‘classical’ pattern of N/M chromonic phasebehaviour – with characteristic phase diagrams, opti-cal textures and, where they have been investigated,X-ray diffraction patterns. Two particular examplesare of interest – Sunset Yellow FCF because of thevery comprehensive level of study and Bordeaux dyebecause of its interesting column structure.
5. Recent studies of chromonic systems
5.1 Sunset Yellow FCFThe first chromonic system after DSCG to be exam-ined in detail was Edicol Sunset Yellow (Figure 15).This dye is a widely-used food colorant, available ina much purer state than textile dyes. It is marketedas a concentrated solution, in the N phase. Followinga preliminary investigation [37], there have been twomajor studies by Horowitz et al. in 2005 [24] andEdwards et al. in 2008 [43] in which the solutionand liquid crystalline phases were examined usingoptical microscopy, multinuclear NMR (1H, 2H, 13C,23Na), and X-ray diffraction. The optical textures areclosely similar to those of the DSCG/water systemand the phase diagram has the same multi-peritecticform.
The major features of the X-ray diffraction pat-terns of the mesophases are similar to those of DSCG.Both N and M phases give the usual strong outeraxial arcs corresponding to the molecular stackingseparation of about 3.4 Å. The N phase gives a dif-fuse equatorial reflection and the M phase gives pairof much sharper equatorial reflections (correspondingto spacings in the ratio 1 : 1/
√3. The dimensions ofthe hexagonal lattice indicate that the cross-sectionalarea of the aggregates corresponds to that of a sin-gle molecule. There are, however, minor differences –weak, diffuse off-axis reflections on the layer line at6.8 Å, corresponding to two molecular thicknesses.This, coupled with the absence of a 6.8 Å axial reflec-tion, indicates some type of alternation of molecularalignment along the column axis (as found in thecomputer modelling of Chami and Wilson).
5.2 Bordeaux dyeBordeaux dye forms chromonic N and M mesophasesand has a temperature/composition phase with an
Dow
nloa
ded
by [
Uni
vers
ity o
f A
rizo
na]
at 2
1:32
19
Sept
embe
r 20
13
Liquid Crystals 1671
Figure 13. Snapshot view from the atomistic simulation of part of a column of the N phase of Edicol Sunset Yellow by Chamiand Wilson [45]. The oxygen atoms (shown in red) in the 2-position of the naphthalene nucleus have been outlined to stress thealternating pattern of packing. Reproduced by permission of Professor Mark Wilson.
unusual feature. The N/N+I boundary shows a peakat about 0.8 M (Figure 16). (Normally this bound-ary is a smoothly-rising curve, more or less par-allel to the clearing point curve.) Analysis of theX-ray diffraction patterns (using a Luzatti log/logplot) indicates a double molecule column cross-section (Figure 17). It is possible that there isa change in the column structure occurring at0.8 M – perhaps a change from single to double-widthcolumns [37].
5.3 Non-aqueous solventsAlthough the vast majority of chromonic systems haveinvolved water, there appears to be no fundamentalreason why other solvents should not be effective.Some obvious water-like solvents have been investi-gated and the formation of chromonic phases withdimethyl formamide and methanol was reported byIverson [54].
It may prove advantageous to use more volatilesolvents for the production of ordered films by dry-ing down aligned M phases (or mixtures of water withvolatile solvents). Methanol was added to the aqueoussolution of the dye Levafix Goldgelb during the prepa-ration of real-time holograms by Hahn et al. [55] andtetrahydrofuran was used by Aida and coworkers inthe production of graphitic nanotubes [56].
5.4 Brick wall and chimney structuresThere are only one or two dye/water systems that showX-ray diffraction patterns that are not of the generaltype shown in Figure 10. In these cases the diffractionpatterns indicate a novel brick wall’ structure formedby a half-and-half overlapping of the molecules [35,36] and this appears to be a feasible suggestion inview of the chevron shape of the molecules. There isone known example of a modification of this packing,where a brickwork pattern is wrapped around to createa cylindrical chimney structure [36, 37].
Dow
nloa
ded
by [
Uni
vers
ity o
f A
rizo
na]
at 2
1:32
19
Sept
embe
r 20
13

1672 J. Lydon
NN
SO3
O3S
OH
N N
O
O
O
NH
HCO2
N
N N
O
O
O
ONHNH
HCO2 HCO2
NNH
N HN
X X
XX
X
X X
X
NN
SO3
OH
O3S SO3 NaNa
Na
a
b
c
ed
Figure 14. Molecular structures of a variety of chromonic compounds (a) Edicol Sunset Yellow, (b,c) Perylene dyes, (d)Phthalocyanine core and (e) Acid Red 27.
6. DNA and RNA
It was the quantitative study of the way in whichpurine and pyrimidine bases aggregate in solutionwhich led to the idea that all chromonic systemsmight aggregate isodesmically [42]. When comparedwith compounds that do form chromonic phases (forexample, DSCG), the individual bases appear to berather small – too small perhaps to form chromonicmesophases. But the hydrogen-bonded base pairswould appear to be ideally suited. Note that in double-stranded DNA and RNA, the sugar/phosphate chainsare only loosely wrapped around the stack of bases(Figure 18). They do not force the bases into face-to-face contact. It must be the π–π interactionswhich cause the bases to form loose stacks, andthe double-stranded molecules can be regarded astwinned side-chain chromonic polymers. The struc-ture can be unwound sufficiently to allow the insertionof other aromatic molecules between the base pairs.Intercalating agents include the fluorescent marker,ethidium bromide, dyes, carcinogens such as acridine,anticancer agents (which act by disrupting the prolif-eration of cancerous cells) and a number of antibiotics
like actinomycin, which inhibit the multiplication ofbacteria [42]. Similar intercalation in unpolymerisedchromonic stacks of the N phase has been observedby Mundy et al. [57].
It is presumably necessary for the biological func-tioning of DNA that it should be flexible and fairlyeasy to unwind, so that, during the various copyingand checking processes, the bases can be exposed. Thispicture of the labile nature of DNA is supported bycalorimetric observations. When solutions of double-stranded DNA are heated, there is an appreciableendotherm in the 60–80oC temperature range. Thismarks the separation of the two chains and is knownas ‘melting’ [42] (Figure 19). This process is reversibleand is a crucial step in PCR (polymerase chain reac-tion), the process widely used in molecular biology andforensic studies for the amplification of DNA, wheremillions of copies DNA can be produced from a singlestrand. The precise temperature of melting depends ona number of factors including the AT/CG ratio. (TheG/G and C/G base pairs are joined by different num-bers of hydrogen bonds and the π–π stacking energiesvary with the base sequences).
Dow
nloa
ded
by [
Uni
vers
ity o
f A
rizo
na]
at 2
1:32
19
Sept
embe
r 20
13
Liquid Crystals 1673
6.8 Årepeat
Incident X -rays
3.4 Å
6.8 Å
N
a
b
c
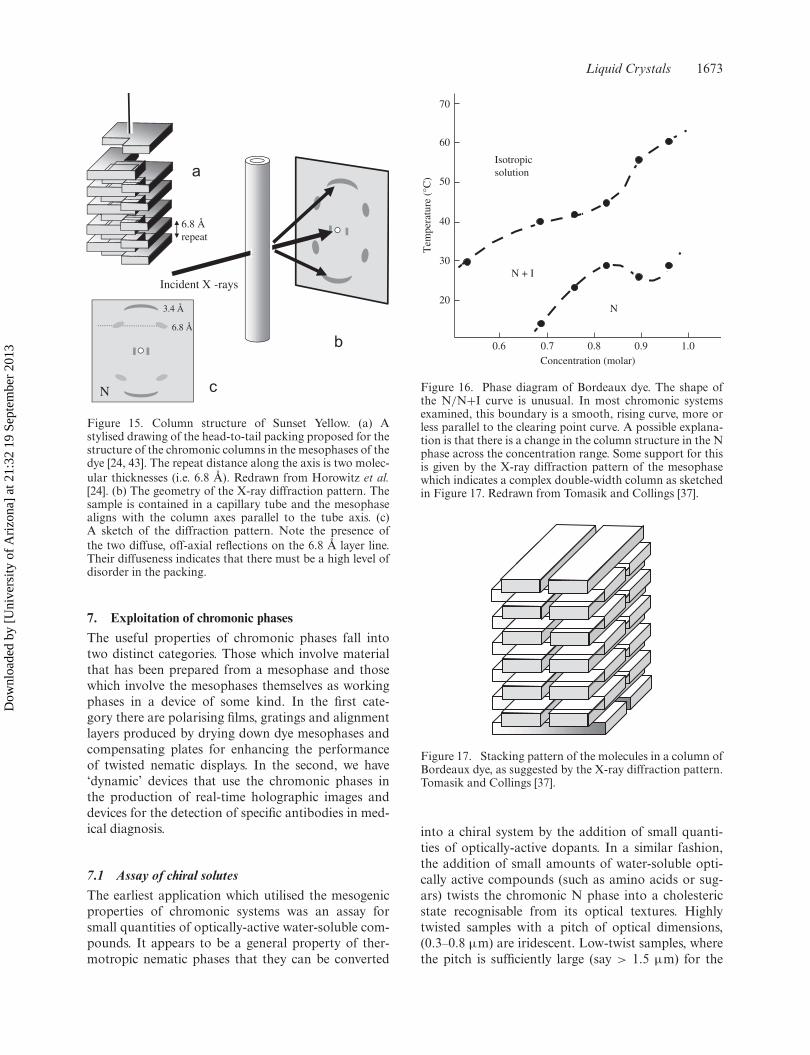
Figure 15. Column structure of Sunset Yellow. (a) Astylised drawing of the head-to-tail packing proposed for thestructure of the chromonic columns in the mesophases of thedye [24, 43]. The repeat distance along the axis is two molec-ular thicknesses (i.e. 6.8 Å). Redrawn from Horowitz et al.[24]. (b) The geometry of the X-ray diffraction pattern. Thesample is contained in a capillary tube and the mesophasealigns with the column axes parallel to the tube axis. (c)A sketch of the diffraction pattern. Note the presence ofthe two diffuse, off-axial reflections on the 6.8 Å layer line.Their diffuseness indicates that there must be a high level ofdisorder in the packing.
7. Exploitation of chromonic phases
The useful properties of chromonic phases fall intotwo distinct categories. Those which involve materialthat has been prepared from a mesophase and thosewhich involve the mesophases themselves as workingphases in a device of some kind. In the first cate-gory there are polarising films, gratings and alignmentlayers produced by drying down dye mesophases andcompensating plates for enhancing the performanceof twisted nematic displays. In the second, we have‘dynamic’ devices that use the chromonic phases inthe production of real-time holographic images anddevices for the detection of specific antibodies in med-ical diagnosis.
7.1 Assay of chiral solutesThe earliest application which utilised the mesogenicproperties of chromonic systems was an assay forsmall quantities of optically-active water-soluble com-pounds. It appears to be a general property of ther-motropic nematic phases that they can be converted
70
60
50
40
30
20
Tem
pera
ture
(°C
)
Isotropicsolution
N + I
N
0.6 0.7 0.8 0.9 1.0Concentration (molar)
Figure 16. Phase diagram of Bordeaux dye. The shape ofthe N/N+I curve is unusual. In most chromonic systemsexamined, this boundary is a smooth, rising curve, more orless parallel to the clearing point curve. A possible explana-tion is that there is a change in the column structure in the Nphase across the concentration range. Some support for thisis given by the X-ray diffraction pattern of the mesophasewhich indicates a complex double-width column as sketchedin Figure 17. Redrawn from Tomasik and Collings [37].
Figure 17. Stacking pattern of the molecules in a column ofBordeaux dye, as suggested by the X-ray diffraction pattern.Tomasik and Collings [37].
into a chiral system by the addition of small quanti-ties of optically-active dopants. In a similar fashion,the addition of small amounts of water-soluble opti-cally active compounds (such as amino acids or sug-ars) twists the chromonic N phase into a cholestericstate recognisable from its optical textures. Highlytwisted samples with a pitch of optical dimensions,(0.3–0.8 μm) are iridescent. Low-twist samples, wherethe pitch is sufficiently large (say > 1.5 μm) for the
Dow
nloa
ded
by [
Uni
vers
ity o
f A
rizo
na]
at 2
1:32
19
Sept
embe
r 20
13

1674 J. Lydon
Figure 18. Intercalation in DNA. The sugar/phosphatechains of DNA are wound round the column loosely enoughto allow intercalation of a guest molecule. In order toaccommodate the alien molecule, the chain must unwind,allowing two bases to move apart and making room for theintercalating to molecule to enter the stack [42].
Figure 19. Stylised representation of the ‘melting’ of DNA.This occurs when a solution of double-stranded DNA isheated and the double helices separate into two singlestrands. This occurs at a temperature in the 60–80oC range(with the precise value depending on the composition andsequence of the bases). There is an appreciable endotherm,easily detectable with a scanning calorimeter [42]. Twoevents occur synergistically – the breaking of the hydrogenbonds that pair the bases and the loosening of the stack-ing interactions between the bases in each strand by thermalvibrations.
individual banding to be resolved, have a character-istic ‘fingerprint’ texture (where the spacing of thebands corresponds to half of the pitch). For low con-centrations of dopant, there is a linear relationshipbetween concentration and twist. Lee and Labes devel-oped this technique as an assay for small quantitiesof optically-active water-soluble compounds and theyhave measured the ‘helical twisting power’ of a numberof compounds [58].
7.2 The production of aligned filmsThermotropic nematic and smectic phases are exten-sively used in display devices and it is usually astraightforward matter to produce planar, (homoge-neous) tilted or perpendicular (homeotropic) align-ment as required. In contrast, the tilted andhomeotropic alignment of chromonic aggregates hasproved to be difficult. All the work on the productionof aligned films and aligned samples in cells describedbelow concerns material with a planar arrangement(where the column axes lie parallel to the surface of thefilm or the substrate plates). The only report describ-ing the production of homeotropically aligned ofchromonic material appears to be that of Nazarenkoet al. [59], who found that, this state was metastable –and in time, the director re-aligned to becometangential.
Many N and M phases can be aligned into a homo-geneous state (in the optical sense) and then drieddown to produce an aligned solid phase with the samelevel of ordering This appears to be a property moreor less unique to chromonic systems. In general, themesophases of both lyotropic and thermotropic sys-tems produce crystalline solids with lower symmetrywhen they are solidified (by cooling or allowing thesolvent to evaporate). They do not retain the structuresof the parent mesophases.
Chromonic N and M phases are usually as easyto align as thermotropic phases and a variety of sim-ilar methods have proved effective. Simply spreadingthe material unidirectionally over a cleaned surfacewith a blade can give surprisingly good alignment.Materials for X-ray diffraction study are often suf-ficiently well-ordered by the flow alignment incurredas the sample tube is filled and no further treatmentis required. Samples for optical investigation can bealigned on prepared substrates and the use of a uni-directionally buffed layer of polyimide is a convenientand widely-used technique. The use of cells with pre-pared substrate surfaces, coupled with a careful fillingtechnique, can give order parameters in the 0.8–0.95range – producing material sufficiently well-orientedfor most purposes. Highly aligned bands of solid dye,for use as polarising filters, can be produced by dry-ing down the mesophase on micro-grooved substrates.The other obvious approaches – electric and mag-netic fields, zone refining and solvent zone refining(where the film is slowly moved across the surface ofa dish of volatile solvent) – have all been found to beeffective [2].
Polarisers are optical devices which filter out thecomponent of an incident beam with vibrations ina particular plane (by removing vibrations in otherdirections). Over the decades, a number of a number
Dow
nloa
ded
by [
Uni
vers
ity o
f A
rizo
na]
at 2
1:32
19
Sept
embe
r 20
13

Liquid Crystals 1675
of types have been evolved. Victorian optics dependedheavily on the Nicol prism, but since the 1920s,Polaroid film, invented by Edwin Land, has been themost widely used. This consists of an aligned array ofsmall iodine crystals in a plastic matrix. It is expensiveto produce to the extent that the most costly parts ofa liquid crystal display are often the Polaroid sheets.There is therefore considerable commercial pressure toproduce cheaper alternatives.
It is beginning to look as if drying down chromonicsolutions will offer a commercially viable method ofproducing aligned dye films. Although highly orientedand more or less monodomain films have been pro-duced by alignment on buffed polyimide surfaces,industrial scale samples, produced by direct shearalignment of the mesophase, have appreciable levelsof disorder, which must reduce their effectiveness. In
this context, the defects in molecular alignment ofchromonic films are of more than trivial interest.
In recent investigations, Kaznatcheev et al. [60]used soft X-ray spectromicroscopy to study the tex-tures of films prepared by drying down films of the twoisomeric sulphonated heterocyclic mesogens (Y1O4and Y1O5) shown in Figure 20. In both cases, theyfound a high level of in-plane alignment, with the col-umn axes lying parallel to the plane of the substrate.The average alignment of column axes was along thedirection of shearing, but there was a sinusoidal undu-lation of the director, giving rise the familiar tiger skintexture of diffuse bands, perpendicular to the shearvector, when the samples were viewed between crossedpolars. (There were also occasional criss-cross pat-terns resulting from the presence of disclinations anddomain walls.)
N NO NN O
SO3H SO3H
SO3H(HO3S) (SO3H)
either/or
Figure 20. Sinusoidal undulations of the director (the chromonic column axis) in films of dried-down, shear-aligned dyes andthe corresponding molecular structures of the two isomeric mesogens examined. The broad arrow indicates the direction ofshear of the mesophase (before the sample is allowed to dry-down). Kaznatcheev et al. [60].
Dow
nloa
ded
by [
Uni
vers
ity o
f A
rizo
na]
at 2
1:32
19
Sept
embe
r 20
13

1676 J. Lydon
When viewed between crossed polars, undulatingpatterns of this kind give the pattern of diffuse bandsdescribed as a ‘tiger skin’ texture. Aligned striatedpatterns of this kind are frequently encountered insamples of chromonic N phase prepared in a variety ofways, and held in tubes and flat cells and spread as sur-face films. They are also found in thermotropic discoticsystems. It would appear, therefore, that the creation ofthis pattern of regular undulation of the director rep-resents an easy way for phases composed of flexiblestacks to relieve asymmetric stress that has built up inthe system.
The two mesophases examined gave films withqualitatively similar striated textures. However, therewere appreciable quantitative differences. The princi-pal distinction was the level of undulation, with theangular variation of the in-plane director for Y104being twice that for the isomeric Y105. This can betaken to illustrate the level of sensitivity of the bulkproperties of the chromonic mesophase to changes inthe molecular structure; in this case, presumably theelastic constant for bending. It will be interesting tosee how easily this can be demonstrated with computersimulations.
Polarising filters made from dried-downchromonic dye mesophases are only effective over therange of absorption wavelengths of the particular dyesused. However, this may not be a serious problem inview of the co-miscibility of many chromonic dyes inthe N and M phases. Tam-Chang et al. have describedthe use of a mixture of two chromonic perylene dyeswhich absorbs over almost the entire visible range [61].
7.3 Photo-alignmentOne particularly promising approach for the produc-tion of aligned dye films is to dry down the mesophaseon a directing layer. Orienting surfaces for this pro-cess can be prepared from photo-aligned polymers asoutlined in Figure 21. The directing layer, consistingof a polyamide with dimethylaminoazobenzene sidechains, is first deposited on the glass substrate by spincoating. This gives a surface film that is un-oriented.However, the azobenzene groups become aligned whenirradiated with plane-polarised light and this gives adirecting layer capable of aligning the N and M phasesof a chromonic dye. Crucially, the molecular orienta-tion is preserved in the solid state when the mesophaseis allowed to dry down [62–64].
The vital features of most compounds used in theconstruction of directing layers are the azo groups.By incorporating these groups into the mesogenmolecules themselves, it is possible to by-pass theseparate directing layer and produce chromonicphases which can be directly aligned by polarised
Figure 21. Production of oriented dye films using a photo-alignment technique [62–64]. This schematic diagram showsthe principle of the photo-alignment technique. (a) Thesubstrate surface is spin-coated with a polymer film. (b)Irradiation with a beam of plane-polarised light aligns thepolymer film. (c) A solution of a chromonic dye in the N-phase is aligned by contact with the polymer film and themolecular orientation is retained as the dye is dried down.
light. This approach is very versatile. It is possibleto make detailed micro-patterned polymer surfacesby masking out parts of the original aligning sur-face and then re-radiating the exposed areas withpolarised light with a different vibration direction.Micro-patterned dye films have been produced in thisway, by Matsunaga et al. for use in binocular disparitystereoscopic displays [65].
As a further demonstration of the versatility ofphotoalignment techniques, Hahn et al. have con-structed real-time holographic gratings [55]. They useda cell filled with the N phase of the azo dye, LevafixGoldgelb. This cell was placed in the light path of aholographic generating system and subjected to forcedRayleigh scattering. The holographic grating wasapparent when the cell was viewed under polarisedlight,
7.4 Re-usable templatesRe-usable template surfaces can be employed to pro-duce aligned dried-down films of chromonic dye, bythe procedure depicted in Figure 22. Tam-Chang and
Dow
nloa
ded
by [
Uni
vers
ity o
f A
rizo
na]
at 2
1:32
19
Sept
embe
r 20
13
Liquid Crystals 1677
a
b
c
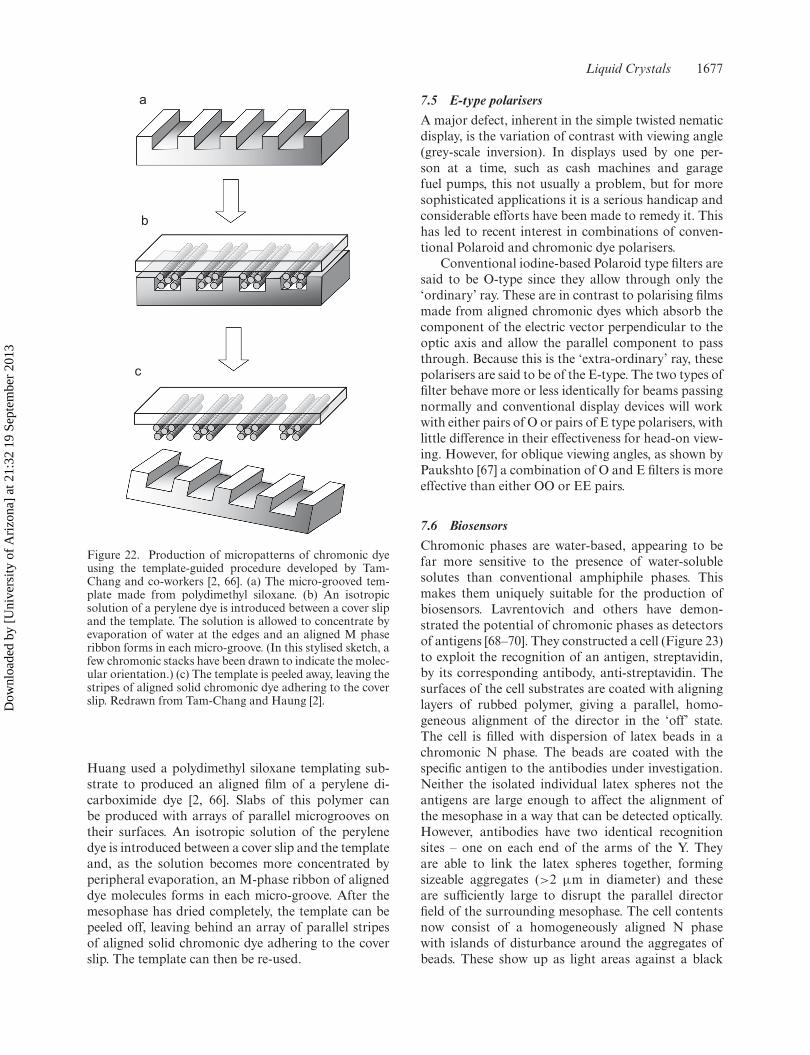
Figure 22. Production of micropatterns of chromonic dyeusing the template-guided procedure developed by Tam-Chang and co-workers [2, 66]. (a) The micro-grooved tem-plate made from polydimethyl siloxane. (b) An isotropicsolution of a perylene dye is introduced between a cover slipand the template. The solution is allowed to concentrate byevaporation of water at the edges and an aligned M phaseribbon forms in each micro-groove. (In this stylised sketch, afew chromonic stacks have been drawn to indicate the molec-ular orientation.) (c) The template is peeled away, leaving thestripes of aligned solid chromonic dye adhering to the coverslip. Redrawn from Tam-Chang and Haung [2].
Huang used a polydimethyl siloxane templating sub-strate to produced an aligned film of a perylene di-carboximide dye [2, 66]. Slabs of this polymer canbe produced with arrays of parallel microgrooves ontheir surfaces. An isotropic solution of the perylenedye is introduced between a cover slip and the templateand, as the solution becomes more concentrated byperipheral evaporation, an M-phase ribbon of aligneddye molecules forms in each micro-groove. After themesophase has dried completely, the template can bepeeled off, leaving behind an array of parallel stripesof aligned solid chromonic dye adhering to the coverslip. The template can then be re-used.
7.5 E-type polarisersA major defect, inherent in the simple twisted nematicdisplay, is the variation of contrast with viewing angle(grey-scale inversion). In displays used by one per-son at a time, such as cash machines and garagefuel pumps, this not usually a problem, but for moresophisticated applications it is a serious handicap andconsiderable efforts have been made to remedy it. Thishas led to recent interest in combinations of conven-tional Polaroid and chromonic dye polarisers.
Conventional iodine-based Polaroid type filters aresaid to be O-type since they allow through only the‘ordinary’ ray. These are in contrast to polarising filmsmade from aligned chromonic dyes which absorb thecomponent of the electric vector perpendicular to theoptic axis and allow the parallel component to passthrough. Because this is the ‘extra-ordinary’ ray, thesepolarisers are said to be of the E-type. The two types offilter behave more or less identically for beams passingnormally and conventional display devices will workwith either pairs of O or pairs of E type polarisers, withlittle difference in their effectiveness for head-on view-ing. However, for oblique viewing angles, as shown byPaukshto [67] a combination of O and E filters is moreeffective than either OO or EE pairs.
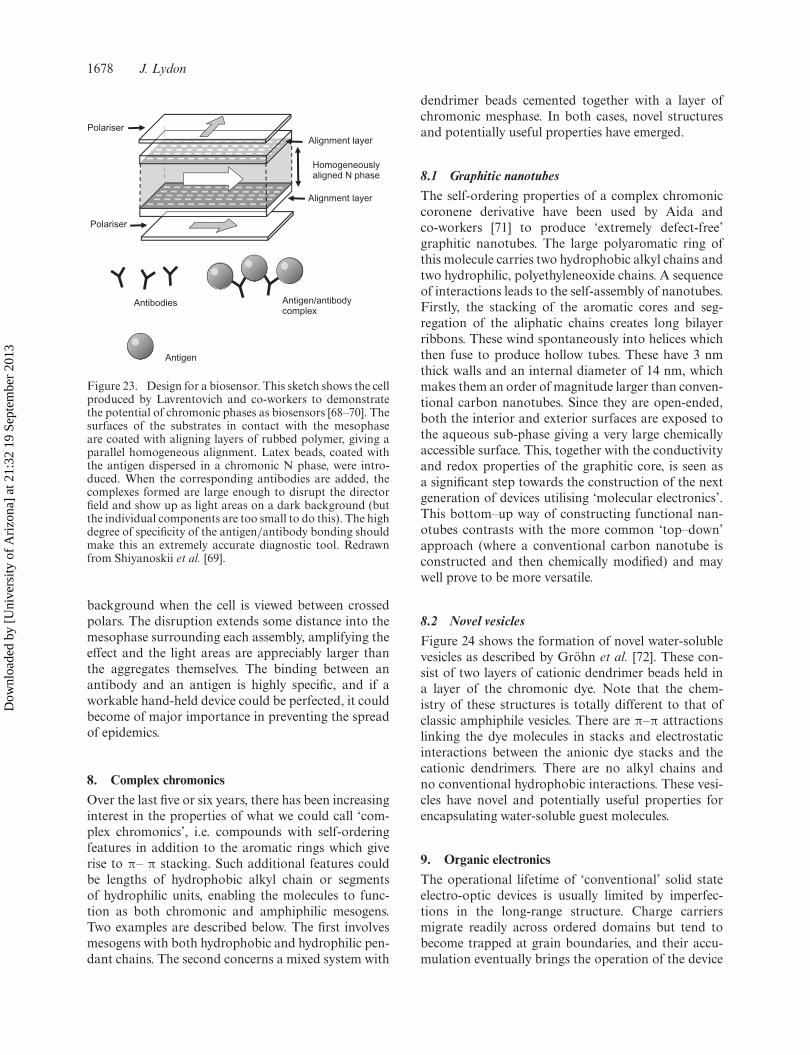
7.6 BiosensorsChromonic phases are water-based, appearing to befar more sensitive to the presence of water-solublesolutes than conventional amphiphile phases. Thismakes them uniquely suitable for the production ofbiosensors. Lavrentovich and others have demon-strated the potential of chromonic phases as detectorsof antigens [68–70]. They constructed a cell (Figure 23)to exploit the recognition of an antigen, streptavidin,by its corresponding antibody, anti-streptavidin. Thesurfaces of the cell substrates are coated with aligninglayers of rubbed polymer, giving a parallel, homo-geneous alignment of the director in the ‘off’ state.The cell is filled with dispersion of latex beads in achromonic N phase. The beads are coated with thespecific antigen to the antibodies under investigation.Neither the isolated individual latex spheres not theantigens are large enough to affect the alignment ofthe mesophase in a way that can be detected optically.However, antibodies have two identical recognitionsites – one on each end of the arms of the Y. Theyare able to link the latex spheres together, formingsizeable aggregates (>2 μm in diameter) and theseare sufficiently large to disrupt the parallel directorfield of the surrounding mesophase. The cell contentsnow consist of a homogeneously aligned N phasewith islands of disturbance around the aggregates ofbeads. These show up as light areas against a black
Dow
nloa
ded
by [
Uni
vers
ity o
f A
rizo
na]
at 2
1:32
19
Sept
embe
r 20
13
1678 J. Lydon
Alignment layer
Alignment layer
Polariser
Homogeneously aligned N phase
Polariser
Antigen/antibody complex
Antibodies
Antigen
Figure 23. Design for a biosensor. This sketch shows the cellproduced by Lavrentovich and co-workers to demonstratethe potential of chromonic phases as biosensors [68–70]. Thesurfaces of the substrates in contact with the mesophaseare coated with aligning layers of rubbed polymer, giving aparallel homogeneous alignment. Latex beads, coated withthe antigen dispersed in a chromonic N phase, were intro-duced. When the corresponding antibodies are added, thecomplexes formed are large enough to disrupt the directorfield and show up as light areas on a dark background (butthe individual components are too small to do this). The highdegree of specificity of the antigen/antibody bonding shouldmake this an extremely accurate diagnostic tool. Redrawnfrom Shiyanoskii et al. [69].
background when the cell is viewed between crossedpolars. The disruption extends some distance into themesophase surrounding each assembly, amplifying theeffect and the light areas are appreciably larger thanthe aggregates themselves. The binding between anantibody and an antigen is highly specific, and if aworkable hand-held device could be perfected, it couldbecome of major importance in preventing the spreadof epidemics.
8. Complex chromonics
Over the last five or six years, there has been increasinginterest in the properties of what we could call ‘com-plex chromonics’, i.e. compounds with self-orderingfeatures in addition to the aromatic rings which giverise to π– π stacking. Such additional features couldbe lengths of hydrophobic alkyl chain or segmentsof hydrophilic units, enabling the molecules to func-tion as both chromonic and amphiphilic mesogens.Two examples are described below. The first involvesmesogens with both hydrophobic and hydrophilic pen-dant chains. The second concerns a mixed system with
dendrimer beads cemented together with a layer ofchromonic mesphase. In both cases, novel structuresand potentially useful properties have emerged.
8.1 Graphitic nanotubesThe self-ordering properties of a complex chromoniccoronene derivative have been used by Aida andco-workers [71] to produce ‘extremely defect-free’graphitic nanotubes. The large polyaromatic ring ofthis molecule carries two hydrophobic alkyl chains andtwo hydrophilic, polyethyleneoxide chains. A sequenceof interactions leads to the self-assembly of nanotubes.Firstly, the stacking of the aromatic cores and seg-regation of the aliphatic chains creates long bilayerribbons. These wind spontaneously into helices whichthen fuse to produce hollow tubes. These have 3 nmthick walls and an internal diameter of 14 nm, whichmakes them an order of magnitude larger than conven-tional carbon nanotubes. Since they are open-ended,both the interior and exterior surfaces are exposed tothe aqueous sub-phase giving a very large chemicallyaccessible surface. This, together with the conductivityand redox properties of the graphitic core, is seen asa significant step towards the construction of the nextgeneration of devices utilising ‘molecular electronics’.This bottom–up way of constructing functional nan-otubes contrasts with the more common ‘top–down’approach (where a conventional carbon nanotube isconstructed and then chemically modified) and maywell prove to be more versatile.
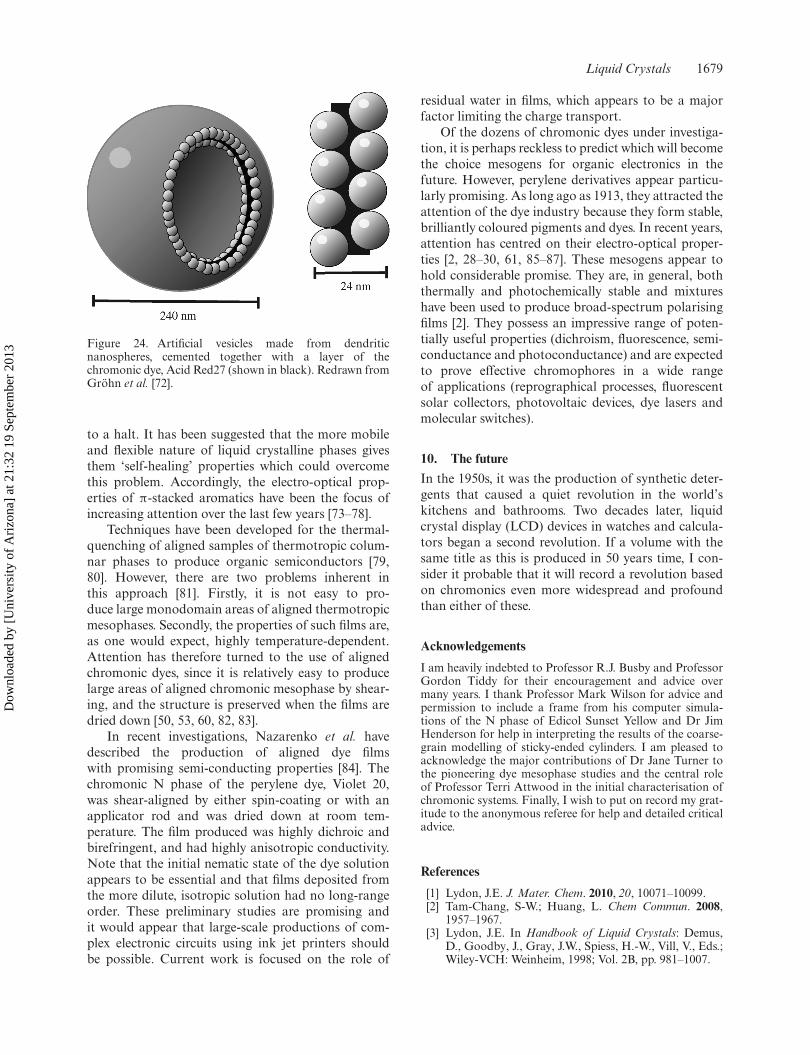
8.2 Novel vesiclesFigure 24 shows the formation of novel water-solublevesicles as described by Gröhn et al. [72]. These con-sist of two layers of cationic dendrimer beads held ina layer of the chromonic dye. Note that the chem-istry of these structures is totally different to that ofclassic amphiphile vesicles. There are π–π attractionslinking the dye molecules in stacks and electrostaticinteractions between the anionic dye stacks and thecationic dendrimers. There are no alkyl chains andno conventional hydrophobic interactions. These vesi-cles have novel and potentially useful properties forencapsulating water-soluble guest molecules.
9. Organic electronics
The operational lifetime of ‘conventional’ solid stateelectro-optic devices is usually limited by imperfec-tions in the long-range structure. Charge carriersmigrate readily across ordered domains but tend tobecome trapped at grain boundaries, and their accu-mulation eventually brings the operation of the device
Dow
nloa
ded
by [
Uni
vers
ity o
f A
rizo
na]
at 2
1:32
19
Sept
embe
r 20
13
Liquid Crystals 1679
Figure 24. Artificial vesicles made from dendriticnanospheres, cemented together with a layer of thechromonic dye, Acid Red27 (shown in black). Redrawn fromGröhn et al. [72].
to a halt. It has been suggested that the more mobileand flexible nature of liquid crystalline phases givesthem ‘self-healing’ properties which could overcomethis problem. Accordingly, the electro-optical prop-erties of π-stacked aromatics have been the focus ofincreasing attention over the last few years [73–78].
Techniques have been developed for the thermal-quenching of aligned samples of thermotropic colum-nar phases to produce organic semiconductors [79,80]. However, there are two problems inherent inthis approach [81]. Firstly, it is not easy to pro-duce large monodomain areas of aligned thermotropicmesophases. Secondly, the properties of such films are,as one would expect, highly temperature-dependent.Attention has therefore turned to the use of alignedchromonic dyes, since it is relatively easy to producelarge areas of aligned chromonic mesophase by shear-ing, and the structure is preserved when the films aredried down [50, 53, 60, 82, 83].
In recent investigations, Nazarenko et al. havedescribed the production of aligned dye filmswith promising semi-conducting properties [84]. Thechromonic N phase of the perylene dye, Violet 20,was shear-aligned by either spin-coating or with anapplicator rod and was dried down at room tem-perature. The film produced was highly dichroic andbirefringent, and had highly anisotropic conductivity.Note that the initial nematic state of the dye solutionappears to be essential and that films deposited fromthe more dilute, isotropic solution had no long-rangeorder. These preliminary studies are promising andit would appear that large-scale productions of com-plex electronic circuits using ink jet printers shouldbe possible. Current work is focused on the role of
residual water in films, which appears to be a majorfactor limiting the charge transport.
Of the dozens of chromonic dyes under investiga-tion, it is perhaps reckless to predict which will becomethe choice mesogens for organic electronics in thefuture. However, perylene derivatives appear particu-larly promising. As long ago as 1913, they attracted theattention of the dye industry because they form stable,brilliantly coloured pigments and dyes. In recent years,attention has centred on their electro-optical proper-ties [2, 28–30, 61, 85–87]. These mesogens appear tohold considerable promise. They are, in general, boththermally and photochemically stable and mixtureshave been used to produce broad-spectrum polarisingfilms [2]. They possess an impressive range of poten-tially useful properties (dichroism, fluorescence, semi-conductance and photoconductance) and are expectedto prove effective chromophores in a wide rangeof applications (reprographical processes, fluorescentsolar collectors, photovoltaic devices, dye lasers andmolecular switches).
10. The future
In the 1950s, it was the production of synthetic deter-gents that caused a quiet revolution in the world’skitchens and bathrooms. Two decades later, liquidcrystal display (LCD) devices in watches and calcula-tors began a second revolution. If a volume with thesame title as this is produced in 50 years time, I con-sider it probable that it will record a revolution basedon chromonics even more widespread and profoundthan either of these.
Acknowledgements
I am heavily indebted to Professor R.J. Busby and ProfessorGordon Tiddy for their encouragement and advice overmany years. I thank Professor Mark Wilson for advice andpermission to include a frame from his computer simula-tions of the N phase of Edicol Sunset Yellow and Dr JimHenderson for help in interpreting the results of the coarse-grain modelling of sticky-ended cylinders. I am pleased toacknowledge the major contributions of Dr Jane Turner tothe pioneering dye mesophase studies and the central roleof Professor Terri Attwood in the initial characterisation ofchromonic systems. Finally, I wish to put on record my grat-itude to the anonymous referee for help and detailed criticaladvice.
References
[1] Lydon, J.E. J. Mater. Chem. 2010, 20, 10071–10099.[2] Tam-Chang, S-W.; Huang, L. Chem Commun. 2008,
1957–1967.[3] Lydon, J.E. In Handbook of Liquid Crystals: Demus,
D., Goodby, J., Gray, J.W., Spiess, H.-W., Vill, V., Eds.;Wiley-VCH: Weinheim, 1998; Vol. 2B, pp. 981–1007.
Dow
nloa
ded
by [
Uni
vers
ity o
f A
rizo
na]
at 2
1:32
19
Sept
embe
r 20
13
1680 J. Lydon
[4] Lydon, J.E. Curr. Opin. Colloid Interface Sci. 1998, 3,458–466.
[5] Lydon, J.E. Curr. Opin. Colloid Interface Sci. 2004, 8,480–489.
[6] Lydon, J.E., Liq. Cryst. Today, 2007, 16, 13–27.[7] Sandquist, H. Belr. Dtsch. Chem. Ges. 1915, 48,
2054–2055.[8] Balaban, I.F.; King, H. J. Chem. Soc. 1927, 127,
3068–3097.[9] Gaubert, P. C. R. 1933, 197, 1436–1438; C. R. 1934,
198, 951–953; C. R. 1935, 200, 679–680.[10] Jelley, E.E. Nature 1936, 138, 1009–1011; Nature 1937,
139, 631–632.[11] Scheibe, G. Angew Chem. 1937, 50, 212–219.[12] Altounyan, R.E.C. Schweiz. Med. Wochenschr. 1980,
110, 179–181.[13] Pepys, J.; Frankland, A.E. Disodium Cromoglycate in
Allergic Airways Disease; Butterworths: London, 1970.[14] Cox, J.S.G.; Woodard, G.D.; McCrone, W.C. J. Pharm.
Sci. 1971, 60, 1458–1465.[15] Hartshorne, N.H.; Woodard, G.D. Mol. Cryst. Liq.
Cryst. 1973, 23, 343–368.[16] Rogers, J.; Winsor, P.A. J. Colloid Interface Sci. 1969,
30, 500–510.[17] Lydon, J.E. Mol. Cryst. Liq. Cryst. Lett. 1980, 64,
19–24.[18] Hui, Y.W.; Labes, M.M. J. Phys. Chem. 1986, 90,
4064–4067.[19] Ramesh, V.; Chien, H.S.; Labes, M.M. J Phys. Chem.
1987, 91, 5937–5940.[20] Attwood, T.K.; Lydon, J.E. Mol. Cryst. Liq. Cryst.
1984, 108, 349–357.[21] Nastishin, Y.A.; Liu, H.; Shiyanovskii, S.V.;
Lavrentovich, O.D.; Kostko, A.K.; Anisimov, M.A.Phys. Rev. E: Stat. Nonlinear, Soft Matter Phys. 2004,70, 051706 (1–9).
[22] Nastishin, Y.A.; Liu, H.; Schneider, T.; Nazarenko,V.; Vasyuta, R.; Shiyanovskii, S.V.; Lavrentovich, O.D.Phys. Rev. E: Stat. Nonlinear, Soft Matter Phys. 2005,72, 041711 (1–14).
[23] Sadler, D.E.; Shannon, M.D.; Tollin, P.; Young, G.W.;Edmondson, M.; Rainsford, P. Liq. Cryst. 1986, 1,509–520.
[24] Horowitz, V.R.; Janowitz, L.A.; Modic, A.L.; Heiney,P.A.; Collings, P.G. Phys. Rev. E: Stat. Nonlinear, SoftMatter Phys. 2005, 72, 041710 (1–10).
[25] Attwood, T.K.; Lydon, J.E.; Jones, F. Liq. Cryst. 1986,1, 499–507.
[26] Attwood, T.K.; Lydon, J.E.; Hall, C.; Tiddy, C.J.T. Liq.Cryst. 1990, 7, 657–668.
[27] Turner, J.E.; Lydon, J.E. Mol. Cryst. Liq. Cryst. Lett.1988, 5, 93–99.
[28] Iverson, I.K.; Tam-Chang, S.-W. J. Am. Chem. Soc.1999, 121, 5801–5802.
[29] Iverson, I.K.; Casey, S.M.; Seo, W.; Tam-Chang, S.-W.;Pindzola, B.A. Langmuir 2002, 18, 3510–3516.
[30] Tam-Chang, S.-W.; Iverson, I.K.; Helbley, J. Langmuir2004, 20, 342–347.
[31] Collings, P.J. Liquid Crystals: Nature’s delicate phase ofmatter, 2nd ed.; Princeton University Press, Princeton,NJ, 2001.
[32] Turner, J.E. PhD, Thesis, University of Leeds, 1988.[33] Edwards, D.J.; Ormerod, A.; Tiddy, G.J.T.; Jabber,
A.A.; Mahendrasingham, A. Adv. Color Chem. Ser.1996, 4, 83–106.
[34] Kustanovitch, I.; Poupko, R.; Zimmermann, H.; Lux,Z.; Labes, M.M. J. Am. Chem. Soc. 1984, 107, 3494–3501.
[35] Tiddy, G.J.T.; Mateer, D.L.; Ormerod, A.P.; Harrison,W.J.; Edwards, D.J. Langmuir 1995, 11, 390–393.
[36] Harrison, W.J.; Mateer, D.L.; Tiddy, G.J.T. J. Phys.Chem. 1996, 100, 2310–2321.
[37] Tomasik, M.R.; Collings, P.J. J. Phys. Chem. B 2008,112, 9883–9889.
[38] Goldfarb, D.; Moseley, M.E.; Labes, M.M.; Luz, Z.Mol. Cryst. Liq. Cryst. 1982, 89, 119–135.
[39] Goldfarb, D.; Labes, M.M.; Luz, Z.; Poupko, R. Mol.Cryst. Liq. Cryst. 1982, 87, 259–279.
[40] Goldfarb, D.; Luz, Z.; Spielberg, N.; Zimmermann, H.Mol. Cryst. Liq. Cryst. 1985, 126, 225–246.
[41] Park, H.; Kang, S.W.; Tortora, L.; Nastishin, Y.;Finotello, D.; Lavrentovich, O.D. Proc. SPIE 2007,6487.
[42] See for example, Saenger, W. Principles of NucleicAcid Structure, Springer Advanced Texts in Chemistry;Springer Verlag: New York, 1983.
[43] Edwards, D.J.; Jones, J.W.; Lozman, O.; Ormerod, A.P.;Sintyureva, M.; Tiddy, G.J.T. J. Phys. Chem. B 2008,112, 14628–14636.
[44] Kuriabova, T.; Betterton, M.D.; Glaser, M.A. J. Mater.Chem. 2010, 20, 10366–10383.
[45] Chami, F.; Wilson, M.R. J. Am. Chem. Soc. 2010, 132,7794–7802.
[46] Perahia, D.; Watchel, E.J.; Luz, Z. Liq. Cryst. 1991, 9,479–492.
[47] Bykov, V.A.; Sharimanov, Y.G.; Mrevlishvili, G.M.;Mdzinarashvili, T.D.; Metreveli, N.O.; Kakabadze,G.R. Mol. Cryst. Liq. Cryst. Sci. Technol., Sect. C 1992,1, 73–83.
[48] Usol’tseva, N.V. Mol. Cryst. Liq. Cryst. Sci. Technol.,Sect. A 1996, 288, 201–210.
[49] Imae, T.; Gagel, L.; Tunich, C.; Platz, G.; Iwamoto, T.;Funayama, K. Langmuir 1998, 14, 2197–2200
[50] Schneider, T.; Lavrentovich, O.D. Langmuir 2000, 19,5227–5230.
[51] Ichimura, K.; Fujiwara, T.; Momose, M.; Matsunaga,D. J. Mater. Chem. 2002, 12, 3380–3386.
[52] Ruslim, C.; Matsunaga, D.; Hashimoto, M.; Tamaki,T.; Ichimura, K. Langmuir 2003, 19, 3686–3691
[53] Boiko, O.P.; Vasyuta, R.M.; Nazarenko, V.G.;Pergamenshchik, V.M.; Nastishin, Y.A.; Lavrentovich,O.D. Mol. Cryst. Liq. Cryst. 2007, 467, 181–194.
[54] Iverson, I.K. Dissertation, University of Nevada, Reno,2000 (this is mentioned in [2]).
[55] Hahn, C.; Spring, I.; Thunig, C.; Platz, G.; Wokaun, A.Langmuir 1998, 14, 6871–6878.
[56] Hill, J.P.; Jin, W.; Kosaka, A.; Fukushima, T.; Ichihara,H.; Shimomura, T.; Ito, K.; Hashizume, T.; Ishii, N.;Aida, T. Science, 2004, 304, 1481–1483.
[57] Mundy, K.; Sleep, J.C.; Lydon, J.E. Liq Cryst. 1995, 19,107–112.
[58] Lee, H.; Labes, M.M. Mol. Cryst. Liq. Cryst. 1982, 84,137–157.
[59] Nazarenko, V.G.; Boiko, O.P.; Park, H.-S.; Brodyn,O.M.; Omelchenko, M.M.; Tortora, L.; Nastishin,Y.A.; Lavrentovich, O.D. Phys. Rev. Lett. 2010, 105,017801 (1–3).
[60] Kaznatcheev, K.V.; Dudin, P.; Lavrentovich, O.D.;Hitchcock, A.P. Phys. Rev. E: Stat. Nonlinear, SoftMatter Phys. 2007, 76, 061703 (1–14).
Dow
nloa
ded
by [
Uni
vers
ity o
f A
rizo
na]
at 2
1:32
19
Sept
embe
r 20
13
Liquid Crystals 1681
[61] Tam-Chang, S.-W.; Seo, W.; Kyle, R.; Casey, S.M.Chem. Mater. 2004, 16, 1832–1834.
[62] Fujiwara, T.; Ichimura, K. J. Mater. Chem. 2002, 12,3387–3391.
[63] Ichimura, K. Mol. Cryst. Liq. Cryst. 1997, 298,221–226.
[64] Lavrentovich, M.D.; Sergan, M.; Kelly, J. Liq. Cryst.2003, 30, 851–859.
[65] Matsunaga, D.; Tamaki, T.; Akiyama, H.; Ichimura, K.Adv. Mater. 2002, 14, 1477–1480.
[66] Tam-Chang, S.-W.; Helbley, J.; Carson, T.D.; Seo, W.;Iverson, I.K. Chem. Commun. 2006, 503–505.
[67] Paukshto, M.V. E-type polarisers and their applications;Optiva Inc.: San Francisco, 2001.
[68] Shiyanovskii, S.V.; Lavrentovich, O.D.; Schneider,T.; Ishikawa, T.; Smalyukh, I.I.; Woolverton, C.J.;Niehaus, G.D.; Doane, K.J. Mol. Cryst. Liq. Cryst.2005, 434, 259–270.
[69] Shiyanovskii, S.V.; Schneider, T.; Smalyukh, I.I.;Ishikawa, T.; Niehaus, G.D.; Doane, K.J.; Woolverton,C.J.; Lavrentovich, O.D. Phys. Rev. E: Stat. Nonlinear,Soft Matter Phys. 2005, 71, 020702 (1–4).
[70] Woolverton, C.J.; Gustely, E.; Li, L.; Lavrentovich,O.D. Liq. Cryst. 2005, 32, 417–423.
[71] Hill, J.P.; Jin, W.; Kosaka, A.; Fukushima, T.; Ichihara,H.; Shimomura, T.; Ito, K.; Hashizume, T.; Ishii, N.;Aida, T. Science, 2004, 304, 1481–1483.
[72] Gröhn, F.; Klein, K.; Koynov, K. Macromol. RapidCommun. 2010, 31, 75–80.
[73] Müllen, K.; Scherf, U. Organic Light Emitting Devices:Synthesis, Properties and Applications; Wiley-VCH:Weinheim, 2006.
[74] Tolkki, A.; Vuorimaa, E.; Chukharev, V.;Lemmetyinen, H.; Ihalainen, P.; Peltonen, J.; Dehm, V.;Würthner, F. Langmuir 2010, 26, 6630–6637.
[75] Lee, S.K.; Zu, Y.; Herrmann, A.; Geerts, Y.; Müllen,K.; Bard, A.J. J. Am. Chem. Soc. 1999, 121, 3513–3520.
[76] Percec, V.; Glodde, M.; Bera, T.K.; Miura, Y.;Shiyanovskaya, I.; Singer, K.D.; Balagurusamy, V.S.K.;Heiney, P.A.; Schnell, I.; Rapp, A.; Spiess, H.-W.;Hudson, S.D.; Duan, H. Nature 2002, 419, 384–387.
[77] Oikawa, K.; Monobe, H.; Nakayama, K.; Kimoto, T.;Tsuchiya, K.; Heinrich, B.; Guillon, D.; Shimizu, Y.;Yokoyama, M. Adv. Mater. 2007, 19, 1864–1868.
[78] Funahashi, M.; Zhang, F.; Tamaoki, N. Adv. Mater.2007, 19, 353–358.
[79] Garnier, F.; Hajlaoui, R.; Horowitz, G.; Laigre, L.;Porzio, W.; Armanini, M.; Provasoli, F. Chem. Mater.1998, 10, 3334–3339.
[80] Amundson, K.R.; Katz, H.E.; Lovinger, A.J. Thin SolidFilms, 2003, 426, 140–149.
[81] Demenev, C.A.; Eichhorn, S.H.; Taerum, T.;Perepichka, D.F.; Patwardhan, S.; Grozema, F.C.;Siebbeles, L.D.A.; Klenkler, R. Chem. Mater. 2010, 22,1420–1428.
[82] Schneider, T.; Artyushkova, K.; Fulghum, J.E.;Broadwater, L.; Smith, A.; Lavrentovich, O.D.Langmuir 2005, 21, 2300–2307.
[83] Ignatov, L.; Lazarev, P.; Nazarov, V.; Ovchinnikova, N.;Paukshto, M. Proc. SPIE 2002, 4807, 177–178.
[84] Nazarenko, V.G.; Boiko, O.P.; Anisimov, M.I.;Kadashchuk, A.K.; Nastishin, Y.A.; Golovin, A.B.;Lavrentovich, O.D. Appl. Phys. Lett. 2010, 97, 263305(1–3).
[85] Tam-Chang, S.-W.; Seo, W.; Iverson, I.K.; Casey, S.M.Angew. Chem., Int. Ed. 2003, 42, 897–900.
[86] Tam-Chang, S.-W.; Seo, W.; Iverson, I.K. J. Org. Chem.,2004, 69, 2719–2726.
[87] Seo, W. Dissertation, University of Nevada, Reno, NV,2004.
Dow
nloa
ded
by [
Uni
vers
ity o
f A
rizo
na]
at 2
1:32
19
Sept
embe
r 20
13