chromosomal abnormalities and epstein barr virus in …
TRANSCRIPT

CHROMOSOMAL ABNORMALITIES AND
EPSTEIN BARR VIRUS IN ACUTE LYMPHOBLASTIC LEUKEMIA IN CHILDREN
A thesis submitted in partial fulfillment for the requirements for the degree of Doctor of Philosophy in
Haematology
By
Dr. Ghulam Shah Nizamani
Department of Pathology Faculty of Medicine and Allied Medical Sciences
Isra University, Hyderabad, Sindh
2016

CHROMOSOMAL ABNORMALITIES AND
EPSTEIN BARR VIRUS IN ACUTE LYMPHOBLASTIC LEUKEMIA IN CHILDREN
by
Dr. Ghulam Shah Nizamani
Name of Supervisor and co-supervisors
Dr. Zaheer Ahmed Nizamani
PhD (France)
Prof. Dr. Fatah Din Khand PhD
Prof. Dr. Mohammad Ahmed Azami PhD

DEDICATION
THIS THESIS IS DEDICATED TO MY PARENTS & TEACHERS
CERTIFICATE
This is to certify that DR. GHULAM SHAH NIZAMANI S/O ALLAH BAKHSH
NIZAMANI has carried out research work on the topic “CHROMOSOMAL
ABNORMALITIES AND EPSTEIN BARR VIRUS IN ACUTE
LYMPHOBLASTIC LEUKEMIA IN CHILDREN” under my supervision and that
his work is original and his thesis is worthy of presentation to Isra University for
awarding the degree of “Doctor of Philosophy” in the subject of Haematology.
Dr. Zaheer Ahmed Nizamani, Associate Professor, Pathology Sindh Agriculture University, Tando Jam. Supervisor

v
ACKNOWLEDGEMENT
With the deep and profound sense of gratitude and thanks to the almighty
ALLAH for giving me the chance for completing this thesis, I am greatly indebted to
my respected Supervisor, Dr. Zaheer Ahmed Nizamani Associate Professor
Pathology Sindh Agriculture University, Tando Jam and Co-supervisor, Prof. Dr.
Fatah Din Khand, Prof. Dr. Mohammad Ahmed Azmi for the cooperation, guidance
and constructive criticism in the successful completion of this thesis and without their
help, this manuscript was not possible to complete. I am grateful to Prof. Dr. Ghulam
Qadir Kazi, Vice Chancellor Isra University for his valuable co-operation and support
which enabled me to complete this work.

vi
ABSTRACT
Background: Acute lymphoblastic leukemia (ALL) is a disease typically
characterized by the accumulation of immature abnormal lymphoid progenitor cells
(lymphoblasts) in the bone marrow, which have abnormal proliferation and
differentiation. A number of acquired chromosomal abnormalities arising from
translocations, deletions, duplications and inversions have been identified in 80% of
childhood and 79% of adulthood ALL.
1. Objectives of Study: To determine the frequency of chromosomal
abnormalities in children suffering from ALL, To evaluate structural and
numerical chromosomal abnormalities in patients with ALL, To find out the
frequency of Epstein Barr Virus in ALL cases.
Subjects and Methods: An observational study was conducted at the Liaquat
University of Medical and Health Sciences, Jamshoro and Isra University Hospital,
Hyderabad. 100 diagnosed childhood ALL cases were selected through non-
probability purposive sampling according to inclusion and exclusion criteria. The
Blood samples were collected in bottles containing Ethylene diamine tetra acetic
acid (EDTA) as an anticoagulant and were processed on automatic hematoanalyzer,
Sysmex KX 21. Fixed cell suspensions prepared from diagnostic bone marrow. For
routine cytogenetic analysis and FISH, samples were obtained from the diagnosed
cases of acute lymphoblastic leukemia. Methods for detecting EBV infection were
based on RT-PCR. The data was analyzed on SPSS version 21.0 (IBM, Corporation,
USA) and Microsoft excel. The continuous variables were presented as mean ± SD
and analyzed using student’s t-test. Categorical variables were analyzed by Chi-
square test and results were presented as frequencies and percentages. Data was

vii
presented in tables, graphs and charts. P-value of significance was taken at ≤0.05.
Results: Numerical and structural chromosomal abnormalities were noted in 69%
and 60% of cases respectively (p=0.001). Chromosomal ploidy showed Diploidy
and Aneuploidy in 29% and 69% of cases respectively (p=0.0001). Hyperploidy,
hypoploidy and pseudoploidy were noted in 51%, 6% and 12% of cases respectively
(0.001). Chromosomal structural abnormalities noted were; t (12; 21)(p13; q22)
t(9;22)(q34;q11), t(8;14)(q24;q32), t(5;14)(q31;q32), t(17;19)(q22;q13), t (7;11) (q35;
q13), t (1;7) (p32; q35), t (7;19) (q35; p13), t(1;19)(p13;q23), t(8;22)(q24;q11) and
unknown 13%. Ph + chromosome (t (9; 22) (q34; q11) was noted in 6% of cases and
EBV in 19% of total study population
Conclusion: ALL cases are characterized by leukocytosis and anemia. Epstein Barr
Virus was found in 19% childhood ALL in present study. Present study shows good
prognostic cytogenetic abnormalities like hyperdiploidy and t (12; 21)(p13; q22) in
Pakistani children with ALL and frequency of poor prognostic cytogenetic aberrations
like hypoploidy and t (9; 22) (q34; q11.2) is comparable to previous studies.
Keywords: Childhood ALL Chromosomal abnormalities Epstein Barr Virus

viii
LIST OF ABBREVIATION ABBREVIATION
TERM
AIDS ALL AML CBC CFU CLL CML CSC EBV EDTA EGIL ELISA FAB FISH GM-CSF HD ISH MRD NK PCR PHSC PTLD RBC SCF SD SDF-1 SPSS WBC WHO
Acquired immune deficiency syndrome Acute lymphoblastic leukemia Acute myeloblastic leukemia Complete blood counts Colony forming unit Chronic lymphoid leukemia Chronic myeloid leukemia Committed stem cells Epstein Barr virus Ethylene diamine acetic acid European group for classification of leukemia Enzyme linked immunosorbent assay French American British classification Fluorescence in situ hybridization Granulocyte monocyte colony stimulating factor Hodgkin`s disease In situ hybridization Minimal residual disease Natural killer cells Polymerase chain reaction Pluripotent hematopoietic stem cells Post transplantation lymphoproliferative disease Red blood cells Stem cell factor Standard deviation Stromal derived factor-1 Statistical Package for the Social Sciences White blood cells World Health Organization
EMF Electrical Magnetic field CGH Comparative genomic hybridization FITC Fluorescent iso thiocyanate (Anti EBV Antibodies) ISIS Integrated software for imaging spectrometers

ix
TABLE OF CONTENTS
Page # ACKNOWLEDGEMENT--------------------------------------------------------------- V ABSTRACT------------------------------------------------------------------------------- Vi LIST OF ABBREVIATION-------------------------------------------------------------TABLE OF CONTENTS--------------------------------------------------------------
viii ix
LIST OF TABLES----------------------------------------------------------------------- Xii LIST OF FIGURES--------------------------------------------------------------------- Xiii LIST OF GRAPHS---------------------------------------------------------------------- Xv CHAPTER – I ---------------------------------------------------------------------------
01
INTRODUCTION------------------------------------------------------------------------ 01 1. OBJECTIVES ------------------------------------------------------------- 2. RATIONALE OF STUDY----------------------------------------------------------- 3. HYPOTHESIS -----------------------------------------------------------------------
04 05 06
CHAPTER – II ------------------------------------------------------------------------- 07 LITERATURE REVIEW -------------------------------------------------------------- 07 1. Bone marrow, stem cells & hematopoiesis ---------------------------
1.1. Bone marrow ----------------------------------------------------------- 1.1.1. Red Bone marrow --------------------------------------------- 1.1.2. Yellow bone marrow ------------------------------------------
1.2. Bone marrow stroma -------------------------------------------------- 1.3. Sites of hematopoiesis------------------------------------------------- 1.4. Hematopoietic stem cells & progenitor cells ---------------------
1.4.1 Stem Cell Plasticity ---------------------------------------------- 1.4.2 Hematopoietic growth factors ---------------------------------
07 07 07 07 09 10 11 12 12
2. Leukemia overview ----------------------------------------------------------- 2.1. Acute leukemias-------------------------------------------------------
2.1.1 Acute lymphocytic (Lymphoblastic) leukemia (ALL 2.1.2 Acute myeloblastic leukemia (AML) -------------------
2.2. Chronic leukemias ------------------------------------------------------ 2.2.1 Chronic myeloid leukemia (CML) --------------------------- 2.2.2 Chronic lymphocytic leukemia (ALL) -----------------------
15 15 16 16 16 16 16
3. Acute lymphoblastic leukemias -------------------------------------------- 3.1. Epidemiology of ALL --------------------------------------------------- 3.2. Classification ------------------------------------------------------------
3.2.1 Morphological classification (French American British) 3.2.2 European Group for the immunological classification)
3.3. Cytogenetics in ALL ---------------------------------------------------- 3.3.1 Chromosomal translocations ---------------------------------
16 17 18 19 23 24 25

x
3.2.2 Cooperative mutations ----------------------------------------- 3.4. Etiology of leukemia ----------------------------------------------------
3.4.1 Dietary factors ---------------------------------------------------- 3.4.2 Socio-economic status ----------------------------------------- 3.4.3 Environmental factors ------------------------------------------ 3.4.3.1 Ionizing radiations ------------------------------------- 3.4.3.2 Non-ionizing radiations ------------------------------ 3.4.3.3 Chemicals ----------------------------------------------- 3.4.3.4 Pesticides ----------------------------------------------- 3.4.3.5 Cigarette ------------------------------------------------ 3.4.4 Immunological factors ------------------------------------------ 3.4.5 Genetic factors ---------------------------------------------------
28 32 32 33 33 33 34 34 34 35 35 35
4. Epstein-Barr virus EBV ------------------------------------------------------ 4.1. Types of EBV-------------------------------------------------------------- 4.2. Genome of EBV----------------------------------------------------------
37 38 38
5. Natural History of EBV infection ----------------------------------------- 5.1. Primary EBV infection--------------------------------------------------
5.1.1 Infectious mononucleosis -------------------------------------- 5.1.2 Chronic active EBV infection (CAEBV) --------------------
5.2. Cell entry and exit ------------------------------------------------------ 6. Malignancies associated with EBV ---------------------------------------
6.1. Hodgkin’s disease ------------------------------------------------------- 6.2. Burkett’s lymphoma------------------------------------------------------ 6.3. Post – Transplant Lymphoproliferative disorder------------------ 6.4. EBV associated carcinomas ------------------------------------------ 6.4.1 Nasopharyngeal carcinoma (NPC) -------------------------- 6.4.2 Gastric carcinoma ------------------------------------------------ 6.4.3 Other carcinomas ------------------------------------------------
39 39 39 39 40 42 42 44 45 47 47 47 48
CHAPTER – III ------------------------------------------------------------------------- 49 MATERIALS AND METHODS --------------------------------------------------- 49 1. Study Design ------------------------------------------------------------------- 49 2. Study setting -------------------------------------------------------------------- 49 3. Duration of study--------------------------------------------------------------- 49 4. Sample size --------------------------------------------------------------------- 49 4.1 Sample size calculation ------------------------------------------------- 49 4.2 Sampling technique ------------------------------------------------------ 50 4.3 Sample selection --------------------------------------------------------- 5. Inclusion criteria:--------------------------------------------------------------- 5.1 Exclusion criteria ---------------------------------------------------------
50 50 50
6. Data collection procedure --------------------------------------------------- 51 7. Laboratory investigations ---------------------------------------------------
7.1 Complete blood count (CBC)---------------------------------------------- 7.2 Preparation and staining of peripheral blood smear----------------- 7.2.1 Preparation of staining solution----------------------------------- 7.2.2 Preparation of buffered water-------------------------------------- 7.2.3 Staining of peripheral blood smear------------------------------- 7.2.4 Morphology of peripheral smear ----------------------------------
51 51 52 52 52 53 53

xi
7.3 Bone marrow procedure----------------------------------------------------- 7.4 Karyotyping -------------------------------------------------------------------- 7.4.1 Reagents used ----------------------------------------------------- 7.4.2 Instruments & consumables---------------------------------------- 7.4.3 Sample collection & processing------------------------------------- 7.4.4 Method of culture------------------------------------------------------- 7.5 Fish (Fluorescence in Situ Hybridization)------------------------------- 7.6 Epstein Barr Virus detection by PCR-------------------------------------
53 54 54 54 55 55 58 59
8. Data analysis ---------------------------------------------------------------------- 62 CHAPTER – IV ------------------------------------------------------------------------- 63 RESULTS -------------------------------------------------------------------------------- 63 CHAPTER – V -------------------------------------------------------------------------- 97 DISCUSSION --------------------------------------------------------------------------- 97
CHAPTER – VI ------------------------------------------------------------------------- 110 CONCLUSION -------------------------------------------------------------------------- 110 CHAPTER – VII ------------------------------------------------------------------------- 111 RECOMMENDATIONS --------------------------------------------------------------- 111 REFRENCES ---------------------------------------------------------------------------- 112

xii
LIST OF TABLES Chapter Description Page II–1 WHO classification of ALL ------------------------------------ 22
IV –1 Age distribution of study population --------------------------- 65
IV-2 Gender distribution of study population ------------------ 66
IV-3 Hemoglobin findings of study population --------------- 67
IV-4 Red blood cell counts of study population ------------- 68
IV-5 White blood cell counts of study population------------------ 69
IV-6 Chromosomal abnormalities of study population----------- 70
IV-7 Chromosomal ploidy of study population------------------------- 71
IV-8 Chromosomal numerical abnormalities --------------------------- 72
IV-9 Chromosomal structural abnormalities in study ---------------- 73
IV-10 Philadelphia chromosome of study population ------------------ 75
IV-11 Frequency of Epstein Barr Virus of study population ---------- 76
V-1 Studies conducted on EBV in childhood ALL---------------------
107

xiii
LIST OF FIGURES
Figure Description Page
II – 1 Blood cell production in bone marrow -------------------------- 08
II – 2 Bone marrow trephine biopsy--------------------------------------- 09
II – 3 Pluripotent hematopoietic stem cells -------------------------- 13
II – 4 Hematopoietic stem cells differentiation------------------------- 14
II – 5 FAB-L1smear showing small homogenous cells------------- 20
II – 6 FAB-L2 smear showing small homogenous cells------------- 20
II – 7 FAB-L3 smear showing small homogenous cells------------- 21
II – 8 Relative frequency of chromosomal abnormalities in ALL-- 27
II – 9 Retinoblastoma pathway and p53 tumor suppressors---- 29
II – 10 Notch signaling pathway in normal thymocytes --------------- 31
II – 11 EBV Primary infection and cycles of persistence------------- 46
IV –1 Bone Marrow particle Leishman’s stain X 40---- 77
IV-2
Peripheral smear showing Homogenous --------population of Lymphoblast Leishman’s stain X 400-----------
78
IV-3 Peripheral smear showing Homogenous population of Lymphoblast Leishman’s stain X 400-----------------------------
79
IV-4 Peripheral smear showing Homogenous population of Lymphoblast Leishman’s stain X 400-----------------------------
80
IV-5 Peripheral smear showing Homogenous population of Lymphoblast Leishman’s stain X 400-----------
81
IV-6 Bone Marrow showing Lymphoblast Leishman’s stain X 1000 - 82
IV-7 Bone Marrow showing Lymphoblast Leishman’s stain X 1000 83
IV-8 Bone Marrow showing Lymphoblast Leishman’s stain X 1000 84
IV-9 Bone Marrow showing Lymphoblast Leishman’s stain X 1000 85
IV-10 Bone Marrow showing Lymphoblast Leishman’s stain X 1000 86
IV-11 Bone Marrow showing Lymphoblast Leishman’s stain X 1000 87
IV-12 Bone Marrow showing Lymphoblast Leishman’s stain X 1000 88

xiv
IV-13 Bone Marrow showing Lymphoblast Leishman’s stain X 1000 89
IV-14 Bone Marrow showing Lymphoblast Leishman’s stainX 1000 90
IV-15 Bone Marrow showing Lymphoblast Leishman’s stain X 1000 91
IV-16 Peripheral Blood Smear. Leishman’s Stain shows leukemic blast of ALL X1000-------------------------------------------------------
92
IV-17 Peripheral Blood Smear. Leishman’s Stain shows leukemic blast of ALL X1000-------------------------------------------------------
93
IV-18 Peripheral Blood Smear. Leishman’s Stain shows leukemic blast of ALL X1000 --------------------------------------------------------
94
IV-19 Peripheral Blood Smear. Leishman’s Stain shows leukemic blast of ALLX400 ---------------------------------------------------------
95
IV-20 Peripheral Blood Smear. Leishman’s Stain shows leukemic blast of ALL X1000-------------------------------------------------------
96

xv
LIST OF GRAPHS
IV –1 Age distribution of study population --------------------------------
65
IV-2 Gender distribution of study population ---------------------------- 66
IV-3 Hemoglobin findings of study population -------------------------- 67
IV-4 Red blood cell counts of study population ------------------------ 68
IV-5 White blood cell counts of study population------------------------ 69
IV-6 Chromosomal abnormalities of study population----------------- 70
IV-7 Chromosomal ploidy of study population--------------------------- 71
IV-8 Chromosomal numerical abnormalities ---------------------------- 72
IV-9 Chromosomal structural abnormalities in study ----------------- 74
IV-10 Philadelphia chromosome of study population ------------------- 75
IV-11 Frequency of Epstein Barr Virus of study population ----------- 76

1
CHAPTER I
INTRODUCTION
Acute lymphoblastic leukemia (ALL) is a disease typically characterized
by the accumulation of immature abnormal lymphoid progenitor cells
(lymphoblasts) in the bone marrow, which have abnormal proliferation and
differentiation. It is a heterogeneous disease which can be divided into a number
of distinct biological and prognostic subtypes. ALL can develop from any
lymphoid cell, blocked at a particular stage of development, including both
primitive cells with a multilineage potential, as well as more mature cells(1).
The national data on ALL in children is lacking in Pakistan. ALL is common
in children of less than 15 years of age. In a retrospective study at Oncology unit
of National Institute of Child Health and Children Cancer Hospital, Karachi.
Yasmeen et al (2) reported a frequency of 32% of ALL in children.
A number of acquired chromosomal abnormalities arising from
translocations, deletions, duplications and inversions have been identified which
are often associated with deregulated gene expression. The abnormal karyotype
have been detected in more than 80% of children (3) and 79% of adults suffering
from ALL(1, 4).
Aneuploidy, defined as having more or less than the normal diploid
number of chromosomes, is a significant feature of ALL. A high hyperdiploid
karyotype, with 51-65 chromosomes, is found in approximately 30% of childhood
cases and 5% of adult patients(5, 6).The chromosomal gains in the form of
trisomies are restricted to certain chromosomes. In Chromosomes X, 4, 6, 10, 14,

2
17, 18 and 21 (frequently the gain of chromosome 21 is tetrasomic) abnormalities
are frequently found (7).
A second significant chromosomal abnormality in childhood ALL is
hypodiploidy (Ho), where chromosomes are ≤ 45. It is rare, with a reported
incidence of approximately 6%(8, 9). In the majority of reported cases, patients
have 45 chromosomes(8, 9). Overall, hypodiploidy has been linked to a poor
prognosis (8-10). Karyotypic analysis of the group shows chromosomal gains
onto the haploid chromosome set is common with high hyperdiploidy (X, Y, 14,
18 and 21). They show rare structural abnormalities and a co-incident doubled
hypodiploid clone. Conventional chromosomal analysis remains the method of
choice for the initial detection of cytogenetic abnormalities in leukaemic
samples(1, 10).
Epstein Barr Virus (EBV) is known to infect about 90% of the adult
population worldwide and its infection is generally restricted to humans(11, 12).
The virus is shed into the saliva of persistently infected individuals who spread
the virus to uninfected individuals (13, 14).
EBV is a virus of the genus Lymphocryptovirus within the subfamily of
gamma-herpes viruses, which is an enveloped virus. The envelope consists of a
toroid shaped protein core wrapped with DNA, a nucleocapsid, a tegument
protein, and a linear double stranded DNA molecule of 172 kb(14-16).EBV is
linked to a variety of neoplasms,(17, 18) including lymphoid tumors like Burkitt`s
Lymphoma, Hodgkin’s disease (HD), lymphoproliferations in solid organ
transplant, natural killer (NK) T-cell lymphoma or bone marrow recipients (post-
transplantation lymphoproliferative disease, PTLD), AIDS-associated lymphomas,

3
Nasopharyngeal carcinoma, gastric carcinoma, salivary gland tumors, thymic
carcinoma, mesothelial tumors and leiomyosarcoma(18).
Currently national data is seriously lacking on prevalence of chromosomal
abnormalities and possible role of EBV in ALL in children of Sindh, Pakistan. The
present research was designed to study patterns of chromosomal abnormalities
and prevalence of EBV in the children suffering from ALL reporting at the
Oncology Unit/NIMRA, Liaquat University of Medical and Health Sciences,
Jamshoro and Isra University Hospital, Hyderabad.

4
OBJECTIVES OF STUDY
The objectives of this study are
1. To determine the frequency of chromosomal abnormalities in children
suffering from ALL
2. To evaluate structural and numerical chromosomal abnormalities in
patients with ALL
3. To find out the frequency of Epstein Barr Virus in ALL cases.

5
RATIONALE OF STUDY
The acute lymphoblastic leukemia is common in children of less than 15
years of age. The disease has been reported to be increasing throughout the
globe and the country. There is paucity of data pertaining to chromosomal
abnormalities and Epstein Barr virus in acute lymphoblastic leukemia. Epstein
Barr virus has unique association with human malignancies in general and
lympho proliferative disorders in particular. Currently, there is paucity of national
data on acute lymphoblastic leukemia and studies on chromosomal abnormalities
and Epstein Barr virus. The chromosomal abnormalities have proven importance
in the prognosis of diseases. The research designed for studying various
chromosomal abnormalities and role of Epstein Barr virus in acute lymphoblastic
leukemia. The study will help oncologist/physicians in treating patients and
estimating prognosis of disease.

6
HYPOTHESIS
The association between the acute lymphoblastic leukemia and
chromosomal abnormalities and EBV will be determined.
Null Hypothesis (Ho): says that there is no association of dependent variable
(chromosomal abnormalities and EBV) with independent variable (Acute
lymphoblastic leukemia), if any association found is by chance until proved
otherwise.
Alternative Hypothesis (H1): says that there is association of dependent
variable (chromosomal abnormalities and EBV) with independent variable (Acute
lymphoblastic leukemia).
In present study H1 hypothesis will be accepted as true if the researcher
fails to prove the Ho hypothesis.
7
CHAPTER II
LITERATURE REVIEW
1. BONE MARROW, STEM CELLS AND HEMATOPOIESIS
1.1. Bone Marrow
Bone marrow is defined as cellulo-vascular hematopoietic tissue which
occupies medullary cavities and cancellous/trabecular spaces of bones and
produces blood cells. Hematopoisis is defined as the formation of blood cells
which primarily occurs in bone marrow. The bone marrow cavities of all bones
produce blood cells in children, however by the age 20; the marrow cavities of all
long bones, except for the upper humerus and femur, become inactive.
(Figure.II-1).(19, 20) Bone marrow may be classified according to functional
status as;
1.1.1. Red Bone Marrow: An active cellular bone marrow which is
performing the function of producing blood cells.
1.1.2. Yellow Bone Marrow: An inactive bone marrow that is loaded
with/adipose tissue.
The bone marrow is one of the largest organs of body (19, 20), nearly
approximating size and weight of the liver. It is also one of the most active
proliferating tissues. Normally, bone marrow contains 75% cells of myeloid series
which produce white blood cells and only 25% cells of erythroid series which
produce red blood cells. (19, 20)

8
The bone marrow contains multipotent hematopoietic stem cells called
pluripotent hematopoietic stem cells (PHSC), from which all blood cells in
circulation are derived. The PHSC differentiate into one or other type of
progenitor cells known as the committed stem cells (CSC). The committed stem
cells in turn differentiate into colony forming unit for erythrocytes, granulocytes,
monocytes, etc. (Figure.II-6)(19, 20)
Figure.II-1. Figure shows blood cell production in bone marrow at different ages (indifferent bones). (Adapted from: Guyton and Hall 2012) (20)

9
1.2 Bone Marrow Stroma
The stroma of bone marrow is naturally designed to provide a normal
homeostasis necessary for the stem cell survival, growth and proliferation. The
stroma of bone marrow is composed of stromal cells, interwoven fibers and
microvascular network. The Mesenchymal stem cells are thought to be critical in
stroma and stromal cell formation. The stromal cells include vascular endothelial
cells, adipocytes, fibroblasts and macrophages. The fibroblasts produce and
secrete extracelluar fibers such as glycoproteins (fibronectin, thrombospondin),
collagens and glycosaminoglycans (hyaluronic acid, chondroitin sulphate). The
stromal cells produce and secrete a number of growth factor necessary for stem
cell survival.(21)
Figure.II-2. A normal Bone marrow trephine biopsy. H & E staining shows 50% hematopoietic tissue and 50% adipose tissue. (Adapted from: HOFFBRAND A.V. 2006)(21)

10
1.3 Sites of Hematopoiesis
The hematopoiesis takes place in different organs of body but changes
anatomical position from embryonic life to adulthood. The various sites involved
in hematopoiesis and erythropoiesis are described as under:
The yolk sac is the first site of hematopoiesis of most primitive red blood
cells during early weeks of gestation. Yolk sac produces blood cells including
nucleated RBC. However, definitive hematopoiesis is observed in stem cells
located near the dorsal aorta. This site of hematopoiesis is known as AGM
(aorta-gonads-mesonephros) region because of close proximity to the dorsal
aorta, primitive gonads and kidneys. The precursor cells known as
hemangioblasts migrate to seed the liver, spleen, lymph nodes and the bone
marrow cavities. The liver and spleen produce blood cells from 6th week of
gestation till 2 weeks after child is born. The bone marrow begins hematopoiesis
form 6-7 months of fetal life and continues throughout life. The bone marrow is
the only source of hematopoiesis during childhood and adult life.(19, 20)
The bone marrow is red during whole infancy but from childhood onward it
is progressively replaced by fatty tissue. During adolescence and adult life, the
functioning bone marrow is confined to axial skeleton like vertebrae, and most
proximal ends of long bones like humeri and femori. The bone marrow is
approximately 50% loaded with fatty tissue even in these sites. The fatty yellow
marrow is reversible to hematopoiesis and so is the liver and spleen. The liver
and spleen can resume hematopoiesis even in adulthood but during certain

11
disease states, and this is known as extramedullary hematopoiesis. The bone
marrow of different bones in relation to age is shown in figure.II-4. (19-21)
1.4 Hematopoietic stem cells and progenitor cells
The process of hematopoiesis begins with proliferation and differentiation
of Pluripotent Hematopoietic Stem Cell (PHSC) in bone marrow (Figure II-6.) The
PHSC has potential of differentiating into all cell lineages within bone marrow.
The PHSC is rare cell (21), most probably one in every 20 million
nucleated bone marrow cells. The PHSC show immunological cluster designation
marker (CD), predominantly CD34+ and CD38+. The PHSC appear similar to be
a small to medium sized lymphocyte. The differentiation of PHSC occurs through
committed hematopoietic progenitor cells, which are comparative to PHSC
restricted in their developmental potential. The in-vitro culture techniques have
been used to demonstrate the existence of separate progenitor cells. An example
of earliest progenitor cell is the mixed myeloid precursor which gives rise to
granulocytes, erythrocytes, monocytes-macrophage and megakaryocytes cell,
known as colony forming unit (CFU)-GEMM.
The bone marrow is also the primary site of lymphocyte production, which
are derived from a common lymphoid progenitor precursor within bone marrow.
The PHSC are capable of self-replication and self-renewal so that cellularity of
bone marrow remains at a constant steady state in a normal healthy person. It is
said that one stem cell (PHSC) can produce about 106 mature blood cells with 20
cell divisions. (21)

12
The stem cells are capable of moving around whole body in peripheral blood
vessels. The stem cells cross through capillaries of bone marrow and exit into
systemic circulation, a process known as mobilization of stem cells. The
mobilization of stem cells is dependent upon growth factors like granulocyte-
colony stimulating factor (G-CSF) or granulocyte-monocyte colony stimulating
factor (GM-CSF). The reverse process of stems cells of colonizing bone marrow
cavities is known as homing. The homing of stem cells is dependent on the
chemotactic factors like SDF-1 (stromal derived factor 1). The stem cell viability,
proliferation, mobilization and homing are dependent upon interactions of stroma,
and stromal cells with the stem cells itself. The SCF (stem cell factor) and jagged
proteins are expressed on membranes of stromal cells while their receptors c-Kit
receptors and Notch receptors are expressed on stem cells. (21)
1.4.1 Stem Cell Plasticity
It is evident from various studies that adult stem cells in different organs
are pluripotent i.e.; they can differentiate into various types of cells and tissues.
Stem cell transplants in animals and humans can differentiate into neurons, liver
and muscle. (21)
1.4.2. Hematopoietic growth factors
The hematopoietic growth factors are glycoprotein cytokine hormones
which control and regulate the differentiation and proliferation of progenitor cells
and functions of mature blood cells. The growth factors include GM-CSF, G-CSF,
M-CSF, thrombopoeitin, erythropoietin and interleukins. The major source of
growth factors is the stromal cells except thrombopoeitin and erythropoietin. The

13
erythropoietin is secreted mostly by renal tissue and partly by liver. However
thrombopoeitin is secreted mostly by liver. (21)
Figure.II-3. Figure Shows Pluripotent Hematopoietic Stem Cells, committed
stems cells and colony forming units in bone marrow (Adapted from: Guyton and Hall 2012)(20)

14
Figure II. 4. Schematic illustration of hematopoietic stem cells
differentiating into lymphoid and myeloid series.(21)

15
2. LEUKEMIA- AN OVERVIEW
The term leukemia was first introduced by the German pathologist
,Rudolph Virchow (1856), who described a disease characterized by excess
counts of white blood cell under microscope. Leukemia is not a single entity, but
rather a disorder overlapping multiple types. Leukemia is a cancerous
proliferation of hematopoietic lymphoid cells within the bone marrow. It is
characterized by uncontrolled proliferation of hematopoietic lymphoid cells which
accumulate in bone marrow before spilling into peripheral blood circulation.
Most of cases appear without an evident cause, however, radiation and
toxins have been shown to be leukemogenic. Chromosome and gene
disturbances are related to leukomogenesis.(22) The chromosome and gene
alteration disrupts the proliferation of lymphoid series at some point of maturation.
The most common cancer in childhood is the leukemia accounting for one
out of three cancers. (23)Under 15 years of age, the leukemia is leadingcause of
cancer death and 7th mostcommon form of cancer death.Although the cause of
Leukemia remains usually unknown and uncertain, however thesymptoms are
produced because of pooling of immature lymphocyte cells in the bone marrow
and peripheral circulation. In the bone marrow, the leukemic cells disturb the
normal production of erythrocytes, leukocytes and thrombocytes(24).
From clinical course of leukemia, it is classified as being acutely fast
growing or chronic slowly growing. Almost all of the childhood leukemias run an
acute course.

16
2.1. Acute Leukemias: There are two main types of acute leukemia,
depending upon whether the lymphoid and/or myeloid series is involved.
2.1.1 Acute Lymphocytic (lymphoblastic) Leukemia (ALL): About
60% cases of acute leukemia are ALL type. The leukomogenesis begins
from the lymphoid series hematopoietic tissue.
2.1.2 Acute Myeloblastic Leukemia (AML): Acute myeloblastic
leukemia originates from the myeloid series of hematopoietic tissue.
2.2 Chronic Leukemias:
Chronic leukemias are more common in adults than in children.
Thechronic leukemia is characterized by slow proliferation of hematopoietic
tissue involving erythrocyte, leukocyte and/or megakaryocytic series. The chronic
leukemias show mature cells but in countless numbers.
Chronic leukemias may be further sub typed into:
2.2.1 Chronic Myeloid Leukemia (CML): The CML is most common
leukemia of adulthood and rarely seen in children.
2.2.2 Chronic Lymphocytic Leukemia (CLL): The CLL is
common in adults but is extremely rare in children.(21-25)
3. ACUTE LYMPHOBLASTIC LEUKEMIA (ALL)
Acute lymphoblastic leukemia (ALL) is a neoplastic disorder of lymphoid
series of hematopoietic tissue. It is defined as a malignant proliferation of
lymphoid cells which are blocked at an early stage of differentiation because of
unknown cause. The lymphoblast cells proliferate in uncontrolled fashion and
eventually replace bone marrow cavities. ALL is basically a heterogeneous
disorder with differing characteristics of lymphoblasts. The changes do occur at

17
the level of cell morphology, biochemical characteristics, and cytogenetic
organization, immunological and molecular characteristics of lymphoblastic cells.
Characteristics of leukemic lymphoblasts are essential in establishing diagnosis
of ALL, excluding other causes of bone marrow failure, and finally to divide the
ALL into its respective subtypes. The morphological heterogeneity reveals the
fact that the leukemic changes may occur at any point during the lymphoid cell
differentiation.
3.1. Epidemiology of ALL
ALL is the most common malignancy of childhood. The incidence of ALL
below 14 years of age is 3 to 4/100,000 and approximately 1/100,000 in older
than 15 years, in the United States(22). The peak incidence of ALL is observed at
age of 2-5 years.The ALL is reportedly the single most common cancer in
Pediatric oncology, accounting for nearly 1/3 of total cancers. ALL represents
75% of all acute leukemias in children, which accounts for 34% of cancer in
childhood.(26).
The incidence of ALL is much lower in adult patients, in whom AML and
CLL are reported to be more common (8, 23, 26).ALL predominates male
population in all age groupsand incidence is more among white children
compared to others (22).
It is reported by various studies that the incidence of T-cell ALL is
somewhat higher in boys compared to girls. (27-30). However, incidence of ALL
is slightly higher in girls during first year of life(26, 29). ALL almost always
appears as de-novo disease rather rarely occurring secondary to a primary
leukemogenic process (31). A variety of environmental and genetic causes have
been implicated in the pathogenesis of ALL. ALL is associated congenital genetic

18
syndromes like Neurofibromatosis type, ataxia telangiectasia, 1, Bloom`s
syndrome and Down`s syndrome (32).
Exposure to pesticides, solvents and ionizing radiations during intra-
uterine life has been linked to increased frequency of childhood
leukemia(32).Fusion of leukemic specific genes, the Immunoglobulin (Ig) and
clonal Ig genes have been identified as predisposing factor of developing ALL
(33, 34). The incidence of childhood leukemia varies according to geographical
distribution, age, gender, race and ethnicity in different parts of the World(35-37).
The Childhood leukemia incidence is highest in United States, Germany,
Australia and Costa Rica.While intermediate incidence is reported from the Indian
subcontinent, Europe and among blacks of United States of America. (26, 38)
3.2 Classification
The ALL umbrella encompasses a variety lymphoid precursor cells which
are morphologically and immunologically related to the B-cell and T-cell lineages.
The ALL usually presents with extensive involvement of bone marrow and
peripheral circulation but rarely limited to tissues, with no or limited involvement
of marrow cavities. However, the later cases are classified as lymphoblastic
lymphomas (LBLs).
The current WHO classification of leukemia of hematopoietic tissue is
designated as B-cell or T-cell lymphoblastic leukemia and or lymphomas (39).
Acute leukemia may classify in different way as;
(1) French-American-British (FAB) classification is based upon morphology,
(2) Proposed WorldHealth Organization Classification of Acute Leukemia

19
(3) Byimmunophenotyping alone, as proposed by the European Group for the
immunological classification of leukemias.(41, 42)
3.2.1 Morphological classification (French-American-British
Classification)
A group of French- American and British (FAB) leukemia experts(1970)
divided ALL into three subtypes as; L1, L2 and L. The L1, L2 and L3 were based
on the microscopic appearance of leukemic cells after routing staining properties.
The ALL is subdivided into FAB-L1 occurring in children, FAB-L2 in older
children and adults and FAB-L3 occurring inleukemia secondary to Burkitt's
lymphoma.
The FAB subtypes are classified according to 2 criteria;
i. Individual features of leukemic cells
ii. Degree of leukemic cell heterogeneity
The features considered in ALL include leukemic cell size, content of
chromatin material, shape of nuclei, nucleoli, degree of basophilia and
cytoplasmic vacuolations (40).
FAB-L1: (Leukemic Small Cell): FAB-L1 is the acute leukemia of childhood
which accounts for 70% of all, with 74% of cases occurring under 15 years.
Homogenous leukemic cell population is observed on smear .Cells are
predominantly small, with moderately basophilic cytoplasm, regular nuclear
shape with occasional cleft and rarely visible are the nuclear contents.(43).
20
Figure II-5. FAB- L1 Smear showing small homogenous cells.
(Adapted from: Guenova M, 2013) (43).
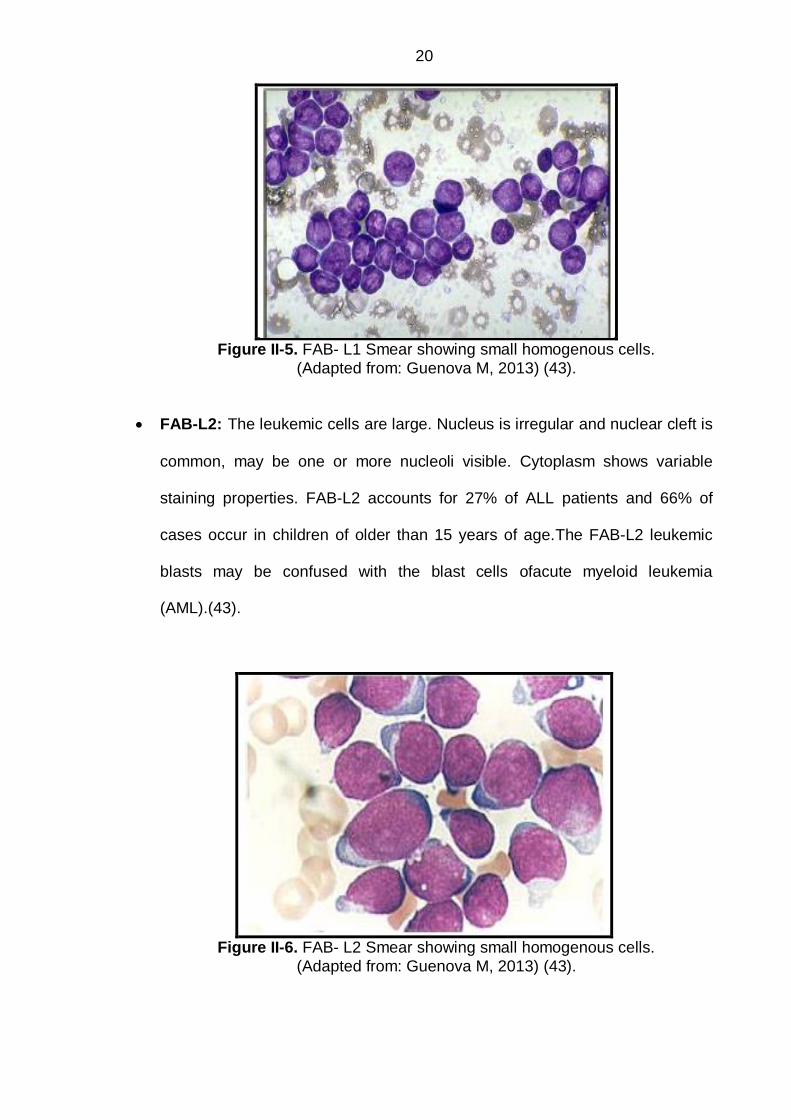
FAB-L2: The leukemic cells are large. Nucleus is irregular and nuclear cleft is
common, may be one or more nucleoli visible. Cytoplasm shows variable
staining properties. FAB-L2 accounts for 27% of ALL patients and 66% of
cases occur in children of older than 15 years of age.The FAB-L2 leukemic
blasts may be confused with the blast cells ofacute myeloid leukemia
(AML).(43).
Figure II-6. FAB- L2 Smear showing small homogenous cells.
(Adapted from: Guenova M, 2013) (43).

21
FAB-L3: (Burkitt's lymphoma type): The leukemic cells are homogenous,
large size with round to oval nucleus. Prominent nucleoli usually one to three
but sometime up to 5 may be visible. Deeply staining basophilic cytoplasm
with prominent vacuoles is visible. Prominent cytoplasmic vacuolations with
intense basophilia is characteristic feature of leukemic cells. Similarly a high
mitotic index with varying degree of phagocytosis is observed. Cell markers of
mature B-cells are detectable on cell surface.(43).
Figure II-7. FAB- L3 Smear showing small homogenous cells.
(Adapted from: Guenova M, 2013) (43).
The FAB classification has been abandoned nowadays, and replaced by
new WHOclassification. The new WHO classification reflects better
understanding of biology and molecular characteristics of leukemic cells. The
WHO utilizes immunophenotyping and divides ALL into three basic types
designated as;
Precursor B cell
Precursor T cell, and
Mature B cell leukemia/lymphoma (44).

22
Table. II-1. WHO CLASSIFICATION(45)
Precursor B-cell ALL/LBL
Cytogenetic subgroups
t(9;22)(q34,q11),BCR/ABL
t(v;11q23);MLL rearranged
t(1;19)(q23;p13),PBX1/E2A
t(12;21)(p13;q22);TEL/AML1
Hypodiploid
Hyperdiploid, >50
Precursor T-cell ALL/LBL
Mature B-cell leukemia/lymphoma
ALL= acute lymphoblastic leukemia; LBL= lymphoblastic lymphoma; MLL= mixed lineage leukemia

23
3.2.2 European Group for the Immunological classification of
Leukemias (EGIL)
The ALL can easily be sub-divided into different types according to
cytoplasmic markers and immunologic surface ligands. The EGIL proposed to
classify ALL by immunophenotyping. (41, 46)
Initially, it was observed that normal lymphoid precursor cells express
common cell surface antigens. Based on expression of cell surface antigens, the
EGIL defined a threshold of at least 20% of positive blast cells to a given
monoclonal antibody.
Pro-B ALL:The B-cell precursor blast cells which are positive for membrane
and cytoplasmic markers CD19, CD22 andCD79a (47) are classified as pro-B
ALL type. By definition, if any two of three above markers are positive then
ALL cells must be titled as pro-B cells ALL.
Common ALL: The presence of CD10 antigen (CALLA) defines the
"common" ALL subgroup of acute lymphoblastic leukemia.
Pre-B group: leukemic cells which show cytoplasmic IgM are labeled as the
pre-B ALL.
Mature B-ALL: The mature B-ALL is labeled if immunoglobulin light chains of
cell membrane are positive.
T-cell ALL: The most immature T lymphoid cells are positive for CD markers
viz; CD1a, CD2, CD3, CD4, CD5, CD7, CD8, CD2, CD5and CD7. However,
none of these are absolutely T cell line specific, hence unequivocal diagnosis
is made of T-cell ALL if surface/cytoplasmic CD3 are positives. The T-cell ALL
comprises 25% of all adult cases of leukemia of ALL type.
24
CD34 marker: The CD 34 marker is expressed on the stem cells of both B
and T lineage. The CD34 has clinical prognostic value but has no diagnostic
value. (48)
The EGIL scoring system addressed characterization of ALL as of B- or T- cell
type based on expression of specific membrane or cytoplasmic markers. The
markers are also helpful in cell differentiation of all stages of maturation of B and
T cell lineages (49).It is reported that these markers can be used for making
diagnosis and sub classification of ALL (50).
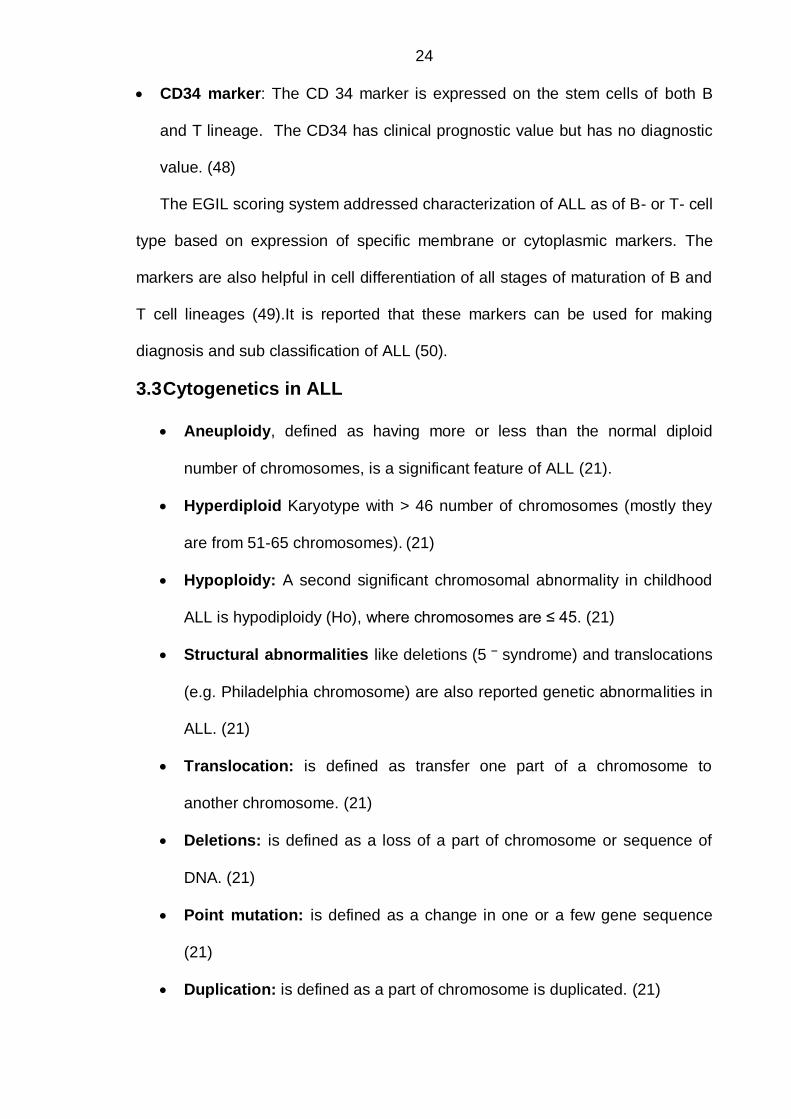
3.3 Cytogenetics in ALL
Aneuploidy, defined as having more or less than the normal diploid
number of chromosomes, is a significant feature of ALL (21).
Hyperdiploid Karyotype with > 46 number of chromosomes (mostly they
are from 51-65 chromosomes). (21)
Hypoploidy: A second significant chromosomal abnormality in childhood
ALL is hypodiploidy (Ho), where chromosomes are ≤ 45. (21)
Structural abnormalities like deletions (5 – syndrome) and translocations
(e.g. Philadelphia chromosome) are also reported genetic abnormalities in
ALL. (21)
Translocation: is defined as transfer one part of a chromosome to
another chromosome. (21)
Deletions: is defined as a loss of a part of chromosome or sequence of
DNA. (21)
Point mutation: is defined as a change in one or a few gene sequence
(21)
Duplication: is defined as a part of chromosome is duplicated. (21)

25
The cytogenetic grouping of ALL improves the understanding of both
etiology and epidemiology of ALL subtypes. The ALL shows distinct cytogenetic
characteristics related to clinical and hematological understanding.
The main reason for getting cytogenetic information in ALL is to obtain
understanding of prognosis and monitoring of disease, and MRD status beyond
the cytomorphologic classification. Genetic abnormalities are hall mark in ALL
and may be recurrent. The genetic abnormalities provide probing into the
molecular mechanisms of leukomogenesis (51).
The genes controlling transcription and tyrosine kinases activity are most
frequent targets of genetic alterations in ALL.(52).The genetic alterations may be
pointmutations and/or deletions. But the main genetic alterations of ALL
aretranslocations and chromosome imbalances which result in hypo- or
hyperploidy. (53).
3.3.1 Chromosomal translocations
Childhood ALL must be analyzed for cytogenetic alteration because these
are of clinical importance. Banded karyotyping is nowadays a routine testing of
ALL. The chromosomal aberrations in ALL can be divided into two groups;
Abnormalities in the number of chromosomes (ploidy) and
Chromosomal structural changes, such as deletions, partial deletions,
partial duplications, translocation, inversions and presence of dendritic
chromosomes.
Numerous primary and secondary cytogenetic abnormalities have been
described in ALL. The cytogenetic abnormalities include both structural changes
and numerical counting of chromosomes. The cytogenetic abnormalities show
correlation with clinical parameters and prognosis.(54, 55).

26
Two of most important findings are presence of Philadelphia (Ph)
chromosome and hypoploidy (chromosomes <46 per cell). Both of these are
chromosomal abnormalities are risk factors for failure of chemotherapy for ALL.
Massive hyperdiploidy in ALL (chromosomes >50 per cell) is common finding of
childhood ALL under 10 years of age. Massive hyperploidy in ALL estimates the
impact on the prognosis and makes differences in treatment intensity. However,
clinically hyperploidy is an indicator of lower risk factor for chemotherapy.
Chromosome translocations either commonly result in formation of a
chimeric fusion of gene with novel properties or by formation of an oncogene by
changing genes.An exaggerated number of promiscuous genes like NUP 98,
ETB6 or MLL have been reported in ALL. These genes recombine with different
other genes and result in fusion and formation of chimeric genes. Thus, the
number of fusion genes overextends the number of affected genes.
In childhood B-ALL, the commonest genetic alteration is the translocation,
t(12;21)(p13;q22), which results in fusion of ETV6 toRUNX. The t (12; 21)(p13;
q22) is reported to be present in 25% of B-ALLcases.(51). Other cytogenetic
alterations found include the;t (1; 19) (q23; p13)/E2A-PBX1 (TCF3-PBX1), the
t(9;22)(q34;q11)/BCR-ABL1, and hyperdiploidy (Chromosome > 46). The
hyperploidy is often associated with a FLT3 mutation (51). Infant ALL is
associated with 80% MLL gene rearrangements and phenotypically presents as
pro-B ALL. (56-58).
27
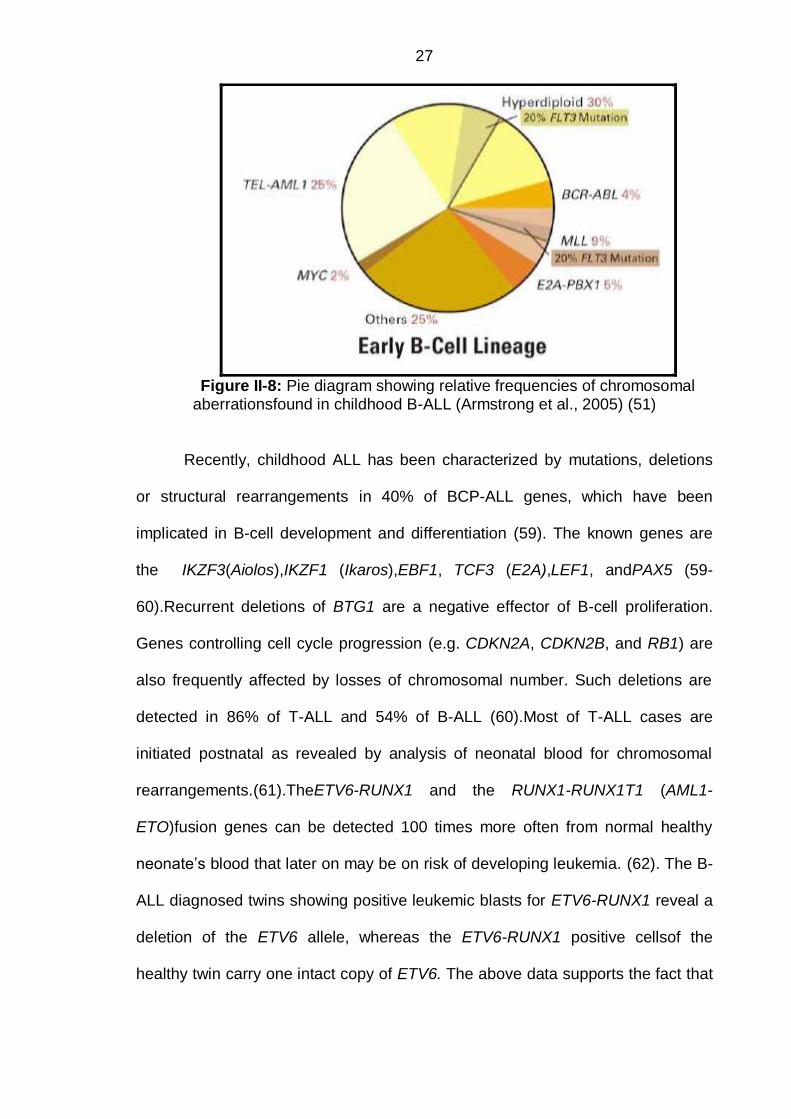
Figure II-8: Pie diagram showing relative frequencies of chromosomal
aberrationsfound in childhood B-ALL (Armstrong et al., 2005) (51)
Recently, childhood ALL has been characterized by mutations, deletions
or structural rearrangements in 40% of BCP-ALL genes, which have been
implicated in B-cell development and differentiation (59). The known genes are
the IKZF3(Aiolos),IKZF1 (Ikaros),EBF1, TCF3 (E2A),LEF1, andPAX5 (59-
60).Recurrent deletions of BTG1 are a negative effector of B-cell proliferation.
Genes controlling cell cycle progression (e.g. CDKN2A, CDKN2B, and RB1) are
also frequently affected by losses of chromosomal number. Such deletions are
detected in 86% of T-ALL and 54% of B-ALL (60).Most of T-ALL cases are
initiated postnatal as revealed by analysis of neonatal blood for chromosomal
rearrangements.(61).TheETV6-RUNX1 and the RUNX1-RUNX1T1 (AML1-
ETO)fusion genes can be detected 100 times more often from normal healthy
neonate’s blood that later on may be on risk of developing leukemia. (62). The B-
ALL diagnosed twins showing positive leukemic blasts for ETV6-RUNX1 reveal a
deletion of the ETV6 allele, whereas the ETV6-RUNX1 positive cellsof the
healthy twin carry one intact copy of ETV6. The above data supports the fact that

28
inactivation of the second unrearranged ETV6 allele represents acrucial
cooperative mutation (63).
3.3.2 Cooperative mutations
Formation of fusion genes produced by chromosomal translocations is
mainstay in the pathogenesis of ALL. However, it seems that other genetic
lesions are equally essential in inducing overt leukemia.(64).An example of such
genetic lesion is deletion of a cyclic dependent kinase inhibitor 2 A
genes(CDKN2A) which is located on 9p21.3.This CDKN2Agene encodes the
tumor suppressors like p14ARF and p16INK4A(65, 66).Deletions of CDKN2A are
present in 30% of B-cell precursor ALL and 70% of T-cell precursor ALL. The
alteration of CDKN2A gene makes both the TP53 and retinoblastoma pathways
inactive. The TP53 and retinoblastoma pathways control cell cycle transition from
G1 to S phase. Hence, inactivations of tumor suppressor proteins of these two
genes fail to prevent leukomogenesis.(67).

29
Figure II-9: The Retinoblastoma pathway and p53 Tumor suppressorcross talk
(Pui et al., 2004) (68).

30
The NOTCH1 gene alteration has been reported in <1% of T-cell ALL.
NOTCH1 gene is associated with chromosomal translocation of t (7; 9). (69). The
NOTCH1 gene encodes a membrane receptor which regulates normal T-cell
maturation.(70). Although the association of NOTCH1 in translocations is rare,
but the recent studies have reported its role in T-ALLthrough mutations. The
NOTCH1 gene mutations have been reported to be present in > 50% of T-ALL
patients (71-73). However, the underlying NOTCH1 gene mechanisms which
cause abnormal signaling and T cell proliferation remain unclear.
It is postulated that the expression of MYC oncogene may be playing role
in induction of NOTCH1gene associated T cell leukomogenesis.One study
reports that the MYC oncogene product is apro-growth mediator of NOTCH1
signaling in the developing thymocytes (71). It is reported from experimental
models that the NOTCH1 gene can induce T cell ALL and may be an initiating
gene in human T cell leukemias. (72).

31
Figure II-10: Notch signaling pathway in normal thymocytes
(Pui et al., 2008) (74)

32
3.4 Etiology of leukemia
ALL is a heterogeneous group of leukemias and many previousstudies
lacked sufficient number of possible potentialrisk factors because of study
designs, sample size and statistical power. Thus, there is emerging need of
information to gather about the etiology of childhood ALL. Many external and
internal risk factors for childhood ALL have been reported by various
epidemiological studies. The possible risk factors may be dietary agents, social
andenvironmental factors, genetic and/or immunological alterations. Knowledge
of possible hazards may help to reduce the exposure and control the deadly
dangerous disease.
3.4.1. Dietary factors
Little is known about diet of mothers of children developing childhood ALL.
Many studies have focused on association of ALL with cured meats, (75),
supplementation with folate (76), vitamins like cholecalciferol and retinol(77),
and/or foods containing topoisomerase II inhibitors (78).
The cured meat contains N-nitrosamine precursors which can be
converted into carcinogenic metabolites. The N-nitrosamine compounds are
hypothesized to induce leukomogenesis either through mother diet or food
consumption during early childhood.(75).
A previous study reported that foods such as black tea, cocoa, coffee, soy,
fruits, fresh vegetables, canned vegetables, beans and wine contain DNA
topoisomerase II inhibitors and are potential risk factors in childhood ALL. (78).

33
3.4.2.Socio-economic status
The role of socioeconomic status (SES) has been controversial as
reported by various studies. Previous studies from United States reported that
higher SES was a possible risk factor, while studies from United Kingdom
reported mixed results, some claimed SES as possible risk factor (79). Other
study from UK reported non significant differences between higher and lower
social classes. It was reported that 75% belonged to lower social class. (79)
3.4.3. Environmental factors
3.4.3.1. Ionizing radiations
Various epidemiological studies had reported that ionizing radiation are
carcinogenic and leukemogenic. (80, 81).Causal relationship of ionizing
radiations has been established for the childhood leukemia, particularly AML.(82-
85). Currently, the relationship of intrauterine radiation exposure as risk factor for
childhood cancers is already established, and it is reported that fetal exposure to
ionizing radiations is more leukemogenic compared to childhood exposure. The
magnitude of ionizing radiation as risk for occurrence of leukemia depends upon
duration of exposure, age of child at time of exposure and more over the dose of
ionizing radiations. The relationship of ionizing radiation and leukomogenesis is
now already established.(85, 86). The ionizing radiations may prove potentially
hazardous at the time of conception, or even before, during pregnancy and after
childbirth birth.

34
3.4.3.2 Non- Ionizing Radiations
Various studies had reported causal relationship between electric or
magnetic fields (EMF) and childhood leukemia. However, the basis of such
association remains unclear. (87-91) Other studies had reported no such causal
relationship.(92-94). The controversial results of such association of various
studies might have been introduced due to different methods of assessing
EMF.(95-97). Animal studies conducted with very high levels of exposure to EMF
have not shown any causal association of EMF with bone marrow neoplasia.(97).
3.4.3.3 Chemicals
Occupational exposure of parents to plastics, thinners, paints and
chlorinated solvents may cause leukemia in children. It is reported by previous
studies that benzene can trigger induction of lymphoid cells into leukemia (53).
An occupational study has reported association of benzene with occurrence of
leukemia. Benzene exposure as low as (98) <60 ppm-years could result in
leukomogenesis than previously reported as high as 220 ppm-
years.(99).Occupational and home exposure has been evaluated as possible risk
factors for childhood leukemia.(100, 101). The father’s occupational exposure to
chlorinated solvents, methyl ethyl ketone, spray paints, dyes and cutting oils have
all been considered potential risk factors.
3.4.3.4 Pesticides
Growing evidences are accumulating for possible association of pesticide
exposure and childhood leukomogenesis. Both intrauterine and postnatal
pesticide exposure are suggested as risk factors for childhood leukemia. (102).
Hence neonates and children are at risk of carcinogenic effects of pesticides as

35
their use is now overwhelming. (103). Childhood exposure is usually from home,
lawn and garden pesticides. (104).
Agriculture, seeds, vegetables, occupational exposure, and pet products
are possible source of pesticide poisoning. (100, 105, 106).
3.4.3.5 Cigarette smoking
Maternal or paternal cigarette smoking before or during pregnancy as risk
factor is yet unclear. (107, 108). Some studies have reported association of
smoking with childhood leukemia (109) while other reported no
association(110).Studies had reported that paternal and maternal smoking before
conception is related to elevated risk of childhood leukemia.(108, 109, 111)
3.4.4 Immunological Factors
Previous studies have suggested role of immunological factors in the
leukomogenesis. (112). Others have reported viral agents associated neoplastic
growths in human beings. Epstein Barr virus may change immunological
mechanisms and may induce neoplasm.(112, 113).
3.4.5. Genetic factors
Genetic factors like gene mutations significantly influence the inter
individual variation in tumor incidence (114). Various factors are acting
simultaneously some activating oncogene and other inactivating regulatory genes
resulting in an imbalance and new growth does occur eventually(115).Gene
polymorphisms have been implicated in altering the risk of leukomogenesis. The
gene polymorphisms interact with environmental factors, immune mechanism
and dietary factors for the leukomogenesis.
However,clonal evolution and the modest concordance rate for ALL in
identical twins strongly suggest that additional genetic mutations, occurring in

36
after child birth time period, are required for progression to full blown neoplasm
growth.(112). Consistent with this paradigm, several genes changes because of
incorrect DNA synthesis or abnormal methylation of oncogeneand/or tumor
suppressor genes, had been identified in the pathogenesis of lymphoid cell
cancers.(116-118).

37
4. EPSTEIN-BARR VIRUS (EBV)
EBV is classified as a human gamma herpes virus with a tropism for
epithelium and B lymphocyte. EBV is also known as human herpes virus 4 (HHV-
4), and is the type specimen of Lymphocryptovirus. Similar to other herpes
viruses, it comprises of a nucleoprotein core which is surrounded by a capsid.
The capsid, in turn, is enveloped by tegument and lipid layer containing at least
ten types of viral glycoproteins and host acquired cell proteins.
EBV is first DNA virus whose genome was sequenced and it was known to
be related to the Lymphocrypto virus genus of gamma herpes viruses.EBV
was the first large DNA virus to be sequenced, and was determined to be part of
the Lymphocrypto virus genus of gamma herpes virus. (119)
The diameter of viral particles is approximately 200 nm. It contains a singly
linear genome comprising of 185 kb, and is designated a type C genome among
herpes family(119).EBV is unique viral infection, which can induce transformation
and proliferation of B lymphocytes in humans as well as other primates, in the
absence of other stimuli.EBV is restricted to human beings under natural
conditions. EBV almost always causes symptomatic infection once in the life of
host similar to other herpes viruses; this is known as primary infection. However,
in later part of life it remains latent in host cells may be for decades.
The EBV was first identified in African region in patients of Burkitt’s
lymphoma (BL). The BL is endemic in Africa and EBV was previously unidentified
herpes virus.(120, 121)The EBV is the first herpes virus knows to immortalize
human cells. The EBV is thus believed to be oncogenic virus, though it is not first
oncogneic virus. (122)

38
4.1. Types of EBV
There are two subtypes of EBV; EBV-1 and EBV-2. Both are closely
related to each other and differ in the structure and sequence of EBNA2,
EBNA3A, EBNA3B& EBNA3C.The occurrence of EBV2 is reported from Papua
New Guinea and Africa. However, EBV 1 is dominant subtype in remaining world.
EBV 2 is reported most in homosexual, HIV +ve males of Western world. The
infectivity and disease association are thought to be similar for both EBV.
Although, it is fact that EBV-2 gene EBNA 2 is less pathogenic in causing cell
transformation and proliferation of host. (123, 124)
4.2. Genome of EBV
In latent form, the genome is a circular episome, while in infectious viral
particles it appears in linear form. When the EBV viral particles enter cells,
circularization occurs at the Terminal repeats (TR) and form linear genome.
Super coiled negative DNA is contained in circularized episome, associated with
histones and localizes to chromosomes.EBV genome replicates once per
episome per cell division. Each episome is attached to chromosome with the help
of EBNA1 protein of EBV.(125, 126) Circularization and linearization of EBV
genome during latent and Lytic infectious phases lead to variability of genome
size through a change in terminal repeats. The terminal repeats contain one
important promoter for the EBV latent membrane protein 1 (LMP1). The LMP 1 is
inversely correlated with upstream of the terminal repeat number. (127) Most of
EBV associated neoplasm arise from latent infected cells whose circular episome
replicate by host cells and contain a fixed TR number.Another contributor in the
variability of EBV strains is the major internal repeats in the W region, which vary
in number of copies. (128)

39
5. NATURAL HISTORY OF EBV INFECTION
5.1. Primary EBV infection
The EBV enters body through a breach in oral mucosa. Once inside
epithelia cells, the virus replicates and passes through mucosa into lymphoid
reservoirs of Waldeyer`s ring (adenoids, palatine tonsils, etc). The primary EBV
infection in adults clinically presents as infectious mononucleosis (IM) while in
children it is usually mild or asymptomatic.
The primary infection is characterized by proliferation of infected B
lymphocyte of Waldeyer’s ring lymphoid tissue. The B cells express immunogenic
EBV antigens and present to T cells and Natural Killer (NK) cells, which in turn
start killing EBV infected B cells.(129)
5.1.1. Infectious mononucleosis:
The symptoms of acute Infectious mononucleosis (IM) last for 1-3 weeks
from onset.The symptoms include pharyngitis, high grade fever, cervical
lymphadenopathy, splenomegaly, hepatomegaly and jaundice. Malaise and sever
fatigue last for months after resolution of acute symptoms. The antibody
response against EBV persists for rest of life(129).
5.1.2. Chronic active EBV infection (CAEBV)
CAEBV severe EBV illness is defined as lasting longer than six months.
The blood from CAEBV shows low titers of antibodies against EBNAs or high titer
against lytic antigens. CAEBV is characterized by lymphadenopathy, chronic
hepatitis, splenomegaly, etc. High EBV antibody titers with impaired T or NK cell
responses are often evident (130). CAEBV shows abnormal proliferation of EBV
infected mature T and NK cells. The underlying mechanisms of non-B
lymphocytes infection by EBV remain unclear. (131)

40
Once infected in life, the person becomes carrier throughout life. The
latency occurs by EBV residing within B lymphocyte. EBV infected B
lymphocytes can be divided into two;
Memory B lymphocytes circulating in vessel
CD10+CD77+ B lymphocytes in the germinal center of lymph nodes
(132)
The number of EBV+ B lymphocytes decreases exponentially throughout
the life of person. Shedding of EBV occurs intermittently in saliva of carriers. This
occurs when infected B cells differentiate into antibody producing plasma cells in
Waldeyer’s ring. The proliferating B cells release lytic EBV particles into saliva.
The infectious EBV secreted in saliva is made by epithelial cells rather than by
plasma cells. (132)
5.2. Cell entry and exit
The EBV binds to complement receptor 2 (CR2), also known as CD2,
which promotes stimulation, proliferation and survival of B lymphocytes by
stimulation of cell surface immunoglobulin. The complement receptor 2 (CR2) is
present on some neutrophils; hence neutrophils can be infected with EBV.
However, neutrophils can be diseased as they express high levels of death
receptors FAs and LMP 1 which cause apoptosis.The EBV glycoprotein
gp350/220 mediates B cell attachment through interaction with CR32. This leads
to cell activation, helps in cell survival through CD 19and PI3K/Akt pathway.
TheCD19 and PI3K/Akt pathwaystimulates endocytosis via non-clathrin-coated
membrane vesicles. (119, 132)
The EVB proteins gp42, gL, and gHmediate fusion of endocytosed vesicle
through interaction with class II MHC. The viral capsid carried to nucleus and
linear genome is transferred. New circular episomes are detected after 16 hours.

41
The new circular episomes function as templates for latent gene expression.The
intracellular survival of EBV inside B cells is dependent upon inactivation of
apoptotic pathways. The B cell apoptotic pathways are inactivated through viral
Bcl-2 expression.(119, 132)
Within 24 hrs of EBV infection, resting B cells show expression of the
BZLF1 protein. The BZLF1stands for Z-encoded broadly reactive activator
(ZEBRA). The BZLF1 serves as the primary lytic switch gene.Upon EBV
infection, latent viral genes expression occurs. Latent viral gene expression is
activated B cells CD23, CD44 and CD10 markers. The expression of these
markers indicates that B cells are about entering cell cycle phase of
differentiation.
The infectious virus production does not occur soon after infection of B
lymphocytes with wild-type EBV. Virus production may take 3 days and enough
virus production is evident after 5 days and 9 days before any virus is
secreted.The long life cycle and multiple steps of lytic viral cycle are peculiar to
herpes viruses.
EBV release proceeds in similar way to other herpes viruses.The viral
genome enters capsid via a dodecameric complex of Portal (BBRF1) protein.
The capsid complex fuses with inner nuclear membrane, de-enveloped by
fusion with outer nuclear membrane. Nuclear egression depends on disassembly
of nuclear lamina by different protein kinases (PK). These kinases include protein
kinase C (PKC) and the Cdk1 homologue BGLF4, which is the only EBV-
encoded PK.(119, 132)
Once in the cytoplasm, the capsid becomes complexed with an
amorphous network of tegument proteins. The complex cellular proteins include
tubulin, cofilin, actin, Hsp90, and Hsp70. Finally, the tegument-coated capsid

42
buds into regions of the trans-Golgi network, acquiring a lipid envelope containing
numerous viral glycoproteins. Secretory vesicles traffick mature virions to the cell
membrane, where the infectious particles are released. (119, 132)
6. MALIGNANCIES ASSOCIATED WITH EBV
EBV possesses potential of transforming B lymphocytes into proliferating
immortalized cell lines.LMP1 and BARF1 are the two latent proteins related to
EBV which are known oncogenic. When both are expressed the neoplastic
growth of B cells lineage begins. The LMP1 is CD40 ligand and is found in
latency II and III while the BARF1 is a CSF-1 receptor found in lytic programming
of EBV (133, 134).
The EBV is suggested as an oncogenic viral agent for cancers of
nasopharyngeal epithelium and lymphoid collections. EBV is strongly associated
with carcinomas and lymphomas (133, 134), however it is also one of the
suggested etiological agents for rare cancers like NK cells, T cells and
leiomyosarcoma associated with AIDS. (133, 134)
The plasmablastic lymphoma and lymphoma presenting as primary
effusion are tumors of large B cell lineage, which contain EBV genome and show
irregular production of LMP2A and or LMP1. (135-138)
EBV is suggested etiological agent in causing some of tumors like;
Hodgkin`s disease, Burkitt`s lymphoma, nasopharyngeal carcinoma, gastric
carcinoma and post transplant lymphoproliferative disorders (135-138).
6.1. Hodgkin’s disease (HD)
Classical HD is a lymphoma localized to lymph nodes or spleen and is
usually treatable. HD is suggested to be derived from germinal center B cells

43
which have been arrested at some stage of maturation. HD is more in male than
female. Male cases are more likely to be EBV+.
Older patients, a history of infectious mononucleosis and HD in developing
countries show high positivity for EBV genome. The classical histological picture
of HD is a giant cell known as the Reed-Sternberg (RS) cells (139). The RS cells
were once considered as granulocytes or macrophages based on shape, size
and cell markers. Later on, the surface immunoglobulin showed a B cell
decendency. The RS cells CD30 and CD15 positive contrary to most B cells.
The RS cells lack normal B cell markers like CD19 and CD20. The RS cells also
lack CD40 and CD80 markers which are necessary for T cell interactions.(139)
The RS cells comprise of 0.1- 10% of total cell population in the lesion. The RS
cells are usually surrounded by normal lymphocytes, and this makes RS genetic
abnormalities very difficult.
The primary EBV infection with symptoms of infectious mononucleosis is
at risk of developing EBV+ HD but not for EBV- HD. The EBV- HD are
characterized by excess of tyrosinase activity and blockage of A 20, both of
which activate STAT and NFκB pathways. In EBV- HD, the genetic alterations
are frequent and often associated with cytokine gene polymorphism and
autoimmune disorders. In EBV+ HD, the EBV is suggested to contribute to
surrounding milieu and probably inhibits normal immune functions. In EBV+
cases the virus is likely contributing to the milieu that surrounds the HRS cells
and prevents resolution by the immune system. (135-138)
The EBV surrounded RS-milieu contains IL-21 and IL-21R, both of which
cause activation of STATs pathway, and increase proliferation factors such as IL-
10, BAFF, APRIL and cytokines which attract T helper and T regulatory cells.
LMP1 induces IL-10 production and EBV-EBNA1 up regulates regulatory T cell

44
chemokine CCL20. EBV infection up regulates autotoxins and LPA, both are HD
growth factors. The LMP1 and LMP2A activate various signal transduction
pathways, which stimulate cell proliferation. Activated T cells, T helper cells and
antiviral immune factors are observed more in EBV+ cases compared to EBV-
HD. The B cell aberration producing RS cell phenotype is produced by down
regulation of B cell factors. EBV LMP2A activates the NOTCH pathway in mouse
models, which is normally associated with T cells rather than with B cells.(135-
138).
6.2. Burkitt’s lymphoma (BL)
Histologically, the BL shows cells similar to germinal center B
cellsi.e.;gene rearrangement for somatic Ig, BCL6 transcriptional repressor gene
levels are elevated and CD10 and CD77 positive phenotype.
BL is found in non nodal areas more often than most lymphomas. The BL
is characterized by translocation of c-myc oncogene on chromosome 8. The
translocation is often between c-myc and Ig gene and usual translocation is
t(8:14), however, t(2:8), and t(8:22) are also noted.
The BL exists in sporadic and endemic types. Theendemic BLis common
in boys of Papua New Guinea and central Africa. The EBV+ is noted in 95% of
cases of endemic BL. The sporadic BLoccurs during childhood commonly and
EBV+ is noted in only about 30%. The somatic mutations and hypermutation of
GC-B cells are associated with occasional translocations which cause
mitogenesis.
The fact that EBV is associated specifically with BL implicates EBV latent
proteins in tumorigenesis and maintenance of the tumor, and there have been
many hypotheses about how this can happen. The EBV helps to sustain BL after
oncogenesis. When EBNA1 is expressed without LMP1 as in BL, it reducesMHC

45
I loading and presentation of viral antigens on the cell surface. EBNA1 also
contributes to chromosomal instability by up regulating enzymes which generate
ROS (reactive oxygen species). The above changes cause translocations which
augment c-myc activity, such as inhibiting the p53-suppressor pathway.(135-138)
6.3. Post-transplant lymphoproliferative disorder (PTLD)
In immunocompromised persons, the cells showing the Latency III
program are killed easily. Primary immunodeficiency disorders, acquired
immunodeficiency syndrome and immunosuppressive drugs like methotrexate
often show lymphoma disease. The PTLD in transplant recipients is a frequent
adverse effect of immunosuppressant (119, 140).
In solid organ transplants, the PTLD is treatable and reducing
immunosuppressant is adding factor. While in Bone marrow transplants, the
PTLD is donor derived, with very good prognostic and treated with donor derived
T cell or EBV specific CTLs cultured ex-vivo.
In bone marrow recipients the PTLD is usually donor-derived and the
prognosis is usually very poor and treatable only by donor T lymphocyte infusion
or ex vivo-cultured EBV-specific CTLs. (119, 140)
PTLD is a diagnosis comprises various types of lesions.
Monomorphic PTLD includes malignancies which are often reported in
immunocompetent people like BL, T cell lymphoma; B-ALL and B-CML.
Monomorphic PTLD are characterized by chromosomal abnormalities.
Polymorphic PTLD is commonest type and EBV + associated with
Latency II program. It is either monoclonal or polyclonal. The B cells appear in
different stage of development.

46
HD-like PTLDs are also reported. They are not always malignant, some
are characterized by plasma blast overproduction and some resemble to EBV
infected proliferating cells as in infectious mononucleosis.
Figure II-11. The EBV primary infection and cycles of persistence(119)
They resemble to hyperplasia’s rather than tumors, but are often
associated with Latency III. The HD-like PTLDs appear soon after
transplantation. They can be controlled by reducing immunosuppressants. But

47
may appear months or years later characterized by monoclonality and or
chromosomal abnormalities. (141)
6.4. EBV associated carcinomas
6.4.1. Nasopharyngeal carcinoma (NPC):
The NPC is a malignancy of the nasal mucosal epithelium. It is prevalent
in south East Asia, and particularly among Chinese. Undifferentiated and Non-
keratinizing NPCs are always EBV+, however, some squamous type NPC are
EBV –ve. The NPC is associated with immunosuppressive microenvironment.
The lesions are characterized by presence of large number of T-regulatory cells
and surprisingly lack T-cytotoxic cells against latent EBV. Anti-EBV serology is of
diagnostic importance in NPC, specifically of the Ig A type. (142)The lesions of
NPC harbor cytokines which function as growth factors for tumor, and are
indicators of lytic EBV reactivation. The cytokines include IL-1α, IL-6, and IL-8; in
addition to the anti-inflammatory IL-10 induced by LMP1, and a lytic viral IL-10
homologue. (143-145)
6.4.2. Gastric carcinoma
The gastric carcinomas show EBV+ in 10% cases. The EBV+ gastric
carcinomas are far higher than EBV+ colon or esophageal carcinoma. The
endemicity of EBV+ gastric carcinoma is not reported. However, EBV+ gastric
carcinomas are common in Europe and Hispanic population.
One review suggests that the EBV infects basal cell layer of disrupted gastric
mucosa and EBV genome becomes methylated. If host genes are also hyper
methylated, it induces carcinogenesis.(143-146)

48
6.4.3. Other carcinomas
The EBV+ve esophageal and colon carcinomas have been reported, but
are much less compared to gastric carcinoma. (119, 140, 147)
49
CHAPTER III
MATERIALS AND METHODS
1. Study Design:
Observational study
2. Study Settings:
Liaquat University of Medical and Health Sciences, Jamshoro and Isra
University Hospital, Hyderabad.
3. Duration of Study:
Three years from January 2013 to December 2015.
4. Sample Size:
One hundred diagnosed cases of acute lymphocytic leukemia (N=100)
4.1 Sample size calculation:
The sample size for the study was calculated by the formula for sampling
for proportions. Following formula was used:
n = (z1-a/2)2 x p (1- p) d2.
n= Number of sample size.
(Z1 –a/2)= is the probability level of confidence level is taken for 95% (1.96).
p= is the probability of an event that is occurring.
1-p= is the probability of an event that is not occurring i.e. (1-p = 1-0.17 = 0.83).

50
d is the margin of sampling error (taken 5%)
n = (1.962)2 x 0.10 (1- 0.10) 0.0035
n = 3.84 x 0.10 x0.9 0.0035
n = 99
Approximated sample
Sample size (N) = 100
4.2 Sampling technique:
Non probability- purposive sampling.
4.3 Sample Selection:
Patient were selected in a systemic manner for which inclusion and
exclusion criteria were delineated.
5. Inclusion criteria
Diagnosed cases of Acute lymphoblastic leukemia
Children of <15 years of age of both genders.
5.1 Exclusion criteria:
Children with mixed lymphoproliferative disorders
Children with concomitant systemic disease.
Children with an acute infectious disease
Adult cases of acute lymphocytic leukemia

51
6.DATA COLLECTION
Liaquat University of Medical and Health Sciences, Jamshoro and Isra
University Hospital, Hyderabad. Informed consent was taken from parents of
study population.
A detailed patient history regarding duration, drugs, and symptoms related
to the acute lymphoblastic leukemia. Complete bio-data, residential address,
family history, exposure to chemicals and history of previous feverish illness was
taken and recorded in proforma.
The weight and height measurements for the calculation of body mass
index (BMI=weight/height) were performed.
7. LABORATORY INVESTIGATIONS
The study was conducted at Isra University Hospital Hyderabad and Liaquat
University of Medical and Health sciences, Jamshoro.
Detailed patients history regarding duration symptoms and drugs related with
acute lymphoblastic leukemia were noted on proforma. Complete biodata family
history, exposure to chemicals and history of previous illness was taken.
LABORATORY INVESTIGATIONS
7.1 Complete blood counts (CBC)
CBC of all samples were determined for basic hematological
parameters; this include Hb estimation, red cell count, white cell count, platelet
count, packed cell volume(PCV), mean cell volume (MCV), mean cell hemoglobin
52
(MCH), mean cell hemoglobin concentration (MCHC) and red cell distribution
width (RDW) using automated cell analyzer (Sysmex XN 1000i Tokyo, Japan).
7.2 Preparation and staining of peripheral blood smear
Peripheral smears were made, air dried and stained with Leishman’s stain.
7.2.1 Preparation of staining solution
Briefly, 0.2 g of Lieshman’s powder was placed in a volumetric flask of 100
ml. A small amount of acetone free methanol was added to dissolve the powder;
final volume was then adjusted to 100 ml by adding more methanol. The staining
solution was filtered before use.
7.2.2 Preparation of buffered water
Disodium hydrogen phosphate : 3.76 g
Potassium dihydrogen phosphate : 2.1 g
Distilled water : 1000 ml
Disodium hydrogen phosphate and potassium dihydrogen phosphate were
placed in a volumetric flask. Small amount of distilled water was added to
dissolve the salts, final volume was then adjusted to 1000 ml by adding more
distilled water.

53
7.2.3 Staining of peripheral blood smear
Leishman’s stain was poured on dried blood smears and was
allowed to stain for 2 minutes. Next, buffered water was added to the slides
having stain. The diluted stain was allowed to stay for 5-10 minutes. Slides were
then washed in running tap water, air dried and mounted.
7.2.4 Morphology of peripheral smear
Morphology of the stained blood smears were observed under the
microscope.
7.3 Bone marrow procedure
1. After taking informed consent from parents of patients, the procedure was
performed from lower end of tibia bone.
2. A small incision was made over the intended biopsy site.
4. A bone marrow aspiration needle was inserted at incision site and fixed in the
bone. Bone marrow sample was drawn using 50ml disposable syringe.
5. Using a specialized hollow needle, a bone marrow core biopsy was obtained in
cases where needed. This sample was sent to the pathology lab for examination.
6. Once the core bone marrow sample was obtained, pressure was applied for 5
minutes to the biopsy site with gauze to stop bleeding.
7. A sterile dressing or bandage was applied to the biopsy incision site.
8. Biopsy site was kept dry for 48 hours. Patients were discharged after the
procedure.

54
7.4 Karyotyping
Karyotyping is the arrangement of chromosomes according to their size,
banding pattern and centomeric position.
7.4.1 Reagents used:
• RPMI 1640 Basal Medium
• Fetal Bovine Serum
• Pencillin/Streptomycin
• Phytoheamaglutinin
• Colcemid
• Pottasiun Chloride 0.075 M Solution
• Fixative: 3 parts Methanol & 01 part Galcial Acetic Acid ( 3:1 Ratio )
Coronoy’s Fixative Freshly Prepared
• Ethanol 70%
7.4.2. Instruments & consumables
• Laminar Flow Hood ( Safety Cabinet Class II )
• Culture flasks T-25
• Co2 incubator
• Co2cylinder
• Centifuge tubes
• Centrifuge machine
• Water bath
• Micro pipettes &adjusters 5-20l, 10-100ul & 100-1000ul
• Syringes 01 c.c, 05 c.c & 10 c.c
• Serological pipettes 02 ml, 05 ml & 10 ml.
• Rack
• Bottle top dispensers
• Refrigerator 2-8oc
• Freezer -20oc

55 • Pippette aid
• Graduated cylinders 100ml,500ml & 1000 ml
• Suction machine
• Plastic Pasteur pipettes 03ml
• Coplinjars
• Frosted slide box
• Coverslips 24x50mm
• Oil immersion
• DPX mounting medium
• Serological glass Pasteur pipettes
• Permanent marker
7.4.3. Sample collection & processing:
Bone Marrow samples were aspirated and then delivered into bottle containing
appropriate amount of ethylene diaminetetra - acetic acid (EDTA) for
cytogenetics.
7.4.4. Method of culture:
The bone marrow was added to the culture tubes having 5ml cell culture medium.
Correct amount of cell suspension was added to each tube. All tubes were
labeled with the case numbers and incubated in a 370C incubator with 5% CO2
for 48 hours. Next, 50ul of 5ug/ml colcemid was added and mixed well in each
tube and reincubated at 370C.
Harvesting: The tubes were centrifuged for 10 minutes at 900 rpm. The
supernatant was discarded with a Pasteur pipette and then pellet was
resuspended . Then, 8 ml of pre-warmed 0.075M KCl was added to tubes which
were left at room temperature for 15 minutes. The tubes were then centrifuged for
10 minutes at 900 rpm. The supernatant was removed and suspension was
vortexed to keep the cell pellet moving. Freshly prepared cold fixative (3 volume

56
ethanol:1 volume acetic acid) was added drop by drop to avoid cell clumping. The
fixative to make up a final volume of 10 ml.
Preparation of slides: The pellet was gently diluted and resuspended with
additional fixative to give a slightly cloudy suspension.
The cell suspension was assessed using a microscope. If the preparation was
too dense, remake slide using a diluted cell suspension. If suspension was too
dilute, it was spinned down again and resuspended in less fixative. If the spreads
were clumped, these were washed with fixative one more time and the slides
were remade.
Two to three drops of cell suspension transferred on to a clean wet slide, spread
out and then air dried. About 2-4 slides were made per case.
Excess cell suspension was stored in fixatives at- 200C for remaking of slides if
needed. For that purposed the suspension was spinned down and fixative was
changed once before making slides.
Banding and Staining: Trypsin solution 0.125% with pH7.3 phosphate buffered
saline (PBS) was freshly prepared.
For staining, Leishman’s stain diluted with `1:7 phosphate buffer pH 6.8 was
prepared.
Coplin jars each containing the following solutions were prepared :
Phosphate Buffer Saline 1
Trypsin solution
PBSII
PBS III
Slides were dipped in PBS 1 for 1 minute. Next slides were dipped in trypsin for
5-10 seconds. Slides were then rinsed in the two Coplin jars containing PBS II
and PBS III. The slides were then stained immediately with fresh Leishman’s

57
stain for 4 minutes. Then slidess were rinsed in running water and air dried.
Cover slips were mounted on slides. The slides were examined under
microscope for chromosome bands. When slides were found under banded, time
of trypsin treatment was increased. If it is overbanded, the duration of trypsin
treatment or the PBS timing were increased, whichever was appropriate. Slides
were screened for good quality metaphase spreads.
Screening of metaphase spreads
Each banded slide was screened for well banded metaphase spreads using a
bright field microscope. The position of the metaphase spreads recorded. During
screening the position for at least 20 good metaphase spreads were recorded.
Capturing of metaphase spreads:
At least 10 metaphase spreads were captured using a satellite capture station.
Image was transferred the to an image analyzer. Karyotyping of chromosome
spreads was done. The patients’ particulars were entered in the image analyzer.
Karyotyping was performed using an image analyzer. Human cytogenetic
nomenclature used in reporting was according to ISCN (1995).
CytoVision Image Analysis and Capture System Version 7.4
CytoVision is a network based Imaging system which used for imaging
during karyotyping. It comprised of application software and hardware modules
for human metaphase finding, image capture, computer aided chromosome
presentation, data management and information output.
Sample treatment and staining
Chromosome visualization requires an appropriate banding and staining
technique being applied to the sample once on the microscope slide. In the

58
present study G-Banding with Giemsa stain and imaging using Brightfield
microscopy were used.
7.5 Fluorescence in Situ Hybridization (FISH)
FISH (Fluorescence in situ hybridization) is a molecular pathology
technique that allows detection of a specific DNA sequence in situ. It relies on the
principle that a fluorescently labeled single stranded DNA probe will anneal
(hybridize) to a complementary single stranded target DNA. The target DNA from
either metaphase chromosomes or non-dividing interphase nuclei can be
visualized using a fluorescent microscope.20
The FISH studies were performed using a commercial dual color probe
cocktail with spectrum green conjugated probe specific. The hybridization and
washings were performed following the manufacturer’s instructions. Briefly, the
slides were denatured in 70% form amide/2xSCC at 730C for 5 minutes and the
probe also in the same way. The slides were washed in 50% formamide (3 times,
10 minutes each) /2xSCC (10 minutes) and /2xSCC/0.1% NP-40 (5 minutes) at
460C. The slides were counterstained and mounted with VectaShiled DAPI. The
smears preparations were pre-treated before FISH.
1st step, the covers slips were removed by Xylene and the slides were
dehydrated in increasing alcohol series, followed by fixation in
methanol/acetic acid (3:1) at 40C overnight. Then, the slides were treated in
1M natrium thiocyanate for 10 minutes at 650C and washed in 2xSCC for 5
minutes at room temperature. Next the slides were treated in 0.01N HCl for 10
minutes and in 0.05 N HCl with pepsin (0.05 mg/ml) for 8 minutes at 37 0C
59
Final step, the slides were washed under cold running tap water for 5
minutes and dehydrated in increasing alcohol series. The analysis was
performed from three color images acquired using a fluorescence microscope
and the ISIS digital image analysis system (Meta System) developed for
CGH. Filters specific to FITC, Texas-Red and DAPI were used (Chroma
Technology Corp., Brattleboro, VT, USA).
7.6 Epstein Barr virus detection by PCR
Epstein - Barr virus (EBV) specific DNA.
Quantitative EBV PCR Kit 1.0 consisted of:
Two Master reagents (Master A and Master B)
Template Internal Control (IC)
Four Quantification Standards (QS1 – QS4)
PCR grade water
Master A and Master B reagents contained all components (buffer,
enzymes, primers and probes) to allow PCR mediated amplification and
target detection of EBV specific DNA and Internal Control in one reaction
setup.
The Quantification Standards contained standardized concentrations of
EBV specific DNA. These Quantification Standards were calibrated
against the 1st WHO International Standard for Epstein - Barr virus for
Nucleic Acid Amplification Techniques (NIBSC code: 09/260). The
Quantification Standards were used individually as positive controls, or
together to generate a standard curve, which was used to determine the
concentration of EBV in the sample.

60 Master Mix Setup
All reagents and samples were thawed completely, mixed (by pipetting or
gentle vortexing) and centrifuged briefly before use.
The Real Star® EBV PCR Kit 1.0 contained a heterologous Internal
Control (IC), which was either used as a PCR inhibition control or as a
control of the sample preparation procedure (nucleic acid extraction) and
as a PCR inhibition control.
When the IC was used as a PCR inhibition control, but not as a control for
the sample preparation procedure, the Master Mix was set up according to
the following pipetting scheme:
Number of
Reactions (rxns)
1 12
Master A 5 μl 60 μl
Master B 15 μl 180 μl
Internal Control 1 μl 12 μl
Volume Master
Mix
21 μl 252 μl
When the IC was used as a control for the sample preparation procedure
and as a PCR inhibition control, the IC was added during the nucleic acid
extraction procedure.
The IC was added to the specimen/lysis buffer mixture. The volume of the
IC which was added depended on the elution volume. It represented 10%
of the elution volume. For instance, if the nucleic acid was going to be

61
eluted in 60 μl of elution buffer or water, 6 μl of IC per sample, it was
2added into the specimen/lysis buffer mixture.
Reaction Setup
Pipette 20 μl of the Master Mix into each required well of an appropriate
optical 96-well reaction plate or an appropriate optical reaction tube.
Add 10 μl of the sample (eluate from the nucleic acid extraction) or 10 μl of
the controls (Quantification Standard, Positive or Negative Control).
At least one Positive and one Negative Control were used per run.
For quantification purposes all Quantification Standards (QS1 to QS4)
were used.
Thoroughly mixed the samples and controls with the Master Mix by up
and down pipetting.
Closed the 96-well reaction plate with an appropriate optical adhesive film
and the reaction tubes with appropriate lids.
Centrifuged the 96-well reaction plate in a centrifuge with a micro titer
plate rotor for 30 seconds at approximately 1000 x g (~ 3000 rpm).

62
8. DATA ANALYSIS
The data was analyzed on SPSS version 21.0 (IBM, Corporation, USA)
and Microsoft excel. The continuous variables is presented as mean ± SD and
has been analyzed using student’s t-test. Categorical variables were analyzed by
Chi-square test and results are presented as frequencies and percentages. Data
is presented in tables, graphs and charts. P-value of significance has been taken
at ≤0.05.
SPSS is a software for statistical analysis of research data.

63
CHAPTER IV
RESULTS
The present study observed the Mean ± SD of age as 7.5±3.2 years. Out
of 100 cases, most frequent age groups belonged to 5-10 years noted in 59
(59%) of total cases where as rest of 35 (35%) of cases belonged to < 5years of
age and only 6 (6%) cases to ≥10 years (p=0.0001).Table IV-1 and Graph IV-1
shows the age distribution of study population.
The gender distribution of study population (n= 100 cases) showed that of
of males were 57 (57%) and 43 (43%) were females (p=0.001). Male to female
ratio was 1.32:1. Gender distribution is shown in table IV-2 and graph IV-2.
Hemoglobin and hematocrit values are shown in table IV-3 and graph IV-3
respectively. Hemoglobin values of <8, 8-10 and >10 g/dl were noted in 9 (9%),
49 (49%) and 42 (42%) of cases respectively (p=0.0001). Anemia was noted in
90% and hematocrit (<20%) in 91% of cases.
Red blood cell (RBC) counts are shown in table IV-4 and graph IV-4. RBC
counts of > 5 million/µL were noted in 33% of cases. RBC counts of 2-5 and <2
million/µL were noted in 61% and 6% of cases respectively (p=0.001).
White blood cell counts (WBC) are shown in table IV-5 and graph IV-5.
WBC counts of < 10, 000, 10, 000-50,000, > 50, 000 < 100,000 and >100,000/µL
were observed in 9%, 17%, 15% and 59% of cases of respectively (p=0.0001).
Chromosomal abnormalities
Chromosomal abnormalities found in present study are summarized in
tables and graphs IV-6 to IV-10. Numerical and structural chromosomal

64
abnormalities were noted in 69% and 60% of cases respectively (p=0.001) (Table
IV-6 and Graph IV-6). Chromosomal ploidy included Diploidy, Aneuploidy and
unknown in 29%, 69% and 2% of cases respectively (p=0.0001) (table IV-7 and
graph IV-7).
Hyperploidy, hypoploidy, pseudoploidy and unknown were noted in 51%,
6%, 12% and 2% of cases respectively (0.001) (table IV-8 and graph IV-8).
Philadelphia chromosome
Ph + chromosome (t (9; 22) (q34; q11) was noted in 6% of cases of
childhood acute childhood lymphoblastic leukemia as shown in table and graph
IV-10.
Epstein Barr Virus
EBV was detected in 19% of total study population in present study as
shown in table and graph IV-11.
Bone marrow and Peripheral Blood Smear
Findings of microscopic examination of peripheral blood smears are
shown in figure IV-1 to IV-6. Immature blast cells of acute lymphoblast leukemia
are shown with hyperchromasia in L1, L2, and L3. Blast cells of variable size,
prominent nuclei, nucleoli and reticular chromatin are shown in figure IV-3. Figure
IV-5 shown immature, small blast cells with high N/C ratio, scanty cytoplasm and
open chromatin material.

65
Table IV-1. Age distribution of study population (n=100)
Age (years) No. of Pt. % p-value
< 5years 35 35
0.0001
5-10 years 59 59
>10 years 6 6
Mean ± SD 7.5±3.4
Graph. IV-1. Age distribution of study population
35
59
6
0
10
20
30
40
50
60
70
< 5years 5-10 years >10 years
Age distribution (n=100)

66
Table IV-2. Gender distribution of study population (n=100)
Gender No. of Pt. %
Male 57 57
Female 43 43
Graph. IV-2. Gender distribution of study population
57
43
0
10
20
30
40
50
60
Male Female
Gender distribution (n=100)
No. of Pt.

67
Table IV-3. Hemoglobin findings of study population (n=100)
Hemoglobin No. of Pt. % p-value
< 8 g/dl 9 9
0.0001 8-10 g/dl 49 49
>10 g/dl 42 42
Graph. IV-3. Hemoglobin distribution of study population
9
49
42
0
10
20
30
40
50
60
< 8 g/dl 8-10 g/dl >10 g/dl
Hemoglobin (n=100)
No. of Pt.

68
Table IV-4. Red blood cell counts of study population
RBC No. of Pt. % p-value
<2 million/µL 6 6
0.001
2-5 million/µL 61 61
>5 million/µL 33 33
Graph. IV-4. Red blood cell counts of study population
6
61
33
0
10
20
30
40
50
60
70
<2 million/µL 2-5 million/µL >5 million/µL
Red blood cells (n=100)
No. of Pt.

69
Table IV-5. White blood cell counts of study population
WBC No. of Pt. % p-value
< 10,000/µL 9 9
0.0001
10,000- 50,000/µL 17 17
> 50,000/µL to < 100,000 15 15
> 100,000/µL 59 59
Graph. IV-5. White blood cell counts of study population
9
17 15
59
0
10
20
30
40
50
60
70
< 10,000/µL 10,000-50,000/µL
> 50,000- <100,000/µL
> 100,000/µL
White blood cells (n=100)
No. of Pt.

70
Table IV-6. Chromosomal abnormalities in study population
Yes No Unknown p-value
Numerical chromosomal abnormality 69 29 2
0.001 Structural chromosomal abnormality 60 27 13
Graph. IV-6. Chromosomal abnormalities in study population
69
29
2
60
27
13
0
10
20
30
40
50
60
70
80
Yes No Unknown
No
. of
Pat
ien
ts
Chromosomal abnormalities (n=100)
Numerical chromosomalabnormality
Structural chromosomalabnormality

71
Table IV-7. Chromosomal ploidy of study population
No. of Pt. % p-value
Diploidy 29 29
0.0001 Aneuploidy 69 69
Unknown 2 2
Graph. IV-7. Chromosomal ploidy of study population
29
69
2
0
10
20
30
40
50
60
70
80
Diploidy Aneuploidy Unknown
No. of Pt.

72
Table IV-8. Chromosomal Numerical abnormalities
No. of Pt. % p-value
Hyperploidy 51 51
0.001
Hypoploidy 6 6
Pseudoploidy 12 12
Unknown 2 2
Graph. IV-8. Chromosomal numerical abnormalities of study population
51
6
12
2
0
10
20
30
40
50
60
Hyperploidy Hypoploidy Pseudoploidy Unknown
No
. of
Pat
ien
ts
Chromosomal numerical abnormalities (n=100)

73
Table IV-9. Chromosomal structural abnormalities in study population
(n=100)
Chromosomal abnormality
No. of Pt.
%
t(12;21)(p13;q22) 18 18
t(9;22)(q34;q11) 6 6
t(8;14)(q24;q32) 5 5
t (1;19) (p13; q23) 2 2
t(5;14)(q31;q32) 3 3
t(17;19)(q22;q13) 3 3
t(8;22)(q24;q11) 6 6
t (7;11) (q35; q13) 5 5
t (1;7) (p32; q35) 7 7
t (7;19) (q35; p13) 5 5
Unknown 13 13

74
Graph. IV-09. Chromosomal structural abnormalities of study population
18
65
23 3
65
7
5
13
0
2
4
6
8
10
12
14
16
18
20
No
. of
Pat
ein
ts
Chromosoal structural abnormalities (n=100)

75
Table IV.10. Philadelphia chromosome in study population (n=100)
Philadelphia chromosome t(9;22)(q34;q11)
No. of Pt. %
6 6
Graph. IV-10. Philadelphia chromosome in study population
6
94
0
10
20
30
40
50
60
70
80
90
100
Positive Negative
No
. of
Pa
tie
nts
Philadelphia chromosome (n=100)
t(9;22)(q34;q11)

76
Table IV-11. Frequency of Epstein Barr virus in study population (n=100)
EBV No. of Pt. % p-value
No 81 81
0.0001 Yes 19 19
Graph. IV-11. Epstein Barr virus in study population
0
10
20
30
40
50
60
70
80
90
yes No
Epstein Barr virus
No. of Pt.

77
Photomicrograph IV-1. Bone Marrow X 40

78
Photomicrograph IV-2. Peripheral smear showing Homogenous population
of Lymphoblast. X 100
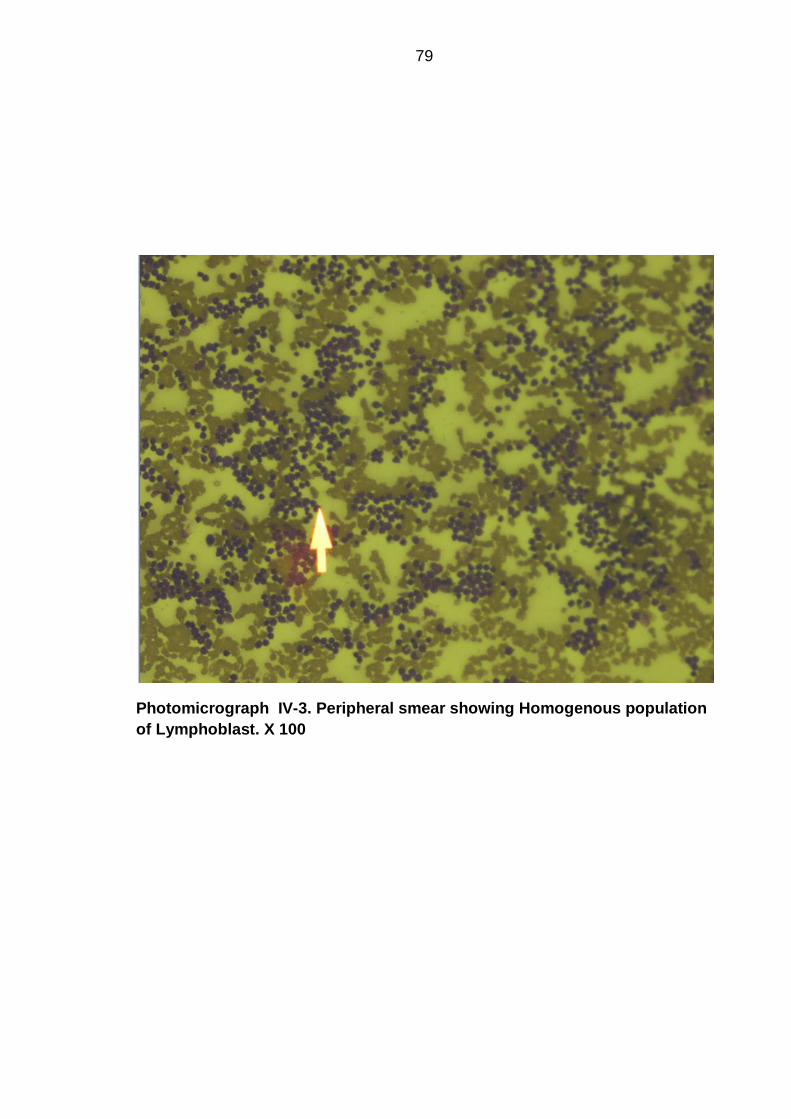
79
Photomicrograph IV-3. Peripheral smear showing Homogenous population
of Lymphoblast. X 100

80
Photomicrograph IV-4. Peripheral smear showing Homogenous population
of Lymphoblast. X 100

81
Photomicrograph IV-5. Peripheral smear showing Homogenous population
of Lymphoblast . X 400

82
Photomicrograph IV-6. Bone Marrow showing Lymphoblast X 1000

83
Photomicrograph IV-7. Bone Marrow showing Lymphoblast X 1000

84
Photomicrograph IV-8. Bone Marrow showing Lymphoblast X 1000

85
Photomicrograph IV-9. Bone Marrow showing Lymphoblast X 1000

86
Photomicrograph IV-10. Bone Marrow showing Lymphoblast X 1000

87
Photomicrograph IV-11. Bone Marrow showing Lymphoblast X 1000

88
Photomicrograph IV-12. Bone Marrow showing Lymphoblast s X 1000

89
Photomicrograph IV-13. Bone Marrow showing Leukemic blast cells X 1000

90
Photomicrograph IV-14. Bone Marrow showing leukemic blast cells X 1000

91
Photomicrograph IV-15. Bone Marrow showing Lymphoblast X 1000
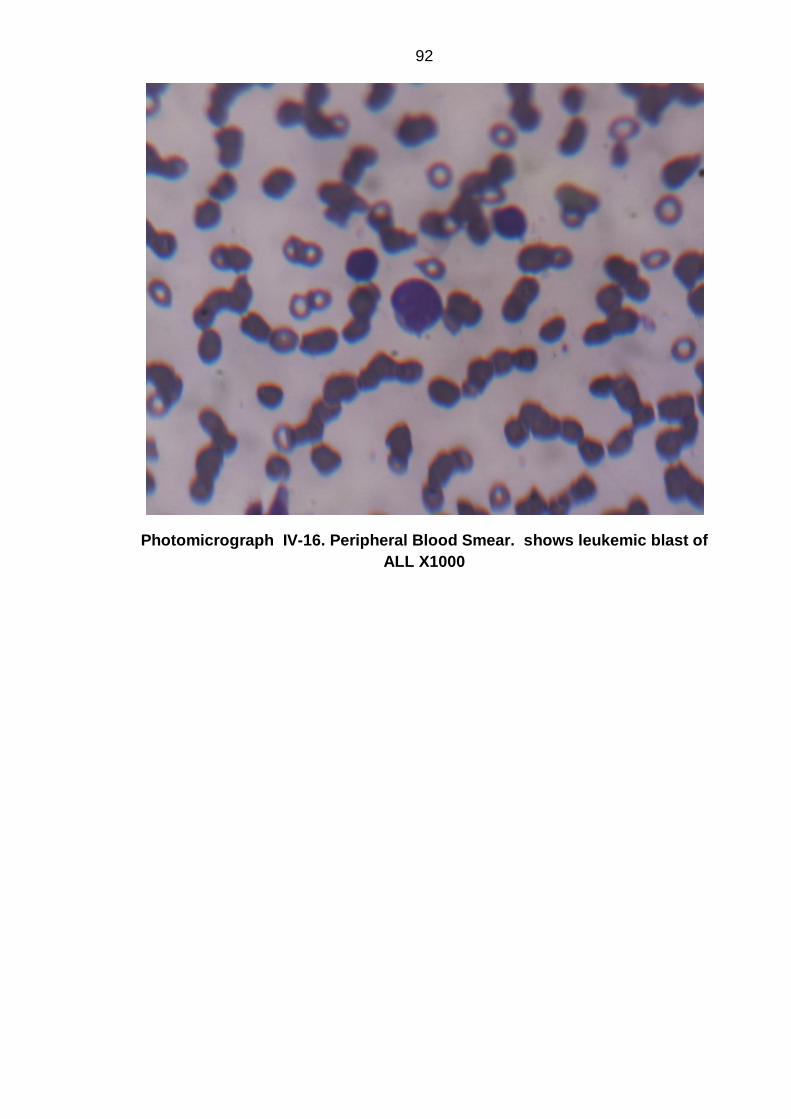
92
Photomicrograph IV-16. Peripheral Blood Smear. shows leukemic blast of
ALL X1000

93
Photomicrograph IV-17. Peripheral Blood Smear. Shows leukemic blast of
ALL X1000

94
Photomicrograph IV-18. Peripheral Blood Smear. Shows leukemic blast of
ALL X1000

95
Photomicrograph IV-19. Peripheral Blood Smear. Shows leukemic blast of
ALLX400

96
Photomicrograph IV-20. Peripheral Blood Smear. shows leukemic blast of
ALL X1000

97
CHAPTER V
DISCUSSION
The present research is conducted to analyze chromosomal abnormalities
and Epstein Barr Virus (EBV) in Childhood ALL at Isra University Hyderabad,
Sindh, Pakistan. Therefore it will help for future studies and for better
management of childhood ALL as the cytogentic characteristics are vital in
patient management.
Acute lymphoblastic leukemia (ALL) is a malignant disease characterized
by accumulation of lymphoblasts. ALL is common in children of less than 15
years of age. It accounts for 75-80% of childhood leukemias and various
subtypes of the disease can be defined based on cell morphology,
immunophenotype, and karyotype and gene expression characteristics. Over the
past several years, diagnosis and treatment of ALL in children has improved
significantly and approximately 80% of children with ALL now survive into
adulthood (149-152).
The national data on ALL in children is lacking in Pakistan.(2) Of a few
studies available, the Yasmeen et al (2) reported a frequency of 32% of ALL in
children in a retrospective study at Oncology unit of National Institute of Child
Health and Children Cancer Hospital, Karachi.(2)
Mean± SD of age was noted as 7.5±3.4 years. Of 100 cases, most
frequent age groups belonged to 2-10 years noted in 94% of total. 35 (35%)
belonged to < 5years of age and only 6 (6%) to ≥10 years (p=0.0001).Table IV-1
and Graph IV-1 shows the age distribution of study population. The findings are
consistent with Shaikh et al (149) and Yasmeen et al (2). Shaikh et al (149) had
reported mean± SD of age 7±4.4 which is comparable to present and previous

98
studies. (2, 153-155)
Of 100 cases, 57 (57%) were male and 43 (43%) were female (p=0.001).
Male to female ratio was 1.32:1. Gender distribution is shown in table IV-2 and
graph IV-2. The findings are consistent to previous studies from Pakistan (2)
(149). Shaikh et al (149) has reported male to female children ratio of 1.8:1 while
Yasmeen et al a ratio of 1.7:1. The boys predominance is a universal fact, the
findings of present study are comparable to male gender predisposition as
mentioned above. (153-155)
Hemoglobin and hematocrit values are shown in table IV-3 and graph IV-3
respectively. Hemoglobin <5, 5-10 and >10 g/dl were noted in 9 (9%), 49 (49%)
and 42 (42%) of cases respectively (p=0.0001). Anemia was noted in 90% and
hematocrit (<20%) in 91% of cases.
Red blood cell counts (RBC) of > 5 million/µL were noted in 33% of cases.
RBC counts 2-5 and <2 million/µL were noted in 61% and 6% of cases
respectively (p=0.001).
White blood cell counts (WBC) are shown in table IV-5 and graph IV-5.
WBC counts < 10, 000, 10, 000-50,000, > 50, 000 and >100,000/µL were
observed in 9%, 17%, 15% and 59% of cases of respectively (p=0.0001).
CHROMOSOMAL ABNORMALITIES
Cytogenetic analysis in hematological malignancies like many other
diseases plays a significant role in understanding the pathophysiology as well as
clinical behavior of the condition (156, 157)In fact, for ALL, like other malignant
conditions, karyotype is one of the prognostic indicators(158, 159). Other
important prognostic indicators in ALL include age (good prognosis in 1-9 years)

99
(160, 161), gender (better prognosis in girls) (162), white blood cell count
(163)(good prognosis if <50x 109/L at presentation), immune-phenotype and
minimal residual disease (MRD) detection (164) (high relapse risk with MRD of
1% or more at the end of remission induction therapy and those with MRD of
0.1% or more during continuation therapy). Numerous cytogenetic abnormalities
have been found associated with distinct immunologic phenotypes of ALL and
characteristic outcomes (150, 165-166).
Both structural and numerical chromosomal abnormalities are detected
recurrently in approximately 80 percent of ALL (167, 168).There are considerable
differences in types of cytogenetic abnormalities detected in different age groups.
For instance, t(9;22) is detected more commonly in adults (167, 168) as
compared to children. Whereas, t(4; 11), t (12; 21) and hyperdiploidies are more
common in children(167-169).
These cytogenetic abnormalities also differ in overall prognosis of the
disease including response to chemotherapy and subsequent chances of
relapse. For example, certain translocations, such as t (4;11) and t(9;22), are
associated with resistant disease and may require intensive chemotherapy
(170).In comparison, the t (12; 21), t (1; 19), and hyperdiploidy (47 to 57
chromosomes) are associated with encouraging outcomes (162, 167, 171).
The clinical and cytogenetic analyses have a crucial role in diagnosis, risk
stratification, treatment and prognosis of ALL (153, 173).
Cytogenetic data of Pakistani children with ALL at national level is
unavailable. Therefore, this study aimed in determining the cytogenetic profile of
Pakistani children with ALL in order to provide an insight into the prognosis and
furthermore proper management of the patients.

100
This study underscored several important facts regarding ALL in Pakistani
children. Literature search revealed that, it is the largest study detailing
cytogenetic profile of Pakistani children with ALL in association with search of
EBV genome in ALL.
A number of acquired chromosomal abnormalities arising from
translocations, deletions, duplications and inversions have been identified which
are often associated with deregulated gene expression. Currently an abnormal
karyotype has been detected in more than 80% of childhood (3) and 79% of
adults suffering from ALL (1, 4). 45% of chromosomal abnormalities of present
study as shown in table IV-6 are comparable to above mentioned studies.
Chromosomal abnormalities noted in present study are summarized in
table and graphs IV-6 to IV-10. Numerical and structural chromosomal
abnormalities were noted in 69% and 60% of cases respectively (p=0.001) (Table
IV-6 and Graph IV-6).
Chromosomal study showed Diploidy, Aneuploidy and unknown in 29%,
69% and 2% of cases respectively (p=0.0001) (table IV-7 and graph IV-7).
Hyperploidy, hypoploidy, pseudoploidy and unknown were noted in 51%,
6%, 12% and 2% of cases respectively (0.001) (table IV-8 and graph IV-8).
Overall, both numerical and structural cytogenetic abnormalities were
detected in 65% of patients. Findings of hyperploidy of present study are highly
comparable to studies (149, 165).
Cytogenetic analysis demonstrated in 69.5% ALL patients had a
hyperdiploid condition. Structural abnormalities observed included: t (9; 22) (q34;
q11) and t(1; 19)(q23; p13.3) (153). In present study, hyperploidy was observed

101
in 51% of cases, findings and these findings are comparable to the results of
Raimondi et al (173) which is a Western population based study.
A similar proportion of hyperdiploid karyotype has been reported in Iranian
children by Farkhondeh et al (174). This and the present study therefore by
obvious reasons show the important finding of a greater prevalence of
hyperdiploidy in Asian region of the world. However, hyperdiploidy is generally
associated with favorable prognosis. It is known that trisomies 4, 10, and 17 are
usually associated with a potentially favorable prognosis (153, 175, 176).
A study from China (177) reported frequency of hyperdiploidy of 10.61%
vs. 20-38%) pediatric ALL and 2.36% vs. 6.77-12% in adult ALL. The findings of
hyperploidy are a controversial finding and do not match with present and
previous studies (153, 173) which are also reported from Asia.
Another study from China by Chai et al (178) has reported cytogenetic
analysis in 124 cases of pediatric ALL and found 60% had clonal abnormalities,
32% had hyperploidy, 12.5% had hypoploidy and 16% pseudoploidy.
Chromosomal translocations found in 13 patients were: 4; 11, 9; 22 and 1; 19
(178). The findings of above study are in contrast to present study in terms of
chromosomal abnormalities and hyperploidy (51%) as shown in table IV-8 and
hypoploidy was found in 6% of total cases which is less compared to above
study.
A study from Denmark by Forestier et al (179) examined 1425 pediatric
ALL cases aged 2-7 years, reported high hyperploidy (51-61 chromosomes) and
a translocation t(12; 21) (p13; q22). The study concluded a high frequency of

102
cytogenetic abnormalities and hyperploidy. The findings of present study are in
full agreement with above study.
In a study in Taiwanese children with ALL, in 78 patients of under 18 years
of age, 20.5% had normal diploidy; 35.9% had pseudodiploidy; 7.7% with
hyperdiploidy (47-50 chromosomes); 24.4% with hyperdiploidy (>50
chromosomes) and 99.4% had hypodiploidy. Most frequent structural abnormality
detected was t (9; 22) (180).
Aneuploidy, defined as having more or less than the normal diploid
number of chromosomes, is a significant feature of ALL. In present study diploidy
and aneuploidy were found in 29% and 69 % of cases respectively (p=0.0001)
(table IV-7 and graph IV-7).
A high hyperdiploidy karyotype, with 51-65 chromosomes, is found in
approximately 30% of childhood cases and 5% of adult patients (5, 6).
Hyperploidy (table IV-8) shows a frequency of 51% in present study is a
comparable finding to above mentioned studies as above.
A significant chromosomal abnormality in childhood ALL is hypodiploidy
(Ho), where chromosomes are ≤ 45. It is rare, with a reported incidence of
approximately 6%.8 In the majority of reported cases, patients have 45
chromosomes. (8, 9) Overall, hypodiploidy has been linked to a poor prognosis
(8-10). Finding of 6% of hypoploidy is comparable to previous studies (8, 9).
Padhi et al (155) reported a high proportion of patients (51.2%) had hypodiploidy
karyotype (modal number of chromosomes<46). Above findings are contrary to
present study.

103
The chromosomal gains in the form of trisomies are restricted to certain
chromosomes. Chromosomes X, 4, 6, 10, 14, 17, 18 and 21 (frequently the gain
of chromosome 21 is tetrasomic) are frequently found abnormalities (7). t (12; 21)
(p13; q22) which is the commonest translocation in children with ALL and carries
good prognosis was found in 18% of cases present study which is contrary to a
previous study by Shaikh et al (149).
Ph + chromosome (t (9; 22) (q34; q11) was noted in 6% of cases of
childhood ALL in present study as shown in table and graph IV-10.The findings is
comparable to reported medical literature on the topic. A study by Schultz et al
(181) has reported a prevalence of 3-5% in Pediatric ALL, while a recent study
(149) from Pakistan has reported a prevalence of 7.08% which is much higher.
The controversies might have been introduced by bias at some step in patient
selection, data collection, analysis and presentation. Philadelphia positive ALL
was seen in one of the two adults with ALL in a previous study by Arico et al
(182). It is known to be found in 15 to 30 % of adults with ALL.
EPSTEIN BARR VIRUS
Epstein Barr Virus (EBV) is known to infect about 90% of the adult
population worldwide and its infection is generally restricted to humans (11, 12).
The virus is shed into the saliva of persistently infected individuals who spread
the virus to uninfected individuals.(13)
EBV is linked to a variety of neoplasms (17, 18)including lymphoid tumors
like Burkitt`s Lymphoma, Hodgkin’s disease (HD), lymphoproliferations in solid
organ transplant, natural killer (NK) T-cell lymphoma or bone marrow recipients
(posttransplantation lymphoproliferative disease, PTLD), AIDS-associated
lymphomas, Nasopharyngeal carcinoma, gastric carcinoma, salivary gland

104
tumors, thymic carcinoma, mesothelial tumors and leiomyosarcoma (18).
Currently national data is seriously lacking on possible role of EBV in ALL in
children.
In recent years some convincing leads have been obtained on a causal
relationship between EBV and a variety of lympho reticular malignancies.
Patients with acute infectious mononucleosis document an increased
susceptibility to Hodgkin's disease (184). Patients with AIDS are known to have
an increased incidence of EBV infection as well as lymphomas (185-187).
In present study, the EBV was detected in 19% of total study population of
Childhood ALL in present study as shown in table and graph IV-10.
In a previous study from India by Sehgal et al (183), the PCR for EBV was
positive in 32% of ALL cases (183). Western blot test using anti ZEBRA
antibodies were positive in 20% cases of ALL. Considering PCR as the gold
standard, 32% of the children with ALL had evidence of active EBV replication.
In India, although nasopharyngeal carcinoma and Burkitt type of
lymphoma are uncommon, EBV infection is common as indicated by the
ubiquitous presence of IgG antibodies to VCA in control subjects (183). One
striking observation in all these malignancies is the long latent period between
the primary infection and development of malignancy. Two exceptions, however,
are the immunoblastic lymphomas occurring after acute EBV infection in
immunocompromised hosts like transplant recipients and those with XLP
syndrome (183).
PCR followed by hybridization was considered the gold standard for
compiling data in this study. The study showed evidence of active EBV replication

105
in some patients with ALL and Hodgkin's as EBV PCR specific for replicating EB
virus was positive in 38% of the children. In this study six /11 children even
without therapy or with a short course of therapy showed evidence of EBV
infection, There was no correlation between the duration of therapy and EBV
infection in ALL. The number is, however, small to conclusively prove that
therapy was not directly or indirectly related to positivity in these children. Ideally,
age matched patients with solid tumors should also have been included but it was
not done in this preliminary study. This study was initiated because a wide variety
of hematological malignancies have been linked to EBV. Such molecular studies
pertaining to EBV in healthy children are wanting in India (183).
Venkitaraman et al (188) reported age specific prevalence of IgG
antibodies to VCA in 80% by the age of 5 years. No data on molecular studies on
EBV in cancers is available in India barring stray case reports (188).
Roy et al (189) also reported a significant number of adult controls and
cancer patients positive for EBV by ELISA assays. However, the point of active
replication was not addressed and no molecular studies were done. There are
controversial reports in the world literature regarding EBV coinfection in childhood
ALL (189).
Schlehoefer et al (190) reported increased incidence of anti VCA
antibodies and anti EBNA antibodies in children with ALL in Germany but it is
known that serological tests may not be very specific and antibodies do not
indicate active viral replication.
Wolf et al(191) documented EBV mRNA IN 4/6 cases of hairy cell
leukemia, another indication of oncogenic potential of EBV. In the single largest

106
epidemiological study conducted on 550000 mothers and 7 million years follow-
up in Finland and Iceland.
Lehtinen et al (192) concluded that activation of maternal Herpes virus
infection increased the risk of ALL in the offspring. Only EBV immunoglobulin M
positivity in EBV-immunoglobulin-G-positive mothers was associated with a
highly significant increased risk of ALL in the offspring (adjusted odds ratio=2.9,
95% confidence interval: 1.5, 5.8). These observations were supported by EBV
DNA studies. No other study has, however, substantiated these observations.
Loufty et al. from Egypt documented that HSV 1 and HSV 2 but not EBV was
linked to ALL(192).
In a more recent study from Sweden, Altieri et al (194) reported that ALL
was positively correlated with the number of siblings; the younger sibs were
strongly protected from the risk of malignancies suggesting an infectious etiology.
Sakajiri reported increased EBV infection in a patient with T ALL employing
Southern blotting and in situ hybridization (ISH) (195).
Table V-I summarizes the relevant information available from the world
literature. This study, using ELISA techniques, indicates that EBV infection is
present in 19% of childhood ALL.
Miyagi (196) from Japan documented EBV in 11/12 cases of Hodgkin's
disease using in situ hybridization (ISH). It appears that EBV may be an
important coinfection in some patients of ALL. Our findings corroborate
observations of Lehtinen et al (192).
EBV is an important opportunistic infection and the role of chemotherapy
in these patients could not be ignored. However, since some untreated patients

107
or those in the induction phase also revealed PCR positivity, it points against
EBV being an opportunistic infection due to therapy in this group of children. It is
quite possible that EBV by itself may not cause ALL but may be an important
cofactor at least in some patients. Similarly, 12 patients with AML, seven of them
on chemotherapy, were also negative. In the available literature, there is no
convincing evidence of EBV infection causing AML in children. It would be
relevant to conduct a large multicenter study on drug naïve children with ALL,
which may give key additional information on the role of EBV in childhood
leukemia in India. With tremendous advances in vaccine research there could be
a drastic change in the management of these patients in the foreseeable future.
The disease is a formidable economic burden on society. If an infectious agent is
involved in ALL, there is hope that in future these would be preventable just as
the incidence of hepatocellular carcinoma due to HbsAg can be drastically
reduced by HBV immunization (183).
Table V-I. Studies conducted on EBV in childhood ALL
Country Author EBV - ALL
India Sehgal et al 2010 (183) EBV +ve in ALL
Finland Lehtinen et al 2003 (192) EBV +ve in ALL
Egypt Loufty et al 2006 (193) EBV +ve in ALL
Japan Sakajiri et al 2002 (195) EBV +ve in ALL
Okinawa Miyagi et al 2002 (196) EBV +ve in ALL
Germany Schlehofer et al 1996 (198) EBV +ve in ALL
Qi X (199) studied Effects of Epstein-Barr virus and cytomegalovirus
infection on childhood acute lymphoblastsic leukemia gene methylation.

108
Compared with those in non-infected group and EBV- or HCMV-infected group.
In children with acute lymphoblastic leukemia, EBV and HCMV co-infection cause
changes in the methylation levels of PTEN and hTERT. These results may be
associated with epigenetic changes caused by viral infections, and further studies
are needed to further verify this hypothesis (199).
Central nervous system (CNS) involvement of Epstein-Barr virus (EBV)-
associated lymphoproliferative disease is a rare and serious complication in
children with leukemia. Although rituximab therapy seems to be promising in
these cases,persistent hypogammaglobulinemia may appear after treatment due
to complete depletion of normal B lymphocytes inthe peripheral blood. Here we
report isolated CNS involvement of EBV-associated lymphoproliferative disorder
in a 4-year-old boy with acute leukemia. The patient was treated with rituximab
and interferon alpha; however, persistenthypogammaglobulinemia developed as
a complication. Given the rarity of the complication in children receiving these
agents, our experience with such a case may be helpful to others (200).
Besides being the largest cytogenetic study in Pakistani children with ALL,
strength of our study is the combined use of polymerase chain reaction (PCR) –
for EBV detection along with cytogenetic method for karyotype determination. We
could not compare our findings with immunophenotype (B or T lineage) of ALL
however, specific cytogenetic abnormality when present, independently provides
strong predictions as far as the prognosis of the disease is concerned. The
relevance of gene set analysis also remains unclear (201)
As the national data on childhood on ALL is lacking and studies on role of
EBV in childhood ALL is absolutely lacking, hence present study will help in

109
making local data and may help for proper management of childhood acute
lymphoblastic leukemia.

110
CHAPTER VI
CONCLUSION
Most of ALL cases were characterized by leukocytosis and anemia.
Chromosomal aberrations made up 64.5% of ALL cases among which
numerical abnormalities were found in 69 % and structural abnormalities in
60% of the karyotypes of ALL cases.
Prevalence Epstein Barr Virus was 19% amongst ALL cases.
This study showed good prognostic cytogenetic abnormalities like
hyperdiploidy and t (12; 21) (p13; 22) in Pakistani children with ALL.
Prevalence of poor prognostic cytogenetic aberrations like t (9; 22) (q34;
q11.2), hypoploidy was comparable to available international literature.
The present study will help for better management of childhood ALL as the
cytogenetic abnormalities are of proven prognostic value in patient
management.

111
CHAPTER VII
RECOMMENDATION
Further studies are recommended to be conducted to evaluate frequency
of cytogenetic abnormalities and role of EBV in childhood ALL in our
population
Prognostic value of each type of chromosomal abnormality should be
determined by follow-up of such cases.

112
REFERENCES
1. Robbinson HM. Acquired abnormalities of chromosome 21 in acute lymphoblastic leukemia. (Thesis). Faculty of Science, School of Medicine, University of Southampton 2008: 23-41.
2. Yasmeen N, Ashraf S. Childhood Acute Lymphoblastic Leukaemia; Epidemiology and Clinico-pathological Features.J Pak Med Assoc2009; 59(3): 151-4.
3. Harrison CJ. The genetics of childhood acute lymphoblastic leukemia.
Baillieres Best Prac ResClinHaematol 2000;13:427-39. 4. Moorman AV, Harrison CJ, Buck GA, Richards SM, Secker-Walker LM,
Martineau M, at al. Karyotype is an independent prognostic factor in adult acute lymphoblastic leukemia (ALL): analysis of cytogenetic data from patients treated on the Medical Research Council (MRC) UKALLXII/Eastern Cooperative Oncology Group (ECOG) 2993 trial. Blood2007; 109:3189-97.
5. Secker-Walker LM, Lawler SD, Hardisty RM. implications of chromosomal
findings in acute lymphoblastic leukemia at diagnosis. British Medical Journal 1978; 2:1529-30.
6. Moorman AV, Richards SM, Martineau M, Cheung KL, Robinson HM, Jalali
GR, et al. Outcome heterogeneity in Childhood high-hyperdiploid acute lymphoblastic leukemia. Blood 2003; 102:2756- 62.
7. Moorman AV, Clark R, Farrell DM, Hawkins JM, Martineau M, Secker-Walker
LM. Probes for hidden hyperdiploidy in acute lymphoblastic leukemia. Genes Chromosomes and Cancer 1996; 16:40-5.
8. Harrison CJ, Moorman AV, Broadfield ZJ, Cheung KL, Harris RL, Reza JG.
Three distinct subgroups of hypodiploidy in acute lymphoblastic leukemia. Br J Haematol 2004;125:552-9.
9. Raimondi SC, Zhou Y, Mathew S, Shurtleff SA, Sandlund JT, Rivera GK.
Reassessment of the prognostic significance of hypodiploidy in pediatric patients with acute lymphoblastic leukemia. Cancer 2003; 98:2715-22.
10. Mitelman F, Johansson B, Mertens F. The impact of translocations and gene
fusions on cancer causation. Nat Rev Cancer2007;7:233-45. 11. Toussirot E, Roudier J. "Epstein-Barr virus in autoimmune diseases." Best
Pract Res Clin Rheumatol 2008; 22(5):883-96. 12. Odumae OA, Hogquist KA. Progress and problems in understanding and
managing primary Ebstein-Barr virus infections. Clin Microbiol Rev 2011; 24(1):193-209.

113 13. Sun X, Tong L. Can global variation of nasopharynx cancer be retrieved from
the combined analyses of IARC Cancer Information (CIN) databases? PLoS One 2011; 6(7):22039.
14. Middeldorp JM, Brink AA. "Pathogenic roles for Epstein-Barr virus (EBV) gene products in EBV-associated proliferative disorders." Crit Rev Oncol Hematol 2003; 45(1):1-36.
15. Tao Q, Young LS. Ebstein-Barr virus (EBV) and its associated human
cancers--genetics, epigenetics, pathobiology and novel therapeutics. Front Biosci 2006; 11:2672-2713.
16. Maeda E, Akahane M. Spectrum of Epstein-Barr virus-related diseases: a
pictorial review. Jpn J Radiol 2009; 27(1):4-19. 17. Thompson MP, Kurzrock R. Epstein-Barr virus and cancer. Clin Cancer Res
2004; 10(3):803- 21. 18. Miszczak D, Slonska A. "Herpes viruses’ survival strategies –latency and
apoptosis." Postepy Hig Med Dosw 2013; 67 (0):276-87. 19. Barret KE, Barman SM, Boitano S, Brooks H.Ganong`s Review of Medical
Physiology, 24th ed. M`c Graw Hill Medical Publishing. New York 2012:507-8.
20. Guyton AC, Hall JE. Textbook of Medical Physiology, 11th ed. Elsevier Saunders. Philadelphia, Pennsylvania 2012:457-60.
21. Hoffbrand AV, Moss PAH, Pettit JE. Essential Hematology. 7th edition. Blackwell Publishing, USA/UK 2016.
22. National Cancer Institute's Surveillance, Epidemiology and End Results (SEER). 2011. Available from: http://seer.cancer.gov/ (accessed: November15, 2014).
23. American Cancer Society. Cancer facts and figures, 2008.
24. Mulhern RK, Palmer SL. Neurocognitive late effects in pediatric cancer. Current Problems in Cancer 2003;27:177-97.
25. Linker CA, Damon LE. Blood Disorders In: Mc Phee SJ, Papadakis MA, Rabow MW. (editors) Current medical diagnosis and treatment. 51st edition. Mc-Graw Hill companies, Inc. New York 2012: 501-6.
26. Gurney JG, Severson RK, Davis S, Robison LL.Incidence of cancer in children in the United States. Sex, race, and 1-year age-specific rates by histologic type. Cancer 1995; 75:2186-95.
27. Kersey JH, Sabad A, Gajl-Peczalska K, Hallgren HM, Yunis EJ, Nesbit ME. Acute lymphoblastic leukemia cells with T (thymus derived) lymphocyte markers. Science 1973; 183:1355–6.

114 28. Zahm SH, Ward MH. Pesticides and childhood cancer. Environmental Health
Perspectives 1988; 106:893–908.
29. Ries LAG, Kosary CL, Hankey BF, Miller BA, Clegg L, Mariotto A. SEER Cancer Statistics Review 1988.
30. Margolin JF, Steuber CP, Poplack DG. Acute lymphoblastic leukemia.In: Pizzo PA, Poplack DG (editors). Principles and Practice of Pediatric Oncology, 4th ed. Lippincott Williams& Wilkins, Philadelphia 2002:489
31. Shivakumar R, Tan W, Wilding GE. Biologic features and treatment outcomeof secondary acute lymphoblastic leukemia. Ann Oncol 2008;19:1634–8.
32. Spector LG, Xie Y, Robison LL, Heerema NA, Hilden JM, Lance B. Maternal diet and infant leukemia: the DNA topoisomerase II inhibitor hypothesis: a report from the children’s oncology group.Cancer Epidemiol Biomarkers Prev 2005;14:651–5.
33. Gale KB, Ford AM, Repp R. Identification of clonotypic gene fusion sequences in neonatal blood spots. ProcNatlAcadSci1977; 94:13950–4.
34. Taub JW, Konard MA, Ge Y. High frequency of leukemic clones in new born screening blood samples of children with B-precursor acute lymphoblastic leukemia. Blood 2002; 99:2992–6.
35. Gustafsson G, Kreuger A. Incidence of childhood leukemia in Sweden. ActaPaediatrScand 1982; 71:887-92.
36. Miller RW, Young JL, Novakovic B.Childhood cancer. Cancer 1995;75:395-405.
37. Swensen AR, Ross JA, Sverson RK, Pollock BH, Robison LL. The age peak in childhood acute lymphoblastic leukemia: exploring the potential relationship with socioeconomic status. Cancer 1997; 79:2045-51.
38. Parkin DM, Stiller CA, Drapper GJ, Bieber CA. The international incidenceof childhood cancer. Int J Cancer 1988; 42:511-20.
39. Swerdlow SH, Campo E, Harris NL. International Agency for Research on Cancer (IARC), Lyon, France 2008.
40. Bennett JM, Catovsky D, Daniel MT. Proposals for the classification of the acute leukaemias (FAB cooperative group). Br J Haematol1976; 33:451-8.
41. Bene MC, Castoldi G, Knapp W. Proposals for the immunological classification of acute leukemias. Leukemia1995; 9:1783-6.
42. Hayhoe FG. The classification of acute leukemia. Blood Rev 1988;2:186-93

115 43. Guenova E, Watanabe R, Teague JE, Desimone JA, Jian Y, Dowlastshahi M,
et al. TH2 Cytokines from Malignant Cells Suppress TH1Responses and Enforce a Global TH2 Bias inLeukemic Cutaneous T-cell Lymphoma. Clin Cancer Res 2013; 19(14):3755-63.
44. Jaffe ES, Harris Nl, Stein H. World Health Organization Classification of Tumours of hematopoietic and lymphoid tissue. Lyon, IARC Press 2001.
45. Mihova D. Leukemia- Acute ALL- WHO classification. Mod Pathol 2000; 13:193.
46. Hoelzer D, Gokbuger N. Diagnostik und Therapie der akuten lymphatischen Leukaemia des Erwachsenen. Onkologie2002;8:672-85.
47. Campana D, Janossy G. Proliferation of normal and malignant human immature lymphoid cells. Blood 1988;71:1201-1210.
48. de Waele M, Renmans W, Vander GK, Jochmans K, Schots R, Otten J. Growth factor receptor profile of CD34+ cells in AML and B-lineage ALL and in their normal bone marrow counterparts. Eur J Haematol2001; 66:178-87.
49. Bene MC, Castoldi G, Knapp W, Ludwig WD, Matutes E, Orfao A, et al. For the European Group for the Immunological Characterization of Leukemias (EGIL). Proposals for the immunological classification of acute leukemias. Leukemia 1995; 9: 1783–6.
50. Thalhammer-Scherrer R, Mitterbauer G, Simonitsch I, Jaeger U, Lechner K, Schneider B. Theimmunophenotype of 325 adult acute leukemias: relationship to morphologic and molecular classification and proposal for a minimal screening program highly predictive for lineage discrimination. Am J Clin Pathol 2002;117: 380-9.
51. Armstrong SA, Look AT. Molecular genetics of acute lymphoblastic leukemia. J Clin Oncol 2005;23: 6306-6315.
52. Mitelman F, Johansson B, Mertens F. Fusion genes and rearranged genes as a linear function of chromosome aberrations in cancer. Nat Genet 2004; 36: 331-334.
53. Greaves MF, Wiemels J. Origins of chromosome translocations in childhood leukaemia. Nat Rev Cancer 2003; 3:639-649.
54. Mitelman F, Mertens F, Johansson B.A break point map of recurrent chromosomal rearrangements in human neoplasia. Nat Genet 1997; 15:417-74.
55. Mitelman F, Johansson B, Mertens F. The impact of translocations and gene fusions on cancer causation. Nat Rev Cancer 2007; 7: 233- 245.
56. Attarbaschi A, Mann G, Konig M, Steiner M, Strehl S, Schreiberhuber A, et al. Mixed lineage leukemia-rearranged childhood pro-B and CD10- negative pre-B acute lymphoblastic leukemia constitute a distinct clinical entity. Clin Cancer Res2006; 12:2988-94.

116 57. O'Neil J, Look AT. Mechanisms of transcription factor deregulation in
lymphoid cell transformation. Oncogene 2007; 26: 6838-6849.
58. Pieters R, Schrappe M, de-Lorenzo P, Hann I, de-Rossi G, Felice M, et al. Overview of the outcome of acute lymphoblastic leukemia in children. Lancet 2007; 370:240.
59. Mullighan CG, Goorha S, Radtke I, Miller CB, Coustan-Smith E, Dalton JD, et al.Genome-wide analysis of genetic alterations in acute lymphoblastic leukaemia.Nature 2007;12:758-64.
60. Kuiper RP, Schoenmakers EF, van Reijmersdal SV, Hehir-Kwa JY, van Kessel AG, van Leeuwen FN, et al. High-resolution genomic profiling of childhood ALL reveals novel recurrent genetic lesions affecting pathways involved in lymphocyte differentiation and cell cycle progression. Leukemia 2007; 21: 1258-66.
61. FischerS, Mann G, Konrad M, Metzler M, Ebetsberger G, Jones N, et al. Screening for leukemia- and clone-specific markers at birth in children with T-cell precursor ALL suggests a predominantly postnatal origin. Blood 2007;110:3036-38.
62. Mori H, Colman SM, Xiao Z, Ford AM, Healy LE, Donaldson C, et al. Chromosome translocations and covert leukemic clones are generated during normal fetal development. Proc Natl Acad Sci U S A 2002;99:8242-7
63. Hong D, Gupta R, Ancliff P, Atzberger A, Brown J, Soneji S, et al. Initiating
and cancer-propagating cells in TELAML1- associated childhood leukemia. Science 2008; 319:336-9.
64. Knudson AG. Mutation and cancer: statistical study of retinoblastoma. Proc Natl Acad Sci USA 1971; 68:820-823.
65. Lukas J, Parry D, Aagaard L, Mann DJ, Bartkova J, Strauss M, et al. Retinoblastoma-protein dependent cell-cycle inhibition by the tumor suppressor p16. Nature 1995; 375:503-6.
66. Stott FJ, Bates S, James MC, McConnell BB, Starborg M, Brookes S, et al. The alternative product from the human CDKN2A locus, p14 (ARF), participates in a regulatory feedback loop with p53 and MDM2. EMBO J 1998;17:5001-14.
67. Bertin R, Acquaviva C, Mirebeau D, Guidal-Giroux C, Vilmer E, Cave, H. CDKN2A, CDKN2B, and MTAP gene dosage permits precise characterization of mono- and bi-allelic 9p21 deletions in childhood acute lymphoblastic leukemia. Genes Chromosomes Cancer 2003; 37: 44-57.
68. Pui CH, Relling MV, Downing JR. Acute lymphoblastic leukemia, N Engl J Med; 2003;350:1535-48.

117
69. Ellisen LW, Bird J, West DC, Soreng AL, Reynolds TC, Smith SD, et al. TAN-
1, the human homolog of the Drosophila notch gene, is broken by chromosomal translocations in T lymphoblastic neoplasms. Cell 1991; 66: 649-61.
70. Maillard I, Fang T, Pear WS. Regulation of lymphoid development, differentiation, and function by the Notch pathway. Annu Rev Immunol 2005;23: 945-74.
71. Weng AP, Ferrando AA, Lee W, Morris JP, Silverman LB, Sanchez-Irizarry C, et al. Activating mutations of NOTCH1 in human T cell acute lymphoblastic leukemia. Science 2004;306:269-71.
72. Grabher C, von-Boehmer H, Look AT. Notch 1 activation in the molecular pathogenesis of T-cell acute lymphoblastic leukaemia. Nat Rev Cancer 2006;6: 347-59.
73. Marks DI, Paietta EM, Moorman AV, Richards SM, Buck G, Dewald G, et al. Selective deficiency of debrisoquine 4- hydroxylase activity in mouse liver microsomes. J Pharmacol Exp Ther 1997; 282:1435-41.
74. Pui CH, Robison LL, Look AT. Acute lymphoblastic leukaemia. Lancet 2008;371:1030-43.
75. Blot WJ, Henderson BR, Boice JDJr. Childhood cancer in relation to cured meat intake: review of the epidemiological evidence. Nutr. Cancer 1999; 34:111-8.
76. Thompson JR, Gerald PF, Willoughby ML, Armstrong BK. Maternal folate supplementation in pregnancy and protection against acute lymphoblastic leukaemia in childhood: a case-control study. Lancet 2001; 358:1935–40.
77. Shu XO, Gao YT, Brinton LA, Linet ML, Tu JT, Zheng W, et al. A population-based case-control study of childhood leukemia in Shanghai. Cancer 1988; 62:635–44.
78. Ross J, Potter J, Robison L, Reaman G, Pendergrass T. Maternal exposure to potential inhibitors of DNA topoisomerase II and infant leukemia (United States): a report from the Childrens Cancer Group. Cancer Causes Control 1996;7: 581– 90.
79. Reinier KS. Methodological Issues in Epidemiologic Studies of Childhood Leukemia: Control Selection and Exposure Assessment (Ph.D Dissertation); Division of Epidemiology, University of California: Berkeley 2002.
80. Jablon S, Kato H. Childhood cancer in relation to prenatal exposure to atomic bomb radiation. Lancet 1970;2:100-3.
81. Black D. New evidence on childhood leukemia and nuclear establishment. Br Med J 1987;294:591-2.

118 82. Ron E.Ionizing radiation and cancer risk: evidence from epidemiology. Radiat
Res 1998;150:30–41.
83. Sali D, Cardis E, Sztanyik L, Auvinen A, Bairakova A, Dontas N. Cancer consequences of the Chernobyl accident in Europe outside the former USSR: a review. Int J Cancer 1996;67:343–52.
84. Urquhart JD, Black RJ, Muirhead MJ, Sharp L, Maxwell M, Eden OB. J.D. United Nations Scientific Committee on the Effects of Atomic Radiation.Case-control study of leukemia and non-Hodgkin’s lymphoma in children in Caithness near the Dounreay nuclear installation. BMJ 1991; 302: 687–92.
85. Mahoney MC, Moysich KB, McCarthy PL, McDonald RC, Stepanenko VF, Day RW. The Chernobyl childhood leukemia study: background & lessons learned. Environ Health 2004; 3: 3-12.
86. Miller RW. Persons with exceptionally high risk of leukemia. Cancer Res 1967;27: 2420–3.
87. Savitz DA, Chen J. Parental occupation and childhood cancer: review of epidemiologic studies. Environ Health Perspect 1990;88: 325–37.
88. Hatch EE, Linet MS, Kleineman RA, Tarone RE, Severson RK, Hartsock CT. Association between childhood acute lymphoblastic leukemia and use of electrical appliances during pregnancy and childhood. Epidemiology 1998;9:234–45.
89. Ahlbom A, Day N, Feychting M, Roman E, Skinner J, Dockerty J. A pooled analysis of magnetic fields and childhood leukaemia. Br J Cancer 2000;83: 692–8.
90. Greenland S, Sheppard AR, Kaune WT, Poole C, Kelsh MA. A pooled analysis of magnetic fields, wire codes, and childhood leukemia, Childhood-EMF Study Group. Epidemiology 2000;11:624–34.
91. Rivard CE, Deadman JE. Maternal occupational exposure to extremely low frequency magnetic fields during pregnancy and childhood leukemia. Epidemiology 2003; 14: 437–41.
92. Myers A, Cllyden A, Cartwright RA, Cartwright SC. Childhood cancer and overhead powerlines: a case-control study. Br J Cancer 1990;62:1008–14.
93. Linet MS, Hatch EE, Kleinman RA, Robison LL, Kaune WT, Friedman DR. Residential exposure to magnetic fields and acute lymphoblastic leukemia in children. N Engl J Med 1997;337: 1–7.
94. Kleinerman RA, Kaune WT, Hatch EE, Wacholder S, Linet MS, Robison LL. Are children living near high-voltage power lines at increased risk of acute lymphoblastic leukemia? Am J Epidemiol 2000;151:512– 5.

119 95. Hardell L, Holmberg B, Malker H, Paulsson LE. Exposure to extremely low
frequency electromagnetic fields and the risk of malignant disease—an evaluation of epidemiological and experimental findings. Eur J Cancer Prev 1995;4(3):107.
96. Bowman JD, Thomas DC. Are children living near high-voltage power lines at increased risk of acute lymphoblastic leukemia? Am J Epidemiol 2001; 153: 615–7.
97. Brain JD, Kavet R, McCormick DL, Poole C, Silverman LB, Smith TJ. Childhood leukemia: electric and magnetic fields (EMF) as possible risk factors. Environ Health Perspect 2003;111: 962–70.
98. Glass DC. (2003). Leukemia risk associated with low-level benzene exposure. Epidemiology 2003; 14: 569–577.
99. Belson M, Kingsley B, Holme A. Risk factors for acute leukemia in children: a review. Environmental Health Perspectives 2007;115: 138–145.
100. Lowengart RA, Peters JM, Cicioni C, Buckley J, Bernstein L, Preston-Martin S. Childhood leukemia and parents' occupational and home exposures. Journal of the National Cancer Institute 1987; 79: 39-46.
101. Shu XO, Stewart P, Wen WQ, Han D, Potter JD, Buckely JD, et al. Parental occupational exposure to hydrocarbons and risk of acute lymphocytic leukemia in offspring.Cancer Epidemiology, Biomarkers & Prevention 1999;8: 783-91.
102. Ma X, Buffler PA, Gunier RB, Dahl G, Smith MT, Reinier K, et al. Critical windows of exposure to household pesticides andrisk of childhood leukemia. Environ. Health Perspect 2002;110: 955–60.
103. Zahm SH, Ward MH. Pesticides and childhood cancer. Environmental Health Perspectives 1988;106:893–908.
104. Grossman J. What’s hiding under the sink: dangers of household pesticides? Environ Health Perspect 1995;103:550–4.
105. Infante-Rivard C, Labuda D, Krajinovic M, Sinnett D. Risk of childhood leukemia associated with exposure to pesticides and with gene polymorphisms. Epidemiology 1999;10, 481-7.
106. Menegaux F, Baruchel A, Bertrand Y, Lescoeur B, Leverger G, Nelken B.Household exposure to pesticides and risk of childhood acute leukaemia.Occup Environ Med 2006; 63:131-4.
107. Shu XO, Ross JA, Pendergrass TW, Reaman GH, Lampkin B, Robison LL. Parental alcohol consumption, cigarette smoking, and risk of infant leukemia: a Children’s Cancer Group study. J Natl Cancer Inst 1996; 88:24–31.

120 108. Brondum J, Shu XO, Steinbuch M, Severson RK, Potter JD, Robison LL.
Parental cigarette smoking and the risk of acute leukemia in children. Cancer 1999;85:1380–8.
109. Ji BT, Shu Xo, Linet MS, Zheng W, Wacholder S, Gao, Y, et al. Paternal
cigarette smoking and the risk of childhood cancer among offspring of nonsmoking mothers. J. Natl. Cancer Inst 1997; 89:238–44.
110. Pang D, McNally R, Birch JM. Parental smoking and childhood cancer: results from the United Kingdom Childhood Cancer Study. Br. J. Cancer 2003;88:373– 81.
111. Sorahan T, Lancashire R, Prior P, Stewart A. Childhood cancer and parental use of alcohol and tobacco. Ann Epidemiol 1995; 5:354–9.
112. Greaves MF, Wiemels J. Origins of chromosome translocations in childhood leukaemia. Nat Rev Cancer 2003; 3:639-49.
113. Kinlen LJ. Epidemiologic evidence for an infective basis in childhood leukaemia. Br J Cancer 1995;71:1-5
114. Shields PG, Harris CC. Cancer risk and low-penetrance susceptibility genes in gene-environment interactions. J. Clin. Oncol 2000; 18: 2309– 15.
115. Nishihira T, Hashimoto Y, Katayama M, Mori S, Kuroki T. Molecular and cellular features of esophageal cancer cells. J Cancer Res Clin Oncol 1993;119:441-9.
116. Zingg JM, Jones PA. Genetic and epigenetic aspects of DNA methylation
on genome expression, evolution, mutation and carcinogenesis. Carcinogenesis 1997;18: 869-82.
117. Kuppers R, Klein U, Hansmann ML, Rajyewsky K. Cellular origin of human
B-cell lymphomas. N Engl J Med 1999;341:1520-9. 118. Vanesse G J, Concannon P, Willerford DM. Regulated genomic instability
and neoplasia in the lymphoid lineage. Blood 1999;94,:3997- 4010. 119. Davison A.Comparative analysis of the genomes in Human herpesviruses:
Biology, therapy, and immunoprophylaxis. In: Arvin A, Campadelli-Fiume G, Mocarski E, Moore PS, Roizman B, Whitley R, Yamanishi K. (editors). Cambridge University Press: New York 2007: 403-33.
120. Epstein MA, Achong BG, Barr YM. Virus particles in cultured lymphoblasts from Burkitt's lymphoma. Lancet 1964;283(7335):702-3.
121. Hummeler K, Henle G, Henle W. Fine structure of a virus in cultured lymphoblasts from Burkitt lymphoma. J Bacteriol 1966; 91(3): p. 1366-1368.

121 122. Gerber P, Whang-Peng J, Monroe JH. Transformation and chromosome
changes induced by Epstein-Barr virus in normal human leukocyte cultures. Proc Natl Acad Sci U S A 1969; 63(3):740-7.
123. Longnecker R, Neipel F. Introduction to the human {gamma}-herpesviruses.In: Arvin A, Campadelli-Fiume G, Mocarski PS, Moore B, Roizman R, Whitley R, Yamanishi K (editors).Human herpesviruses: Biology, therapy, and immunoprophylaxis. Cambridge University Press: New York 2007: 403-33.
124. Klein G, Emberg I. Effects on apoptosis, cell cycle and transformation, and comparative aspects of EBV with other DNA tumor viruses.In: Arvin A, Campadelli-Fiume G, Mocarski PS, Moore B, Roizman R, Whitley R, Yamanishi K (editors).Human herpesviruses: Biology, therapy, and immunoprophylaxis. Cambridge University Press: New York 2007: 403-33.
125. Vereide D, Sugden D. Proof for EBV's sustaining role in Burkitt's lymphomas. Semin Cancer Biol 2009; 19(6): 389-393.
126. Lieberman P, Hu J, Renne R. Gammaherpesvirus maintenance and replication during latency. in Human herpesviruses: Biology, therapy, and immunoprophylaxis. In: Arvin A, Campadelli-Fiume G, Mocarski PS, Moore B, Roizman R, Whitley R, Yamanishi K (editors).Human herpesviruses: Biology, therapy, and immunoprophylaxis. Cambridge University Press: New York 2007: 403-33.
127. Repic AM, Shi M, Scott RS, Sixbey JW. Augmented latent membrane protein 1 expression from Epstein-Barr virus episomes with minimal terminal repeats. J Virol2010. 84(5):2236-2244.
128. Allan GJ, Rowe DT. Size and stability of the Epstein-Barr virus major internal repeat (IR-1) in Burkitt's lymphoma and lymphoblastoid cell lines. Virology 1989;173(2): 489-498.
129. Ambinder R, Caserman E. Clinical and pathological aspects of EBV and KSHV infection.In: Arvin A, Campadelli-Fiume G, Mocarski PS, Moore B, Roizman R, Whitley R, Yamanishi K (editors).Human herpesviruses: Biology, therapy, and immunoprophylaxis. Cambridge University Press: New York 2007: 403-33.
130. Kimura H, Hoshino Y, Kanegane H, Tsuge I, okamura T, Kawa K, et al. Clinical and virologic characteristics of chronic active Epstein-Barr virus infection. Blood 2001; 98(2): 280-286.
131. Ohga S, Ishimura M, Toshimo G, Miyamoto T, Takada H, Tanaka T, et al. Clonal origin of Epstein-Barr virus-infected T/NK-cell subpopulations in chronic active Epstein-Barr virus infection. Nature Preceding 2010: hdl:10101/npre.2010.4238.1.

122 132. Lee CP, Chen MR.Escape of herpesviruses from the nucleus. Rev Med
Virol, 2010; 20(4): 214-30.
133. Bräuninger A, Spieker T, Willenbrock K, Gaulard P, Wacker HH, Rajewsky K, et al. Survival and clonal expansion of mutating "forbidden" (immunoglobulin receptor-deficient) Epstein-Barr virus-infected B cells in angioimmunoblastic T cell lymphoma. J Exp Med 2001; 194(7):927-40.
134. Hjalgrim H, Friborg J, Melbye M. The epidemiology of EBV and its association with malignant disease.In: Arvin A, Campadelli-Fiume G, Mocarski PS, Moore B, Roizman R, Whitley R, Yamanishi K (editors).Human herpesviruses: Biology, therapy, and immunoprophylaxis. Cambridge University Press: New York 2007: 403-33.
135. Anastasiadou E, Boccellato F, Cirone M, Kis LL, Klein E, Frati L, et al. Epigenetic mechanisms do not control viral latency III in primary effusion lymphoma cells infected with a recombinant Epstein-Barr virus. Leukemia 2005;19(10): 1854-6.
136. Horenstein MG, Nador RG, Chadburn A, Hyjek EM, Inghirami G,Knowles DM, et al. Epstein-Barr virus latent gene expression in primary effusion lymphomas containing Kaposi's Sarcoma-associated herpesvirus / Human herpesvirus-8. Blood 1997;90(3):1186-1191.
137. JiangY, Xu D, Zhao Y, Zhang L. Mutual inhibition between Kaposi's
Sarcoma-associated herpesvirus and Epstein-Barr virus lytic replication initiators in dually-infected primary effusion lymphoma. PLoS One 2008; 3(2): e1569.
138. Castillo JL, Pantanowitz L, Dezube BJ. HIV-associated plasmablastic lymphoma: Lessons learned from 112 published cases. Am J Hematol 2008; 83(10): 804-9.
139. Kanzler H, Kuppers R, Hansman ML, Rajewsky K. Hodgkin and Reed-Sternberg cells in Hodgkin's disease represent the outgrowth of a dominant tumor clone derived from (crippled) germinal center B cells. J Exp Med 1996; 184(4): 1495-1505.
140. Juvonen E, Aalto SM, Takkanen J, Volin L, Mattila PS, Knuutila S, et al. High incidence of PTLD after non-T-cell-depleted allogenic haematopoietic stem cell transplantation as a consequence of intensive immunosuppressive treatment. Bone Marrow Transplant2003; 32(1): 97-102.
141. Dunphy CH, Galambos C, Polski JM, Evans HL, Gardner LJ, Grosso LE,
et al. Montone, Extranodal posttransplant plasmacytic hyperplasia with subsequent posttransplant plasmacytic malignancy: Six-year interval case report and review of the literature. Arch Pathol Lab Med 2002; 126(3):351-6.

123 142. Gullo C, Low WK, Teoh G. Association of Epstein-Barr virus with
nasopharyngeal carcinoma and current status of development of cancer-derived cell lines. Ann Acad Med Singapore 2008;37(9): 769-77.
143. Hsu M, Wu SY, Chang S, Su IJ, Tsai CH, Jai SU, et al. Epstein-Barr virus lytic transactivator Zta enhances chemotactic activities through induction of interleukin-8 in nasopharyngeal carcinoma cells. J Virol 2008;82(7): 3679-88.
144. Huang YT, Sheen TS, Chen CL, Lu J, Chang Y, Chen JY, et al. Profile of cytokine expression in nasopharyngeal carcinomas: A distinct expression of interleukin 1 in tumor and CD4+ T cells. Cancer Res 1999; 59(7):1599-1605.
145. Münz C, Moormann A. Immune escape by Epstein-Barr virus associated malignancies. Semin Cancer Biol 2008; 18(6): 381-7.
146. Yu WM, Hussain SSM. Incidence of nasopharyngeal carcinoma in Chinese immigrants, compared with Chinese in China and South East Asia: Review. J Laryngol Otol 2009; 123(10): 1067-74.
147. Boysen T, Mohammadi M, Melbye M, Hamilton-Dutoit S, Vainer B, et al.EBV-associated gastric carcinoma in high- and low-incidence areas for nasopharyngeal carcinoma. Br J Cancer 2009; 101(3): 530-3.
148. Niini T. Cytogenetic and molecular genetic changes in childhood acute leukemias. Academic dissertation: Department of Medical Genetics Haartman Institute University of Helsinki Finland. 2002.
149. Shaikh MS, Ali SS, Khurshid M, Fadoo Z. Chromosomal Abnormalities in Pakistani Children with Acute Lymphoblastic Leukemia.Asian Pac J Cancer Prev 2014; 15 (9):3907-39
150. Vrooman LM, Silverman LB. Childhood acute lymphoblastic leukemia: update on prognostic factors. Curr Opin Pediatr 2009; 21:1-8.
151. Aburn G, Gott M. Education given to parents of children newly diagnosed with acute lymphoblastic leukemia a narrative review. J Pediatr Oncol Nurs, 2011; 28: 300-5.
152. Tharnprisan P, Khiewyoo J, Sripraya P, Wiangnon S. Relapse-free rate with childhood acute lymphoblastic leukemia treated under the thai national protocol. Asian Pac J Cancer Prev 2013; 14:1127-30.
153. Aziz F, Qureshi I Z. Clinical and cytogenetic analyses of Pakistani Leukemia Patients. Pak J Zool 2008; 40 (3):147-57.
154. Kosary CL, Ries LAG, Miller BA, Hankey BF, Edwards BK. SEER cancer statistics review, 1973-1992: tables and graphs. National Cancer Institute. Bethesda, Md. 1995.
124 155. Padhi S, Sarangi R, Mohanty P, Das P, Chakravarty S, Mohanty R, et al.
Cytogenetic profile of pediatric acute lymphoblastic leukemia (ALL): analysis of 31 cases with review of literature. Caryologia 2011; 64 (1): 33-41.
156. Mazloumi SH, Madhumathi DS, Appaji L, Prasannakumari. Combined study of cytogenetics and fluorescence in situ hybridization (FISH) analysis in childhood acute lymphoblastic leukemia (ALL) in a tertiary cancer centre in South India.. Asian Pac J Cancer Prev 2012; 13: 3825-7.
157. Gil EA, Lajus TB, de Moura TM. Banding cytogenetic analysis in pediatric
patients with acute lymphoblastic leukemia (ALL) in a Brazilian population. Mol Cytogenet 2013; 6:37.
158. Borowitz MJ, Devidas M, Hunger SP. Clinical significance of minimal residual disease in childhood acute lymphoblastic leukemia and its relationship to other prognostic factors: a children’s oncology group study. Blood 2008; 111: 5477-85.
159. Iacobucci I, Papayannidis C, Lonetti A. Cytogenetic and molecular predictors of outcome in acute lymphoblastic leukemia: recent developments. Curr Hematol Malig Rep 2012; 7:133-43.
160. Hilden JM, Dinndorf PA, Meerbaum SO. Analysis of prognostic factors of
acute lymphoblastic leukemia in infants: report on CCG 1953 from the children’s oncology group. Blood 2006; 108:441-51.
161. Tharnprisan P, Khiewyoo J, Sripraya P, Wiangnon S. Relapse-free rate with childhood acute lymphoblastic leukemia treated under the thai national protocol. Asian Pac J Cancer Prev 2013; 14:1127-30.
162. Pieters R, Carroll WL. Biology and treatment of acute lymphoblastic leukemia. Pediatr Clin North Am 2008; 55:1-20.
163. Landau H, Lamanna N. Clinical manifestations and treatment of newly
diagnosed acute lymphoblastic leukemia in adults. Curr Hematol Malig Rep 2006;1:171-9.
164. Basso G, Veltroni M, Valsecchi MG. Risk of relapse of childhood acute lymphoblastic leukemia is predicted by flow cytometric measurement of residual disease on day 15 bone marrow. J Clin Oncol 2009; 27:5168-74.
165. Pui CH, Robison LL, Look AT. Acute lymphoblastic leukaemia. Lancet 2008; 371:1030-43.
166. Harrison CJ. Cytogenetics of pediatric and adolescent acute lymphoblastic leukaemia. Br J Haematol 2009; 144:147-56.
167. Harrison CJ, Moorman AV, Barber KE. Interphase molecular cytogenetic screening for chromosomal abnormalities of prognostic significance in childhood acute lymphoblastic leukaemia: a UK Cancer Cytogenetics Group Study. Br J Haematol 2005; 129:520-30.
125 168. Moorman AV, Ensor HM, Richards SM. Prognostic effect of chromosomal
abnormalities in childhood B-cell precursor acute lymphoblastic leukaemia: results from the UK Medical Research Council ALL97/99 randomised trial. Lancet Oncol 2010;11: 429-38.
169. Hilden JM, Dinndorf PA, Meerbaum SO. Analysis of prognostic factors of acute lymphoblastic leukemia in infants: report on CCG 1953 from the children’s oncology group. Blood 2006; 108:441-51.
170. Aricó M, Schrappe M, Hunger SP. Clinical outcome of children with newly
diagnosed philadelphia chromosome-positive acute lymphoblastic leukemia treated between 1995 and 2005. J Clin Oncol 2010; 28:4755-61.
171. Forestier E, Heyman M, Andersen MK. Outcome of ETV6/RUNX1-positive childhood acute lymphoblastic leukaemia in the NOPHO-ALL-1992 protocol: frequent late relapses but good overall survival. Br J Haematol 2008: 123: 134-9
172. Carroll WL, Bhojwani D, Min DJ. Pediatric acute lymphoblastic leukemia. Hematology (Am. Soc. Hematol. Educ. Program) 2003; 1:102-31.
173. Raimondi SC. Current status of cytogenetic research in childhood acute lymphoblastic leukemia. Blood 1993; 81: 2237-51.
174. Farkhondeh B, Mohammad-Taghi A, Ardeshir A, Mina I. Chromosomal abnormalities in leukemia in Iran; A pilot study. Arch. Iran. Med 2001;6: 128-34.
175. Pui CH, Relling MV, Dowining JR. Acute Lymphoblastic Leukemia. N. Engl. J. Med 2004;350: 1535-48.
176. Hann I, Voram A, Harrison G, Harrison C, Eden O, Hill F, et al. Determinants of outcome after intensified therapy of childhood lymphoblastic leukaemia: results from Medical Research Council United Kingdom acute lymphoblastic leukaemia XI protocol. Br. J. Haematol 2001;113: 103-14.
177. Chen B, Wang YY, Shen Y, Zhang WN, He HY, Zhu YM, et al. Newly diagnosed acute lymphoblastic leukemia in China (I):abnormal genetic patterns in 1346 childhood and adult casesand their comparison with the reports from Western countries. Leukemia 2012; 26:1608 -16
178. Chai YH, Lu H, Li JQ, Xiao PF, He YX, Shao XJ. Classical and molecular cytogenetic abnormalities in 124 pediatric patients with acute lymphoblastic leukemia. Zhonghua Er Ke Za Zhi 2007;45: 684-6.
179. Forestier E, Schmiegelow K. The incidence peaks of the childhood acute leukemias reflect specific cytogenetic aberrations. J. Pediatr. Hematol. Oncol 2008;28: 486-95.

126 180. Chang HH, Lu MY, Jou ST, Lin KH, Tien HF, Lin DT. Cytogenetics in
childhood acute lymphoblastic leukemia in Taiwan: a single-institutional experience. Pediatr. Hematol. Oncol 2006;23:495-506.
181. Schultz KR, Bowman WP, Aledo A. Improved early event-free survival with imatinib in Philadelphia chromosome-positive acute lymphoblastic leukemia: a children’s oncology group study. J Clin Oncol 2009; 27: 5175-81.
182. Arico M, Valsecchi MG, Camitta B, Schrappe M, Chessells J, Baruchel A, et al. Outcome of treatment in children with Philadelphia chromosome-positive acute lymphoblastic leukemia. N. Engl. J. Med 2000; 342: 998-1006.
183. Sehgal S, Mujtaba S, Gupta D, Aggarwal R, Marwaha R K. High incidence of Epstein Barr virus infection in childhood acute lymphocytic leukemia: A preliminary study. Indian J Pathol Microbiol 2010;53:63-7
184. Jarrett RF. Risk factors for Hodgkin's lymphoma by EBV status and significance of detection of EBV genomes in serum of patients with EBV-associated Hodgkin's lymphoma. Leuk Lymphoma 2003; 44:S27-32.
185. Mujtaba S, Varma S, Sehgal S. Coinfection with Epstein Barr virus in North Indian patients with HIV/AIDS. Indian J Pathol Microbiol 2005; 48:349-53.
186. Hamilton - Dutoit SJ, Pallesen G, Franzmann M B, Karkov J, Black F, Skinhøj P. AIDS related lymphoma: histopathology, immunophenotype, and association with EBV as demonstrated by in situ nucleic acid hybridization. Am J Pathol 1991;138:149-63
187. Weiss LM, Movahed LA. In situ demonstration of Epstein-Barr viral genomes in viral-associated B cell lymphoproliferations. Am J Pathol 1989;134:651-9
188. Venkitaraman AR, Lenoir GM, John TJ. The seroepidemiology of infection due to Epstein Barr virus in southern India. J Med Virol 1985;15:11-6.
189. Roy A, Dey S, Chatterjee R. Prevalence of serum IgG and IgM antibodies against Epstein Barr virus capsid antigen in Indian patients with respiratory tract carcinomas. Neoplasma 1994;41:29-33
190. Schlehofer B, Blettner M, Geletneky K, Haaf HG, Kaatsch P, Michaelis J et al. Sero-epidemiological analysis of the risk of virus infections for childhood leukemia. Int J of Cancer 1996; 65:584-90.
191. Wolf BC, Martin AW, Neiman RS, Janckila AJ, Yam LT, Caracansi A, et al. The detection of Epstein-Barr virus in hairy cell leukemia cells by in situ hybridization. Am J Pathol 1999; 136:717-23.

127 192. Lehtinen M, Koskela P, Ogmundsdottir HM, Bloigu A, Dillner J,
Gudnadottir M, et al. Maternal Herpes virus infection and risk of Acute Lymphoblastic Leukemia in the offspring. Am J Epidemiol 2003; 158:207-13.
193. Loutfy SA, Alam El-Din HM, Ibrahim MF, Hafez MM. Herpes simplex type 1 and 2, Epstein Barr virus and cytomegalovirus in children with acute lymphoblastic leukemia in Egypt. Saudi Med J 2006; 27:1139-45.
194. Altieri A, Castro F, Bermejo JL, Hemminki K. Number of Siblings and the risk of Lymphoma, Leukemia and Myeloma by histopathology. Cancer Epidemiol Biomarkers Prev 2006; 15:1281-6.
195. Sakajiri S, Mori k, Isobe y, kawamata N, Oshimi K. Epstein Barr virus associated T cell acute lymphoblastic leukemia. Br J Hematol 2002; 117:127-9.
196. Miyagi J, Toda T, Uezato H, Ohshima K, Miyakuni T, Takasu N, et al. Detection of Epstein barr virus type 1 in malignant nodal lymphoma, studied in Okinawa, a sub tropical area in Japan. Int J Hematol 2002; 75:78-84.
197. O'Connor SM, Boneva RS. Infectious etiologies of childhood leukemia: plausibility and challenges to proof. Environ Health Perspect 2007; 115:146-50.
198. Schlehofer B, Blettner M, Geletneky K, Haaf HG, kaatsch P, Michaelis J et
al. Sero-epidemiological analysis of the risk of virus infections for childhood leukemia. Int J of Cancer 1996; 65:584-90.
199. Qi X, Shu Y, Qin R, Zou L. Effects of Epstein-Barr virus and cytomegalovirus infection on childhood acute lymphoblastic leukemia gene methylation. Nan Fang Yi Ke Da Xue Xue Bao 2013; 33(11):1678-81.
200. Atabay B, Turker M, Ozturk C, Sutcuoglu S, Oniz H, Ozer ES. Central Nervous System Involvement of Epstein BarrVirus Associated Lymphoproliferative Disorder in aChild with Acute Lymphoblastic Leukemia: SuccessfulTreatment with Rituximab and Interferon-Alpha. Turk J Hematol 2013; 30:58-62.
201. Soheila K, Hamid A, Farid Z. Comparison of univariate and multivariate gene set analysis in acute lymphoblastic leukemia. Asian Pac J Cancer Prev 2013; 14:1629-33.

128
Proforma
CHROMOSOMAL ABNORMALITIES AND EPSTEIN BARR VIRUS
IN ACUTE LYMPHOBLASTIC LEUKEMIA IN CHILDREN
Department of Pathology/Hematology, Isra University Hospital
MR# Date:
Name: Age :
Sex: Religion:
Ethnicity:
Socioeconomic status:
Address:
Phone No:
General health status:
General Physical Examination:
Pulse:
B.P:
Anemia:
Clubbing:
Koilonychias:
Dehydration:
Pedal edema

129
Laboratory Investigations:
1. Complete Blood Counts
Hemoglobin
Hematocrit
ESR
RBC:
WBC:
Platelet count
2. Karyotyping (Chromosomal studies)
3. Epstein Barr Virus
Dr. Ghulam Shah Nizamani