chromosome 13q14 deletions in multiple...
TRANSCRIPT
i
CHROMOSOME 13q14 DELETIONS IN MULITPLE MYELOMA AT
CHRIS-HANI BARAGWANATH HOSPITAL
SEKGOKWA TEBOHO STELLA PHEEHA A research report submitted to the Faculty of Health Sciences, University of
the Witwatersrand, in fulfilment of the requirements for the degree of Master
of Medicine (MMed), in Haematology.
JOHANNESBURG, 2009

ii
DECLARATION I declare that this is my unaided work, except for some technical and
specialised cytogenetic investigations. It is being submitted for
the degree of Master of Medicine, in Haematology, to the University of the
Witwatersrand. It has not been submitted before for any other degree or
examination at this or any other University.
____________________ ________________ Teboho Pheeha Date

iii
ETHICS COMMITTEE APPROVAL
Approval for this study was granted by the Ethics Committee for Research on
Human Subjects, University of the Witwatersrand (Clearance Certificate
Protocol Number – M01-01-12 / Reference Number 14/49 Pheeha).

iv
DEDICATION This work is dedicated to my parents, my husband Eddie, son Thamaha, and daughters Tshegofatso and Kabelo.
v
ABSTRACT Multiple Myeloma (MM) is a malignancy of plasma cells. The incidence
worldwide has been reported to be 3-4/100 000 of the population. The exact
aetiology is not known, but several factors have been implicated in the aetio-
pathogenesis of the disease.
Chromosomal abnormalities are well documented in MM. Their detection is
important, as some of the cytogenetic abnormalities such as the 13q deletion
are associated with a poor prognosis. Knowledge of the prognostic factors
guides the clinician with respect to the appropriate management of the
patient.
Prior to the use of fluorescence in situ hybridisation (FISH) as a technique for
detecting cytogenetic abnormalities in MM, progress was slow in this field
because of the difficulty of obtaining analysable metaphases in view of the low
proliferative activity of plasma cells. FISH has significantly improved the
detection rate over conventional cytogenetics.
Objective: The present study set out to determine the proportion of patients
with MM who have a detectable chromosome 13q deletion using
conventional cytogenetic and FISH analysis. The FISH technique was
specifically studied to see if the detection rate of the 13q deletion is improved
compared to conventional cytogenetics. Furthermore, the cytogenetic
abnormalities detected were correlated with the course of the disease, as well
as other parameters of prognostic significance.
vi
Methods: Bone marrow aspiration specimens were obtained from thirty (30)
patients with MM. Both newly and previously diagnosed patients were
included.
The sample size was however reduced to twenty (20) because of the
need to optimise the technique and improve signal detection.
Conventional cytogenetic and FISH analysis was performed using the LSI
D13S319 DNA probe as the test probe, and the centromeric alpha 11 and 18
as control probes. The analysis was carried out by two observers.
Results: In the current study, the detection of chromosomal aberrations was
much better with FISH analysis compared to conventional cytogenetics i.e.
25% versus 5%.
Of all the patients with chromosomal aberrations, 25% (5/20) had the specific
deletion 13q14 (D13S319). Most of our patients (70%) presented with stage
III disease. 60% of those were positive for deletion 13q14 (D13S319), i.e 3/5
patients had stage III disease. However, there was no correlation between
disease stage and chromosome status, as the majority of the patients
presented with advanced stage disease, irrespective of their chromosomal
status. Other factors of prognostic significance such as the haemoglobin level,
beta-2 microglobulin and creatinine levels were not found to correlate with the
presence of the chromosomal aberration but with disease stage. Furthermore,
median survival did not correlate with the presence of the chromosomal
abnormality.
Conclusion: FISH analysis improves the detection rate of chromosomal
abnormalities in MM compared to conventional cytogenetics. The prevalence
of 13q14 deletion in our patient population is lower than that reported in the
vii
literature (25% vs 30-80%). No correlation was found between the presence
of the deletion 13q14 (D13S319) and mortality, stage of disease and
laboratory parameters that have been associated with poor prognosis in MM
i.e. haemoglobin, Beta-2-microglobulin and creatinine levels. The prognostic
significance of deletion 13q14 (D13S319) in MM could not be established
from this study. A prospective study with a larger sample and using probes
covering the whole extent of chromosome 13q may possibly yield different or
more conclusive results. The use of other techniques such as gene
expression profile analysis would probably be of value in determining the
prognostic significance of 13q14 lesions in MM.

viii
ACKNOWLEDGEMENTS
I would like to sincerely thank the following people and organizations:
i) The Freda and David Becker Trust, for providing the funds required for
this project.
ii) My supervisor, Professor Moosa Patel, for his assistance, guidance,
valuable advice, and the support that he provided throughout the study.
iii) Professor Barry Mendelow, for his valuable advice.
iv) Dr Pascale Willem, for the laboratory support .
v) The medical staff at Chris Hani Baragwanath Hospital, especially Dr Vinitha
Philip, for her assistance and support.
vi) The Haematology (NHLS) laboratory staff at Chris Hani Baragwanath
Hospital, Mr Yega Govender, Ms Sakina Loonat and Ms Nomsa Tshabalala
for their assistance.
vii) The staff of the Cytogenetics Department at the University of
Witwatersrand Medical School, namely Ms Gugu Nosilela, Ms Momtaz
Booley, Ms Eulanda Muale, and Ms Keabetswe Mbamba, for teaching me
the FISH technique, technical support and helping me troubleshoot; Ms
Sonya Engelbrecht, for her assistance and advice on the technique, computer
software, reviewing of the results and taking pictures.
viii) Mrs Liezel Wolmarans for data correlation and statistical analysis.
I would also like to thank all those who contributed in any way to this project,
but whom I failed to acknowledge personally. Last but not least, I would like to
express my sincere gratitude to the patients who willingly and unselfishly gave
consent for their samples to be used in this study and to be part of the study.
Most of all I would like to thank God for making all this possible.
ix
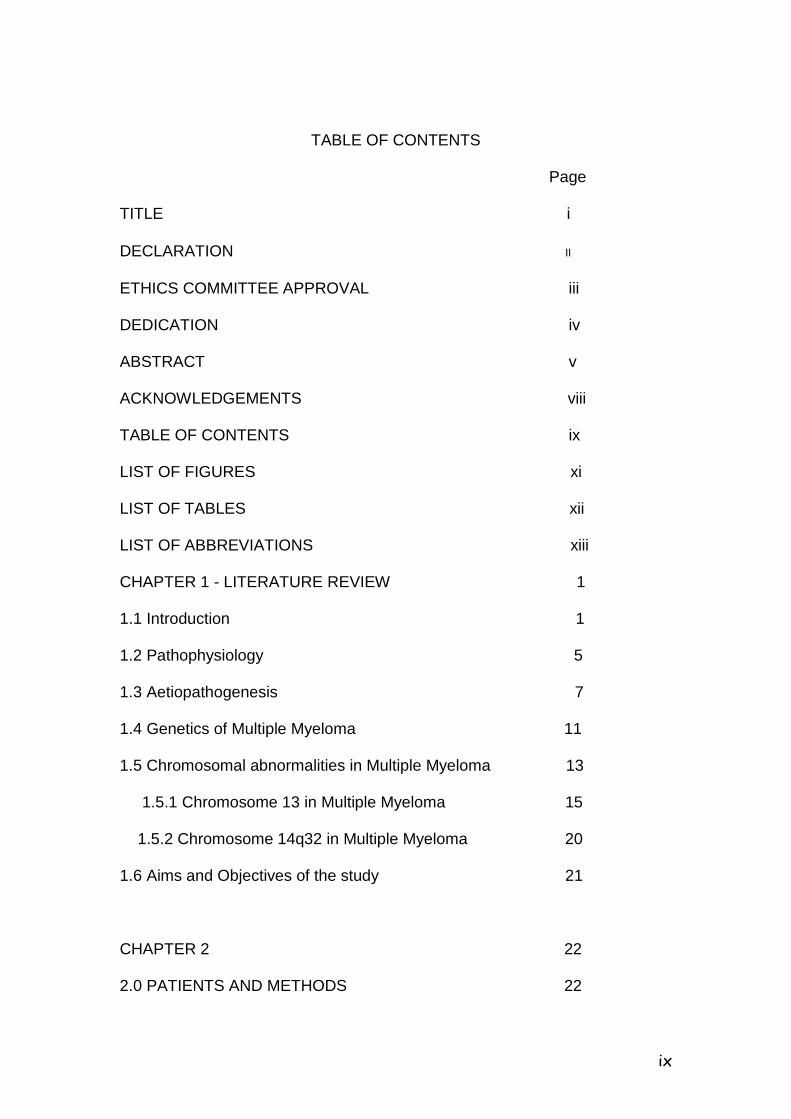
TABLE OF CONTENTS
Page
TITLE i
DECLARATION ii
ETHICS COMMITTEE APPROVAL iii
DEDICATION iv
ABSTRACT v
ACKNOWLEDGEMENTS viii
TABLE OF CONTENTS ix
LIST OF FIGURES xi
LIST OF TABLES xii
LIST OF ABBREVIATIONS xiii
CHAPTER 1 - LITERATURE REVIEW 1 1.1 Introduction 1 1.2 Pathophysiology 5 1.3 Aetiopathogenesis 7 1.4 Genetics of Multiple Myeloma 11 1.5 Chromosomal abnormalities in Multiple Myeloma 13 1.5.1 Chromosome 13 in Multiple Myeloma 15 1.5.2 Chromosome 14q32 in Multiple Myeloma 20 1.6 Aims and Objectives of the study 21 CHAPTER 2 22 2.0 PATIENTS AND METHODS 22
x
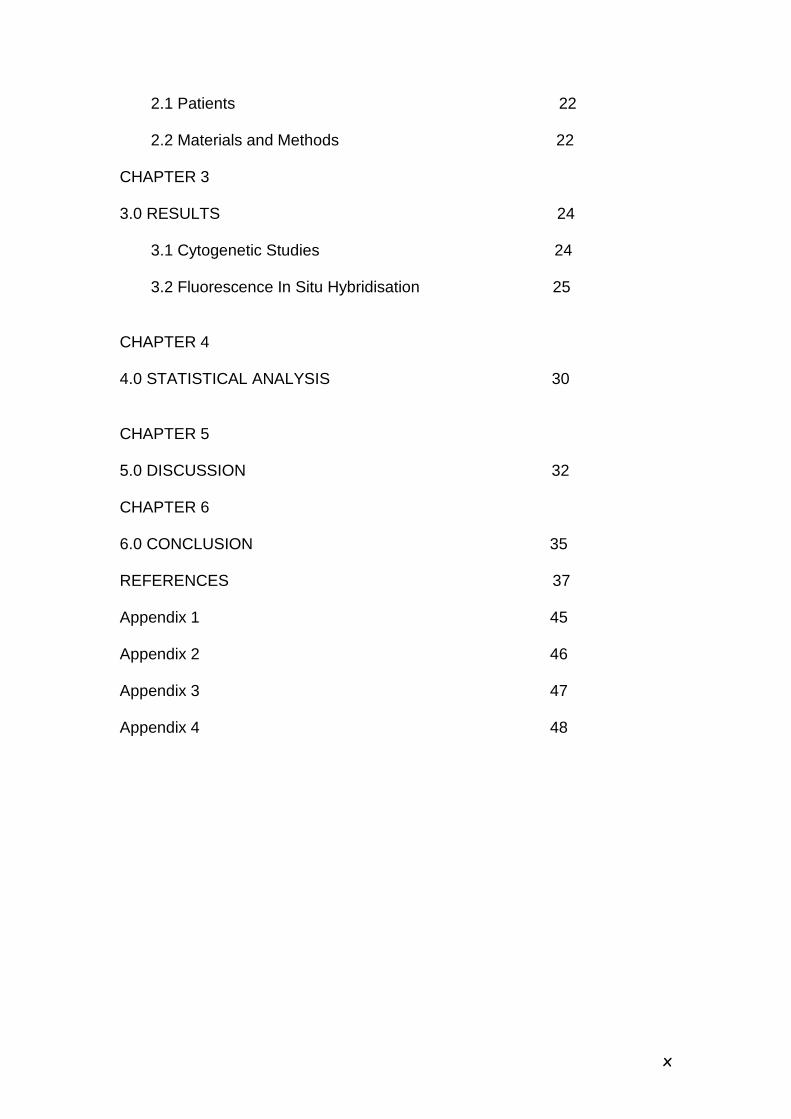
2.1 Patients 22 2.2 Materials and Methods 22 CHAPTER 3 3.0 RESULTS 24 3.1 Cytogenetic Studies 24 3.2 Fluorescence In Situ Hybridisation 25 CHAPTER 4 4.0 STATISTICAL ANALYSIS 30 CHAPTER 5 5.0 DISCUSSION 32 CHAPTER 6 6.0 CONCLUSION 35 REFERENCES 37 Appendix 1 45 Appendix 2 46 Appendix 3 47 Appendix 4 48
xi
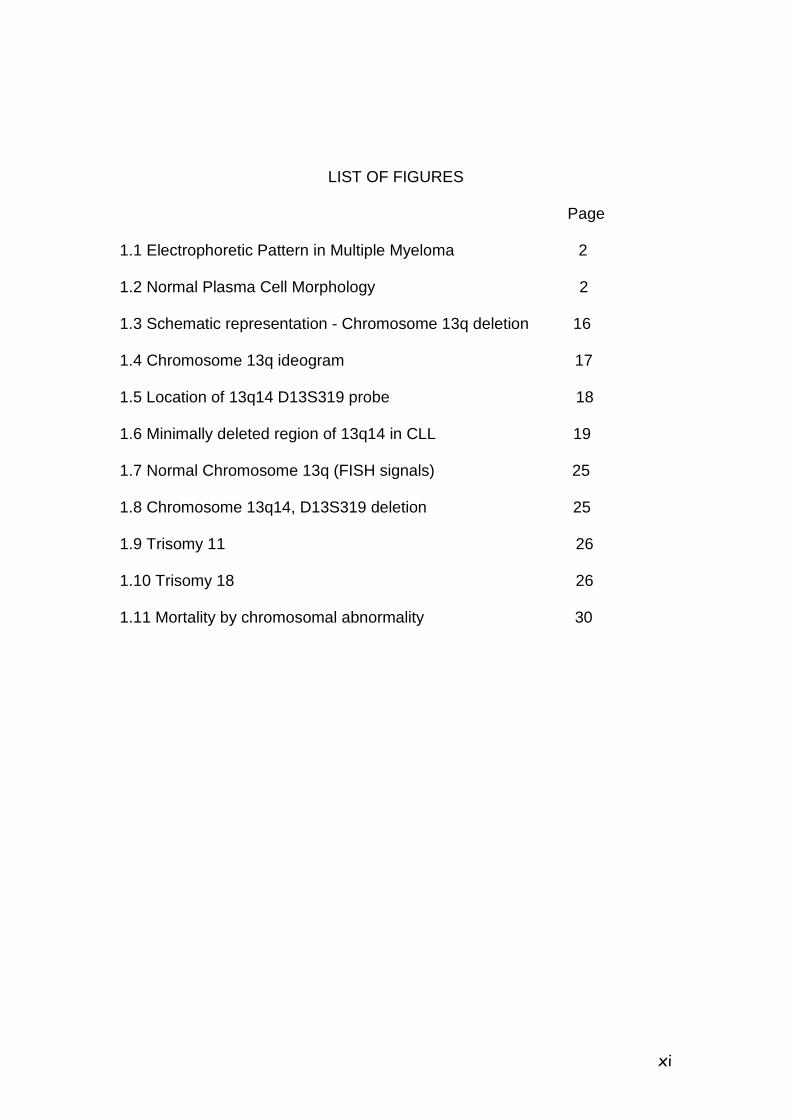
LIST OF FIGURES
Page
1.1 Electrophoretic Pattern in Multiple Myeloma 2
1.2 Normal Plasma Cell Morphology 2
1.3 Schematic representation - Chromosome 13q deletion 16 1.4 Chromosome 13q ideogram 17 1.5 Location of 13q14 D13S319 probe 18 1.6 Minimally deleted region of 13q14 in CLL 19 1.7 Normal Chromosome 13q (FISH signals) 25 1.8 Chromosome 13q14, D13S319 deletion 25 1.9 Trisomy 11 26 1.10 Trisomy 18 26 1.11 Mortality by chromosomal abnormality 30
xii
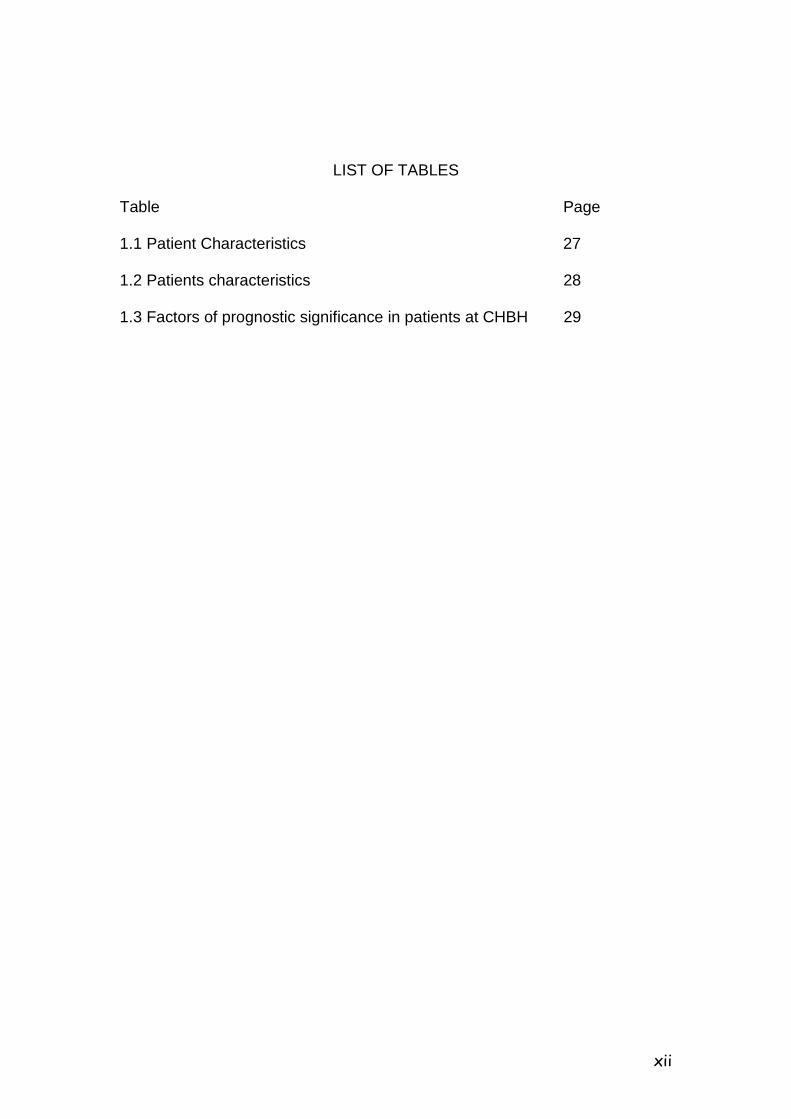
LIST OF TABLES
Table Page
1.1 Patient Characteristics 27
1.2 Patients characteristics 28
1.3 Factors of prognostic significance in patients at CHBH 29
xiii
LIST OF ABBREVIATIONS
BJP – Bence Jones Protein CRP - C–Reactive Protein CAS – Chronic Antigenic Stimulation CCT – Combination Chemotherapy CHBH – Chris-Hani Baragwanath Hospital DAPI – Diamino-2-phenylindole DDK1 – Dickkopf1 ESR – Erythrocyte Sedimentation Rate FGFR-3 – Fibroblast Growth Factor Receptor 3 FISH – Fluorescence In Situ Hybridisation HB/Hb – Haemoglobin HHV-8 – Human Herpes Virus 8 Ig - Immunoglobulin IGFB – Insulin-like Growth Factor Binding Protein ImiDs – Immunomodulatory drugs IL - Interleukin INF - Interferon KSHV – Kaposi Sarcoma Herpes Virus LDH – Lactate Dehydrogenase MGUS – Monoclonal Gammopathy of Undetermined Significance
MM – Multiple Myeloma
OS – Overall survival RB – Retinoblastoma

xiv
RPMI – Roswell Park Memorial Institute SCT – Stem Cell Transplantation sFRP – secreted Frizzled receptor like proteins TNF – Tumour Necrosis Factor WNT – Wingless type
1
CHAPTER 1 1.0 LITERATURE REVIEW 1.1 Introduction Multiple myeloma (MM) is a malignant proliferation of plasma cells, which are
terminally differentiated B lymphocytes. MM accounts for approximately 10 to
20% of all haematopoietic malignancies (Cigudosa et al, 1998). On average,
the incidence worldwide is reported as 3-4/100 000 of the population (Morgan,
1999; Muir et al, 1987; Alexanian, 1985; Pottern and Blattner, 1985). MM is
characteristically a disease of middle and old age. The incidence increases
with increasing age and reaches a peak during the seventh decade of life.
The median age at diagnosis is 65 years. Myeloma case series from Africa
have suggested a younger median age at diagnosis (approximately 5 - 10
years younger) than in the Western world, probably reflecting the younger age
structure of the African population (Patel et al, 1992; Mukiibi and Kyobe,
1988). There is a slight male predominance, and the disease occurs twice as
often in blacks as it does in caucasians (Muir et al, 1987; Alexanian, 1985;
Pottern and Blattner, 1985; Blattner et al, 1979).
The clinical presentation of MM is exemplified by bone pain (especially
backache), anaemia, recurrent infections, renal dysfunction, and
hypercalcaemia. Other features include pathological fractures, osteopenia,
vertebral compression fractures, spinal cord compression, hyperuricaemia,
plasmacytomas, abnormal bleeding tendency, hyperviscosity and amyloidosis
(Malpas, 1995; Patel, 1994; Kyle, 1990).
2
The diagnosis of MM is based on the WHO diagnostic Criteria/ International
Myeloma Working Group Criteria (see appendix 3 for details)
All three of the following criteria are required to establish a diagnosis.
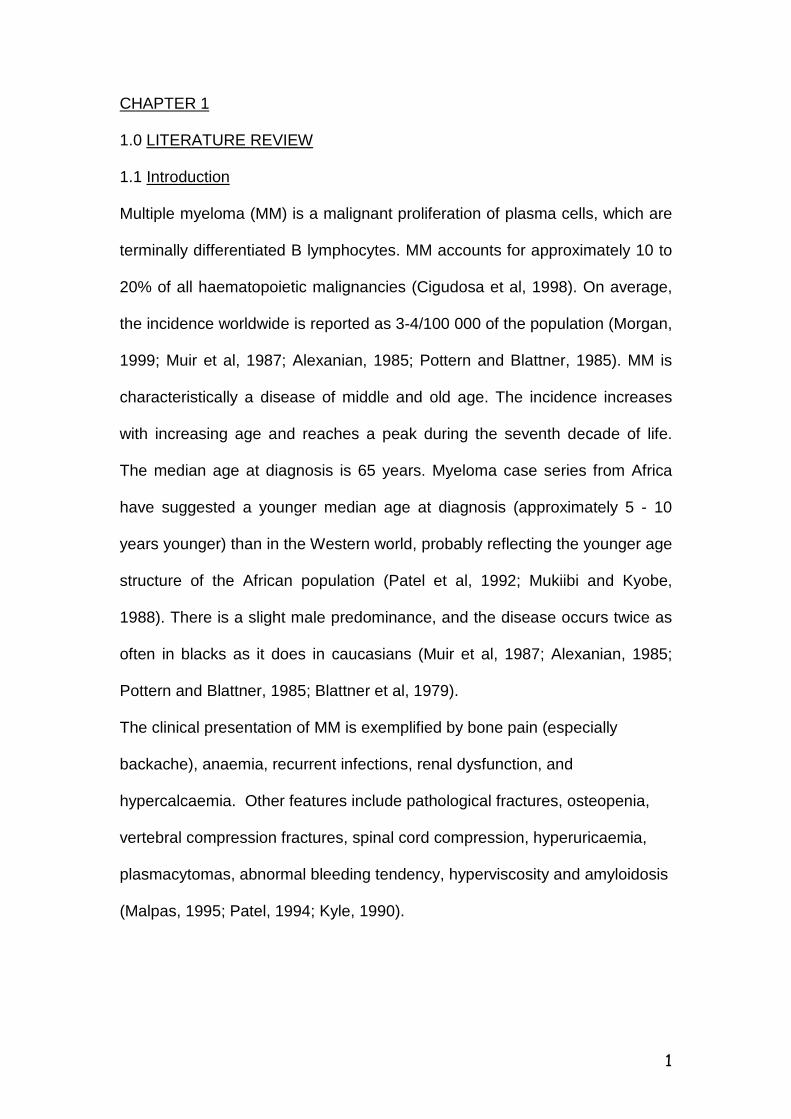
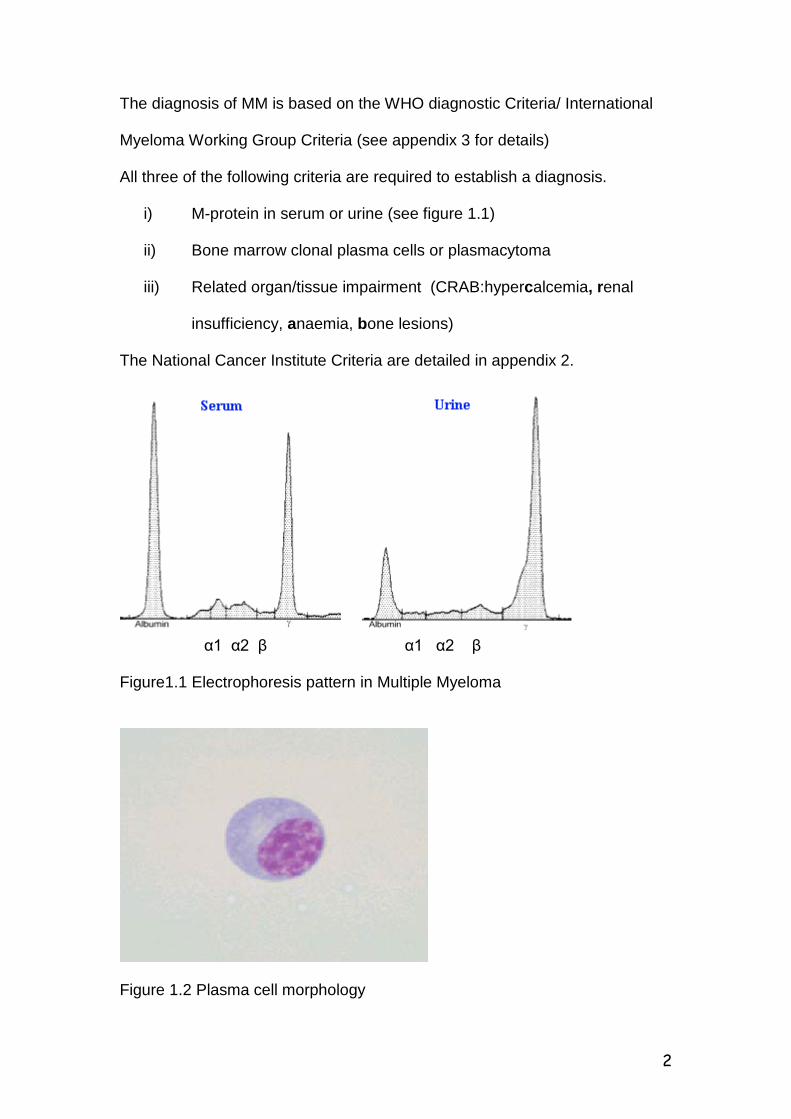
i) M-protein in serum or urine (see figure 1.1)
ii) Bone marrow clonal plasma cells or plasmacytoma
iii) Related organ/tissue impairment (CRAB:hypercalcemia, renal
insufficiency, anaemia, bone lesions)
The National Cancer Institute Criteria are detailed in appendix 2.
α1 α2 β α1 α2 β Figure1.1 Electrophoresis pattern in Multiple Myeloma
Figure 1.2 Plasma cell morphology
3
Once the diagnosis of MM is established, the disease is staged according to
the Durie and Salmon staging system (Durie and Salmon, 1975 - see
Appendix 1).
In addition to the above staging system, a number of other prognostic factors
have been developed. These prognostic factors are related to the tumour
burden or intrinsic malignancy. Examples of prognostic factors related to the
tumour burden include Beta-2 microglobulin, ‘M’ component, percentage of
bone marrow plasma cells, osteolytic lesions, haemoglobin and serum
calcium. Those that are related to the intrinsic malignancy include: plasma cell
labelling index, CRP, IL-6, albumin, genetic alterations/cytogenetic
abnormalities, plasma cell phenotype, thymidine kinase, lactic
dehydrogenase, immune dysregulation and neopterin (Boccadoro and Pileri,
1995).
The vast majority of patients (approximately 90%) require therapeutic
intervention once the diagnosis is established. In such patients therapy can
prolong and improve quality of life. The remaining 10% demonstrate an
indolent course, with slow progression of disease over many years.
Treatment may be broadly classified as supportive and/or specific. Supportive
care is an essential component of the disease. Supportive care is generally
directed at the anticipated complications of the disease. Analgesics,
allopurinol, increased fluid intake, antibiotics, erythropoietin, haematinics,
transfusion of blood and blood products, dialysis and plasmapheresis are
examples of supportive care used in the treatment of MM. Hypercalcaemia
responds well to hydration, natriuresis, mobilisation, glucocorticoids and
importantly to bisphosphonates. Bisphosphonates have pleotropic effects

4
including inhibition of osteoclastic bone resorption, reduction in bone pain and
possible anti-tumour activity (Aparicio et al, 1998; Berenson et al, 1998).
Most of the specific modalities of therapy used are not curative, except
possibly for allogeneic stem cell transplantation. This, together with innovative
therapies for MM (see p.5) represent a new treatment paradigm, targeting
tumour cells and their microenvironments to achieve greater tumour
cytoreduction and potentially a cure (Munshi, 2004).
The standard induction therapy for MM using a combination of oral Melphalan
and Prednisone (MP) achieves complete responses in only 5% of patients
and improves median survival to 36 months (Barlogie et al, 2004). In 1998,
the Myeloma Trialist’s Collaborative Group performed a meta-analysis of data
from 6633 patients from 27 randomised trials. They found higher response
rates with combination chemotherapy (CCT) than with MP (60% v 53.2%,
respectively; P <0.00001), but no significant differences in response duration
or overall survival (OS). With high dose melphalan-based autotransplants,
especially in a tandem transplant setting, complete response rates exceeding
50% have been reported. At ten years, in the absence of cytogenetic
abnormalities (especially abnormalities of chromosome 13, i.e. 13q deletion
and hypodiploidy), 25% of patients remain event-free and 40% are alive
(Shaughnessy et al, 2003). Although this represents a significant
improvement, the development of chemotherapy-resistant disease remains an
important therapeutic challenge.
Current research is focusing on attempts at overcoming resistance. New and
re-emerging approaches specifically target the mechanisms critical for MM
cell growth and survival in the bone marrow microenvironment. Some of
5
these novel therapeutic agents include thalidomide (Weber et al, 2003;
Yakoub-Agha et al, 2002) and its analogue immunomodulatory drugs (ImiDS)
e.g. Revlimid (Lenalidomide) (Richardson et al, 2002), the proteosome
inhibitor Bortezomib (Richardson et al, 2003) and arsenic trioxide (Munshi et
al, 2002), all of which have demonstrated clinical anti-MM activity even in
patients with refractory and relapsed disease. Ongoing studies will define the
exact role of these agents (i.e. as single agents/combination with other agents
such as dexamethasone and where in the course of disease they should be
introduced – at diagnosis; post-autotransplants etc.)
1.2 Pathophysiology
Immunoglobulin heavy chain (IgH) analysis reveals that the malignant plasma
cells arise from post-germinal centre B lymphocytes that have undergone
antigen selection, isotype switch recombination and somatic hypermutation of
their Ig (immunoglobulin) genes. The plasma cells then migrate to the bone
marrow where they proliferate (van Riet et al, 1998). Interactions with marrow
stromal cells facilitate homing and growth of myeloma cells. Stromal cells
produce interleukin 6 (IL-6) – an important growth and differentiating factor for
plasma cells.
The mechanism by which these cells undergo malignant transformation is not
clear. Hallek et al (1998), proposed a multi-step transformation process
starting with a normal plasma cell that progresses to Monoclonal
Gammopathy of Unknown Significance (MGUS), where the cells are
immortalised, but not transformed, and then to intra-medullary myeloma
6
where the cells have become malignant, and finally to extra-medullary
myeloma.
The malignant process may be initiated by an Ig gene translocation related to
the Ig recombination process, that results in ectopic expression (dysregulated
expression) of an oncogene such as cyclin D1, c-myc etc., caused by the
juxtaposition to strong regulatory sequences of the IgH locus and resulting in
immortalization of the malignant clone.
Dysregulated c-myc levels may be the first growth stimulatory signal in the
development of myeloma. C-myc, together with p53, counteracts pRB and
p107 mediated growth arrest signals and thus stimulates cell proliferation.
Additionally, the myeloma cells may be susceptible to cytokine-deprived or
growth factor-deprived apoptosis. There is early acquisition of chromosomal
instability, with frequent multiple trisomies present even in MGUS and
monosomy 13 in myeloma.
The second proliferative signal may be activation of the ras/MAPK (mitogen-
activated protein kinase) pathway, by secretion of IL-6 and related cytokines
from the bone marrow stromal cells in response to adhesion of myeloma cells.
Activation of the ras/MAP kinase pathway prevents c-myc induced apoptosis,
and results in up-regulation of bcl-2 and other anti-apoptotic factors that
prolong survival of myeloma cells. The ensuing constitutive ras activation
results in higher expression of bcl-2 and endogenous IL-6 secretion by
myeloma cells. The hypermutational process onto ras or a tumour suppressor
gene on chromosome 13, results in selection of a single clone for malignant
expansion. Activating ras mutations have been noted in 35-50% of MM
patients. Most of these involve both N- and K–ras.
7
Tumours with t(4;14)(p16.3;q32) can have activating mutations of ras or
fibroblast growth factor receptor 3 (FGFR3). Mutations of K but not N-ras have
been associated with shorter survival (Liu et al, 1996; Bezieau et al, 2001)
In the advanced stages of the disease, loss of p53 function occurs, leading to
genomic instability as evidenced by complex karyotypic abnormalities and
translocations.
Deletion 17p13 is detected in 5% of the patients at diagnosis and 20-40% in
advanced MM or plasma cell leukaemia (Mazars et al, 1992)
The secondary IgH translocation to a variety of loci occurs by mechanisms
unrelated to physiologic Ig recombination processes, that may reflect the
presence of a more general genomic instability. Further mutations, like p53,
lead to stroma-independent growth, and escape of myeloma cells from the
bone marrow micro-environment (Bergsagel et al, 1999; Hallek et al, 1998;
Feinman et al, 1997).
1.3 Aetiopathogenesis
The exact aetiology of MM is unknown. A number of factors have been
suggested as causative. Exposure to ionizing radiation and agriculture are the
most common (Patel, 2000; Demers et al, 1993; Shimizu, 1990; Cuzick and
De Stavola, 1988; Steineck and Wiklund, 1986; Pottern and Blattner, 1985;
Cuzick, 1981). One of the more convincing risk factors for myeloma has been
exposure to ionizing radiation. This has been documented in the studies of
survivors of the atomic bomb explosions in Hiroshima and Nagasaki, Japan,
in 1945 (Ichimaru et al, 1982). Radiation exposures include exposure to
ionizing radiation (atomic bomb; high dose) and occupation related radiation
8
such as nuclear workers and radiologists, and recipients of therapeutic and
diagnostic radiation. In contrast to individuals who were exposed to high dose
irradiation, the excess risk of myeloma in association with low dose radiation
exposure remains controversial. The target of ionising radiation is believed to
be the proto-oncogenes in DNA.
In the reports in which an association with farming has been suggested (see
references above), because of the wide variety of different exposures, it is not
possible to determine whether oncogenic zoonotic viruses, pesticides
(including herbicides and insecticides), agricultural chemicals or some
combination of exposures is responsible for the increased risk of myeloma.
Other associations or specific exposures that may increase myeloma risk
among farmers include dairy and sheep farming, exposure to cattle, poultry
and other farm animals, orchard farming, exposure to grain dust, aflatoxins,
paints and solvents, wood treatment, chemicals used for fencing, engine
exhaust from farm equipment, welding fumes and pollen (Pearce and Reif,
1990; Blair et al, 1985).
Exposure to benzene has also been implicated as an aetiological factor.
Recent data, however, appear to dispute this association (Bergsagel, et al,
1999).
Bergsagel et al (1999), in their review of benzene and myeloma concluded
that in contrast to the strong evidence linking high levels of benzene exposure
to an increased risk of developing acute myelogenous leukaemia, there is no
scientific evidence to support a causal association between exposure to
benzene or other petroleum products and the risk of developing MM.
9
Chronic antigenic stimulation (CAS) has been suggested to be a risk factor in
the development of myeloma. In addition, there is growing evidence that CAS
could facilitate the progression of the disease. This may occur via (IL-6)
interleukin-6. Overproduction of IL-6 occurs in a number of other diseases
such as rheumatoid arthritis, systemic lupus erythematosus, trauma, acute
infectious neural disease, cardiac myxoma and transplantation (Wolverkamp
and Marquet, 1990). It is plausible that these conditions could be regarded as
potential risk factors for the development of myeloma via IL-6 over production.
Another pathway by which CAS could be associated with myeloma is through
production of a monoclonal protein (M-protein), which may be transient or
chronic. Transient production occurs normally in response to trauma, drugs
and infections with specific antigens (Haas et al, 1990). Chronic production
can occur in response to rheumatoid arthritis, infections, malignancy,
neurological and dermatological diseases, chronic liver disease etc. (Passweg
et al, 1996; Blade and Kyle, 1995).
Cytokines play an important role in the pathogenesis of MM. Interactions with
marrow stromal cells facilitate homing and growth of myeloma cells. The most
commonly implicated cytokines are interleukin-1 beta (IL-1β), tumour necrosis
factor alpha (TNFα), IL-3, IL-6, IL-5, IL-10, IL-21, insulin-like growth factor I
(IGF-I), vascular endothelial growth factor (VEGF) and transforming growth
factor beta I (TGF-βI) (Chauhan et al, 1996; Urashima et al, 1996; Urashima
et al, 1995) .
IL-6 may act both as an autocrine and paracrine differentiating factor for
plasma cells.IL-6 is a potent stimulator of B-cell differentiation and is essential
for the survival and growth of myeloma cells (Klein et al, 1989; Kawano et al,
10
1988). Additionally, myeloma cells can stimulate stromal and bone cells to
produce large amounts of IL-6 (Carter et al, 1990). IL-6 in turn stimulates the
myeloma cells as well as cells in the bone marrow microenvironment to
produce osteoclast activating cytokines including tumour necrosis factor α and
IL-1β. These cytokines upregulate stromal cell secretion of receptor activator
of nuclear factor к B ligand (RANK-L), which stimulates osteoclast production.
Excess osteoclastic activity may manifest as lytic bone disease and
hypercalcaemia. Secretion of osteoprotegerin, the major inhibitor of RANK-L
is reduced (Croucher and Apperley, 1998). In addition Dickkopf-1 which is
thought to be produced by myeloma cells or stromal cells in association with
myeloma cells inhibits Wnt-signaling, which is important for osteoblast
differentiation. This results in inhibition of osteoblast activity in MM (Erming et
al, 2003). Other osteoblast inhibitors are also thought to play a role e.g
(IGFBP-4) insulin like growth factor binding protein-4, secreted frizzled
receptor-like proteins(sFRP-2/3) and IL-7 (Erming et al, 2003)
Recently, human herpesvirus-8/Kaposi sarcoma herpesvirus
(HHV-8/KSHV) has been implicated in the aetiopathogenesis of MM (Rettig et
al, 1997). Involvement of the virus in the development of myeloma was
suggested after detection of KSHV DNA sequences by polymerase chain
reaction (PCR) in the dendritic cells of 15/15 patients with MM and 2/8
patients with MGUS, but not from malignant cells or bone marrow dendritic
cells from normal individuals or patients with other malignancies (Rettig et al,
1997). The association was biologically plausible as KSHV was found to
encode an IL-6 homologue that was capable of stimulating growth and
preventing apoptosis of murine and human myeloma cell lines (Burger et al,
11
1998; Moore et al, 1996). However, following on the initial positive reports, a
number of authors have not been able to confirm this association and the role
of KSHV in MM remains controversial (Olsen et al, 1998; Tarte et al, 1998).
In a local study by Patel et al (2001), the positivity of KSHV DNA sequences
in MM adherent cell cultures was found to be 23.5%. This is similar to the
background sero-prevalence rate for KSHV in South Africa. Based on these
findings, there does not appear to be a clear association between MM and
KSHV in the local population.
1.4 Genetics of Multiple Myeloma The familial occurrence of MM is well recognized. The first documented report
was by Mandema and Wildervanck, in 1954. Since then, a number of authors
have reported its occurrence, mainly in siblings and first-degree relatives of
multiple myeloma patients (Herrinton et al, 1995).
The role of genetic factors in the pathogenesis of the disease is still uncertain,
but MM per se is not regarded as an inherited disorder.
Genetic factors may be used to explain the differences in incidence between
the different ethnic groups. Evidence for the role of genetic factors in the
pathogenesis of the disease is based on striking differences in the incidence
of monoclonal gammopathy and plasmacytomas in different inbred strains of
mice (Potter et al, 1975; Radl and Hollander, 1974); racial differences in the
incidence of MGUS (monoclonal gammopathy of undetermined significance)
and MM in humans (Riedl and Pottern, 1992); the association of an increased
risk of developing myeloma with certain human leucocyte antigens (HLA)
(Pottern et al, 1992); and the occurrence of familial MM.
12
A number of publications have suggested an association of HLA phenotypes
with MM. These involve class I (A, B and C), as well as class II (DR) antigens.
There is no consistent or specific MM HLA phenotype.
Miller (1974) found that in an analysis of HLA antigens in adults with various
forms of haematological malignancies, there was an increase in HLA-5 and
HLA-13 in patients with lymphoproliferative disorders, including multiple
myeloma, compared to normal controls. Earlier studies of MM patients
reported an association with the B locus, in particular HLA-B5; with a
significantly elevated risk of developing myeloma (Festen et al, 1976; Mason
and Cullen, 1975; Miller, 1974). A significantly higher frequency of HLA-B18
antigen has also been documented in myeloma (Smith et al, 1974; Bertrams
et al, 1972). An association with the C locus involving HLA-Cw5 and HLA-
Cw6 antigens has also been reported (Leech et al, 1983, Pottern, et al, 1992).
There is a paucity of data available regarding the involvement of the D locus
and MM. Muylle et al (1982), in their study of 28 patients, found no
association with HLA DR antigens.
Patel et al (2002), in their study of 62 South African black patients with MM,
showed a statistically significant association with HLA-B18 and not with any
other published (MM associated) HLA phenotype.
13
1.5 Chromosomal abnormalities in Multiple Myeloma Chromosomal (cytogenetic) abnormalities are well described in MM. Both
numerical and structural abnormalities have been reported (Maslovsky et al,
1999; Bataille and Harosseau, 1997; Dewald et al, 1985).
Detection of these abnormalities has been difficult in the past using
conventional cytogenetics, due to the lack of adequate analysable
metaphases, because of the low proliferation rate of plasma cells. The
technical difficulties with culturing and banding contributes to this problem
(Zhao et al, 2000). Other factors which compound the problem include the
variable pattern of bone marrow infiltration, the complexity of the numerical
and structural abnormalities described, and the absence of a common or
specific abnormality (Avet-Loiseau et al, 1999). Conventional cytogenetics
reveals abnormal karyotypes in only 40% of the patients at diagnosis and
63% of patients with advanced disease (Zojer et al, 2000; Fonseca et al,
1999; Maslovsky et al, 1999; Cigudosa et al, 1998).
Most of the abnormalities are reported in patients with advanced disease
(stage III), which might suggest an association of genetic abnormalities with
disease progression.
The chromosomal abnormalities that were detected and found to be recurrent
in MM include: abnormalities of chromosomes 1, 3, 5, 7, 9, 11, 15, 19, 21,
deletions of 13q and reciprocal translocations involving 14q32 (Avet-Loiseau
et al, 1999; Garcia-Sanz et al, 1999).
Less commonly, abnormalities of other chromosomes such as chromosome 8,
12, 16, 17 and 18 have been associated with myeloma (Fonseca et al, 1999;
Tricot et al, 1995; Dewald et al, 1985; Lewis and Mackenzie, 1984).

14
Deletions of 13q14 and rearrangements of 14q32 (mainly translocations)
have been described as the most frequently encountered chromosomal
abnormalities in association with multiple myeloma (Zojer et al, 2000;
Morgan, 1999; Cigudosa et al, 1998; Bergsagel et al, 1996).
Some chromosomal abnormalities have been associated with a poor
prognosis. These includes any translocation, e.g. t(4;14), t(14;16),
abnormalities involving 11q, deletions of 13q14 (Fonseca et al, 1999;
Cigudosa et al, 1998) and deletions of chromosome 17 (Fonseca et al, 1999).
Chromosomal abnormalities associated with a good prognosis and long-term
survival are trisomies of chromosomes 6, 9 and 7 (Perez-Simon et al,1998).
The rate of detection of cytogenetic abnormalities is higher with flow
cytometric and FISH (Fluorescence in situ hydridisation) analysis.
Abnormalities have been detected in the vast majority (80-90%) of patients
with myeloma using FISH, irrespective of the stage of the disease (Tabernero
et al, 1996; Drach et al, 1995; Barlogie et al, 1989).
Flow cytometric analysis of DNA content of myeloma cells in G0/1 phase has
revealed aneuploidy in 30-80% of the patients (Fonseca et al, 1999; Garcia-
Sanz et al, 1999; Barlogie et al, 1989). Based on the flow cytometry
aneuploidy data and the FISH analysis, conventional cytogenetics fails to
detect the majority of patients with chromosomal abnormalities.
Patients in relapse and progressive disease show a higher frequency (30-
60%) of chromosomal abnormalities compared to newly diagnosed patients
(Lai et al, 1995; Sawyer et al, 1994; Gould et al, 1988; Dewald et al, 1985).
This is in line with the multi-step theory of MM oncogenesis (Hallek et al,
1998).
15
1.5.1 Chromosome 13 in Multiple Myeloma
Deletion (partial or complete) of chromosome 13q has been shown to be the
most frequently encountered chromosomal loss in MM (see figure 1.3). It is
detected in 46% of the newly diagnosed and 73% of relapsed patients with
MM (Zojer et al, 2000). Shaughnessy et al (2000), reported 13q deletions in
86% of MM patients compared to normal donors. Chang et al (1999), reported
13q deletions in 30% of patients with normal karyotypes on conventional
cytogenetics. In a study by Avet-Loiseau et al (2002), monosomy 13 was
found to be the most common chromosome 13 abnormality, detected in 92%
of their patients. In a study comparing patients with MGUS that progressed to
MM and patients with de novo MM, deletion 13q has been reported in 70% of
patients with MGUS/MM compared to 40% of patients with de novo MM.
The prevalence of 13q deletion is reported to be 30-55% with interphase FISH
(Fonseca et al, 2002; Shaughenessy et al, 2000).
Chromosome 13q deletion appears to be a good candidate event in the
malignant transformation of myeloma plasma cells (Avet-Loiseau et al, 1999).
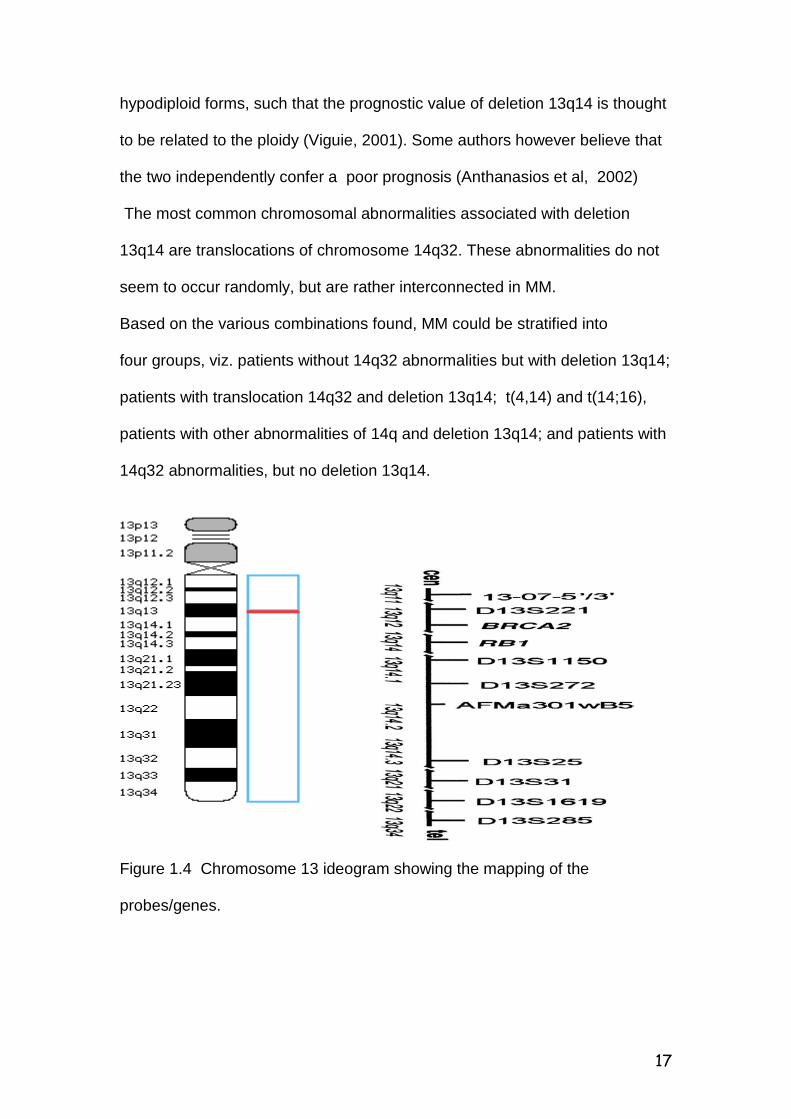
The minimal common region of deletion on 13 is thought to be in band
13q14.3, which spans the region containing the RB-1 gene, loci D13S319 and
D13S272 (see figure 1.6) (Viguie, 2001; Konigs et al, 2000).
The majority of these deletions are sub-microscopic and only detected during
interphase.
The possibility of a putative tumour suppressor gene cannot be excluded,
although the minimal deleted region is difficult to demonstrate. A candidate
16
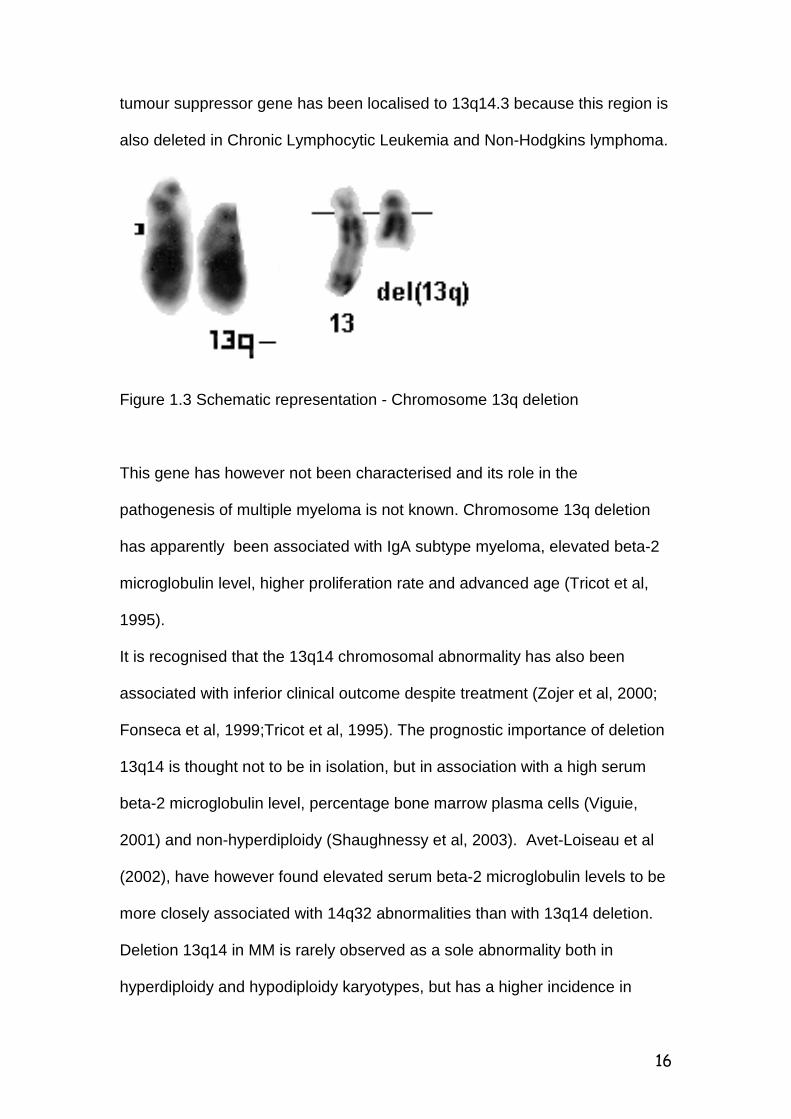
tumour suppressor gene has been localised to 13q14.3 because this region is
also deleted in Chronic Lymphocytic Leukemia and Non-Hodgkins lymphoma.
Figure 1.3 Schematic representation - Chromosome 13q deletion
This gene has however not been characterised and its role in the
pathogenesis of multiple myeloma is not known. Chromosome 13q deletion
has apparently been associated with IgA subtype myeloma, elevated beta-2
microglobulin level, higher proliferation rate and advanced age (Tricot et al,
1995).
It is recognised that the 13q14 chromosomal abnormality has also been
associated with inferior clinical outcome despite treatment (Zojer et al, 2000;
Fonseca et al, 1999;Tricot et al, 1995). The prognostic importance of deletion
13q14 is thought not to be in isolation, but in association with a high serum
beta-2 microglobulin level, percentage bone marrow plasma cells (Viguie,
2001) and non-hyperdiploidy (Shaughnessy et al, 2003). Avet-Loiseau et al
(2002), have however found elevated serum beta-2 microglobulin levels to be
more closely associated with 14q32 abnormalities than with 13q14 deletion.
Deletion 13q14 in MM is rarely observed as a sole abnormality both in
hyperdiploidy and hypodiploidy karyotypes, but has a higher incidence in
17
hypodiploid forms, such that the prognostic value of deletion 13q14 is thought
to be related to the ploidy (Viguie, 2001). Some authors however believe that
the two independently confer a poor prognosis (Anthanasios et al, 2002)
The most common chromosomal abnormalities associated with deletion
13q14 are translocations of chromosome 14q32. These abnormalities do not
seem to occur randomly, but are rather interconnected in MM.
Based on the various combinations found, MM could be stratified into
four groups, viz. patients without 14q32 abnormalities but with deletion 13q14;
patients with translocation 14q32 and deletion 13q14; t(4,14) and t(14;16),
patients with other abnormalities of 14q and deletion 13q14; and patients with
14q32 abnormalities, but no deletion 13q14.
Figure 1.4 Chromosome 13 ideogram showing the mapping of the
probes/genes.
18
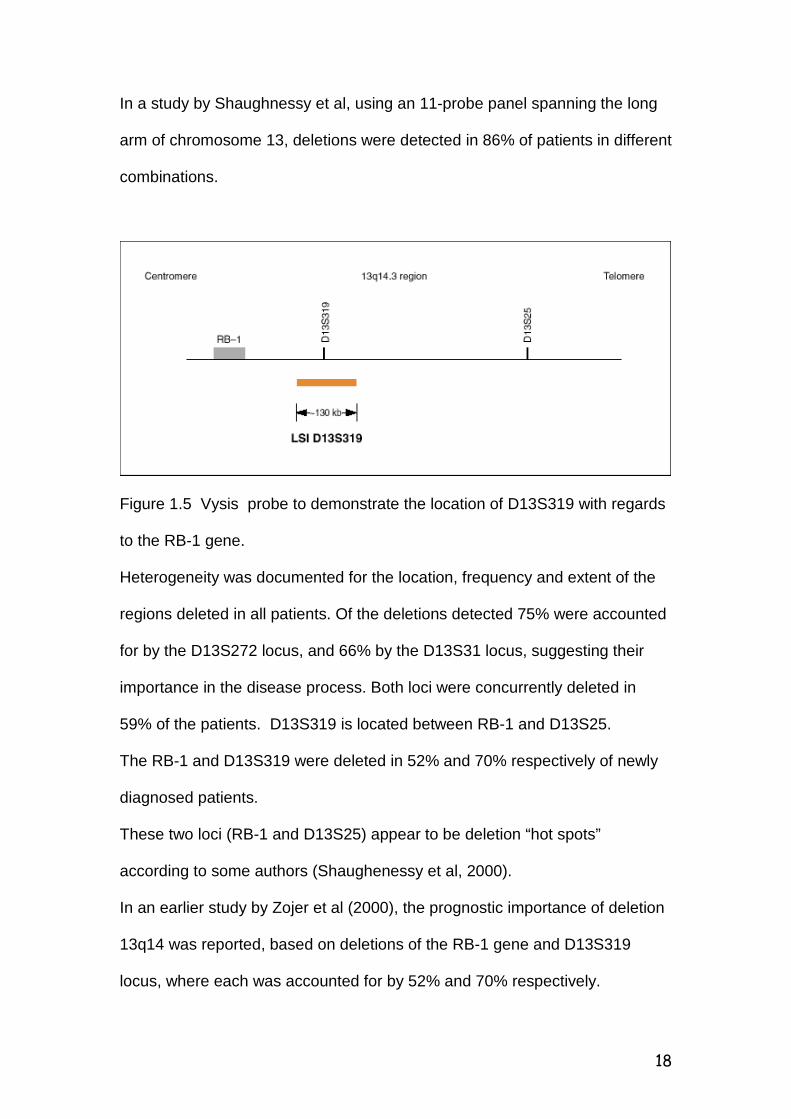
In a study by Shaughnessy et al, using an 11-probe panel spanning the long
arm of chromosome 13, deletions were detected in 86% of patients in different
combinations.
Figure 1.5 Vysis probe to demonstrate the location of D13S319 with regards
to the RB-1 gene.
Heterogeneity was documented for the location, frequency and extent of the
regions deleted in all patients. Of the deletions detected 75% were accounted
for by the D13S272 locus, and 66% by the D13S31 locus, suggesting their
importance in the disease process. Both loci were concurrently deleted in
59% of the patients. D13S319 is located between RB-1 and D13S25.
The RB-1 and D13S319 were deleted in 52% and 70% respectively of newly
diagnosed patients.
These two loci (RB-1 and D13S25) appear to be deletion “hot spots”
according to some authors (Shaughenessy et al, 2000).
In an earlier study by Zojer et al (2000), the prognostic importance of deletion
13q14 was reported, based on deletions of the RB-1 gene and D13S319
locus, where each was accounted for by 52% and 70% respectively.

19
This makes it difficult to determine whether the adverse prognostic
implications were as a result of the deletions in isolation, or in combination
with other loci being deleted.
Deletion of chromosome 13q14 implies both rapid disease recurrence and
initial drug resistance (Shaughnessy et al, 2000). In trying to determine the
biological implications of deletion 13q14 some groups have shown that
deletion 13q14 is frequently associated with lambda type light chain, higher
proliferation rate, lower serum monoclonal peak concentration, and increased
angiogenesis in some but not all patients (Fonseca et al, 2002, Moreau et al,
2002)
Figure 1.6 The minimally deleted region of 13q14 in CLL
(Adapted from Chang et al, 1999)
20
1.5.2 Chromosome 14q32 in Multiple Myeloma
Avet-Loiseau et al (1999), reported rearrangements involving the IgH gene at
14q32 in 60-75% of their patients. Nishida et al (1997), reported similar
rearrangements in 73% of their patients. Bergsagel and colleagues (1996),
have shown that translocations involving the breakpoint at 14q32 to be nearly
universal in MM. The rearrangements of 14q32 were found in all tumour cells,
which strongly implicated these rearrangements as early events preceding
clonal expansion. This translocation involves numerous partners. Those
described include chromosomes 11, 4, 8, 16 and 18 (Dewald and Jenkins,
1991; Gould et al, 1988; Dewald et al, 1985). Chromosome 11q13 and 4p16
have been found to be the main partners (Avet-Loiseau, et al 1999;
Bergsagel, et al, 1996). These translocations have not been found to form
fusion genes, but to cause juxtaposition of oncogenes with promoter regions
(Fonseca et al, 1999).
Abnormalities of 14q32 have also been associated with a poor prognosis.
It has been shown that t (11;14 ) in particular is associated with a grave
prognosis (Fonseca et al, 2002).
21
1.6 Aims and objectives of the study The aims and objectives of the study are:
1. To determine if the detection rate of chromosomal abnormalities
improves with FISH analysis compared to conventional cytogenetic studies.
2. To determine the proportion/percentage of patients with chromosome
13q14 deletion in the study population, and
3. To correlate the cytogenetic findings with known clinical and
laboratory features of prognostic significance in our study population.
22
CHAPTER 2 2.0 PATIENTS AND METHODS 2.1 Patients The study population consisted of adults with a confirmed diagnosis of MM.
The patients were diagnosed , being treated and followed up by the Clinical
Haematology Division, Department of Medicine, Chris-Hani Baragwanath
Hospital (CHBH). The study period was from January 1999 to July 2003.
Ethical clearance was obtained from the Committee for Research with Human
Subjects (Medical) of the University of the Witwatersrand - Reference Number
14/49.
During this period, all consecutive patients were considered for the study, but
only patients with bone marrow aspirate specimens that had adequate tumour
representation were selected for the study.
2.2 Materials and Methods
The study had both a prospective (13 patients) and a retrospective
(7 patients) arm. Bone marrow aspirate smears were retrieved from storage
for the retrospective arm. Two extra bone marrow aspirate smears were
prepared and 1-2mls was sent for conventional cytogenetic studies for all the
new patients. The sample cultures were collected in RPMI ( Roswell Park
Memorial Institute ) medium with fetal calf serum and antibiotics. Growth was
not stimulated as per standard operating procedure.
The pre-hybridisation technique had to be optimised for the older specimens,
for FISH preparation.
23
Some of the strategies employed were, overnight fixation, rehydration,
shortening of the diamino-2-phenylindole (DAPI) counterstaining time,
extended washing times and repeat hybridisation.
FISH analysis was performed using the LSI* D13S319 spectrum orange, DNA
probe specific for the D13S319 locus, purchased from S.A. Scientific Group
(Vysis), as the test probe, and a centromeric chromosome 11-alpha and 18-
alpha probes as controls. The method as per standard operating procedure
involved fixation, dehydration in ethanol series of varying concentration,
denaturation, followed by overnight hybridisation in a humidified chamber at
37° Celcius. This was followed by a washing step and Deamino-2-
phenylindole (DAPI) counter-staining.
Analysis was carried out using the BX 61 Olympus Flourescence Microscope
with computer software for capturing the pictures.
Hybridisation signals were enumerated in 50 to 100 cells. Results were
analysed independently by two individuals. The cut off for the number of
positive cells was set at five (i.e if signals were detected in less than five cells
then the test was regarded as having been unsuccessful, only cases with
signals in five or more cells were reported).
24
CHAPTER 3
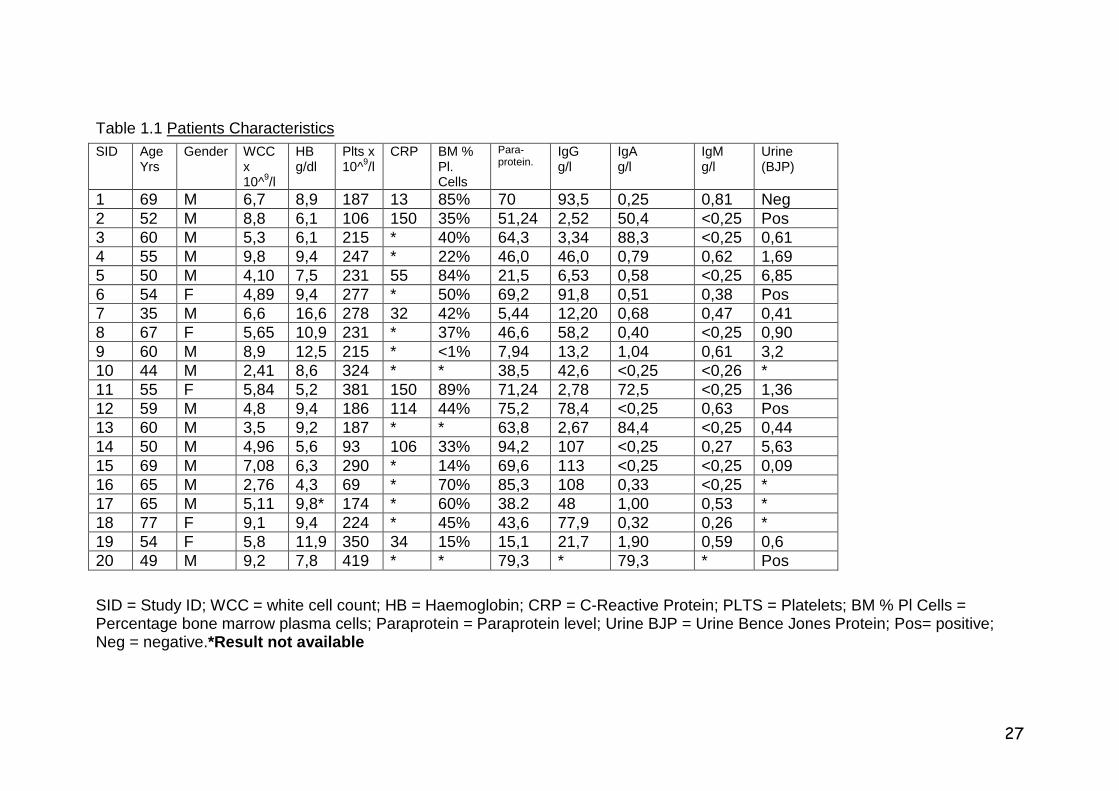
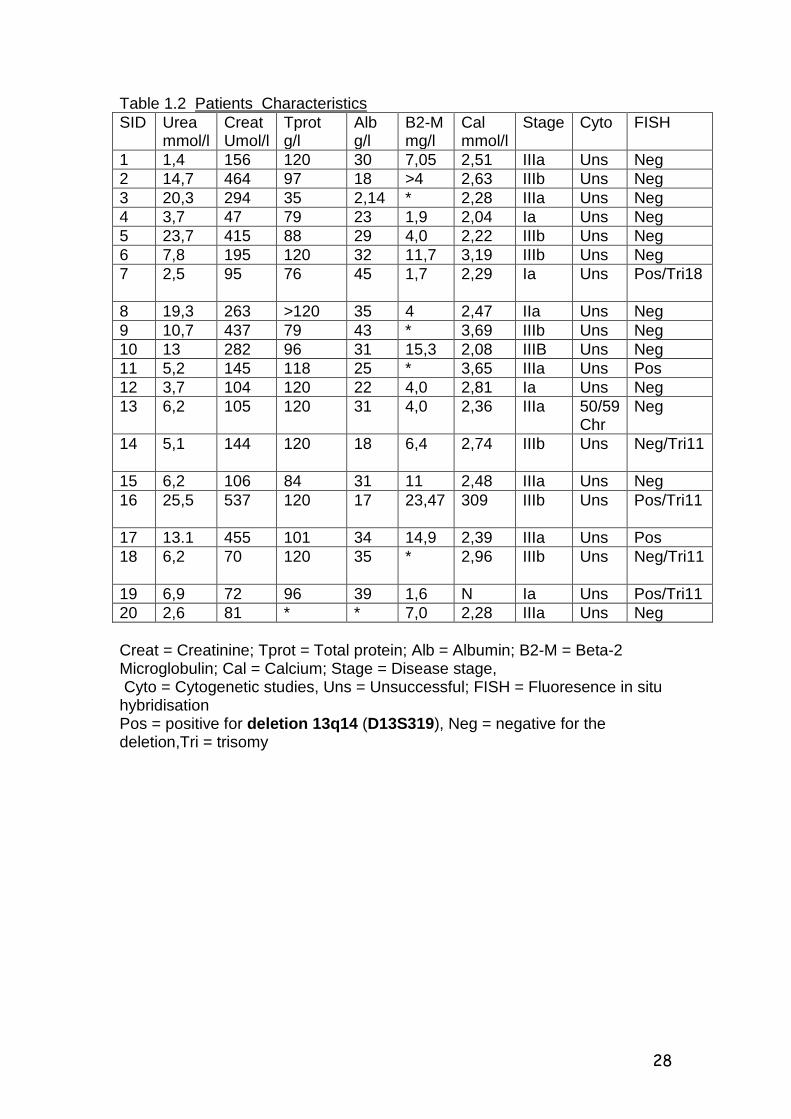
3.0 RESULTS The initial sample size was thirty patients. The number was reduced due to problems encountered with old bone marrow specimens, where hybridisation failed and signal detection was not possible even after optimisation of the technique. Finally, results of twenty of the total number of patients attempted were evaluated. The characteristics and results of the patients in whom conventional cytogenetics was attempted and FISH was successful are depicted in tables1.1 and 1.2. There were 15 males and 5 females with a male to female ratio of 3:1. The age ranged from 35 to 77 years with an average of 58 years. Based on the Durie and Salmon staging, four patients presented with stage I, one with stage II and fifteen with stage III disease. The dominant isotype was IgG (70% ) followed by IgA (25%) and 5% light chain disease. 3.1 Cytogenetic studies Cytogenetic studies were performed on all of the patients in the prospective
arm of the study. Success was however limited due to unavailability of
metaphases in most patients. The main problem appears to have been failure
to achieve growth, irrespective of whether the specimens were fresh or had
adequate tumour representation. A successful result was obtained in 1/20
(5%) of the patients studied. The abnormality detected was hyperdiploidy (50-
59 chromosomes).
25
3.2 Flourescence In Situ Hybridisation (FISH) With regard to FISH analysis five of the twenty (5/20) patients (25%) were found to be positive for deletion 13q14, locus D13S319. This result is lower than that reported in other studies (Zojer et al, 2000; Chang et al, 1999; Perez-Simon et al, 1998).
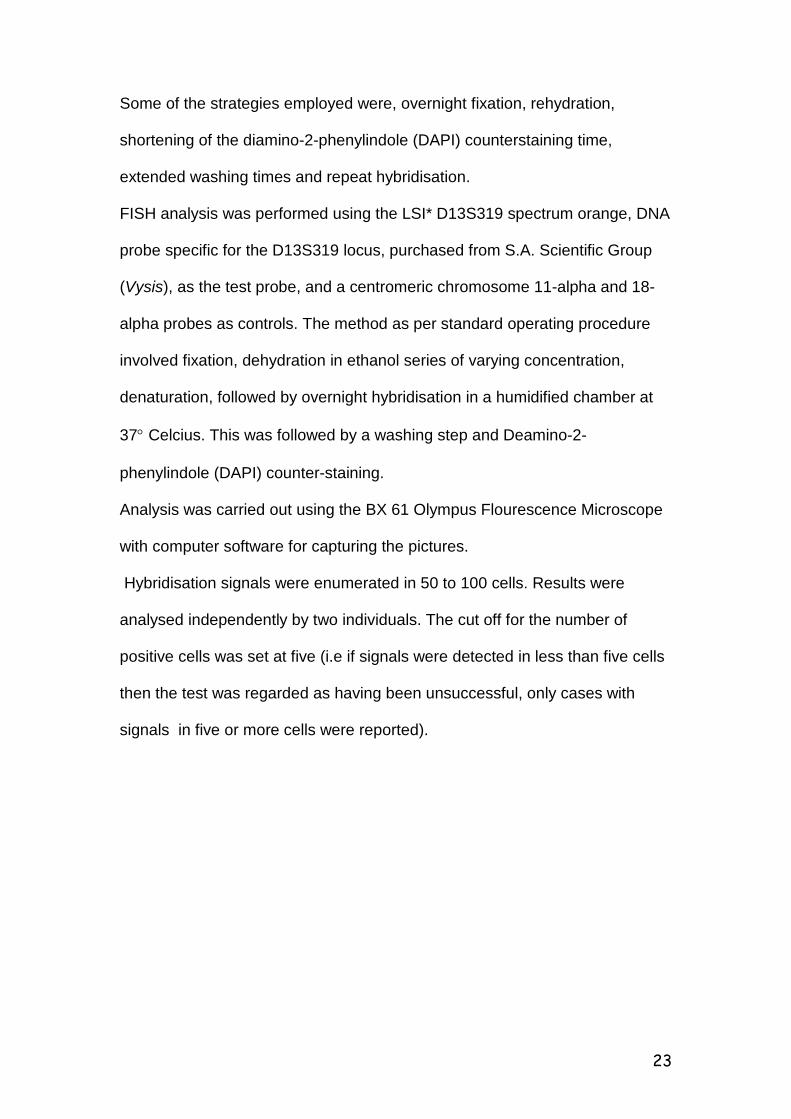
Figure 1.7 Interphase cell showing normal signals for chromosome 13q probe, two red 13q and two green signals for the control probe.
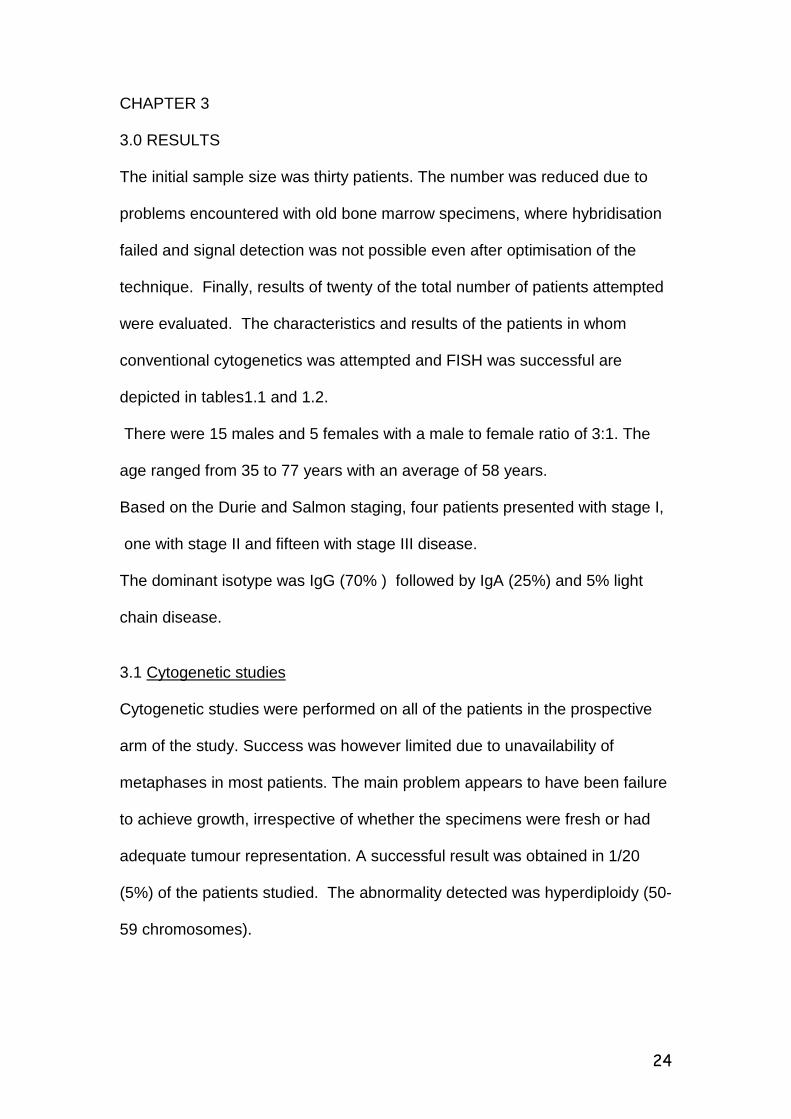
Figure 1.8 Interphase cell showing deletion of chromosome 13q14 (D13S319) with only one red signal. The two green signals represent the control probe.
26
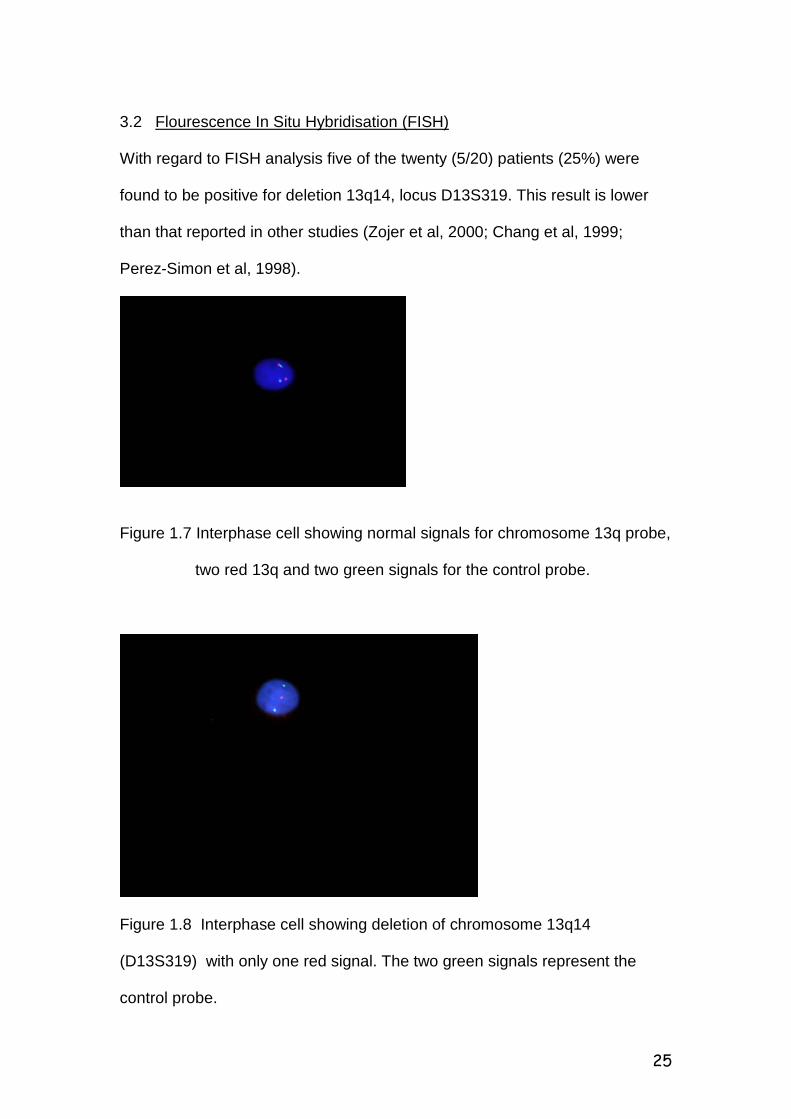
Figure 1.9 The three green signals, demonstrate Trisomy of chromosome 11, which was used as a control probe.
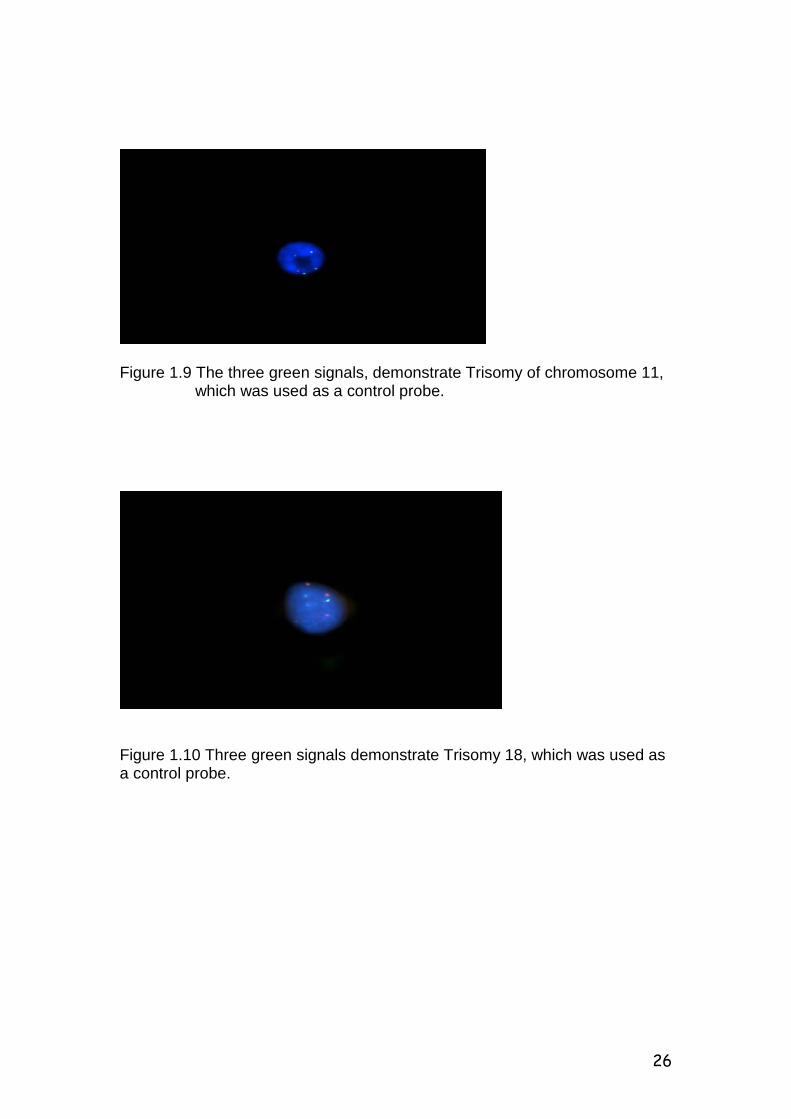
Figure 1.10 Three green signals demonstrate Trisomy 18, which was used as a control probe.
27
Table 1.1 Patients Characteristics
SID = Study ID; WCC = white cell count; HB = Haemoglobin; CRP = C-Reactive Protein; PLTS = Platelets; BM % Pl Cells = Percentage bone marrow plasma cells; Paraprotein = Paraprotein level; Urine BJP = Urine Bence Jones Protein; Pos= positive; Neg = negative.*Result not available
SID Age Yrs
Gender WCCx 10^9/l
HB g/dl
Plts x 10^9/l
CRP BM % Pl. Cells
Para- protein. IgG
g/l IgA g/l
IgM g/l
Urine (BJP)
1 69 M 6,7 8,9 187 13 85% 70 93,5 0,25 0,81 Neg 2 52 M 8,8 6,1 106 150 35% 51,24 2,52 50,4 <0,25 Pos 3 60 M 5,3 6,1 215 * 40% 64,3 3,34 88,3 <0,25 0,61 4 55 M 9,8 9,4 247 * 22% 46,0 46,0 0,79 0,62 1,69 5 50 M 4,10 7,5 231 55 84% 21,5 6,53 0,58 <0,25 6,85 6 54 F 4,89 9,4 277 * 50% 69,2 91,8 0,51 0,38 Pos 7 35 M 6,6 16,6 278 32 42% 5,44 12,20 0,68 0,47 0,41 8 67 F 5,65 10,9 231 * 37% 46,6 58,2 0,40 <0,25 0,90 9 60 M 8,9 12,5 215 * <1% 7,94 13,2 1,04 0,61 3,2 10 44 M 2,41 8,6 324 * * 38,5 42,6 <0,25 <0,26 * 11 55 F 5,84 5,2 381 150 89% 71,24 2,78 72,5 <0,25 1,36 12 59 M 4,8 9,4 186 114 44% 75,2 78,4 <0,25 0,63 Pos 13 60 M 3,5 9,2 187 * * 63,8 2,67 84,4 <0,25 0,44 14 50 M 4,96 5,6 93 106 33% 94,2 107 <0,25 0,27 5,63 15 69 M 7,08 6,3 290 * 14% 69,6 113 <0,25 <0,25 0,09 16 65 M 2,76 4,3 69 * 70% 85,3 108 0,33 <0,25 * 17 65 M 5,11 9,8* 174 * 60% 38.2 48 1,00 0,53 * 18 77 F 9,1 9,4 224 * 45% 43,6 77,9 0,32 0,26 * 19 54 F 5,8 11,9 350 34 15% 15,1 21,7 1,90 0,59 0,6 20 49 M 9,2 7,8 419 * * 79,3 * 79,3 * Pos
28
Table 1.2 Patients Characteristics SID Urea
mmol/l Creat Umol/l
Tprot g/l
Alb g/l
B2-M mg/l
Cal mmol/l
Stage Cyto FISH
1 1,4 156 120 30 7,05 2,51 IIIa Uns Neg 2 14,7 464 97 18 >4 2,63 IIIb Uns Neg 3 20,3 294 35 2,14 * 2,28 IIIa Uns Neg 4 3,7 47 79 23 1,9 2,04 Ia Uns Neg 5 23,7 415 88 29 4,0 2,22 IIIb Uns Neg 6 7,8 195 120 32 11,7 3,19 IIIb Uns Neg 7 2,5 95 76 45 1,7 2,29 Ia Uns Pos/Tri18
8 19,3 263 >120 35 4 2,47 IIa Uns Neg 9 10,7 437 79 43 * 3,69 IIIb Uns Neg 10 13 282 96 31 15,3 2,08 IIIB Uns Neg 11 5,2 145 118 25 * 3,65 IIIa Uns Pos 12 3,7 104 120 22 4,0 2,81 Ia Uns Neg 13 6,2 105 120 31 4,0 2,36 IIIa 50/59
Chr Neg
14 5,1 144 120 18 6,4 2,74 IIIb Uns Neg/Tri11
15 6,2 106 84 31 11 2,48 IIIa Uns Neg 16 25,5 537 120 17 23,47 309 IIIb Uns Pos/Tri11
17 13.1 455 101 34 14,9 2,39 IIIa Uns Pos 18 6,2 70 120 35 * 2,96 IIIb Uns Neg/Tri11
19 6,9 72 96 39 1,6 N Ia Uns Pos/Tri11 20 2,6 81 * * 7,0 2,28 IIIa Uns Neg Creat = Creatinine; Tprot = Total protein; Alb = Albumin; B2-M = Beta-2 Microglobulin; Cal = Calcium; Stage = Disease stage, Cyto = Cytogenetic studies, Uns = Unsuccessful; FISH = Fluoresence in situ hybridisation Pos = positive for deletion 13q14 (D13S319), Neg = negative for the deletion,Tri = trisomy
29
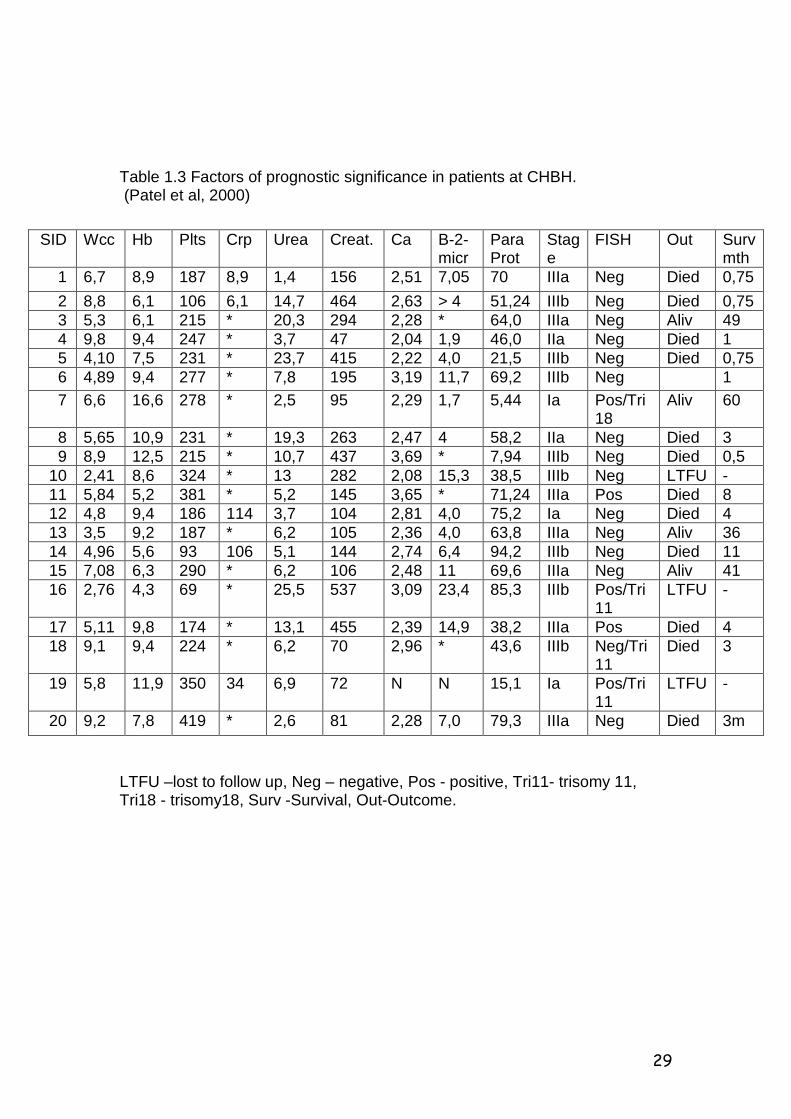
Table 1.3 Factors of prognostic significance in patients at CHBH. (Patel et al, 2000)
LTFU –lost to follow up, Neg – negative, Pos - positive, Tri11- trisomy 11, Tri18 - trisomy18, Surv -Survival, Out-Outcome.
SID Wcc Hb Plts Crp Urea Creat. Ca B-2-micr
Para Prot
Stage
FISH Out Surv mth
1 6,7 8,9 187 8,9 1,4 156 2,51 7,05 70 IIIa Neg Died 0,75 2 8,8 6,1 106 6,1 14,7 464 2,63 > 4 51,24 IIIb Neg Died 0,75 3 5,3 6,1 215 * 20,3 294 2,28 * 64,0 IIIa Neg Aliv 49 4 9,8 9,4 247 * 3,7 47 2,04 1,9 46,0 IIa Neg Died 1 5 4,10 7,5 231 * 23,7 415 2,22 4,0 21,5 IIIb Neg Died 0,75 6 4,89 9,4 277 * 7,8 195 3,19 11,7 69,2 IIIb Neg 1 7 6,6 16,6 278 * 2,5 95 2,29 1,7 5,44 Ia Pos/Tri
18 Aliv 60
8 5,65 10,9 231 * 19,3 263 2,47 4 58,2 IIa Neg Died 3 9 8,9 12,5 215 * 10,7 437 3,69 * 7,94 IIIb Neg Died 0,5 10 2,41 8,6 324 * 13 282 2,08 15,3 38,5 IIIb Neg LTFU - 11 5,84 5,2 381 * 5,2 145 3,65 * 71,24 IIIa Pos Died 8 12 4,8 9,4 186 114 3,7 104 2,81 4,0 75,2 Ia Neg Died 4 13 3,5 9,2 187 * 6,2 105 2,36 4,0 63,8 IIIa Neg Aliv 36 14 4,96 5,6 93 106 5,1 144 2,74 6,4 94,2 IIIb Neg Died 11 15 7,08 6,3 290 * 6,2 106 2,48 11 69,6 IIIa Neg Aliv 41 16 2,76 4,3 69 * 25,5 537 3,09 23,4 85,3 IIIb Pos/Tri
11 LTFU -
17 5,11 9,8 174 * 13,1 455 2,39 14,9 38,2 IIIa Pos Died 4 18 9,1 9,4 224 * 6,2 70 2,96 * 43,6 IIIb Neg/Tri
11 Died 3
19 5,8 11,9 350 34 6,9 72 N N 15,1 Ia Pos/Tri11
LTFU -
20 9,2 7,8 419 * 2,6 81 2,28 7,0 79,3 IIIa Neg Died 3m
30
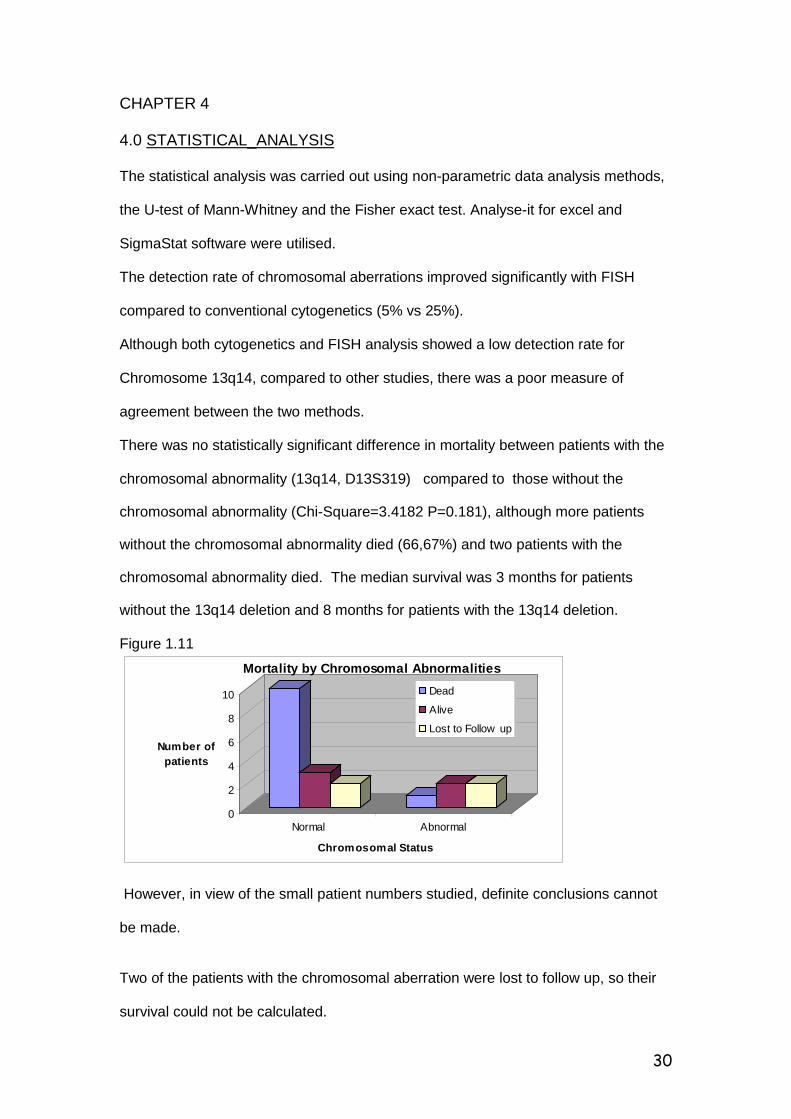
CHAPTER 4 4.0 STATISTICAL_ANALYSIS The statistical analysis was carried out using non-parametric data analysis methods, the U-test of Mann-Whitney and the Fisher exact test. Analyse-it for excel and SigmaStat software were utilised. The detection rate of chromosomal aberrations improved significantly with FISH compared to conventional cytogenetics (5% vs 25%). Although both cytogenetics and FISH analysis showed a low detection rate for Chromosome 13q14, compared to other studies, there was a poor measure of agreement between the two methods. There was no statistically significant difference in mortality between patients with the chromosomal abnormality (13q14, D13S319) compared to those without the
chromosomal abnormality (Chi-Square=3.4182 P=0.181), although more patients
without the chromosomal abnormality died (66,67%) and two patients with the
chromosomal abnormality died. The median survival was 3 months for patients
without the 13q14 deletion and 8 months for patients with the 13q14 deletion. Figure 1.11
0
2
4
6
8
10
Number of patients
Normal Abnormal
Chromosomal Status
Mortality by Chromosomal AbnormalitiesDead
Alive
Lost to Follow up
However, in view of the small patient numbers studied, definite conclusions cannot be made. Two of the patients with the chromosomal aberration were lost to follow up, so their survival could not be calculated.
31
Of the patients where survival could be calculated, two with the chromosomal abnormality had a survival period similar to that of patients without the chromosomal aberration and one patient with the chromosomal aberration and trisomy 18 had prolonged survival (60 months). Of note is that he presented at a young age (35 years), with early disease (stage-Ia). He also had other favourable prognostic features (i.e Hb = 16.6g/dl; Beta-2 microglobulin = 1.4; Calcium = 2.29 and normal renal function). No correlation was found between the stage of the disease and the presence of the chromosomal abnormality (13q14, D13S319) . The majority of the patients without the chromosomal abnormality presented with advanced stage disease. Late presentations with advanced stage disease is not unusual in our patient population. This could explain the high mortality rate in these patients. A positive correlation was found between disease stage and mortality, in that most patients with stage III died compared to patients in stage I and II. Comparison of laboratory results to disease stage showed statistically significant differences for Creatinine, Beta -2 microglobulin and Haemoglobin level. Patients with disease stage III showed a higher creatinine and Beta-2 microglobulin level and lower haemoglobin levels compared to patients with early stage disease (I and II).
32
CHAPTER 5 5.0 DISCUSSION The detection of chromosomal abnormalities in MM has always been a problem, because of the low proliferation rate of the plasma cells. This has however improved significantly with the introduction of the FISH technique, since this does not require metaphases for analysis. We also found that the detection rate of chromosomal abnormalities improved significantly in our patients with FISH analysis. This was attributed to the difficulty to achieve growth and thus failure to obtain analysable metaphases from the cell cultures. Chromosome 13q14: Deletion 13q14, D13S319 was detected in five of the twenty (5/20) patients compared to only one patient where hyperdiploidy (50-59 chromosomes) was detected with cytogenetics studies. This patient did not have a positive FISH result for 13q14,D13S319. The frequency of 25% of 13q14 deletion in our patients is much lower than that reported by other groups in the literature (i.e 30 to 70%), despite the fact that the majority of the patients presented with advanced stage disease. The reasons for the low detection rate of this abnormality in our patients are not entirely clear, but the possibilities include:
- A low prevalence of this abnormality in our patient population.
- The presence of other chromosomal abnormalities e.g chromosomes 14 and chromosome 17 abnormalities which are also known to occur in MM and confer a poor prognosis but were not assessed in this study.
33
- The different types of probes used by the different study groups. We used a probe specific for D13S319, whereas most of the other studies used probes extending from the RB-1 gene covering a wider region of the chromosome. Chang et al (1999), used a similar probe but reported a slightly higher frequency (30%). - The variation in the frequency and location of deletions of 13q14 is well documented (J. Shaughnessy et al, 2000). The absence of deletion D13S319 does not exclude other deletions of 13q14. Ideally the whole extent of 13q should be studied in detail to determine the minimum deleted region in MM. - Technical reasons have to be considered as well. These include:
i) Very poor yield on conventional cytogenetics ii) Inadequate tumour representation in the bone marrow samples.
iii) Failure of hybridisation because of the aged/ dehydrated specimens, and
iv) Non-specific representation of the plasma cells due to lack of purification/sorting of the tumour cells.
Chromosome 11: Abnormalities of chromosome 11 are said to be common in MM. Four (20%) of our patients showed trisomy of chromosome11. Two of those also had deletion 13q14 (D13S319). The three patients with trisomy 11 who presented with disease stage III died , and one was lost to follow-up. The specific role of chromosome 11 abnormalities in the pathogenesis of MM is not known. The t (11; 14) has however been associated with a poor prognosis in MM.
34
Chromosome 18: Abnormalities of chromosome 18 have also been described in MM, including trisomy 18. Trisomy 18 has been found to occur in up to 10% of patients with MM, but apparently not been found to be of prognostic significance. In this study one patient with deletion 13q14 (D13S319) was found to be positive for trisomy of chromosome 18. The significance of this finding is not certain. Generally trisomies are common in MM corresponding to the hyperdiploidy status of these cells, and chromosomal gains are apparently generally associated with poor prognosis ( Fonseca et al, 1999)
35
CHAPTER 6 6.0 CONCLUSION The occurance of chromosomal abnormalities is well documented in MM. These may involve a number of chromosomes, and may manifest as deletions, trisomies, monosomies or translocations. These include more importantly abnormalities of chromosomes 11,14,13,17,16. Some chromosomal abnormalities have been found to have prognostic significance. Deletions of chromosome 13 have specifically been associated with a poor prognosis, despite conventional chemotherapy. It is however not known whether the poor prognosis is as a result of the deletion in isolation, or in association with abnormalities of chromosome 14q32 with the various partners and the hypodiploidy which frequently co-exists. In this study we also set out to determine whether there was any correlation between the presence of deletion 13q14, D13S319 and other known prognostic factors in our patients. The prevalence of 13q14 deletion in our patients was lower than that reported in the literature (25% vs 30-80%). There was no correlation found between the presence of deletion 13q14 and mortality, stage of disease and known laboratory parameters associated with poor prognosis in MM. The prognostic significance of deletion 13q14(D13S319) in MM could not be established from this study. The limitations of this study includes the small sample size, the unavailability of a built-in control for the specific probe, which necessitated the use of
36
additional centromeric probes as external controls, which showed abnormalities. The FISH technique also required optimisation for old specimens. This was ultimately achieved, though in a limited number of patients. The use of fresh specimens and sorting of the tumour cells is recommended to improve yield and quality of results. A probe with a built-in control would be preferable. A further prospective study with a larger patient sample using probes covering the whole extent of chromosome 13q may yield more conclusive results. The use of alternative techniques such as analysis of gene expression profiles/signatures to further investigate genes that might be responsible for the poor prognosis in MM should also be considered. Numerous groups have shown that classification on the basis of gene expression signatures is plausible , with the possibility of making definitive diagnosis upfront, monitoring disease evolution and predicting prognosis.
37
REFERENCES Alexanian R. Diagnosis and management of multiple myeloma.In: Neoplastic Diseases of the Blood. Eds. P H Wiernik, GP Canellos, RA Kyle and CA Schiffer. (1st Ed.) Churchill Livingstone, New York, 1985, p.529-52. Anthanasios B, Fassas T, Spencer T et al. Both hypodiploidy nad deletion of chromrosome 13 independently confer poor prognosis in multiple myeloma. British Journal of Haematology,Vol.118,issue 4 ,Page 1041, September 2002. Aparicio A, Gardner A, Tu Y et al. In vitro cytoreductive effects on multiple myeloma cells induced by bisphosphonates. Leukemia 12, 220-9, 1998. Avet-Loiseau H, Facon T and Grosbois B. et al. Oncogenesis of multiple myeloma: 14q32 and 13q14 chromosome abnormalities are not randomly distributed, but correlate with natural history, immunological features and clinical presentation. Blood 99 (6), 2185-91, 2002. Avet-Loiseau H, Li JY, Morineau N. et al. Monosomy 13 is associated with the transition from monoclonal gammopathy of undetermined significance to multiple myeloma. Blood 94 (8), 2583-89, 1999. Barlogie B, Shaughnessy J, Tricot G. et al. Treatment of multiple myeloma. Blood 103, 20-32, 2004. Barlogie B, Epstein J, Selvanayagam P. et al. Plasma cell myeloma, New biological insights and advances in therapy. Blood 73, 865-79, 1989. Bataille R and Harousseau JL. Multiple Myeloma. NEJM 23, 1655-64, 1997. Berenson JR, Lichtenstein A, Porter L. et al. Long-term pamidronate treatment of advanced multiple myeloma patients reduces skeletal events. J Clin Oncol 16, 583-602, 1998. Bergsagel D E, Wong O, Bergsagel PL. et al. Benzene and Multiple Myeloma. Appraisal of the Scientific Evidence. Blood 94, 1174-82, 1999. Bergsagel P L, Chesi M and Kuehl W M. Myeloma – a multistep transformation process. Abstract. VIIth International Multiple Myeloma Workshop, Sweden, 1999. Bergsagel P L, Chesi M, Nardini E. et al. Promiscuous translocations into immunoglobulin heavy chain switch region in multiple myeloma. Proc Natl Acad Sci USA 93, 13931, 1996.

38
Bertrams J, Kuwert E, Bohme U. et al. HLA antigens in Hodgkin’s disease and multiple myeloma – increased frequency of W18 in both diseases. Tissue Antigens 2, 41, 1972. Blade J and Kyle RA. Monoclonal gammopathies of undetermined significance. In: Myeloma: Biology and Management. Eds. JS Malpas, DE Bergsagel and RA Kyle. (1st Ed.). Oxford University Press Inc., New York, 1995, p.433-62. Blair A, Malker H, Cantor KP. et al. Cancer among farmers. Scand J Work, Environ Health 11, 397-407, 1985. Blattner WA, Jacobson RJ and Shulman G. Multiple myeloma in South African blacks. Lancet 1, 928, 1979. Boccadoro M and Pileri A. Prognostic factors in multiple myeloma. In: Myeloma: Biology and Management. Eds. JS Malpas, D E Bergsagel and RA Kyle. (1st Ed.). Oxford University Press Inc., New York, 1995, p.251-270. Burger R, Neipel F, Fleckenstein B, et al. Human herpes virus type 8 interleukin-6 homologue is functionally active on human myeloma cells. Blood 90, 4278-82, 1998. Carter A, Merchar S, Silvian-Draxler I. et al. The role of interleukin-1 and tumour necrosis factor-α in human multiple myeloma. Br J Haematol 74, 424-31, 1990. Chang H, Bouman D, Boerkoel CF. et al. Frequent monoallelic loss of D13S319 in multiple myeloma patients shown by interphase fluorescence in situ hybridisation. Leukemia 13, 105-09, 1999. Chauhan D, Uchiyama H, Akbarali Y. et al. Multiple myeloma cell adhesion-induced interleukin-6 expression in bone marrow stromal cells involves activation of NF-kappa B. Blood 87, 1104-12, 1996. Cigudosa JC, Pulivarthi H, Rao M. et al. Characterisation of non-random chromosomal gains and losses in multiple myeloma by comparative genomic hybridisation. Blood 19(8), 3007-10, 1998. Committee of Chronic Leukemia-Myeloma Task Force.National Cancer Institute:Proposed guidelines for Protocol Studies II . Plasma Cell Myeloma. Cancer Chemotherapy Rep 4,145-58,1993 Croucher PI and Apperley JF. Bone disease in multiple myeloma. Br J Haematol 103, 902-10, 1998. Cuzick J and De Stavola B. Multiple Myeloma – A case control study. Br J Cancer 57, 517, 1988.
39
Cuzick J. Radiation-induced myelomatosis. NEJM 304, 201, 1981. Demers PA, Vaughan TL, Koepsell TD. et al. A case control study of multiple myeloma and occupation. Am J Ind Med 23, 629-39, 1993. Dewald GW and Jenkins RB. Cytogenetic and molecular genetic studies of patients with monoclonal gammopathies. In: Neoplastic Diseases of the Blood. Eds. PH Wiernik , GP Canellos, RA Kyle and CA Schiffer. (2nd Ed.). Churchill Livingstone, New York, 1991, p 427. Dewald GW, Kyle RA, Hicks GA. et al. The clinical significance of cytogenetic studies in 100 patients with multiple myeloma, plasma cell leukaemia, or amyloidosis. Blood 66, 380-90, 1985. Drach J, Angerler J, Schuster J. et al. Interphase fluorescence in situ hybridisation identifies chromosomal abnormalities in plasma cells from patients with MGUS. Blood 86(10), 1995. Durie BG. Staging and Kinetics of multiple myeloma. Seminars in Oncology 13, 300-9, 1986. Durie B G M and Salmon S E. A clinical staging system for multiple myeloma. Cancer 36, 842-54, 1975. Erming T, Fenghuang Z, Walter R et al. The role of the Wnt-signalling antagonist Dkk1 in the development of osteolytic lesions in Multiple Myleoma, NEJM No.26,Vol. 349:2483-2484, 2003. Feinman R, Sawyer J, Hardin J. et al. Cytogenetics and Molecular Genetics in Multiple Myeloma. In: Haematol Oncol Clin North Am. Ed. B Barlogie, W B Saunders Company, Philadelphia, 1997, p.1-25. Festen J M M, Marrink J, Sijpesteijn J A K. et al. A study on the association between myelomatosis and immunoglobulin allotypes, HLA and blood groups. Immunogenetics 3, 201-3, 1976. Fonseca R, Lionel Coignet JA, Dewald GW. et al. Cytogenetic abnormalities in multiple myeloma. Haematol/ Oncol Clin North Am.Vol.13.No.6,Dec 1999. Fonseca R, Debes-Marun C, Picken E et al. The recurrent IgH translocations are highly associated with non-hyperdiploid variant multiple myeloma. Blood 102: 2562-2567, 2003 Fonseca R, Bailey R J,Ahmann G J. et al.Genome abnormalities in monoclonal gammopathy of undetermined significance.Blood 100:1417-1424,2002.
40
Fonseca R, Harrington D, Okin M et al. Myeloma and the t(11;14)(q16.3.q32) represents a uniquely identified biological subset of patients. Blood 99:3735-3741, 2002. Fonseca R, Okin M, Harrington D.Deletions of 13 in Multiple Myeloma identified by interphase FISH usually denotes large deletions of the q arm or monosomy. Leukemia (Baltimore); 15:981-986, 2001 Garcia-Sanz R, Orfao M. Gonzalez M. et al. Primary plasma cell leukaemia: clinical immunophenotype, DNA ploidy and cytogenetics characteristics. Blood 93(3), 1169-1179, 1999. Gould J, Alexanian R, Goodacre A. et al. Plasma cell karyotypes in multiple myeloma. Blood 71, 453-56, 1988. Gozzetti A, and Le Beau M. Flourescence in situ hybridisation uses and limitations. Seminars in Haematology 37(4), 2000. Haas H, Anders S, Bornkamm GW. et al. Do infections induce monoclonal immunoglobulin components? Clin Exp Immunol 81, 435-40, 1990. Hallek M, Bergsagel P and Anderson KC. Multiple Myeloma – increasing evidence for a multistep transformation process. Blood 91, 3-21, 1998. Herrinton LJ, Weiss NS and Olshan AF. The epidemiology of myeloma. In Myeloma – Biology and Management. Eds JS Malpas, DE Bergsagel and RA Kyle (1st ed.). Oxford University Press, Inc., New York, 1995, p.127-68. Ichimaru M, Ishimaru T, Mikami M. et al. Multiple myeloma among atomic bomb survivors in Hiroshima and Nagasaki, 1950-76: Relationship to radiation dose absorbed by marrow. J Natl Cancer Inst 69, 323-8, 1982. International Myeloma Working Group. Criteria for the classification of monoclonal gammopathies, Multiple myeloma and related disorders: a report of the International Myeloma Working Group. Br J Haematology 121,749-57, 2003 Kawano M, Hirano T, Matsuda M. et al. Autocrine generation and requirement of BSF-2/IL-6 for human multiple myelomas. Nature 332, 83-5, 1988. Klein B, Zhang X-G, Jourdan M. et al. Paracrine rather than autocrine regulation of myeloma-cell growth and differentiation by 1L-6. Blood 73, 517-26, 1989. Kyle RA. Multiple myeloma – an update on diagnosis and management. Acta Oncologica 29, 1-8, 1990. Konigs R, Ackermann J, Kaufmann H. et al. Deletion of chromosome 13q14 in monoclonal gammopathy of undetermined significance. Leukemia 14, 1975-79, 2000.
41
Lai J, Zandecki M, Mary JY. et al. Improved cytogenetics in multiple myeloma A study of 151 patients including 117 patients at diagnosis. Blood 85, 2490-97, 1995. Leech SH, Bryan CF, Elston RC. et al. Genetic studies in multiple myeloma. Association with HLA Cw5. Cancer 51, 1408-11, 1983. Lewis JP and MacKenzie MR. Non-random chromosomal aberrations associated with multiple myeloma. Hematol Oncol 2, 307-17, 1984. Liu P, Leong T, Quam L et al. Activating mutations of N-ras and K-ras in MM show differential clinical associations: analysis of the Eastern Cooperative Oncology group Phase III trial. Blood 88:2699-2706,1996. Malpas JS. In: Myeloma: Biology and Management. Eds. JS Malpas, DE Bergsagel and RA Kyle. (1st Ed.). Oxford University Press Inc., New York, p.433-62, 1995. Mandema E and Wildervanck LS. La Maladie de Kahler. Journal of Genetics in Humans 3, 170-75, 1954. Maslovsky I, Lugassy G, Blumtel R. et al. Multiple chromosomal abnormalities in fulminant anaplastic myeloma. Clin Lab Haem 21, 207-210, 1999. Mason DY and Cullen P. HLA antigen frequencies in myeloma. Tissue Antigens 5, 238-45, 1975. Mazars GR, Porter M, Zhang X.G. Mutations of the p53 gene in human myeloma cell lines.Oncogene 7:1015-1018,1992. Miller W V. HLA and hematologic malignancy. Arch Int Med 133, 397-99, 1974. Moore PS, Boshoff C, Weiss R, et al. Molecular mimicry of human cytokine and cytokine response pathway genes by KSHV. Science 274, 1739-44, 1996. Moreau P, Facon T, Leleu X, et al. Recurrent 14q32 translocation determines the prognosis of multiple myeloma especially in patients receiving intensive chemotherapy.Blood 100:1579-1583,2002 Morgan GJ. Advances in the biology and treatment of multiple myeloma. Br J Haematol 105, 1-6, 1999 (suppl. 1). Muir C, Waterhouse J, Mack T. et al. Cancer incidence in five continents, Vol (V), No. 88, International Agency for Research on Cancer, Lyon, France, 1987. Mukiibi JM and Kyobe J. Pattern of multiple myeloma in Kenyans. Trop Geogr Med 40, 20, 1988.

42
Munshi NC. Recent Advances in the Management of Multiple Myeloma. Seminars in Hematology 41, 21-6, 2004. Munshi NC, Tricot G, Desikan R et al. Clinical activity of arsenic trioxide for the treatment of multiple myeloma. Leukemia 16, 1835-37, 2002 Muylle L, Desmet D, Cole J. et al. HLA-DR and monoclonal gammopathy. Tissue Antigens 20, 397-99, 1982. Myeloma Trialist’s Collaborative Group: Combination chemotherapy versus melphalan plus prednisone as treatment for multiple myeloma: An overview of 6633 patients from 27 randomised trials. J Clin Oncol 16, 3832-42, 1998. Nishida K. Tanura A, Nakawaza N. et al. The immunoglobulin heavy chain gene is frequently involved in chromosomal translocations in multiple myeloma and plasma cell leukaemia as detected by in situ hybridisation. Blood 90, 526, 1997. Olsen SJ, Tarte K, Sherman W, et al. Evidence against KSHV infection in the pathogenesis of myeloma. Virus Res 57, 197-202, 1998. Passweg J, Thiel G. and Bock HA. Monoclonal gammopathy after intense induction immunosuppression in renal transplant patients. Nephrol Dial Transplant 11(12), 2461-5, 1996. Patel M, Wadee AA, Galpin J, et al. HLA class I and class II antigens associated with multiple myeloma in Southern Africa. Clin Lab Haem 24, 215-9, 2002. Patel M, Mahlangu J, Patel J. et al. Kaposi Sarcoma-Associated Herpesvirus/Human Herpesvirus 8 and Multiple Myeloma in South Africa. Diagn Mol Pathol 10(2), 95-9, 2001. Patel M. An Epidemiological Study of Multiple Myeloma in Southern Africa. PhD thesis. University of the Witwatersrand, 2000. Patel M. Haematology. In: Baragwanath Hospital – A Medical Miscellany. Eds. K. Huddle and A. Dubb. Ultra Litho, 173-90, 1994. Patel M, Celliers L, Dukes IAF. et al. Multiple Myeloma at Baragwanath Hospital. Abstract No. 875. International Society of Haematology Congress, London, 1992, p.230. Pearce N and Reif JS. Epidemiologic studies of cancer in agricultural workers. Am J Ind Med 18, 133-48, 1990. Perez-Simon JA,Garzia-Sanz R, Tabernero M O. et al. Prognostic value of numerical chromosomal aberrations in multiple myeloma: A FISH analysis of 15 different chromosomes. Blood 91, 3366-71,1998.
43
Potter M, Pumphrey JG and Bailey DW. Genetics of susceptibility of plasmacytoma induction. I. BALB/cAnN (C), C57BL/6N (B6), C57BL/Ka (BK), (CxB6), F1, (CxBK) F1 and CxB recombinant-inbred strains. J Natl Cancer Inst 54, 1413-17, 1975. Pottern LM, Gart JJ, Nam J. et al. HLA and multiple myeloma among Black and White men: evidence of a genetic association. Cancer Epidemiology Biomarkers and Prev 1, 177-82, 1992. Pottern LM and Blattner WA. Etiology and epidemiology of multiple myeloma and related disorders. In: Neoplastic Diseases of the Blood. Eds. PH Wiernik, GP Cancellos, RA Kyle and CA Schiffer (1st Ed.) Churchill Livingstone, New York p. 413-29, 1985, p.413-29. Radl J and Hollander CF. Homogenous immunoglobulins in the sera of mice during aging. J Immunol 112, 2271-73, 1974. Rettig MB, Ma HJ, Vescio RA. et al. Kaposi’s sarcoma-associated herpesvirus infection of bone marrow dendritic cells from multiple myeloma patients. Science 276, 1851-4, 1997. Richardson PG, Barlogie B, Berenson J. et al. A phase 2 study of bortezomib in relapsed, refractory myeloma. N Engl J Med 348, 2609-17, 2003. Richardson PG, Schlossman RL, Weller E. et al. Immunomodulatory drug CC-5013 overcomes drug resistance and is well tolerated in patients with relapsed multiple myeloma. Blood 100, 3063-7,2002. Riedl DA and Pottern LM. The Epidemiology of Multiple Myeloma. In: Haematol Oncol Clin N Am. Multiple Myeloma. Ed. B. Barlogie. 6, 1992, p.225-47. Sawyer JR, Tricot G, Mattox S et al. Monosomy 13(-13) or abnormalities involving 14q are associated with poor prognosis in multiple myleloma (MM) Blood 84, 523, 1994 (suppl. 1). Shaughnessy J, Jacobson J, Sawyer J. et al. Continuous absence of metaphase-defined cytogenetic abnormalities, especially of chromosome 13 and hypodiploidy, ensures long term survival in multiple myeloma treated with Total Therapy I: Interpretation in the context of global gene expression. Blood 101, 3849-56, 2003. Shaughnessy J, Tian E, Sawyer J. et al. High incidence of chromosome 13 deletion in multiple myeloma detected by interphase FISH. Blood 96 (4), 2000. Shimizu Y, Kato H and Schull WJ. Studies of the mortality of A-bomb survivors. 9. Mortality, 1950-1985: Part II. Cancer mortality based on the recently revised doses (DS86). Radiat Res 121, 120-41, 1990.
44
Smith G, Walford RL, Fishkin B. et al. HLA phenotypes, immunoglobulins and κ and λ light chains in multiple myeloma. Tissue Antigens 4, 374-77, 1974. Steineck G and Wiklund K. Multiple myeloma in Swedish agricultural workers. Int J Epidemiol 15, 321-25, 1986. Tabernero D, San Miguel JF, Garcia-Sanz R. et al. Incidence of chromosome numerical changes in multiple myeloma. Am J Pathol 149, 153, 1996. Tarte K, Olsen SJ, Rossi JF, et al. Kaposi’s sarcoma-associated herpes virus is not detected with immunosuppression in multiple myeloma. Blood 92, 2186-8, 1998. Tricot G, Barlogie B, Jagannath S. et al. Poor prognosis in multiple myeloma associated only with partial or complete deletions of chromosome 13 or abnormalities involving 11q and not with other karyotype abnormalities. Blood 86, 4250-56, 1995. Urashima M, Ogata A, Chauhan D. et al. Transforming growth factor-beta I: Differential effects on multiple myeloma versus normal B cells. Blood 87, 1928-38, 1996. Urashima M, Chauhan D, Uchiyama H. et al. CD40 ligand triggered interleukin-6 secretion in multiple myeloma. Blood 85, 1903-12, 1995. Van Riet I, Vanderkerken K, de Greef C. et al. Homing behaviour of the malignant cell clone in multiple myeloma. Med Oncol 15, 154-64, 1998. Viguie F. Deletion 13q in multiple myeloma. Genet Cytogenet. Oncol. Haematol. March, 2001. Weber D, Rankin K, Gavino et al. Thalidomide alone or with dexamethasone for previously untreated multiple myeloma. J Clin Oncol 21, 16-19, 2003. Wolverkamp MCJ and Marquet RL. Interleukin-6: historical background, genetics and biological significance. Immunology Letters 24, 1-10, 1990. Yakoub-Agha I, Attal M, Dumontet C. et al. Thalidomide in patients with advanced multiple myeloma: A study of 83 patients-Report of the Intergroupe Francophone du Myelome (IFM). Hematol J 3, 185-92, 2002. Zhao L, Hayes K, Glassman A. et al. Enhanced detection of chromosomal abnormalities with the use of RXFISH multicolour banding technique. Cancer Cytogenetics 11, 108-11, 2000. Zojer N, Konigsberg R, Ackermann J. et al. Deletion 13q14 remains an independent adverse prognostic variable in multiple myeloma despite its frequent detection by interphase fluorescence in situ hybridisation. Blood 95(6), 1925-30, 2000.
45
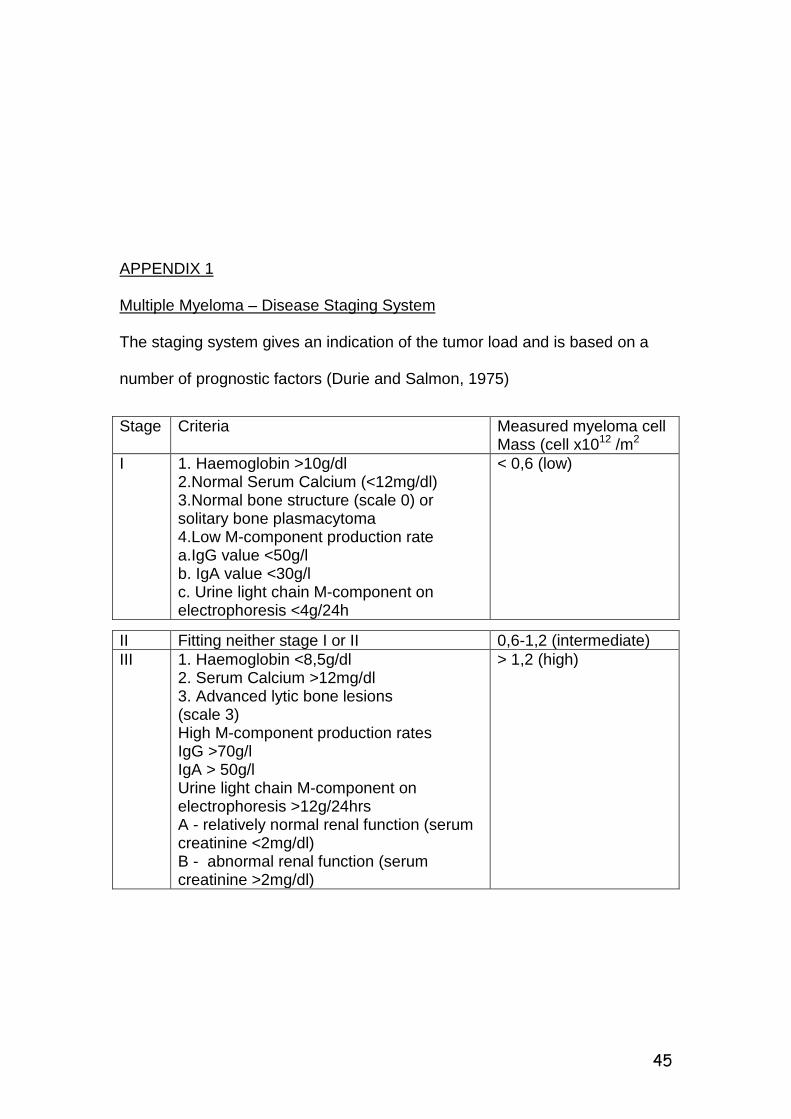
APPENDIX 1
Multiple Myeloma – Disease Staging System The staging system gives an indication of the tumor load and is based on a number of prognostic factors (Durie and Salmon, 1975)
Stage Criteria Measured myeloma cell Mass (cell x1012 /m2
I 1. Haemoglobin >10g/dl 2.Normal Serum Calcium (<12mg/dl) 3.Normal bone structure (scale 0) or solitary bone plasmacytoma 4.Low M-component production rate a.IgG value <50g/l b. IgA value <30g/l c. Urine light chain M-component on electrophoresis <4g/24h
< 0,6 (low)
II Fitting neither stage I or II 0,6-1,2 (intermediate) III 1. Haemoglobin <8,5g/dl
2. Serum Calcium >12mg/dl 3. Advanced lytic bone lesions (scale 3) High M-component production rates IgG >70g/l IgA > 50g/l Urine light chain M-component on electrophoresis >12g/24hrs A - relatively normal renal function (serum creatinine <2mg/dl) B - abnormal renal function (serum creatinine >2mg/dl)
> 1,2 (high)

46
APPENDIX 2
Criteria for diagnosis of Myeloma
Any 2 major criteria listed below
Major criterion 1 plus minor criterion B, C or D
Major criterion 3 plus minor criterion A or C
Minor criteria A, B and C or A, B and D
MAJOR CRITERIA
1. Plasmacytoma on biopsy
2. > 30% plasma cells in marrow
3. Monoclonal immunoglobulin electrophoretic spike with IgG >3,5 g/dl
or IgA > 2 g/dl or kappa or lambda light chain excretion in the
urine > 1g /day
MINOR CRITERIA
A. Bone marrow plasmacytosis, with 10-30% plasma cells
B. Monoclonal immunoglobulin present, but at quantitatively lower levels
than for a major criteria
C. Lytic bone lesions
D. Depressed normal immunoglobulins IgM<50 mg/dl, IgA < 100 mg/dl,
IgG < 600 mg/dl.
( Durie, 1986, Committee of Chronic Leukemia-Myeloma Task Force,
National Cancer Institute, 1993)
47
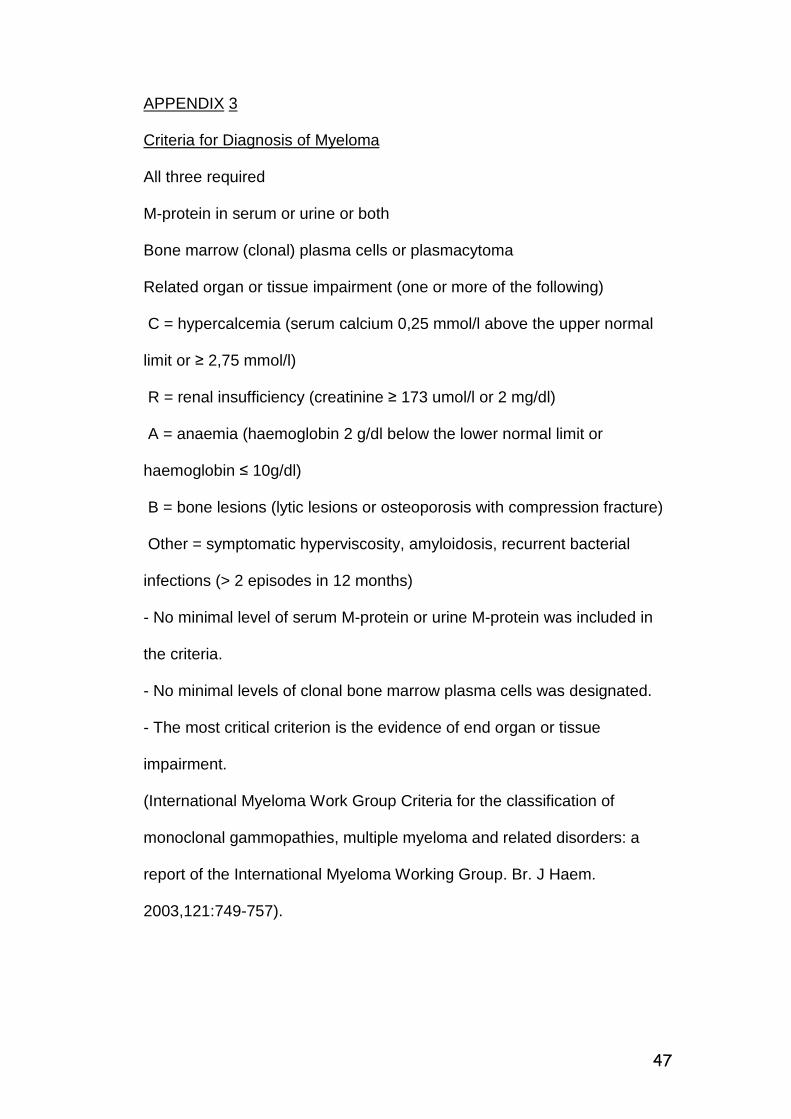
APPENDIX 3
Criteria for Diagnosis of Myeloma
All three required
M-protein in serum or urine or both
Bone marrow (clonal) plasma cells or plasmacytoma
Related organ or tissue impairment (one or more of the following)
C = hypercalcemia (serum calcium 0,25 mmol/l above the upper normal
limit or ≥ 2,75 mmol/l)
R = renal insufficiency (creatinine ≥ 173 umol/l or 2 mg/dl)
A = anaemia (haemoglobin 2 g/dl below the lower normal limit or
haemoglobin ≤ 10g/dl)
B = bone lesions (lytic lesions or osteoporosis with compression fracture)
Other = symptomatic hyperviscosity, amyloidosis, recurrent bacterial
infections (> 2 episodes in 12 months)
- No minimal level of serum M-protein or urine M-protein was included in
the criteria.
- No minimal levels of clonal bone marrow plasma cells was designated.
- The most critical criterion is the evidence of end organ or tissue
impairment.
(International Myeloma Work Group Criteria for the classification of
monoclonal gammopathies, multiple myeloma and related disorders: a
report of the International Myeloma Working Group. Br. J Haem.
2003,121:749-757).
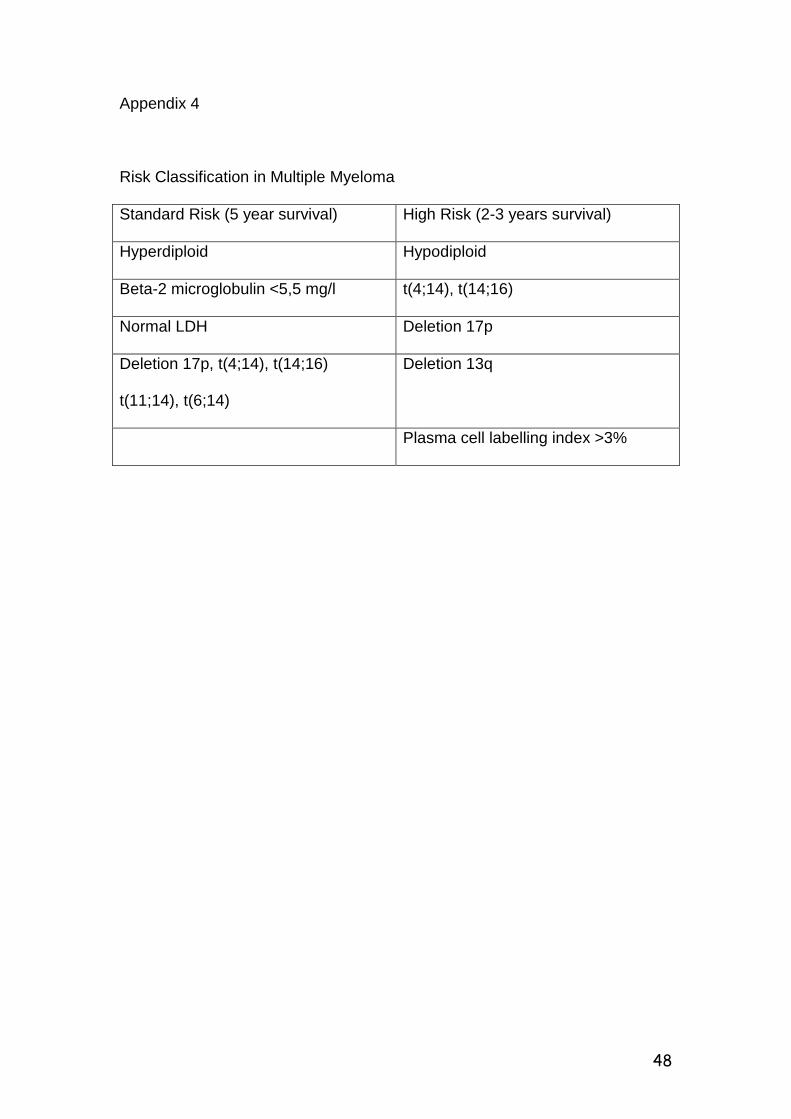
48
Appendix 4
Risk Classification in Multiple Myeloma
Standard Risk (5 year survival) High Risk (2-3 years survival)
Hyperdiploid Hypodiploid
Beta-2 microglobulin <5,5 mg/l t(4;14), t(14;16)
Normal LDH Deletion 17p
Deletion 17p, t(4;14), t(14;16)
t(11;14), t(6;14)
Deletion 13q
Plasma cell labelling index >3%