chronic disease health profile - tennessee · tennessee department of health office of policy,...
TRANSCRIPT

TENNESSEE DEPARTMENT OF HEALTH OFFICE OF POLICY, PLANNING & ASSESSMENT
SURVEILLANCE, EPIDEMIOLOGY AND EVALUATION DECEMBER 2011
CHRONIC DISEASE HEALTH PROFILE REGIONS AND COUNTIES: TENNESSEE
METROPOLITAN COUNTIES

TABLE OF CONTENTS
SECTION 1: STATE PROFILE TENNESSEE 1 SECTION 2: RANKINGS REGIONAL RANKINGS OF SELECTED INDICATORS 15 COUNTY RANKINGS OF SELECTED INDICATORS 16 COUNTY RANKINGS OF SELECTED INDICATORS BY RURAL REGION 20 SECTION 3: METROPOLITAN COUNTY PROFILES DAVIDSON 24 HAMILTON 38 KNOX 52 MADISON 66 SHELBY 80 SULLIVAN 94 SECTION 4: TECHNICAL NOTES TECHNICAL NOTES 108

Median Age1: 37.3
Median Income1:
Home Ownership1:
Unemployment1: 7.9%
Crime Rate2 (per 1,000): 91.9
Teen Pregnancy Rate3 (per 1,000)
Population by Age, Gender and Race, 2005-20091 Overall: 63.4
Age White: 52.4
Black: 103.3
Infant Mortality4 (per 1,000)
Overall: 8.1
<18 White: 5.6
18-44 Black: 15.2
45-6465+Total
Female Male Non-Hispanic
White
Non-Hispanic
Black
Hispanic
TennesseeDemographics Quick Facts
$42,943
Gender Race Total
1,143,968 1,140,065 1,699,802 410,678 106,533 2,284,033720,623 754,407 1,025,898 298,159 90,277 1,475,030
3,157,271 3,001,682 4,740,106 1,016,050 228,443 6,158,953
Automobile Accident Deaths4 (per 100,000): 18.7
464,909 332,068 698,898 81,004 6,057 796,977827,771 775,142 1,315,508 226,209 25,576 1,602,913
Demographics of Tennessee, 2005-20091
72.0%
1
1Data Source: U.S. Census Bureau, American Community Survey, 2005-2009.
4Data Source: Death Statistical System, Tennessee Department of Health, Division of Health Statistics, 2007-2009.
2Data Source: Tennessee Bureau of Investigation. "Tennessee Incident Based Reporting System (TIBRS)" accessed July 26, 2011. http://www.tennesseecrimeonline.com/tibrspublic2005, 2007-2009.
3Data Source: Birth Statistical System, Fetal Death Statistical System, and Induced Abortion Statistical System. Tennessee Department of Health, Division of Health Statistics, 2007-2009.
16.112.2
82.0
3.716.5
77.0
51.348.7
0 20 40 60 80 100
Individuals in PovertyFamilies in Poverty
HS Graduate
HispanicNH BlackNH White
Female Male
Percent
Demographics of Tennessee, 2005-20091
1

TennesseeGeneral Health
18.319.9 20.7
18.1 19.4 19.5 18.8 20.5 20.5 21.3
0
20
40
2000 2002 2004 2006 2008
Perc
ent
"Fair/Poor" Health1
76.7
55.461.3 60.8 63.5 63.8 66.5 65.3 64.3 63.9
52.3 50.8 55.0 53.1 53.041.6
53.0 57.0 54.1 55.7
0
20
40
60
80
100
2000 2001 2002 2003 2004 2005 2006 2007 2008 2009
Perc
ent
Pneumonia and Influenza Vaccination Status1
11.9
10.7
13.0 12.7 11.814.0 13.2 14.7 16.6 15.7
0
20
40
2000 2002 2004 2006 2008
Perc
ent
Lacking Health Insurance1
2
Prevalence for General Health Indicators Among Tennessee Adults 18+, 20091
1Data Source: Tennessee Behavioral Risk Factor Surveillance System (BRFSS). Statistics are for 18+ unless indicated otherwise.
2Age 65+.
3Age 50+.
Indicator Total NH White NH Black Female Male
Lacking Health Insurance (%) 15.7 14.2 20.0 12.9 18.9Fair/Poor Health Status (%) 21.3 22.1 20.6 22.4 20.1
Received Flu Shot in Past 12 Months3(%) 55.7 57.2 43.7 56.6 54.7Ever Received Pneumonia Vaccination2(%) 63.9 66.1 44.5 65.3 62.0
12.4
Mean # of Days of Poor Mental Health per Month (%) 13.9 14.2 13.5 12.9 15.3
Mean # of Days of Poor Physical Health per Month (%) 12.4 12.9 10.9 12.5
0
20
2000 2001 2002 2003 2004 2005 2006 2007 2008 2009
Ever received pneumonia vaccination (age 65+) Received flu shot in past 12 months (age 50+)
2
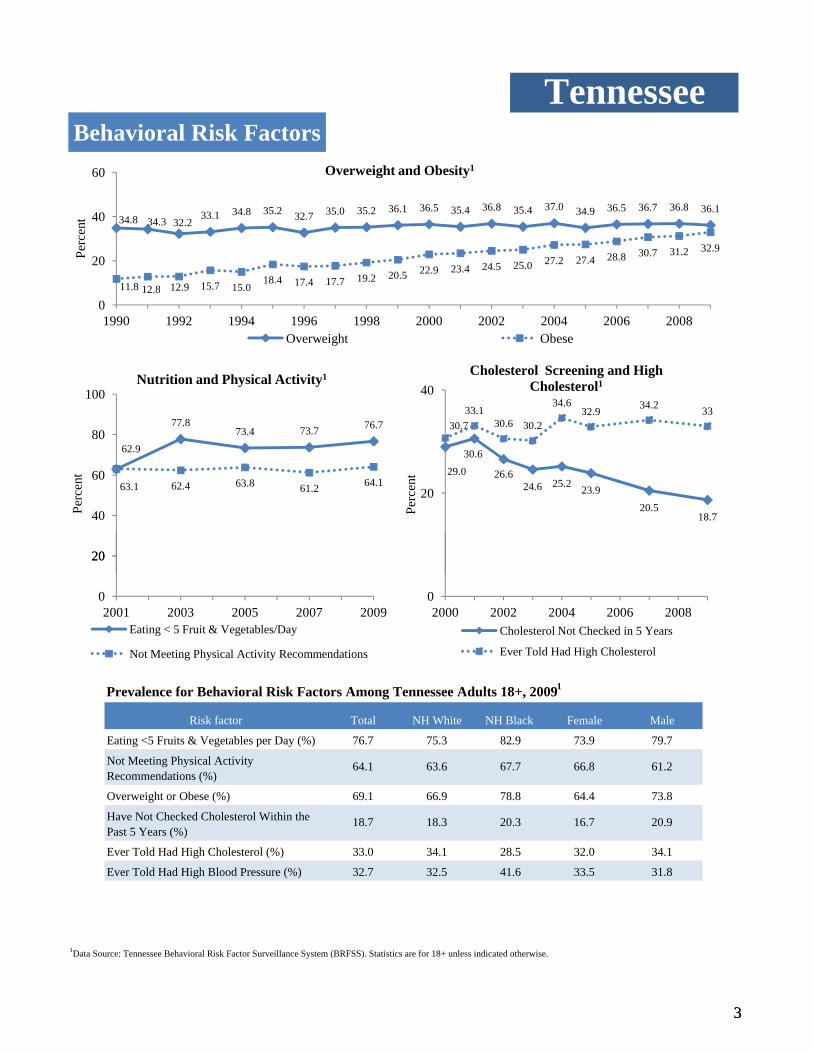
TennesseeBehavioral Risk Factors
34.8 34.3 32.233.1 34.8 35.2 32.7 35.0 35.2 36.1 36.5 35.4 36.8 35.4 37.0 34.9 36.5 36.7 36.8 36.1
11.8 12.8 12.9 15.7 15.018.4 17.4 17.7 19.2 20.5 22.9 23.4 24.5 25.0 27.2 27.4 28.8 30.7 31.2 32.9
0
20
40
60
1990 1992 1994 1996 1998 2000 2002 2004 2006 2008
Perc
ent
Overweight and Obesity1
Overweight Obese
62.9
77.873.4 73.7 76.7
63.1 62.4 63.8 61.2 64.1
20
40
60
80
100
Perc
ent
Nutrition and Physical Activity1
29.0
30.6
26.624.6 25.2 23.9
20.518.7
30.733.1
30.6 30.2
34.632.9 34.2 33
20
40Pe
rcen
t
Cholesterol Screening and High Cholesterol1
3
Prevalence for Behavioral Risk Factors Among Tennessee Adults 18+, 20091
1Data Source: Tennessee Behavioral Risk Factor Surveillance System (BRFSS). Statistics are for 18+ unless indicated otherwise.
Risk factor Total NH White NH Black Female Male
Not Meeting Physical Activity Recommendations (%)
64.1 63.6 67.7 66.8 61.2
Eating <5 Fruits & Vegetables per Day (%) 76.7 75.3 82.9 73.9 79.7
Have Not Checked Cholesterol Within the Past 5 Years (%)
18.7 18.3 20.3 16.7 20.9
Overweight or Obese (%) 69.1 66.9 78.8 64.4 73.8
Ever Told Had High Blood Pressure (%) 32.7 32.5 41.6 33.5 31.8
Ever Told Had High Cholesterol (%) 33.0 34.1 28.5 32.0 34.1
0
20
2001 2003 2005 2007 2009Eating < 5 Fruit & Vegetables/Day
Not Meeting Physical Activity Recommendations
02000 2002 2004 2006 2008
Cholesterol Not Checked in 5 Years
Ever Told Had High Cholesterol
3
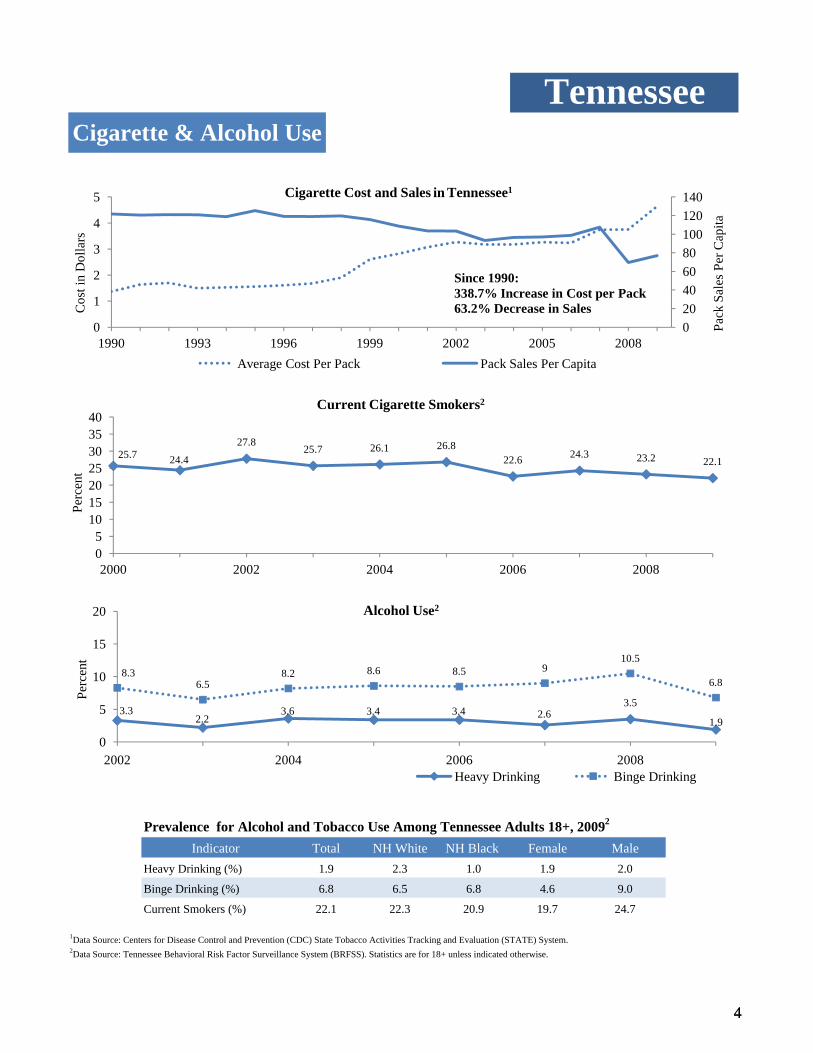
TennesseeCigarette & Alcohol Use
020406080100120140
0
1
2
3
4
5
1990 1993 1996 1999 2002 2005 2008
Pack
Sal
es P
er C
apita
Cos
t in
Dol
lars
Cigarette Cost and Sales in Tennessee1
Average Cost Per Pack Pack Sales Per Capita
Since 1990:338.7% Increase in Cost per Pack63.2% Decrease in Sales
25.7 24.4
27.825.7 26.1 26.8
22.6 24.3 23.2 22.1
05
10152025303540
2000 2002 2004 2006 2008
Perc
ent
Current Cigarette Smokers2
4
Prevalence for Alcohol and Tobacco Use Among Tennessee Adults 18+, 20092
1Data Source: Centers for Disease Control and Prevention (CDC) State Tobacco Activities Tracking and Evaluation (STATE) System.2Data Source: Tennessee Behavioral Risk Factor Surveillance System (BRFSS). Statistics are for 18+ unless indicated otherwise.
Heavy Drinking (%) 1.9 2.3 1.0 1.9 2.0
Indicator Total NH White NH Black Female Male
Current Smokers (%) 22.1 22.3 20.9 19.7 24.7
Binge Drinking (%) 6.8 6.5 6.8 4.6 9.0
3.32.2
3.6 3.4 3.4 2.63.5
1.9
8.36.5
8.2 8.6 8.5 910.5
6.8
0
5
10
15
20
2002 2004 2006 2008
Perc
ent
Alcohol Use2
Heavy Drinking Binge Drinking
05
2000 2002 2004 2006 2008
4
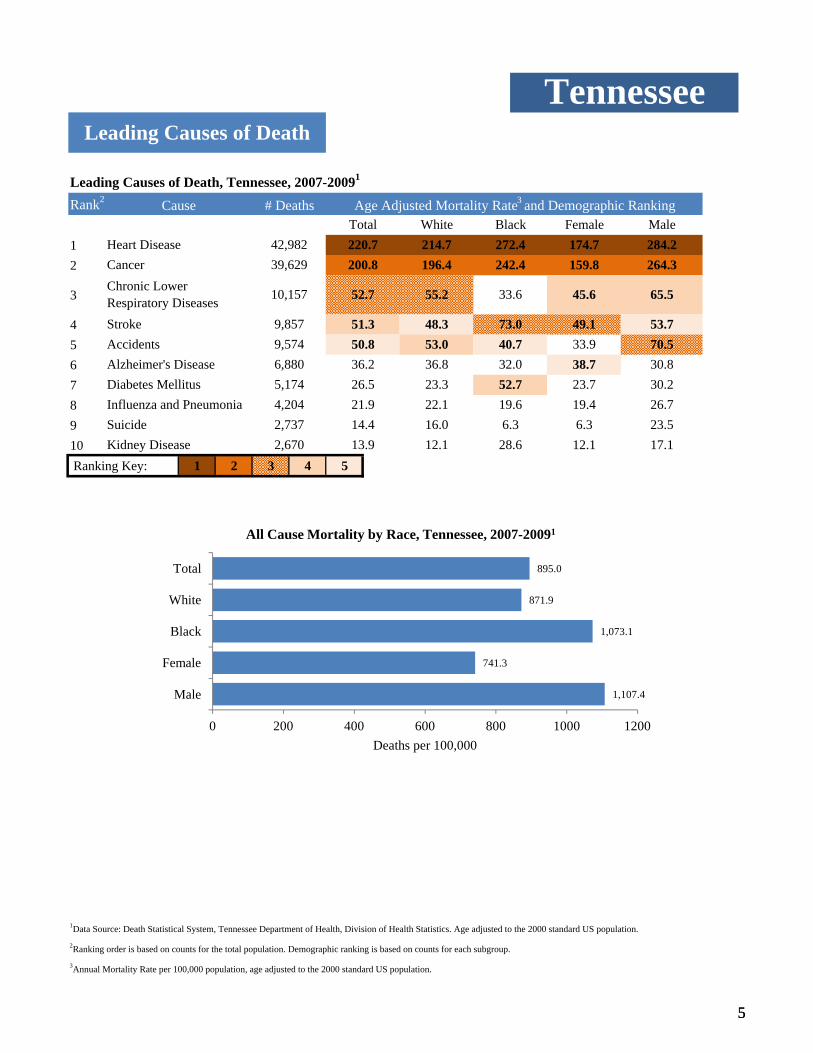
Leading Causes of Death, Tennessee, 2007-20091
Rank2
12
3
45678910 Ranking Key: 1 2 3 4 5
Accidents 50.89,5746,880
Influenza and PneumoniaDiabetes Mellitus 5,174
Suicide
23.322.116.012.1
Alzheimer's Disease 36.2
Kidney Disease 2,67014.413.9
2,7374,204
26.521.9
Stroke
220.7200.8
52.7
51.3
272.4242.4
33.6
73.0
Chronic Lower Respiratory Diseases
Cause # Deaths
Leading Causes of Death
Cancer42,98239,629 159.8
45.6
49.1
Age Adjusted Mortality Rate3 and Demographic Ranking
284.2264.3
65.5
53.770.5
Total Male174.7
33.9
196.4Heart Disease
White Black Female214.7
Tennessee
26.723.5
19.4
30.830.2
10,157
9,857
6.328.6
32.052.719.6
6.312.1
40.7
55.2
48.353.036.8
17.1
38.723.7
895.0Total
All Cause Mortality by Race, Tennessee, 2007-20091
5
1Data Source: Death Statistical System, Tennessee Department of Health, Division of Health Statistics. Age adjusted to the 2000 standard US population.
2Ranking order is based on counts for the total population. Demographic ranking is based on counts for each subgroup.
3Annual Mortality Rate per 100,000 population, age adjusted to the 2000 standard US population.
1,107.4
741.3
1,073.1
871.9
895.0
0 200 400 600 800 1000 1200
Male
Female
Black
White
Total
Deaths per 100,000
All Cause Mortality by Race, Tennessee, 2007-20091
5
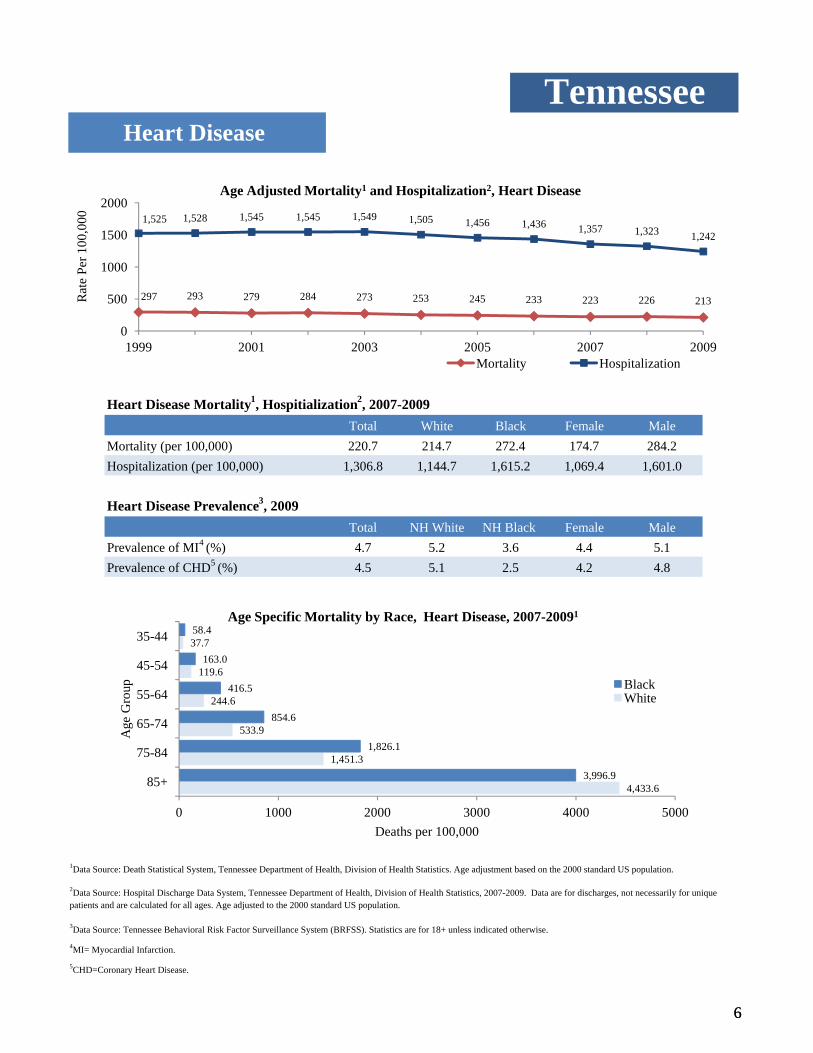
Heart Disease Mortality1, Hospitialization2, 2007-2009
Heart Disease Prevalence3, 2009
Mortality (per 100,000) 220.7 214.7 272.4 174.7 284.2
TennesseeHeart Disease
Total White Black Female Male
Total NH White NH Black Female Male
Hospitalization (per 100,000) 1,306.8 1,144.7 1,615.2 1,069.4 1,601.0
P l f CHD5 (%) 4 5 5 1 2 5 4 2 4 8Prevalence of MI4 (%) 4.7 5.2 3.6 4.4 5.1
297 293 279 284 273 253 245 233 223 226 213
1,525 1,528 1,545 1,545 1,549 1,505 1,456 1,436 1,357 1,323 1,242
0
500
1000
1500
2000
1999 2001 2003 2005 2007 2009
Rat
e Pe
r 100
,000
Age Adjusted Mortality1 and Hospitalization2, Heart Disease
Mortality Hospitalization
6
1Data Source: Death Statistical System, Tennessee Department of Health, Division of Health Statistics. Age adjustment based on the 2000 standard US population.
3Data Source: Tennessee Behavioral Risk Factor Surveillance System (BRFSS). Statistics are for 18+ unless indicated otherwise.
4MI= Myocardial Infarction.
5CHD=Coronary Heart Disease.
Prevalence of CHD5 (%) 4.5 5.1 2.5 4.2 4.8
2Data Source: Hospital Discharge Data System, Tennessee Department of Health, Division of Health Statistics, 2007-2009. Data are for discharges, not necessarily for unique patients and are calculated for all ages. Age adjusted to the 2000 standard US population.
4,433.6
1,451.3
533.9
244.6
119.6
37.7
3,996.9
1,826.1
854.6
416.5
163.0
58.4
0 1000 2000 3000 4000 5000
85+
75-84
65-74
55-64
45-54
35-44
Deaths per 100,000
Age
Gro
up
Age Specific Mortality by Race, Heart Disease, 2007-20091
BlackWhite
6

Stroke Mortality1, Hospitialization2, and Prevalence3, 2007-2009
Mortality (per 100,000) 51.3 48.3 73.0 49.1 53.7
TennesseeStroke
Total White Black Female Male
Prevalence4 (%) 3 0 3 1 3 4 3 7 2 2Hospitalization (per 100,000) 318.0 273.4 431.1 299.8 342.0
76 78 73 71 68 63 61 55 55 51 48
402 398 400 394 382 363 356 356329 322 303
0
100
200
300
400
500
1999 2001 2003 2005 2007 2009
Rat
e pe
r 100
,000
Age Adjusted Mortality1 and Hospitalization2, Stroke
Mortality Hospitalization
7
1Data Source: Death Statistical System, Tennessee Department of Health, Division of Health Statistics. Age adjustment based on the 2000 standard US population.
3Data Source: Tennessee Behavioral Risk Factor Surveillance System (BRFSS). Statistics are for 18+ unless indicated otherwise.
42009 data, NH white and NH black race groups.
Prevalence4 (%) 3.0 3.1 3.4 3.7 2.2
2Data Source: Hospital Discharge Data System, Tennessee Department of Health, Division of Health Statistics, 2007-2009. Data are for discharges, not necessarily for unique patients and are calculated for all ages. Age adjusted to the 2000 standard US population.
1138
387.1
106.2
35.1
14.7
5.6
1121.5
517.8
217.9
96.6
44.3
18.2
0 200 400 600 800 1000 1200
85+
75-84
65-74
55-64
45-54
35-44
Deaths per 100,000
Age
Gro
up
Age Specific Mortality by Race, Stroke, 2007-20091
BlackWhite
7
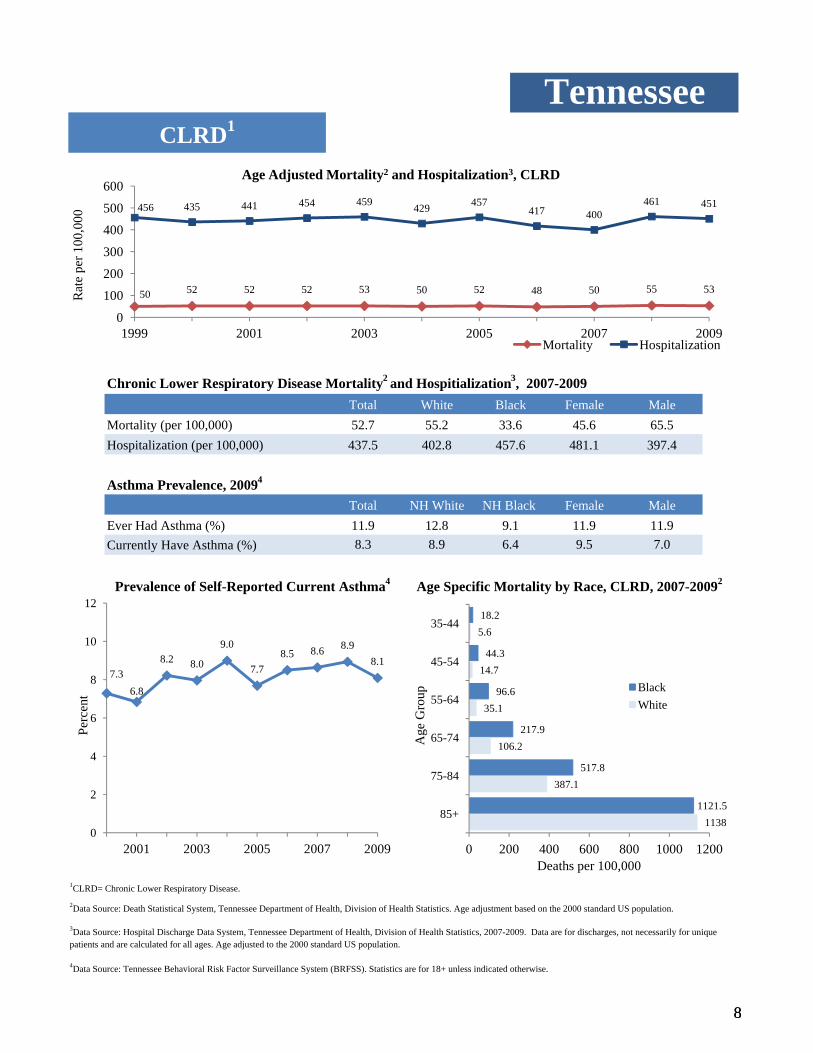
Chronic Lower Respiratory Disease Mortality2 and Hospitialization3, 2007-2009
Currently Have Asthma (%)
Mortality (per 100,000) 52.7 55.2 33.6 45.6 65.5
TennesseeCLRD1
Total White Black Female Male
Asthma Prevalence, 20094
Total NH White NH Black Female Male
Hospitalization (per 100,000) 437.5 402.8 457.6 481.1 397.4
8.3 8.9 6.4 9.5 7.0Ever Had Asthma (%) 11.9 12.8 9.1 11.9 11.9
50 52 52 52 53 50 52 48 50 55 53
456 435 441 454 459 429 457417 400
461 451
0
100
200
300
400
500
600
1999 2001 2003 2005 2007 2009
Rat
e pe
r 100
,000
Age Adjusted Mortality2 and Hospitalization3, CLRD
Mortality Hospitalization
8
1CLRD= Chronic Lower Respiratory Disease.
2Data Source: Death Statistical System, Tennessee Department of Health, Division of Health Statistics. Age adjustment based on the 2000 standard US population.
4Data Source: Tennessee Behavioral Risk Factor Surveillance System (BRFSS). Statistics are for 18+ unless indicated otherwise.
Prevalence of Self-Reported Current Asthma4 Age Specific Mortality by Race, CLRD, 2007-20092
3Data Source: Hospital Discharge Data System, Tennessee Department of Health, Division of Health Statistics, 2007-2009. Data are for discharges, not necessarily for unique patients and are calculated for all ages. Age adjusted to the 2000 standard US population.
7.36.8
8.2 8.0
9.0
7.78.5 8.6 8.9
8.1
0
2
4
6
8
10
12
2001 2003 2005 2007 2009
Perc
ent
1138
387.1
106.2
35.1
14.7
5.6
1121.5
517.8
217.9
96.6
44.3
18.2
0 200 400 600 800 1000 1200
85+
75-84
65-74
55-64
45-54
35-44
Deaths per 100,000
BlackWhite
Age
Gro
up
8
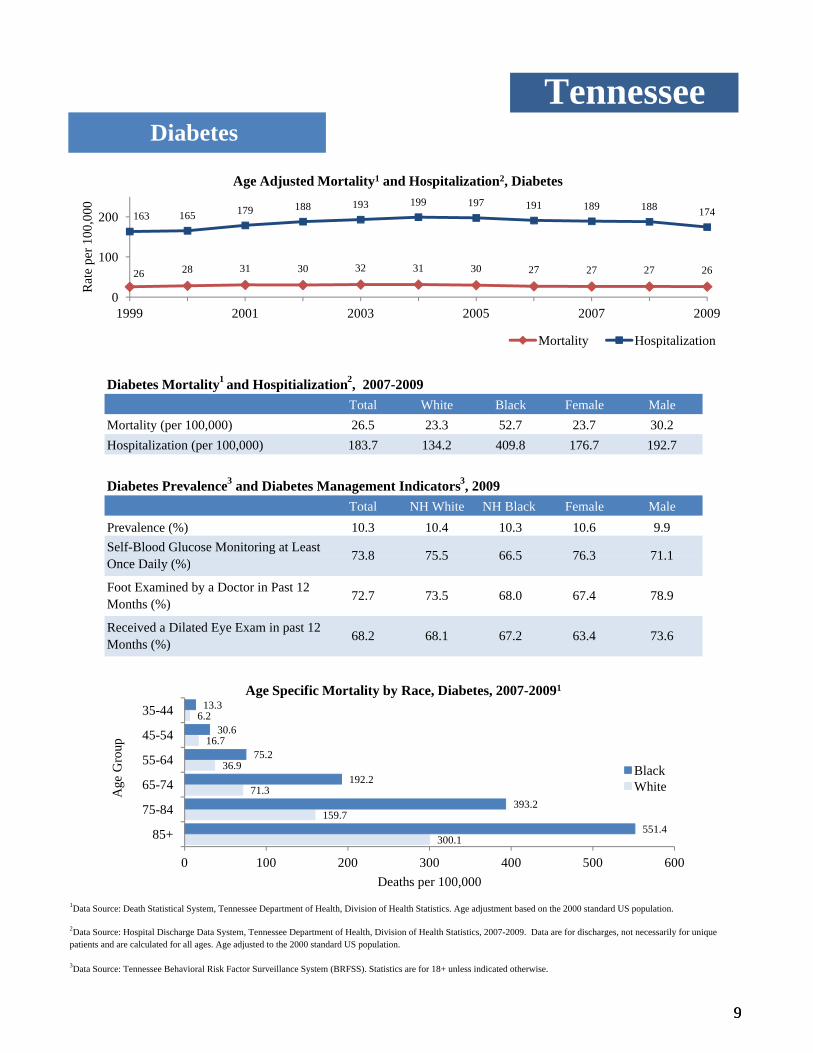
Mortality (per 100,000) 26.5 23.3 52.7 23.7 30.2
TennesseeDiabetes
Diabetes Mortality1 and Hospitialization2, 2007-2009 Total White Black Female Male
Diabetes Prevalence3 and Diabetes Management Indicators3, 2009Total NH White NH Black Female Male
Hospitalization (per 100,000) 183.7 134.2 409.8 176.7 192.7
Self-Blood Glucose Monitoring at Least Once Daily (%) 73.8 75.5 66.5 76.3 71.1
Prevalence (%) 10.3 10.4 10.3 10.6 9.9
26 28 31 30 32 31 30 27 27 27 26
163 165 179 188 193 199 197 191 189 188 174
0
100
200
1999 2001 2003 2005 2007 2009
Rat
e pe
r 100
,000
Age Adjusted Mortality1 and Hospitalization2, Diabetes
Mortality Hospitalization
9
1Data Source: Death Statistical System, Tennessee Department of Health, Division of Health Statistics. Age adjustment based on the 2000 standard US population.
3Data Source: Tennessee Behavioral Risk Factor Surveillance System (BRFSS). Statistics are for 18+ unless indicated otherwise.
Once Daily (%)
Received a Dilated Eye Exam in past 12 Months (%) 68.2 68.1 67.2 63.4 73.6
Foot Examined by a Doctor in Past 12 Months (%) 72.7 73.5 68.0 67.4 78.9
2Data Source: Hospital Discharge Data System, Tennessee Department of Health, Division of Health Statistics, 2007-2009. Data are for discharges, not necessarily for unique patients and are calculated for all ages. Age adjusted to the 2000 standard US population.
300.1
159.7
71.3
36.9
16.7
6.2
551.4
393.2
192.2
75.2
30.6
13.3
0 100 200 300 400 500 600
85+
75-84
65-74
55-64
45-54
35-44
Deaths per 100,000
Age
Gro
up
Age Specific Mortality by Race, Diabetes, 2007-20091
BlackWhite
9

TennesseeCancer
Cancer Incidence1 and Mortality1, 2004-2008 Total White Black Female Male
Mortality (per 100,000) 202.2 196.9 249.8 163.3 260.5Incidence (per 100,000) 467.8 466.6 468.1 405.3 559.1
444.2473.2 470.8 475.8 473.3
206.7 208.7 202.7 199.2 194.5
407.6 399.8 390.8 371.0 367.4
0
100
200
300
400
500
600
2004 2005 2006 2007 2008
Rat
e pe
r 100
,000
Age Adjusted Incidence1, Mortality1 and Hospitalization2, All Cancers
Incidence Mortality Hospitalization
10
1Data Source: Cancer Registry, Tennessee Department of Health, Office of Cancer Surveillance, all ages. Age adjusted to the 2000 standard US population.
3Data Source: Death Statistical System, Tennessee Department of Health, Division of Health Statistics.
2Data Source: Hospital Discharge Data System, Tennessee Department of Health, Division of Health Statistics, 2007-2009. Data are for discharges, not necessarily for unique patients and are calculated for all ages. Age adjusted to the 2000 standard US population.
1528.5
1355.5
802.9
369.2
138.2
35.9
1,834.9
1,608.3
958.8
495.3
182.1
46.9
0 500 1000 1500 2000
85+
75-84
65-74
55-64
45-54
35-44
Deaths Per 100,000
Age
Gro
up
Age Specific Mortality by Race, All Cancer, 2007-20093
BlackWhite
10

TennesseeLung Cancer
Lung Cancer Incidence1 and Mortality1, 2004-2008Total White Black Female Male
Mortalit (per 100 000) 66 5 66 5 66 5 66 5 66 5Incidence (per 100,000) 81.0 81.7 77.8 60.8 108.8
83.2 83.4 82.2 78.6 78.0
67.7 69.5 67.4 65.3 63.0
0
20
40
60
80
100
120
2004 2005 2006 2007 2008
Rat
e pe
r 100
,000
Age Adjusted Incidence1 and Mortality1, Lung Cancer
Incidence Mortality
11
1Data Source: Cancer Registry, Tennessee Department of Health, Office of Cancer Surveillance, all ages. Age adjusted to the 2000 standard US population.
2Data Source: Death Statistical System, Tennessee Department of Health, Division of Health Statistics.
Mortality (per 100,000) 66.5 66.5 66.5 66.5 66.5
317.4
453.8
329.2
134.2
41.9
7.3
327.1
430.1
316.2
148.9
48.2
5.9
0 100 200 300 400 500
85+
75-84
65-74
55-64
45-54
35-44
Deaths Per 100,000
Age
Gro
up
Age Specific Mortality by Race, Lung Cancer, 2007-20092
BlackWhite
11
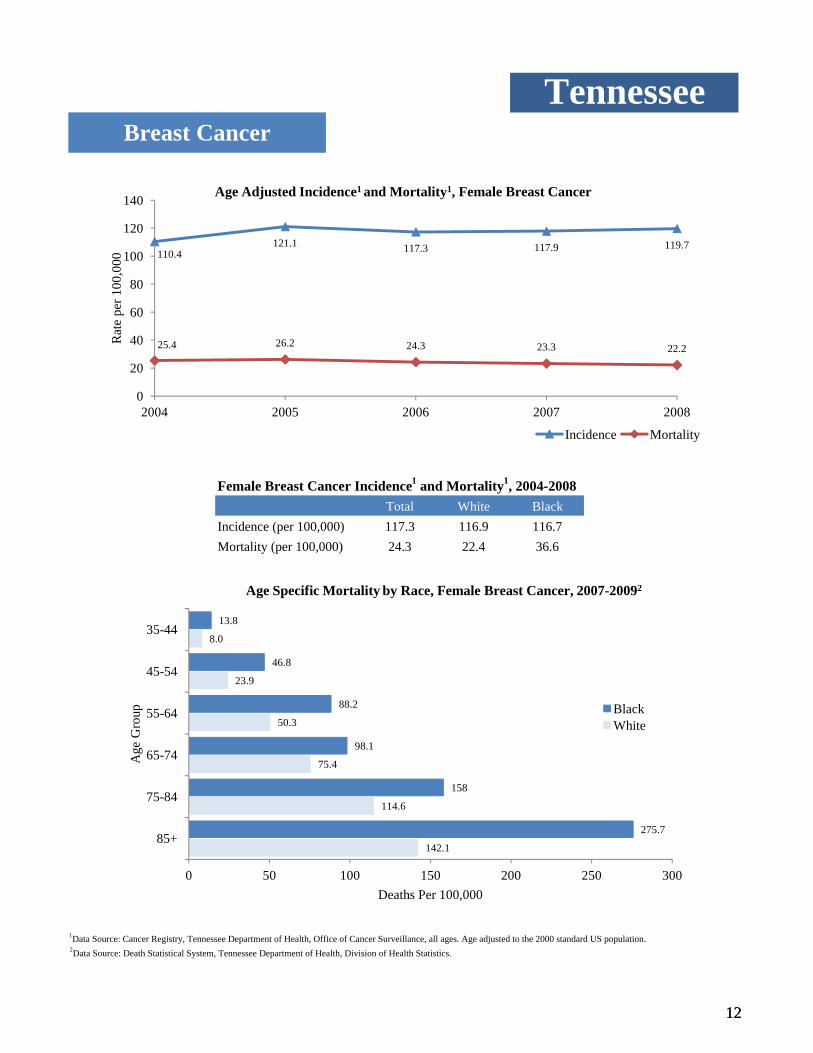
Incidence (per 100,000) 117.3 116.9 116.7Mortality (per 100,000) 24.3 22.4 36.6
TennesseeBreast Cancer
Female Breast Cancer Incidence1 and Mortality1, 2004-2008 Total White Black
110.4121.1 117.3 117.9 119.7
25.4 26.2 24.3 23.3 22.2
0
20
40
60
80
100
120
140
2004 2005 2006 2007 2008
Rat
e pe
r 100
,000
Age Adjusted Incidence1 and Mortality1, Female Breast Cancer
Incidence Mortality
12
1Data Source: Cancer Registry, Tennessee Department of Health, Office of Cancer Surveillance, all ages. Age adjusted to the 2000 standard US population.2Data Source: Death Statistical System, Tennessee Department of Health, Division of Health Statistics.
142.1
114.6
75.4
50.3
23.9
8.0
275.7
158
98.1
88.2
46.8
13.8
0 50 100 150 200 250 300
85+
75-84
65-74
55-64
45-54
35-44
Deaths Per 100,000
Age
Gro
up
Age Specific Mortality by Race, Female Breast Cancer, 2007-20092
BlackWhite
12

Total White Black Female Male
TennesseeColorectal Cancer
Colorectal Cancer Incidence1 and Mortality1, 2004-2008
Mortality (per 100,000) 18.5 17.3 28.4 15.5 22.6Incidence (per 100,000) 48.8 47.3 58.6 42.2 57.5
48.9 52.0 48.9 47.7 47.0
19.3 18.8 17.5 18.6 18.2
0
20
40
60
80
100
2004 2005 2006 2007 2008
Rat
e p
er 1
00,0
00
Age Adjusted Incidence1 and Mortality1, Colorectal Cancer
Incidence Mortality
13
1Data Source: Cancer Registry, Tennessee Department of Health, Office of Cancer Surveillance, all ages. Age adjusted to the 2000 standard US population.
2Data Source: Death Statistical System, Tennessee Department of Health, Division of Health Statistics.
179.4
121.7
60.1
31.9
13.7
3.9
252.3
179.5
107.1
52.3
21.9
6.7
0 50 100 150 200 250 300
85+
75-84
65-74
55-64
45-54
35-44
Deaths Per 100,000
Age
Gro
up
Age Specific Mortality by Race, Colorectal Cancer, 2007-20092
BlackWhite
13
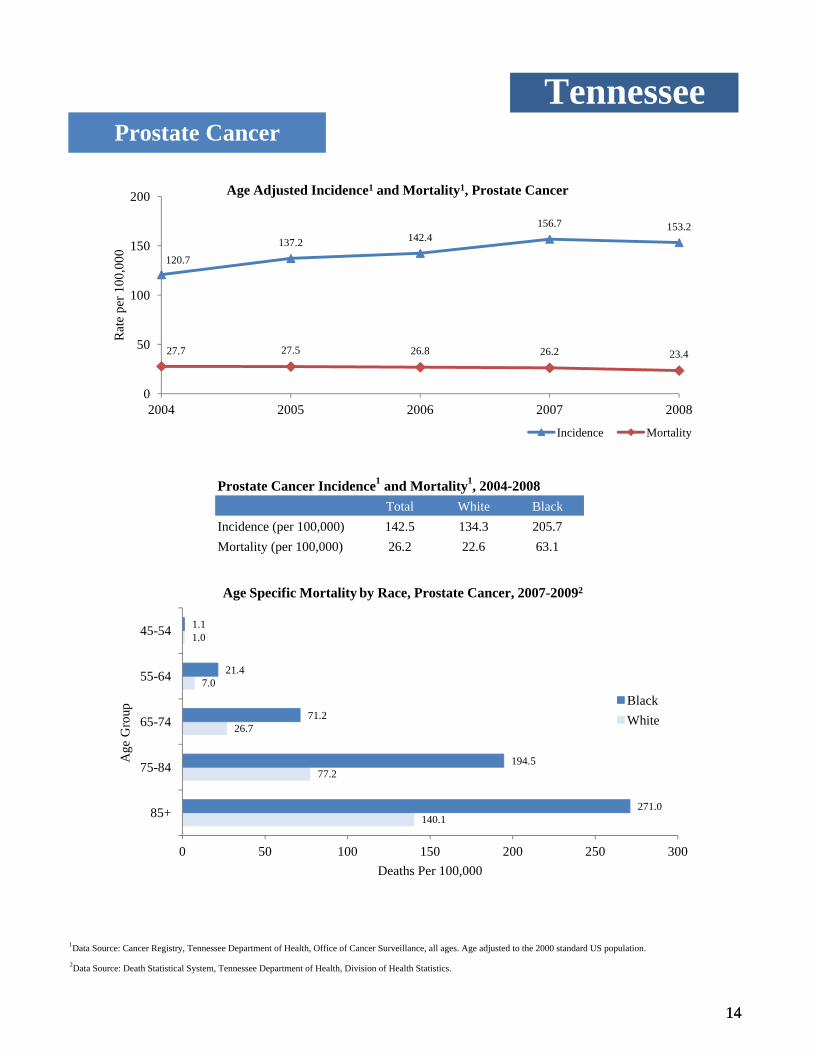
Incidence (per 100,000) 142.5 134.3 205.7Mortality (per 100,000) 26.2 22.6 63.1
TennesseeProstate Cancer
Prostate Cancer Incidence1 and Mortality1, 2004-2008Total White Black
120.7137.2 142.4
156.7 153.2
27.7 27.5 26.8 26.2 23.4
0
50
100
150
200
2004 2005 2006 2007 2008
Rat
e pe
r 100
,000
Age Adjusted Incidence1 and Mortality1, Prostate Cancer
Incidence Mortality
14
1Data Source: Cancer Registry, Tennessee Department of Health, Office of Cancer Surveillance, all ages. Age adjusted to the 2000 standard US population.
2Data Source: Death Statistical System, Tennessee Department of Health, Division of Health Statistics.
140.1
77.2
26.7
7.0
1.0
271.0
194.5
71.2
21.4
1.1
0 50 100 150 200 250 300
85+
75-84
65-74
55-64
45-54
Deaths Per 100,000
Age
Gro
up
Age Specific Mortality by Race, Prostate Cancer, 2007-20092
BlackWhite
14

Indicator Dav
idso
n
Eas
t
Ham
ilton
Kno
x
Mad
ison
Mid
-C
umbe
rlan
d
Nor
thea
st
Nor
thw
est
Shel
by
Sout
h C
entr
al
Sout
heas
t
Sout
hwes
t
Sulli
van
Upp
er-
Cum
berl
and
High School Education or Higher 4 11 3 2 6 1 8 9 4 9 13 12 7 14Individuals in Poverty 11 8 13 12 6 14 4 4 2 8 7 2 10 1Unemployment 12 9 8 14 6 13 6 4 2 5 3 1 11 10Crime 2 8 5 6 3 14 12 10 1 8 11 7 4 13Teen Pregnancy 2 8 6 14 3 13 12 7 1 4 9 5 11 10Infant Mortality 10 12 4 13 2 14 8 5 1 6 7 8 3 11Fair/Poor Health Status 14 1 11 13 6 10 5 7 11 4 2 3 8 9Lacking Health Insurance 9 3 14 13 8 11 10 4 12 5 2 6 7 1Ever Received Pneumonia Vaccination1 6 5 13 4 12 2 3 6 14 10 9 11 1 8Received Flu Shot in Past 12 Months2 10 5 13 2 8 9 3 4 7 11 14 12 1 6Eating <5 F&V3 14 1 11 10 4 12 13 3 7 8 5 2 9 6Not Meeting PA4 Recommendations 13 1 9 14 5 8 4 6 11 12 2 3 7 10Overweight or Obese 13 5 14 12 3 9 11 7 2 4 10 6 8 1Cholesterol Not Checked Within the Past 5 Years 2 8 11 3 10 6 13 5 12 9 1 14 7 4
Ever Told High Cholesterol 9 1 10 5 14 13 4 6 12 2 11 6 3 8Ever Told High Blood Pressure 14 3 10 9 13 12 7 2 1 8 6 5 4 11Current Cigarette Smoker 7 2 11 13 12 9 5 1 14 3 4 8 10 5Heavy Drinking 7 7 2 10 9 1 13 3 4 6 4 14 10 10Binge Drinking 1 7 3 9 2 11 14 12 5 13 8 4 6 10All Cause Mortality 9 8 13 12 14 11 7 1 6 4 3 2 10 5Heart Disease Mortality 10 12 8 14 11 9 3 1 6 5 7 2 13 4Myocardial Infarction Prevalence 14 5 8 13 12 7 1 2 9 6 10 4 3 11CHD5 Prevalence 11 10 14 9 7 11 1 3 13 8 6 4 2 5Stroke Mortality 10 11 9 12 1 5 13 4 3 7 6 2 14 8Stroke Prevalence 12 7 14 5 11 5 2 1 9 8 10 3 13 4CLRD6 Mortality 12 4 6 7 11 9 3 5 14 9 1 7 13 2Asthma Prevalence (Ever) 10 2 14 12 11 5 8 3 6 9 1 7 4 12Asthma Prevalence (Current) 12 1 11 10 12 8 3 5 7 9 2 6 4 14Diabetes Mortality 4 8 7 14 6 13 10 3 5 11 2 1 8 12Diabetes Prevalence 14 4 6 8 2 13 10 3 9 12 5 7 1 11Cancer Mortality 9 6 13 12 14 11 8 1 4 4 7 3 10 2Cancer Incidence 6 3 5 1 13 8 11 12 9 7 10 14 2 4Lung Cancer Incidence 8 2 10 5 12 9 7 1 14 6 11 13 3 4Breast Cancer Incidence 4 5 6 1 14 6 12 13 2 11 10 6 3 9Colorectal Cancer Incidence 8 10 11 13 4 7 14 5 1 3 9 2 12 6Prostate Cancer Incidence 6 5 3 2 11 8 14 13 1 12 10 4 9 7*Regional rankings are in descending order, where a rank of 1 indicates the highest value for that indicator among all regions.1For population age 65+. 2For population age 50+.3Fruit and vegetable.4Physical Activity.5Coronary heart disease.6Chronic lower respiratory disease.Data Sources:
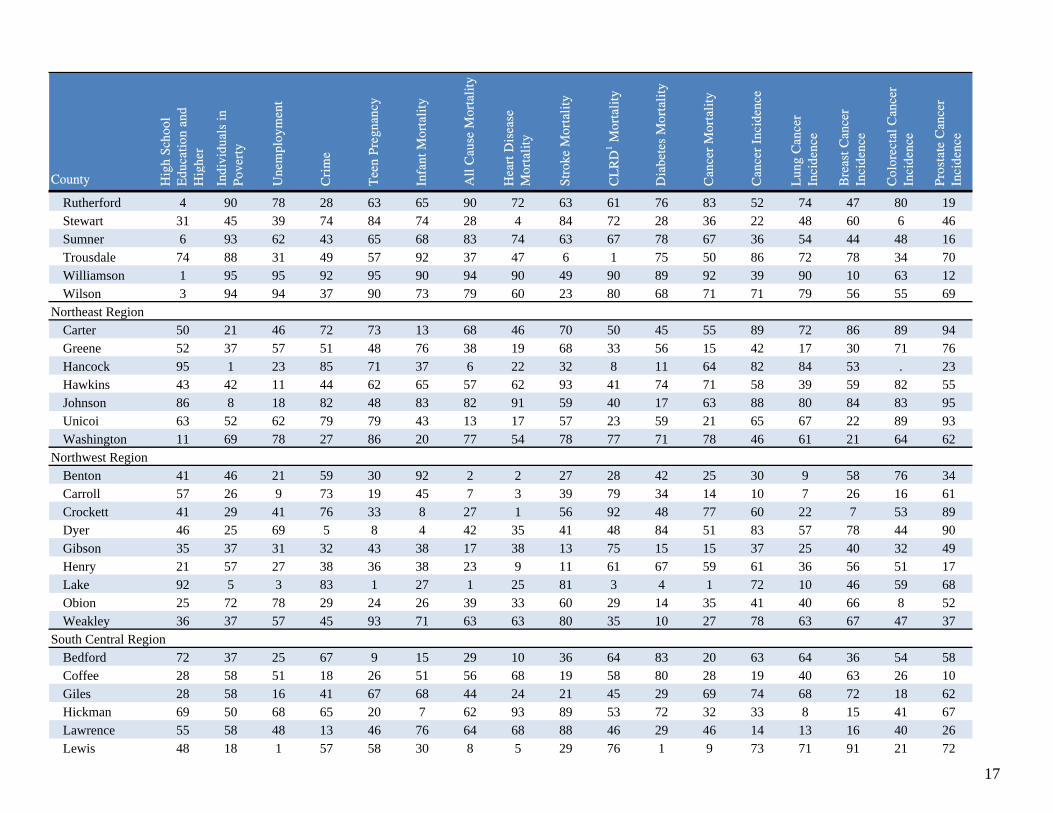
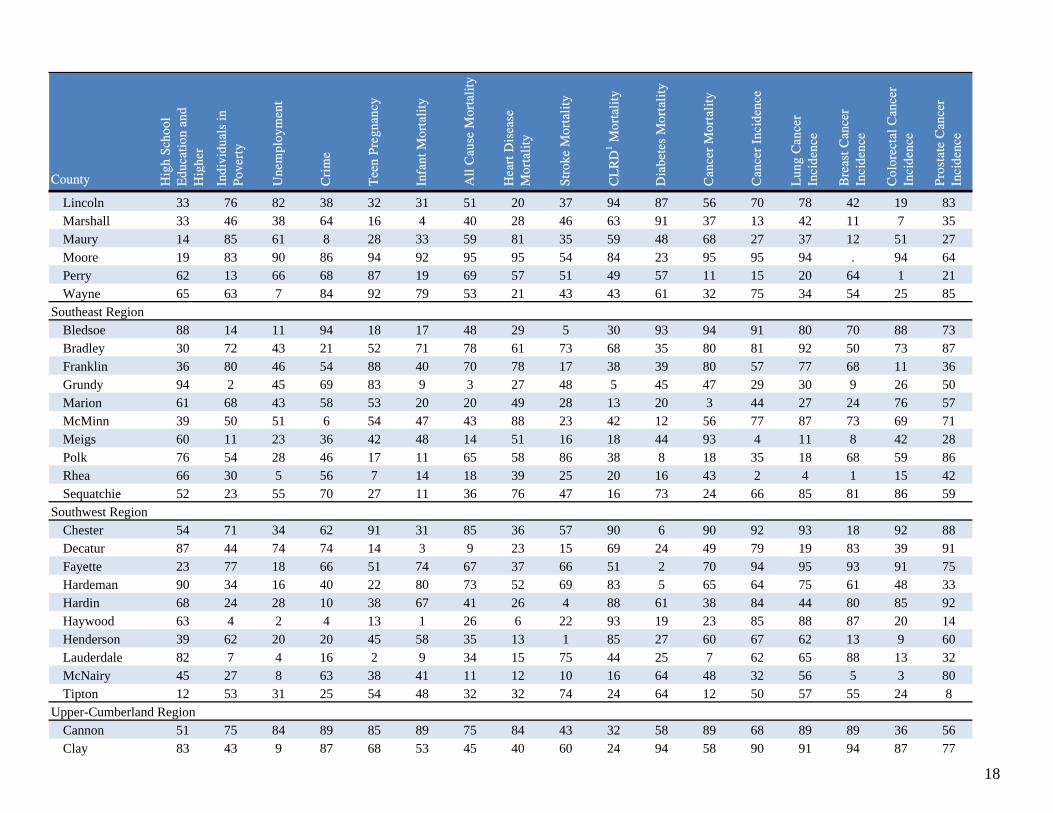
Tennessee Cancer Registry, 2004-2008: Cancer Mortality, Cancer Incidence, Lung Cancer Incidence, Breast Cancer Incidence, Colorectal Cancer Incidence, Prostate Cancer Incidence.
Regional Rankings of Selected Indicators, Tennessee*
U.S. Census Bureau, American Community Survey, 2005-2009: High School Education or Higher, Individuals in Poverty, Unemployment.Tennessee Bureau of Investigation, "Tennessee Incident Based Reporting System (TIBRS)" 2007-2009: Crime.Tennessee Birth Statistical System, Fetal Death Statistical System, and Induced Abortion Statistical System, 2007-2009: Teen Pregnancy.Tennessee Death Statistical System, 2007-2009: Infant Mortality, All Cause Mortality, Heart Disease Mortality, Stroke Mortality, CLRD Mortality, Diabetes Mortality.Tennessee Behavioral Risk Factor Surveillance System, 2009: Fair/Poor Health Status, Lacking Health Insurance, Ever Received Pneumonia Vaccination, Received Flu Shot in Past 12 Months, Eating <5 FV, Not Meeting PA Recommendations, Overweight or Obese, Cholesterol Not Checked Within the Past 5 Years, Ever Told High Cholesterol, Ever Told High Blood Pressure, Current Cigarette Smoker, Heavy Drinking, Binge Drinking, Myocardial Infarction Prevalence, CHD Prevalence, Stroke Prevalence, Asthma Prevalence Ever/Current, Diabetes Prevalence.
15

County Hig
h S
choo
l E
duca
tion
and
H
i ghe
r
Indi
vidu
als
in
Pov
erty
Une
mpl
oym
ent
Cri
me
Tee
n P
regn
ancy
Infa
nt M
orta
lity
All
Cau
se M
orta
lity
Hea
rt D
isea
se
Mor
tali
ty
Str
oke
Mor
tali
ty
CL
RD
1 Mor
tali
ty
Dia
bete
s M
orta
lity
Can
cer
Mor
tali
ty
Can
cer
Inci
denc
e
Lun
g C
ance
r In
cide
nce
Bre
ast C
ance
r In
cide
nce
Col
orec
tal C
ance
r In
cide
nce
Pro
stat
e C
ance
r In
cide
nce
Metropolitan CountiesDavidson 9 70 76 3 5 44 76 70 63 74 35 74 34 60 31 57 15Hamilton 7 77 57 9 41 29 87 67 55 56 50 84 31 70 37 67 9Knox 5 74 92 26 77 68 86 89 71 57 82 79 21 38 14 75 6Madison 14 48 51 2 10 17 88 71 20 72 43 73 54 76 52 37 44Shelby 9 34 30 1 3 6 55 55 26 89 38 41 43 86 23 22 4Sullivan 18 65 69 11 59 28 80 79 83 78 54 66 23 34 27 71 28
East RegionAnderson 17 63 67 19 78 83 81 84 92 66 81 52 28 50 41 31 11Blount 7 88 64 61 70 61 89 94 66 52 69 87 39 66 25 80 41Campbell 89 11 22 7 56 58 31 43 95 15 66 13 17 2 45 44 20Claiborne 84 31 51 34 79 24 16 11 49 36 69 4 18 5 28 29 45Cocke 77 15 26 23 22 35 25 8 77 86 52 44 51 47 75 61 53Grainger 93 55 55 71 61 85 24 41 62 27 45 6 8 14 34 43 18Hamblen 43 65 48 17 6 61 49 64 40 22 7 31 45 31 76 79 48Jefferson 48 49 48 49 44 24 30 66 34 47 9 34 7 26 20 56 24Loudon 13 86 76 47 40 88 91 86 72 87 52 82 15 53 35 84 1Monroe 74 56 13 42 24 63 61 65 38 53 41 42 48 32 77 57 24Morgan 67 20 69 90 82 76 47 92 82 18 63 9 1 1 2 4 22Roane 22 77 64 35 66 16 60 80 53 60 33 39 55 49 62 74 28Scott 59 9 15 14 34 86 22 45 94 4 18 19 37 15 71 12 74Sevier 27 83 87 12 15 36 84 50 87 95 88 86 20 43 37 50 13Union 91 32 93 81 47 80 66 77 52 12 31 62 80 57 90 35 37
Mid-Cumberland RegionCheatham 16 92 78 48 79 91 72 56 43 64 85 76 53 28 48 64 54Dickson 24 82 69 22 48 33 52 53 30 71 89 22 9 16 17 5 65Houston 26 21 14 33 4 87 54 83 2 14 85 53 49 45 29 2 47Humphreys 20 86 74 77 76 57 46 30 13 31 3 29 11 24 3 46 78Montgomery 2 81 82 15 21 48 71 82 12 26 37 60 58 46 51 61 51Robertson 32 91 69 53 11 58 33 14 8 81 32 26 47 68 48 37 40
County Rankings of Selected Indicators, Tennessee*
16
County Hig
h S
choo
l E
duca
tion
and
H
i ghe
r
Indi
vidu
als
in
Pov
erty
Une
mpl
oym
ent
Cri
me
Tee
n P
regn
ancy
Infa
nt M
orta
lity
All
Cau
se M
orta
lity
Hea
rt D
isea
se
Mor
tali
ty
Str
oke
Mor
tali
ty
CL
RD
1 Mor
tali
ty
Dia
bete
s M
orta
lity
Can
cer
Mor
tali
ty
Can
cer
Inci
denc
e
Lun
g C
ance
r In
cide
nce
Bre
ast C
ance
r In
cide
nce
Col
orec
tal C
ance
r In
cide
nce
Pro
stat
e C
ance
r In
cide
nce
Rutherford 4 90 78 28 63 65 90 72 63 61 76 83 52 74 47 80 19Stewart 31 45 39 74 84 74 28 4 84 72 28 36 22 48 60 6 46Sumner 6 93 62 43 65 68 83 74 63 67 78 67 36 54 44 48 16Trousdale 74 88 31 49 57 92 37 47 6 1 75 50 86 72 78 34 70Williamson 1 95 95 92 95 90 94 90 49 90 89 92 39 90 10 63 12Wilson 3 94 94 37 90 73 79 60 23 80 68 71 71 79 56 55 69
Northeast RegionCarter 50 21 46 72 73 13 68 46 70 50 45 55 89 72 86 89 94Greene 52 37 57 51 48 76 38 19 68 33 56 15 42 17 30 71 76Hancock 95 1 23 85 71 37 6 22 32 8 11 64 82 84 53 . 23Hawkins 43 42 11 44 62 65 57 62 93 41 74 71 58 39 59 82 55Johnson 86 8 18 82 48 83 82 91 59 40 17 63 88 80 84 83 95Unicoi 63 52 62 79 79 43 13 17 57 23 59 21 65 67 22 89 93Washington 11 69 78 27 86 20 77 54 78 77 71 78 46 61 21 64 62
Northwest RegionBenton 41 46 21 59 30 92 2 2 27 28 42 25 30 9 58 76 34Carroll 57 26 9 73 19 45 7 3 39 79 34 14 10 7 26 16 61Crockett 41 29 41 76 33 8 27 1 56 92 48 77 60 22 7 53 89Dyer 46 25 69 5 8 4 42 35 41 48 84 51 83 57 78 44 90Gibson 35 37 31 32 43 38 17 38 13 75 15 15 37 25 40 32 49Henry 21 57 27 38 36 38 23 9 11 61 67 59 61 36 56 51 17Lake 92 5 3 83 1 27 1 25 81 3 4 1 72 10 46 59 68Obion 25 72 78 29 24 26 39 33 60 29 14 35 41 40 66 8 52Weakley 36 37 57 45 93 71 63 63 80 35 10 27 78 63 67 47 37
South Central RegionBedford 72 37 25 67 9 15 29 10 36 64 83 20 63 64 36 54 58Coffee 28 58 51 18 26 51 56 68 19 58 80 28 19 40 63 26 10Giles 28 58 16 41 67 68 44 24 21 45 29 69 74 68 72 18 62Hickman 69 50 68 65 20 7 62 93 89 53 72 32 33 8 15 41 67Lawrence 55 58 48 13 46 76 64 68 88 46 29 46 14 13 16 40 26Lewis 48 18 1 57 58 30 8 5 29 76 1 9 73 71 91 21 72
17
County Hig
h S
choo
l E
duca
tion
and
H
i ghe
r
Indi
vidu
als
in
Pov
erty
Une
mpl
oym
ent
Cri
me
Tee
n P
regn
ancy
Infa
nt M
orta
lity
All
Cau
se M
orta
lity
Hea
rt D
isea
se
Mor
tali
ty
Str
oke
Mor
tali
ty
CL
RD
1 Mor
tali
ty
Dia
bete
s M
orta
lity
Can
cer
Mor
tali
ty
Can
cer
Inci
denc
e
Lun
g C
ance
r In
cide
nce
Bre
ast C
ance
r In
cide
nce
Col
orec
tal C
ance
r In
cide
nce
Pro
stat
e C
ance
r In
cide
nce
Lincoln 33 76 82 38 32 31 51 20 37 94 87 56 70 78 42 19 83Marshall 33 46 38 64 16 4 40 28 46 63 91 37 13 42 11 7 35Maury 14 85 61 8 28 33 59 81 35 59 48 68 27 37 12 51 27Moore 19 83 90 86 94 92 95 95 54 84 23 95 95 94 . 94 64Perry 62 13 66 68 87 19 69 57 51 49 57 11 15 20 64 1 21Wayne 65 63 7 84 92 79 53 21 43 43 61 32 75 34 54 25 85
Southeast RegionBledsoe 88 14 11 94 18 17 48 29 5 30 93 94 91 80 70 88 73Bradley 30 72 43 21 52 71 78 61 73 68 35 80 81 92 50 73 87Franklin 36 80 46 54 88 40 70 78 17 38 39 80 57 77 68 11 36Grundy 94 2 45 69 83 9 3 27 48 5 45 47 29 30 9 26 50Marion 61 68 43 58 53 20 20 49 28 13 20 3 44 27 24 76 57McMinn 39 50 51 6 54 47 43 88 23 42 12 56 77 87 73 69 71Meigs 60 11 23 36 42 48 14 51 16 18 44 93 4 11 8 42 28Polk 76 54 28 46 17 11 65 58 86 38 8 18 35 18 68 59 86Rhea 66 30 5 56 7 14 18 39 25 20 16 43 2 4 1 15 42Sequatchie 52 23 55 70 27 11 36 76 47 16 73 24 66 85 81 86 59
Southwest RegionChester 54 71 34 62 91 31 85 36 57 90 6 90 92 93 18 92 88Decatur 87 44 74 74 14 3 9 23 15 69 24 49 79 19 83 39 91Fayette 23 77 18 66 51 74 67 37 66 51 2 70 94 95 93 91 75Hardeman 90 34 16 40 22 80 73 52 69 83 5 65 64 75 61 48 33Hardin 68 24 28 10 38 67 41 26 4 88 61 38 84 44 80 85 92Haywood 63 4 2 4 13 1 26 6 22 93 19 23 85 88 87 20 14Henderson 39 62 20 20 45 58 35 13 1 85 27 60 67 62 13 9 60Lauderdale 82 7 4 16 2 9 34 15 75 44 25 7 62 65 88 13 32McNairy 45 27 8 63 38 41 11 12 10 16 64 48 32 56 5 3 80Tipton 12 53 31 25 54 48 32 32 74 24 64 12 50 57 55 24 8
Upper-Cumberland RegionCannon 51 75 84 89 85 89 75 84 43 32 58 89 68 89 89 36 56Clay 83 43 9 87 68 53 45 40 60 24 94 58 90 91 94 87 77
18

County Hig
h S
choo
l E
duca
tion
and
H
i ghe
r
Indi
vidu
als
in
Pov
erty
Une
mpl
oym
ent
Cri
me
Tee
n P
regn
ancy
Infa
nt M
orta
lity
All
Cau
se M
orta
lity
Hea
rt D
isea
se
Mor
tali
ty
Str
oke
Mor
tali
ty
CL
RD
1 Mor
tali
ty
Dia
bete
s M
orta
lity
Can
cer
Mor
tali
ty
Can
cer
Inci
denc
e
Lun
g C
ance
r In
cide
nce
Bre
ast C
ance
r In
cide
nce
Col
orec
tal C
ance
r In
cide
nce
Pro
stat
e C
ance
r In
cide
nce
Cumberland 38 58 34 29 29 55 92 75 90 82 92 91 26 82 32 78 7Dekalb 69 6 5 31 35 22 12 44 7 21 55 45 55 28 33 23 79Fentress 79 3 39 52 69 23 10 16 85 11 21 8 6 3 65 10 5Jackson 79 10 34 88 74 92 5 7 9 9 50 75 87 55 82 66 81Macon 77 15 34 80 12 54 4 18 33 7 77 2 24 22 6 13 43Overton 79 32 85 78 71 80 21 31 18 10 25 17 76 33 92 69 81Pickett 56 17 89 95 89 2 58 48 91 2 95 88 12 6 85 68 31Putnam 57 19 87 24 75 51 74 59 79 55 60 54 3 21 4 32 3Smith 46 65 86 91 63 46 15 73 3 6 13 5 69 52 74 30 66Van Buren 84 28 90 93 60 64 93 87 75 34 40 85 93 83 43 93 84Warren 73 41 60 59 37 55 50 34 42 70 79 30 25 51 39 17 39White 71 34 41 55 31 41 19 41 31 37 21 40 5 12 18 26 2
*County rankings are in descending order, where a rank of 1 indicates the highest value for that indicator among all counties. 1Chronic lower respiratory disease.Data Sources:
Tennessee Cancer Registry, 2004-2008: Cancer Mortality, Cancer Incidence, Lung Cancer Incidence, Breast Cancer Incidence, Colorectal Cancer Incidence, Prostate Cancer Incidence.
U.S. Census Bureau, American Community Survey, 2005-2009: High School Education or Higher, Individuals in Poverty, Unemployment.
Tennessee Bureau of Investigation, "Tennessee Incident Based Reporting System (TIBRS)" 2007-2009: Crime.
Tennessee Birth Statistical System, Fetal Death Statistical System, and Induced Abortion Statistical System, 2007-2009: Teen Pregnancy.
Tennessee Death Statistical System, 2007-2009: Infant Mortality, All Cause Mortality, Heart Disease Mortality, Stroke Mortality, CLRD Mortality, Diabetes Mortality.
19

County Hig
h S
choo
l E
duca
tion
and
H
i ghe
r
Indi
vidu
als
in
Pov
erty
Une
mpl
oym
ent
Cri
me
Tee
n P
regn
ancy
Infa
nt M
orta
lity
All
Cau
se
Mor
tali
ty
Hea
rt D
isea
se
Mor
tali
ty
Str
oke
Mor
tali
ty
CL
RD
1
Mor
talit
y
Dia
bete
s M
orta
lity
Can
cer
Mor
tali
ty
Can
cer
Inci
denc
e
Lun
g C
ance
r In
cide
nce
Bre
ast
Can
cer
Inci
denc
e
Col
orec
tal
Can
cer
Inci
denc
e
Pro
stat
e C
ance
r In
cide
nce
East RegionAnderson 3 10 11 5 13 12 12 12 13 12 14 11 8 12 8 4 2Blount 1 15 9 12 12 7 14 15 8 9 12 15 10 15 3 14 11Campbell 13 2 3 1 9 6 6 4 15 3 11 4 5 2 9 7 5Claiborne 12 5 7 7 14 2 1 2 4 7 12 1 6 3 4 3 12Cocke 11 3 4 6 3 4 4 1 10 13 8 10 13 10 12 11 14Grainger 15 8 8 13 10 13 3 3 7 6 7 2 3 4 5 6 4Hamblen 6 11 5 4 1 7 8 7 3 5 1 6 11 7 13 13 13Jefferson 7 7 5 11 7 2 5 9 1 8 2 7 2 6 2 9 7Loudon 2 14 13 10 6 15 15 13 9 14 8 13 4 13 6 15 1Monroe 10 9 1 9 4 9 10 8 2 10 6 9 12 8 14 10 7Morgan 9 4 12 15 15 10 7 14 11 4 10 3 1 1 1 1 6Roane 4 12 9 8 11 1 9 11 6 11 5 8 14 11 10 12 9Scott 8 1 2 3 5 14 2 5 14 1 3 5 9 5 11 2 15Sevier 5 13 14 2 2 5 13 6 12 15 15 14 7 9 7 8 3Union 14 6 15 14 8 11 11 10 5 2 4 12 15 14 15 5 10
Mid-Cumberland RegionCheatham 6 9 8 7 9 11 8 6 8 6 9 10 9 3 7 11 8Dickson 8 4 5 2 4 1 5 5 7 8 11 1 1 1 3 2 9Houston 9 1 1 4 1 9 6 11 1 2 9 6 7 4 4 1 6Humphreys 7 5 7 11 8 3 4 3 5 4 1 3 2 2 1 6 12Montgomery 2 3 10 1 3 2 7 10 4 3 4 7 10 5 9 9 7Robertson 11 8 5 9 2 4 2 2 3 11 3 2 6 8 7 5 4Rutherford 4 7 8 3 6 5 11 8 10 5 7 11 8 10 6 12 3Stewart 10 2 3 10 10 8 1 1 12 9 2 4 3 6 11 3 5Sumner 5 10 4 6 7 6 10 9 10 7 8 8 4 7 5 7 2Trousdale 12 6 2 8 5 12 3 4 2 1 6 5 12 9 12 4 11Williamson 1 12 12 12 12 10 12 12 9 12 11 12 5 12 2 10 1Wilson 3 11 11 5 11 7 9 7 6 10 5 9 11 11 10 8 10
Northeast RegionCarter 3 3 4 4 5 1 5 4 5 6 3 3 7 5 7 5 6
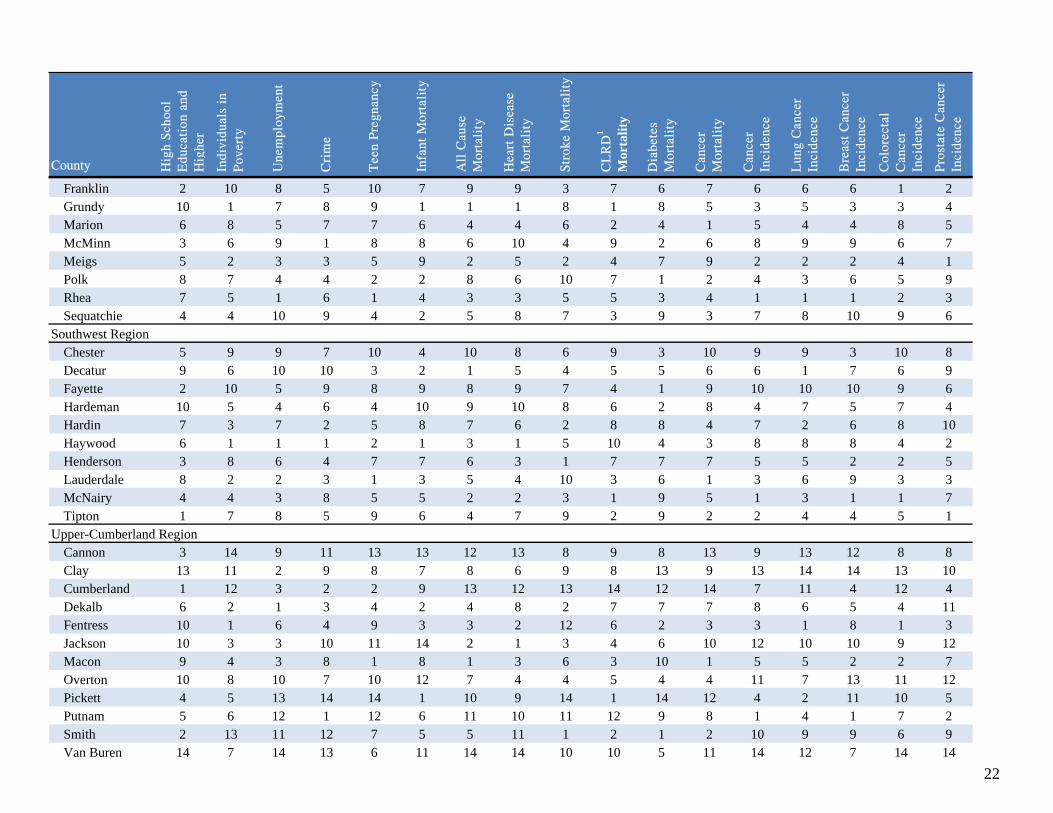
County Rankings of Selected Indicators by Rural Region, Tennessee*
20

County Hig
h S
choo
l E
duca
tion
and
H
i ghe
r
Indi
vidu
als
in
Pov
erty
Une
mpl
oym
ent
Cri
me
Tee
n P
regn
ancy
Infa
nt M
orta
lity
All
Cau
se
Mor
tali
ty
Hea
rt D
isea
se
Mor
tali
ty
Str
oke
Mor
tali
ty
CL
RD
1
Mor
talit
y
Dia
bete
s M
orta
lity
Can
cer
Mor
tali
ty
Can
cer
Inci
denc
e
Lun
g C
ance
r In
cide
nce
Bre
ast
Can
cer
Inci
denc
e
Col
orec
tal
Can
cer
Inci
denc
e
Pro
stat
e C
ance
r In
cide
nce
Greene 4 4 5 3 1 6 3 2 4 3 4 1 1 1 3 2 4Hancock 7 1 3 7 4 3 1 3 1 1 1 5 5 7 4 . 1Hawkins 2 5 1 2 3 5 4 6 7 5 7 6 3 2 5 3 2Johnson 6 2 2 6 1 7 7 7 3 4 2 4 6 6 6 4 7Unicoi 5 6 6 5 6 4 2 1 2 2 5 2 4 4 2 5 5Washington 1 7 7 1 7 2 6 5 6 7 6 7 2 3 1 1 3
Northwest RegionBenton 5 7 3 6 5 9 2 2 3 2 6 4 2 2 6 9 2Carroll 8 3 2 7 3 7 3 3 4 8 5 2 1 1 2 2 6Crockett 5 4 6 8 6 2 6 1 6 9 7 9 5 4 1 7 8Dyer 7 2 8 1 2 1 8 7 5 5 9 7 9 8 9 4 9Gibson 3 5 5 3 8 5 4 8 2 7 4 3 3 5 3 3 4Henry 1 8 4 4 7 5 5 4 1 6 8 8 6 6 5 6 1Lake 9 1 1 9 1 4 1 5 9 1 1 1 7 3 4 8 7Obion 2 9 9 2 4 3 7 6 7 3 3 6 4 7 7 1 5Weakley 4 5 7 5 9 8 9 9 8 4 2 5 8 9 8 5 3
South Central RegionBedford 12 3 4 9 1 3 2 2 5 9 10 3 7 8 5 11 6Coffee 3 6 7 3 4 8 7 8 1 6 9 4 4 6 8 7 1Giles 3 6 3 5 9 9 4 5 2 2 3 11 10 9 10 3 7Hickman 11 5 10 8 3 2 9 11 12 5 8 5 6 1 3 9 9Lawrence 8 6 6 2 7 10 10 8 11 3 3 8 2 2 4 8 3Lewis 7 2 1 6 8 5 1 1 3 10 1 1 9 10 11 5 10Lincoln 5 10 11 4 6 6 5 3 6 12 11 9 8 11 6 4 11Marshall 5 4 5 7 2 1 3 6 8 8 12 7 1 7 1 2 5Maury 1 12 8 1 5 7 8 10 4 7 5 10 5 5 2 10 4Moore 2 11 12 12 12 12 12 12 10 11 2 12 12 12 . 12 8Perry 9 1 9 10 10 4 11 7 9 4 6 2 3 3 9 1 2Wayne 10 9 2 11 11 11 6 4 7 1 7 5 11 4 7 6 12
Southeast RegionBledsoe 9 3 2 10 3 5 7 2 1 6 10 10 10 7 8 10 8Bradley 1 9 5 2 6 10 10 7 9 10 5 7 9 10 5 7 10
21
County Hig
h S
choo
l E
duca
tion
and
H
i ghe
r
Indi
vidu
als
in
Pov
erty
Une
mpl
oym
ent
Cri
me
Tee
n P
regn
ancy
Infa
nt M
orta
lity
All
Cau
se
Mor
tali
ty
Hea
rt D
isea
se
Mor
tali
ty
Str
oke
Mor
tali
ty
CL
RD
1
Mor
talit
y
Dia
bete
s M
orta
lity
Can
cer
Mor
tali
ty
Can
cer
Inci
denc
e
Lun
g C
ance
r In
cide
nce
Bre
ast
Can
cer
Inci
denc
e
Col
orec
tal
Can
cer
Inci
denc
e
Pro
stat
e C
ance
r In
cide
nce
Franklin 2 10 8 5 10 7 9 9 3 7 6 7 6 6 6 1 2Grundy 10 1 7 8 9 1 1 1 8 1 8 5 3 5 3 3 4Marion 6 8 5 7 7 6 4 4 6 2 4 1 5 4 4 8 5McMinn 3 6 9 1 8 8 6 10 4 9 2 6 8 9 9 6 7Meigs 5 2 3 3 5 9 2 5 2 4 7 9 2 2 2 4 1Polk 8 7 4 4 2 2 8 6 10 7 1 2 4 3 6 5 9Rhea 7 5 1 6 1 4 3 3 5 5 3 4 1 1 1 2 3Sequatchie 4 4 10 9 4 2 5 8 7 3 9 3 7 8 10 9 6
Southwest RegionChester 5 9 9 7 10 4 10 8 6 9 3 10 9 9 3 10 8Decatur 9 6 10 10 3 2 1 5 4 5 5 6 6 1 7 6 9Fayette 2 10 5 9 8 9 8 9 7 4 1 9 10 10 10 9 6Hardeman 10 5 4 6 4 10 9 10 8 6 2 8 4 7 5 7 4Hardin 7 3 7 2 5 8 7 6 2 8 8 4 7 2 6 8 10Haywood 6 1 1 1 2 1 3 1 5 10 4 3 8 8 8 4 2Henderson 3 8 6 4 7 7 6 3 1 7 7 7 5 5 2 2 5Lauderdale 8 2 2 3 1 3 5 4 10 3 6 1 3 6 9 3 3McNairy 4 4 3 8 5 5 2 2 3 1 9 5 1 3 1 1 7Tipton 1 7 8 5 9 6 4 7 9 2 9 2 2 4 4 5 1
Upper-Cumberland RegionCannon 3 14 9 11 13 13 12 13 8 9 8 13 9 13 12 8 8Clay 13 11 2 9 8 7 8 6 9 8 13 9 13 14 14 13 10Cumberland 1 12 3 2 2 9 13 12 13 14 12 14 7 11 4 12 4Dekalb 6 2 1 3 4 2 4 8 2 7 7 7 8 6 5 4 11Fentress 10 1 6 4 9 3 3 2 12 6 2 3 3 1 8 1 3Jackson 10 3 3 10 11 14 2 1 3 4 6 10 12 10 10 9 12Macon 9 4 3 8 1 8 1 3 6 3 10 1 5 5 2 2 7Overton 10 8 10 7 10 12 7 4 4 5 4 4 11 7 13 11 12Pickett 4 5 13 14 14 1 10 9 14 1 14 12 4 2 11 10 5Putnam 5 6 12 1 12 6 11 10 11 12 9 8 1 4 1 7 2Smith 2 13 11 12 7 5 5 11 1 2 1 2 10 9 9 6 9Van Buren 14 7 14 13 6 11 14 14 10 10 5 11 14 12 7 14 14
22

County Hig
h S
choo
l E
duca
tion
and
H
i ghe
r
Indi
vidu
als
in
Pov
erty
Une
mpl
oym
ent
Cri
me
Tee
n P
regn
ancy
Infa
nt M
orta
lity
All
Cau
se
Mor
tali
ty
Hea
rt D
isea
se
Mor
tali
ty
Str
oke
Mor
tali
ty
CL
RD
1
Mor
talit
y
Dia
bete
s M
orta
lity
Can
cer
Mor
tali
ty
Can
cer
Inci
denc
e
Lun
g C
ance
r In
cide
nce
Bre
ast
Can
cer
Inci
denc
e
Col
orec
tal
Can
cer
Inci
denc
e
Pro
stat
e C
ance
r In
cide
nce
Warren 8 10 8 6 5 9 9 5 7 13 11 5 6 8 6 3 6White 7 9 7 5 3 4 6 7 5 11 2 6 2 3 3 5 1
*County rankings are in descending order, where a rank of 1 indicates the highest value for that indicator among all counties. 1Chronic lower respiratory disease.Data Sources:
Tennessee Cancer Registry, 2004-2008: Cancer Mortality, Cancer Incidence, Lung Cancer Incidence, Breast Cancer Incidence, Colorectal Cancer Incidence, Prostate Cancer Incidence.
U.S. Census Bureau, American Community Survey, 2005-2009: High School Education or Higher, Individuals in Poverty, Unemployment.
Tennessee Bureau of Investigation, "Tennessee Incident Based Reporting System (TIBRS)" 2007-2009: Crime.
Tennessee Birth Statistical System, Fetal Death Statistical System, and Induced Abortion Statistical System, 2007-2009: Teen Pregnancy.
Tennessee Death Statistical System, 2007-2009: Infant Mortality, All Cause Mortality, Heart Disease Mortality, Stroke Mortality, CLRD Mortality, Diabetes Mortality.
23

Median Age1:
Median Income1:
Home Ownership1:
Unemployment1:
Crime Rate2 (per 1,000) : 135.7
Teen Pregnancy Rate3 (per 1,000)
Population by Age, Gender, and Race Distribution (2005-2009)1 Overall:
Age White:
Black:
Infant Mortality4 (per 1,000)
Overall:
<18 White:
18-44 Black:
45-6465+Total 320,072 301,393 377,094 167,959 49,038 621,465
12.1
76,385 70,242 100,626 35,721 5,252 146,627 Automobile Accident Deaths4 (per 100,000): 12.7
40,844
134,860 134,733 158,497 74,010 24,215 269,593
26,162 52,401 12,183 1,021 67,006
101.1
7.5
67,983 70,256 65,570 46,045 18,550 138,239 5.4
Female Male Non-Hispanic
White
Non-Hispanic
Black
Hispanic
6.8%
81.6
Gender Race Total 66.9
DavidsonDemographics Quick Facts
34.3
45,828
61.5%
48.5MaleDemographics, 2005-20091
$
24
1Data Source: U.S. Census Bureau, American Community Survey, 2005-2009.
4Data Source: Death Statistical System, Tennessee Department of Health, Division of Health Statistics, 2007-2009.
2Data Source: Tennessee Bureau of Investigation. "Tennessee Incident Based Reporting System (TIBRS)" accessed July 26, 2011. http://www.tennesseecrimeonline.com/tibrspublic2005, 2007-2009.
3Data Source: Birth Statistical System, Fetal Death Statistical System, and Induced Abortion Statistical System. Tennessee Department of Health, Division of Health Statistics, 2007-2009.
15.611.9
79.5
7.927.0
60.7
51.548.5
0 20 40 60 80 100
Individuals in PovertyFamilies in Poverty
HS Graduate
HispanicNH BlackNH White
Female Male
Percent
Demographics, 2005-20091
24
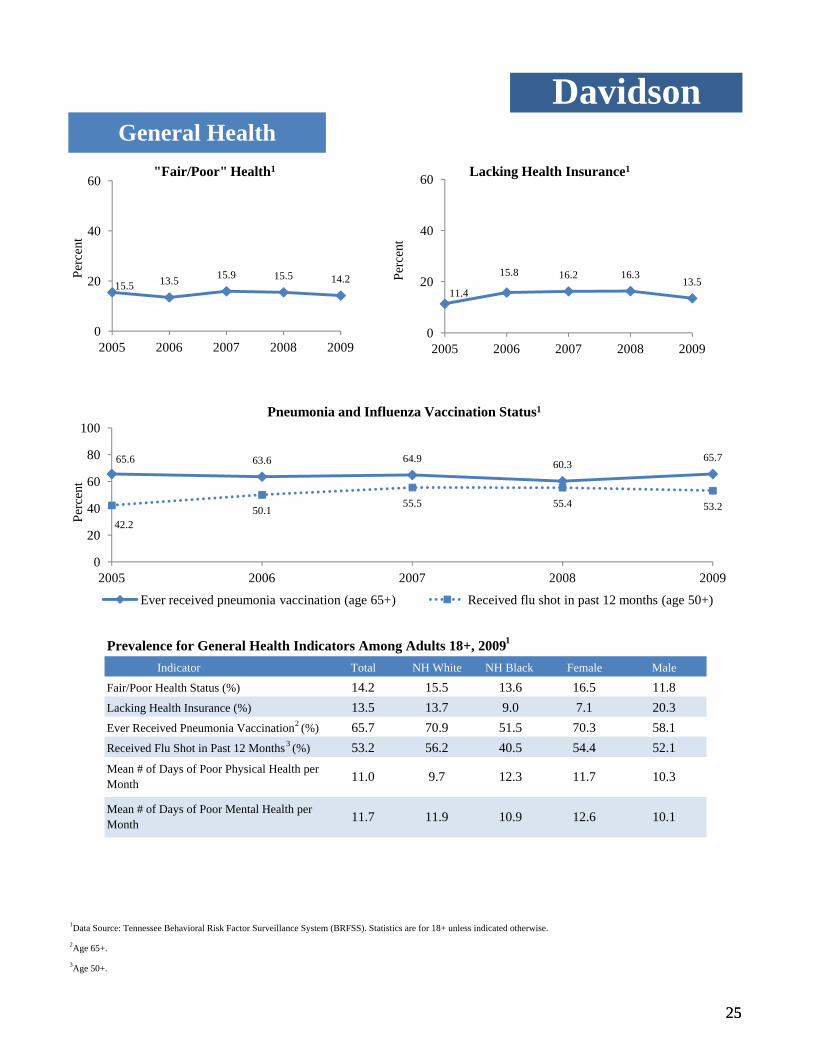
General HealthDavidson
15.5 13.5 15.9 15.5 14.2
0
20
40
60
2005 2006 2007 2008 2009
Perc
ent
"Fair/Poor" Health1
65.6 63.6 64.9 60.365.7
42.250.1
55.5 55.4 53.2
0
20
40
60
80
100
2005 2006 2007 2008 2009
Perc
ent
Pneumonia and Influenza Vaccination Status1
11.4
15.8 16.2 16.313.5
0
20
40
60
2005 2006 2007 2008 2009
Perc
ent
Lacking Health Insurance1
25
Prevalence for General Health Indicators Among Adults 18+, 20091
1Data Source: Tennessee Behavioral Risk Factor Surveillance System (BRFSS). Statistics are for 18+ unless indicated otherwise.
2Age 65+.
3Age 50+.
10.3
Mean # of Days of Poor Mental Health per Month 11.7 11.9 10.9 12.6 10.1
Mean # of Days of Poor Physical Health per Month 11.0 9.7 12.3 11.7
20.3
Male
Fair/Poor Health Status (%) 14.2 15.5 13.6 16.5 11.8
Received Flu Shot in Past 12 Months3 (%) 53.2 56.2 40.5 54.4 52.1Ever Received Pneumonia Vaccination2 (%) 65.7 70.9 51.5 70.3 58.1
Indicator Total NH White NH Black Female
Lacking Health Insurance (%) 13.5 13.7 9.0 7.1
0
20
2005 2006 2007 2008 2009
Ever received pneumonia vaccination (age 65+) Received flu shot in past 12 months (age 50+)
25

DavidsonBehavioral Risk Factors
35.8 35.5 33.3 33.0 34.7
27.031.8
28.0 29.5 29.2
0
20
40
60
2005 2006 2007 2008 2009
Perc
ent
Overweight and Obesity1
Overweight Obese
70.0 68.5 69.7
63.8 61.2 57.6
20
40
60
80
100
Perc
ent
Nutrition and Physical Activity1
22.6
28.7
21.6
31.0
25.4
30.8
20
40
60
Perc
ent
Cholesterol Screening and High Cholesterol1
26
Prevalence for Behavioral Risk Factors, 20091
1Data Source: Tennessee Behavioral Risk Factor Surveillance System (BRFSS). Statistics are for 18+ unless indicated otherwise.
Ever Told High Blood Pressure (%) 25.4 22.3 36.6 24.7 26.2
Ever Told High Cholesterol (%) 30.8 29.5 32.5 35.2 26.6
Have Not Checked Cholesterol Within the Past 5 Years (%)
21.6 21.7 17.9 22.0 21.1
Overweight or Obese (%) 63.9 57.8 78.8 56.6 71.3
Not Meeting Physical Activity Recommendations (%)
57.6 53.9 67.7 64.5 50.1
Eating <5 Fruits & Vegetables per Day (%) 69.7 62.1 83.2 70.9 68.5
Risk factor Total NH White NH Black Female Male
57.6
0
20
40
2005 2007 2009
Perc
e
Eating <5 Fruit Vegetables/Day
Not Meeting Physical Activity Recommendations
22.6 21.625.4
0
20
2005 2007 2009
Perc
en
Cholesterol Not Checked in 5 Years
Ever Told Had High Cholesterol
26
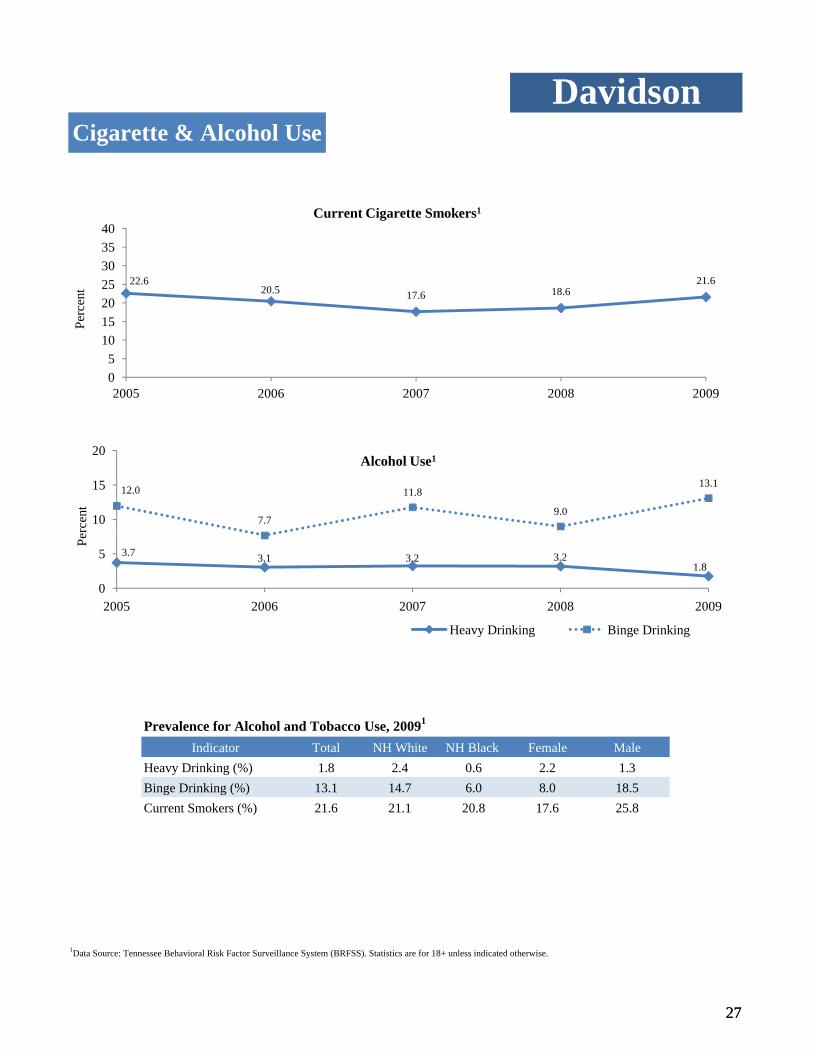
DavidsonCigarette & Alcohol Use
3.7 3.1 3.2 3.21.8
12.0
7.7
11.8
9.0
13.1
5
10
15
20
Perc
ent
Alcohol Use1
22.620.5 17.6 18.6
21.6
05
10152025303540
2005 2006 2007 2008 2009
Perc
ent
Current Cigarette Smokers1
27
Prevalence for Alcohol and Tobacco Use, 20091
1Data Source: Tennessee Behavioral Risk Factor Surveillance System (BRFSS). Statistics are for 18+ unless indicated otherwise.
Current Smokers (%) 21.6 21.1 20.8 17.6 25.8Binge Drinking (%) 13.1 14.7 6.0 8.0 18.5Heavy Drinking (%) 1.8 2.4 0.6 2.2 1.3
Indicator Total NH White NH Black Female Male
3.7 3.1 3.2 3.21.8
0
5
2005 2006 2007 2008 2009
Per
Heavy Drinking Binge Drinking
27
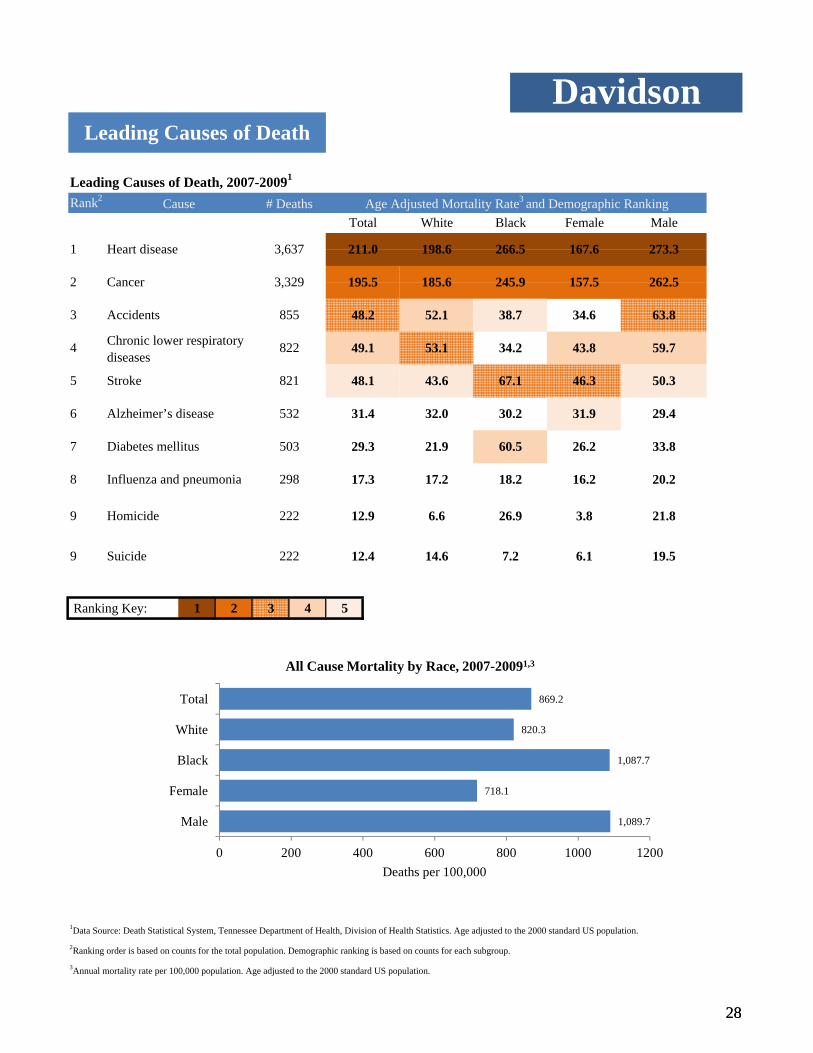
Leading Causes of Death, 2007-20091
Rank2
6.1 19.59 Suicide 222 12.4 14.6 7.2
16.2 20.2
9 Homicide 222 12.9 6.6 26.9 3.8 21.8
8 Influenza and pneumonia 298 17.3 17.2 18.2
31.9 29.4
7 Diabetes mellitus 503 29.3 21.9 60.5 26.2 33.8
6 Alzheimer’s disease 532 31.4 32.0 30.2
43.8 59.7
5 Stroke 821 48.1 43.6 67.1 46.3 50.3
4 Chronic lower respiratory diseases
822 49.1 53.1 34.2
3 Accidents 855 48.2 52.1 38.7 34.6 63.8
2 Cancer 3,329 195.5 185.6 245.9
1 Heart disease 3,637 211.0 198.6 266.5 167.6 273.3
157.5 262.5
DavidsonLeading Causes of Death
Cause # Deaths Age Adjusted Mortality Rate3 and Demographic RankingTotal White Black Female Male
28
Ranking Key: 1 2 3 4 5
1Data Source: Death Statistical System, Tennessee Department of Health, Division of Health Statistics. Age adjusted to the 2000 standard US population.
2Ranking order is based on counts for the total population. Demographic ranking is based on counts for each subgroup.
3Annual mortality rate per 100,000 population. Age adjusted to the 2000 standard US population.
1,089.7
718.1
1,087.7
820.3
869.2
0 200 400 600 800 1000 1200
Male
Female
Black
White
Total
Deaths per 100,000
All Cause Mortality by Race, 2007-20091,3
28

Heart Disease Mortality1 and Hospitialization2, 2007-2009
Heart Disease Prevalence3, 2009
Pre alence of CHD5 (%) 3 9 4 6 3 3 4 2 3 7Prevalence of MI4 (%) 2.9 3.6 2.1 1.9 4.0
Total NH White NH Black Female Male
Hospitalization (per 100,000) 1,154.6 1,041.4 1,481.2 925.1 1,445.7Mortality (per 100,000) 211.0 198.6 266.5 167.6 273.3
DavidsonHeart Disease
Total White Black Female Male
298 286286 276 265 268 255 237 238 221 218 221 194
1,462 1,449 1,437 1,393 1,409 1,373 1,354 1,323 1,270 1,289 1,229 1,1741,063
0
500
1000
1500
2000
1997 1999 2001 2003 2005 2007 2009
Rat
e Pe
r 100
,000
Age Adjusted Mortality1 and Hospitalization2, Heart Disease
Mortality Hospitalization
29
1Data Source: Death Statistical System, Tennessee Department of Health, Division of Health Statistics. Age adjustment based on the 2000 standard US population.
3Data Source: Tennessee Behavioral Risk Factor Surveillance System (BRFSS). Statistics are for 18+ unless indicated otherwise.
4MI= Myocardial Infarction.
5CHD=Coronary Heart Disease.
2Data Source: Hospital Discharge Data System, Tennessee Department of Health, Division of Health Statistics, 2007-2009. Data are for discharges, not necessarily for unique patients and are calculated for all ages. Age adjusted to 2000 US standard population.
Prevalence of CHD5 (%) 3.9 4.6 3.3 4.2 3.7
4,562.1
1,324.0
438.3
227.2
97.5
32.5
4,145.7
1,768.8
847.4
384.1
154.9
52.6
0 1000 2000 3000 4000 5000
85+
75-84
65-74
55-64
45-54
35-44
Deaths per 100,000
Age
Gro
up
Age Specific Mortality by Race, Heart Disease, 2007-20091
BlackWhite
29

Stroke Mortality1, Hospitialization2, and Prevalence3, 2007-2009
Prevalence4 (%) 2 0 1 5 3 6 2 8 1 1Hospitalization (per 100,000) 270.6 238.8 363.0 255.2 294.3Mortality (per 100,000) 48.1 43.6 67.1 46.3 50.3
DavidsonStroke
Total White Black Female Male
76 65 73 80 70 69 69 55 52 53 50 49 46
380 367 370 384361 343 347 329 328 321
280 274 258
0
100
200
300
400
500
1997 1999 2001 2003 2005 2007 2009
Rat
e pe
r 100
,000
Age Adjusted Mortality1 and Hospitalization2, Stroke
Mortality Hospitalization
30
1Data Source: Death Statistical System, Tennessee Department of Health, Division of Health Statistics. Age adjustment based on the 2000 standard US population.
3Data Source: Tennessee Behavioral Risk Factor Surveillance System (BRFSS). Statistics are for 18+ unless indicated otherwise.
42009 data, NH white and NH black race groups.
2Data Source: Hospital Discharge Data System, Tennessee Department of Health, Division of Health Statistics, 2007-2009. Data are for discharges, not necessarily for unique patients and are calculated for all ages. Age adjusted to the 2000 standard US population.
Prevalence4 (%) 2.0 1.5 3.6 2.8 1.1
958.3
317.8
119.2
39.8
14.0
5.7
987.1
497.2
173.6
119.1
32.5
19.1
0 200 400 600 800 1000 1200
85+
75-84
65-74
55-64
45-54
35-44
Deaths per 100,000
Age
Gro
up
Age Specific Mortality by Race, Stroke, 2007-20091
BlackWhite
30

Chronic Lower Respiratory Disease Mortality2 and Hospitialization3, 2007-2009
Currently Have Asthma (%) 5.7 7.3 3.2 7.0 4.3Ever Had Asthma (%) 9.2 11.5 6.3 10.6 7.8
Asthma Prevalence, 20094
Total NH White NH Black Female Male
Hospitalization (per 100,000) 334.4 304.6 406.2 384.8 283.5Mortality (per 100,000) 49.1 53.1 34.2 43.8 59.7
DavidsonCLRD1
Total White Black Female Male
45 43 47 43 48 49 53 48 46 48 47 54 47
434 392429
391 384 363 373341 354
321 318373
312
0
100
200
300
400
500
600
1997 1999 2001 2003 2005 2007 2009
Rat
e pe
r 100
,000
Age Adjusted Mortality2 and Hospitalization3, CLRD
Mortality Hospitalization
31
1CLRD= Chronic Lower Respiratory Disease.
2Data Source: Death Statistical System, Tennessee Department of Health, Division of Health Statistics. Age adjustment based on the 2000 standard US population.
4Data Source: Tennessee Behavioral Risk Factor Surveillance System (BRFSS). Statistics are for 18+ unless indicated otherwise.
3Data Source: Hospital Discharge Data System, Tennessee Department of Health, Division of Health Statistics, 2007-2009. Data are for discharges, not necessarily for unique patients and are calculated for all ages. Age adjusted to the 2000 standard US population.
9.6
5.4
7.6
9.1
5.7
0
2
4
6
8
10
12
2005 2006 2007 2008 2009
Perc
ent
Prevalence of Self-Reported Current Asthma4
720.8
416.4
206.1
64.6
24.2
3.4
482.6
286.8
117.4
41.3
8.9
4.8
0 200 400 600 800
85+
75-84
65-74
55-64
45-54
35-44
Deaths per 100,000
Age
Gro
up Black
White
Age Specific Mortality by Race, CLRD, 2007-20092
31
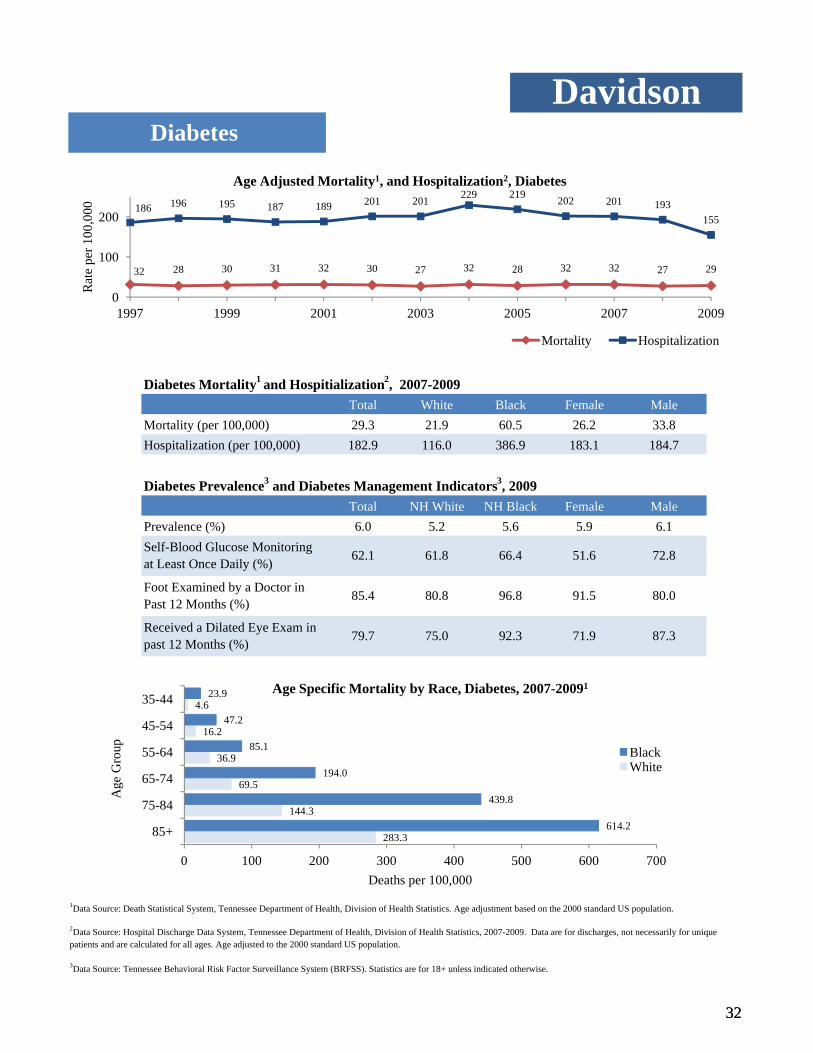
Self-Blood Glucose Monitoring at Least Once Daily (%) 62.1 61.8 66.4 51.6 72.8
Prevalence (%) 6.0 5.2 5.6 5.9 6.1
Diabetes Prevalence3 and Diabetes Management Indicators3, 2009Total NH White NH Black Female Male
Hospitalization (per 100,000) 182.9 116.0 386.9 183.1 184.7Mortality (per 100,000) 29.3 21.9 60.5 26.2 33.8
DavidsonDiabetes
Diabetes Mortality1 and Hospitialization2, 2007-2009 Total White Black Female Male
32 28 30 31 32 30 27 32 28 32 32 27 29
186 196 195 187 189 201 201 229 219 202 201 193155
0
100
200
1997 1999 2001 2003 2005 2007 2009
Rat
e pe
r 100
,000
Age Adjusted Mortality1, and Hospitalization2, Diabetes
Mortality Hospitalization
32
1Data Source: Death Statistical System, Tennessee Department of Health, Division of Health Statistics. Age adjustment based on the 2000 standard US population.
3Data Source: Tennessee Behavioral Risk Factor Surveillance System (BRFSS). Statistics are for 18+ unless indicated otherwise.
2Data Source: Hospital Discharge Data System, Tennessee Department of Health, Division of Health Statistics, 2007-2009. Data are for discharges, not necessarily for unique patients and are calculated for all ages. Age adjusted to the 2000 standard US population.
Received a Dilated Eye Exam in past 12 Months (%) 79.7 75.0 92.3 71.9 87.3
Foot Examined by a Doctor in Past 12 Months (%) 85.4 80.8 96.8 91.5 80.0
at Least Once Daily (%)
283.3
144.3
69.5
36.9
16.2
4.6
614.2
439.8
194.0
85.1
47.2
23.9
0 100 200 300 400 500 600 700
85+
75-84
65-74
55-64
45-54
35-44
Deaths per 100,000
Age
Gro
up
Age Specific Mortality by Race, Diabetes, 2007-20091
BlackWhite
32

Mortality (per 100,000) 194.7 187.8 233.5 159.3 252.4Incidence (per 100,000) 472.4 475.4 479.4 417.8 561.8
DavidsonCancer
Cancer Incidence1 and Mortality1, 2004-2008 Total White Black Female Male
438.6469.4 479.5 488.2 483.1
195.6 193.3 200.3 193.8 190.5
0
100
200
300
400
500
600
2004 2005 2006 2007 2008
Rat
e pe
r 100
,000
Age Adjusted Incidence1 and Mortality1, All Cancers
Incidence Mortality
33
1Data Source: Cancer Registry, Tennessee Department of Health, Office of Cancer Surveillance, all ages. Age adjusted to the 2000 standard US population.
2Data Source: Death Statistical System, Tennessee Department of Health, Division of Health Statistics.
1583.2
1376.9
707.8
323.0
132.5
27.4
1908.3
1673.2
985.2
459.4
183.0
49.4
0 500 1000 1500 2000 2500
85+
75-84
65-74
55-64
45-54
35-44
Deaths Per 100,000
Age
Gro
up
Age Specific Mortality by Race, All Cancer, 2007-20092
BlackWhite
33
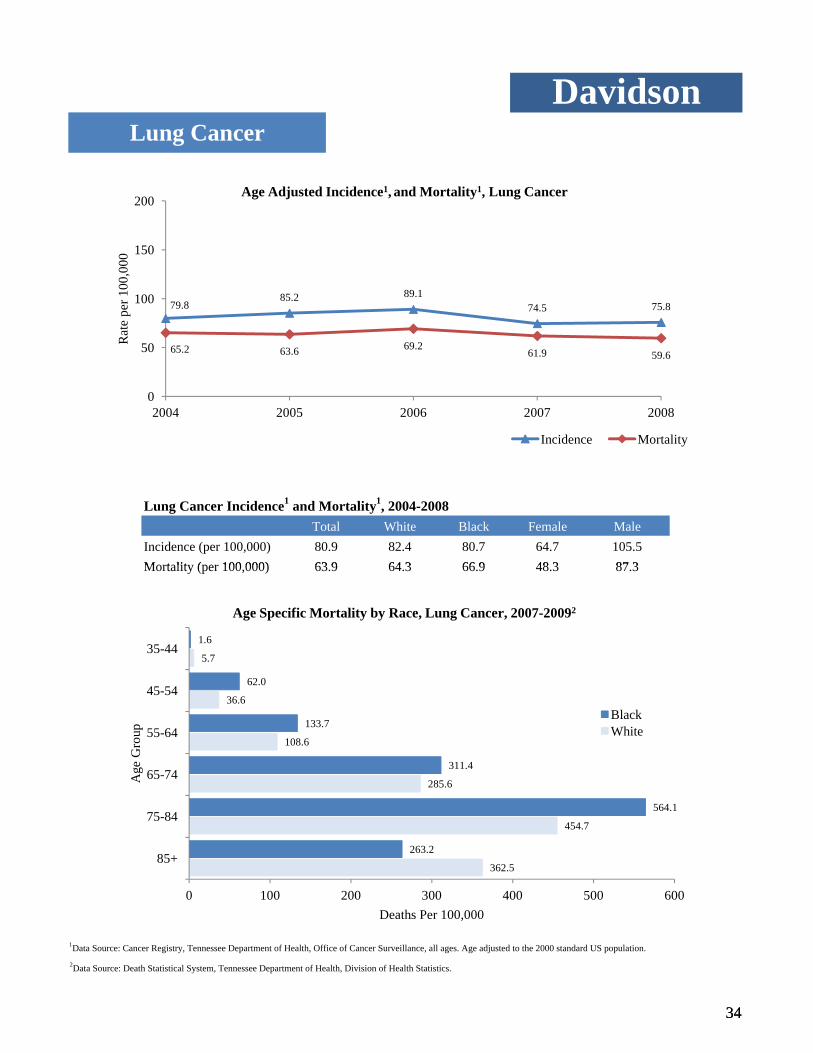
Mortalit (per 100 000) 63 9 64 3 66 9 48 3 87 3Incidence (per 100,000) 80.9 82.4 80.7 64.7 105.5
DavidsonLung Cancer
Lung Cancer Incidence1 and Mortality1, 2004-2008Total White Black Female Male
79.885.2 89.1
74.5 75.8
65.2 63.6 69.261.9 59.6
0
50
100
150
200
2004 2005 2006 2007 2008
Rat
e pe
r 100
,000
Age Adjusted Incidence1, and Mortality1, Lung Cancer
Incidence Mortality
34
1Data Source: Cancer Registry, Tennessee Department of Health, Office of Cancer Surveillance, all ages. Age adjusted to the 2000 standard US population.
2Data Source: Death Statistical System, Tennessee Department of Health, Division of Health Statistics.
Mortality (per 100,000) 63.9 64.3 66.9 48.3 87.3
362.5
454.7
285.6
108.6
36.6
5.7
263.2
564.1
311.4
133.7
62.0
1.6
0 100 200 300 400 500 600
85+
75-84
65-74
55-64
45-54
35-44
Deaths Per 100,000
Age
Gro
up
Age Specific Mortality by Race, Lung Cancer, 2007-20092
BlackWhite
34

Female Breast Cancer Incidence1 and Mortality1, 2004-2008
Incidence (per 100,000) 120.4 121.9 119.1Mortality (per 100,000) 24.2 22.2 29.9
DavidsonBreast Cancer
Total White Black
117.2 119.4 118.6127.9
118.8
21.6 25.2 24.6 24.8 24.4
0
50
100
150
200
2004 2005 2006 2007 2008
Rat
e pe
r 100
,000
Age Adjusted Incidence1 and Mortality1, Female Breast Cancer
Incidence Mortality
35
1Data Source: Cancer Registry, Tennessee Department of Health, Office of Cancer Surveillance, all ages. Age adjusted to the 2000 standard US population.2Data Source: Death Statistical System, Tennessee Department of Health, Division of Health Statistics.
153.4
101.5
86.2
56.1
27.0
3.7
366.2
87.7
62.0
83.5
43.5
23.9
0 50 100 150 200 250 300 350 400
85+
75-84
65-74
55-64
45-54
35-44
Deaths Per 100,000
Age
Gro
up
Age Specific Mortality by Race, Female Breast Cancer, 2007-20092
BlackWhite
35

Mortality (per 100,000) 17.7 15.9 26.1 14.5 22.5Incidence (per 100,000) 46.9 44.7 55.6 40.6 55.7
Total White Black Female Male
DavidsonColorectal Cancer
Colorectal Cancer Incidence1 and Mortality1, 2004-2008
45.2 44.8 47.2 47.3 49.6
17.8 16.5 16.6 18.5 19.2
0
20
40
60
80
100
2004 2005 2006 2007 2008
Rat
e p
er 1
00,0
00
Age Adjusted Incidence1 and Mortality1, Colorectal Cancer
Incidence Mortality
36
1Data Source: Cancer Registry, Tennessee Department of Health, Office of Cancer Surveillance, all ages. Age adjusted to the 2000 standard US population.
2Data Source: Death Statistical System, Tennessee Department of Health, Division of Health Statistics.
183.3
107.7
47.2
30.5
10.2
4.0
307.1
143.4
102.1
58.3
1.4
11.2
0 50 100 150 200 250 300 350
85+
75-84
65-74
55-64
45-54
35-44
Deaths Per 100,000
Age
Gro
up
Age Specific Mortality by Race, Colorectal Cancer, 2007-20092
BlackWhite
36
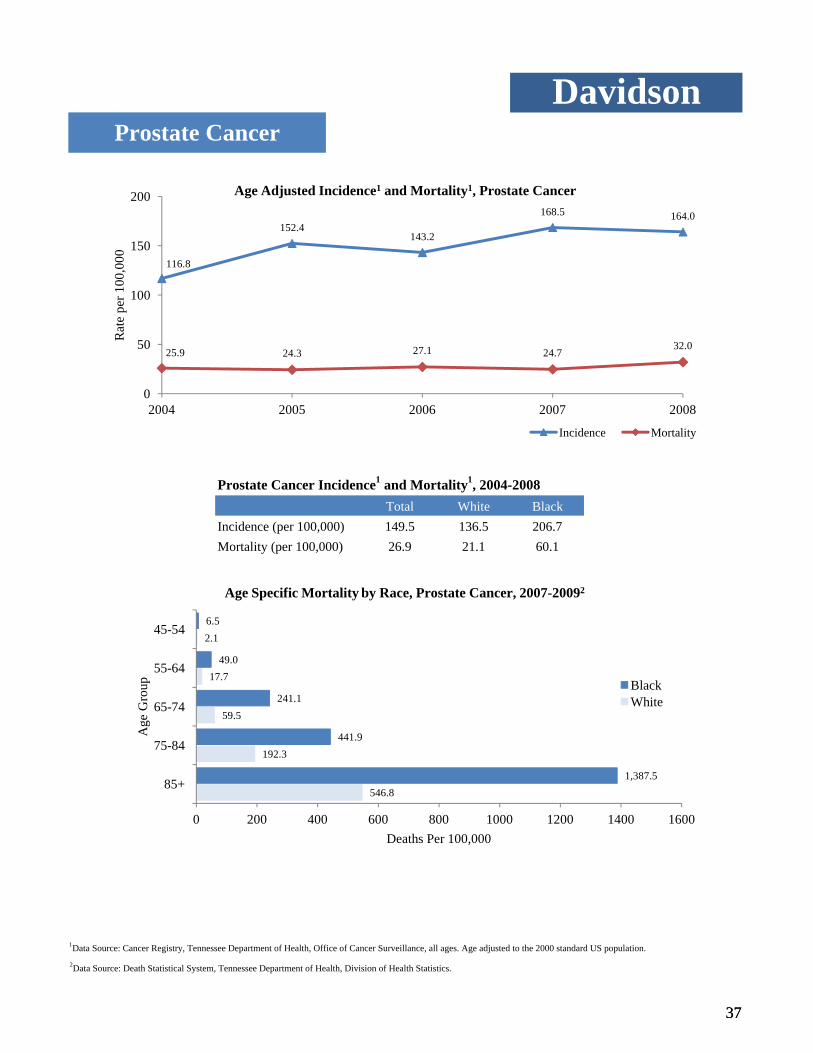
Prostate Cancer Incidence1 and Mortality1, 2004-2008
Incidence (per 100,000) 149.5 136.5 206.7Mortality (per 100,000) 26.9 21.1 60.1
DavidsonProstate Cancer
Total White Black
116.8
152.4143.2
168.5 164.0
25.9 24.3 27.1 24.732.0
0
50
100
150
200
2004 2005 2006 2007 2008
Rat
e pe
r 100
,000
Age Adjusted Incidence1 and Mortality1, Prostate Cancer
Incidence Mortality
37
1Data Source: Cancer Registry, Tennessee Department of Health, Office of Cancer Surveillance, all ages. Age adjusted to the 2000 standard US population.
2Data Source: Death Statistical System, Tennessee Department of Health, Division of Health Statistics.
546.8
192.3
59.5
17.7
2.1
1,387.5
441.9
241.1
49.0
6.5
0 200 400 600 800 1000 1200 1400 1600
85+
75-84
65-74
55-64
45-54
Deaths Per 100,000
Age
Gro
up
Age Specific Mortality by Race, Prostate Cancer, 2007-20092
BlackWhite
37
Median Age1:
Median Income1:
Home Ownership1:
Unemployment1:
Crime Rate2 (per 1,000) : 94.4
Teen Pregnancy Rate3 (per 1,000)
Population by Age, Gender, and Race Distribution (2005-2009)1 Overall:
Age White:
Black:
Infant Mortality4 (per 1,000)
Overall:
<18 White:
18-44 Black:
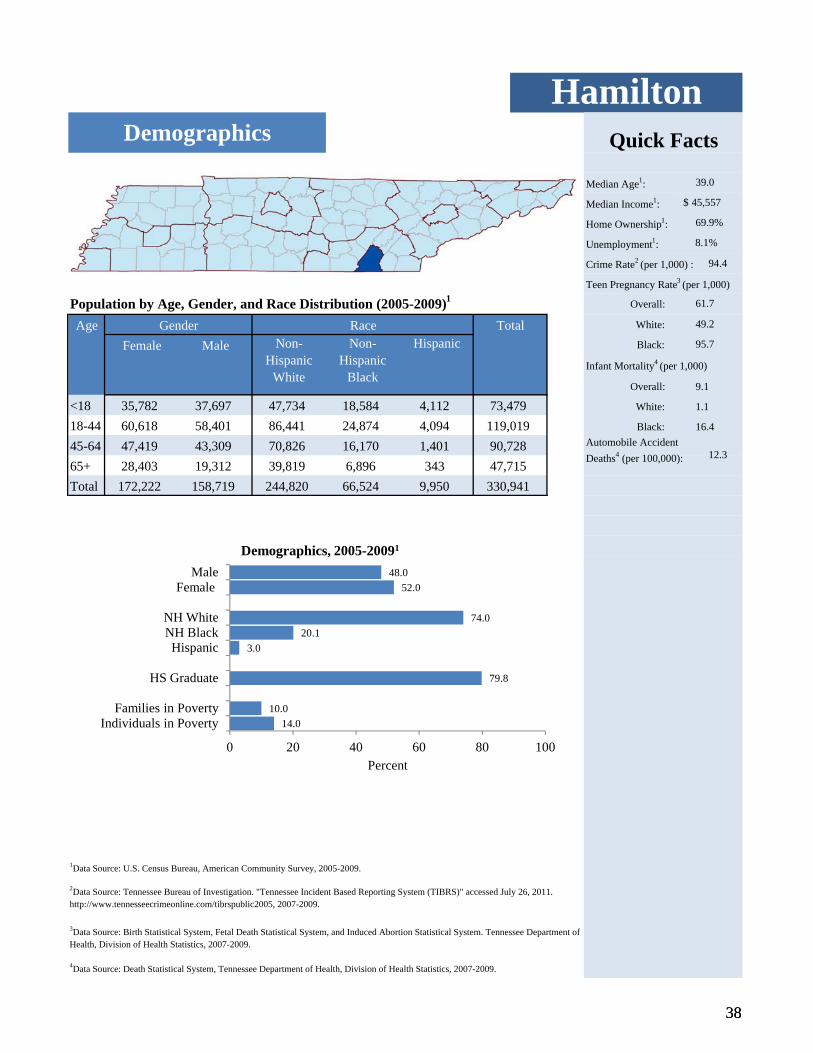
45-6465+Total 172,222 158,719 244,820 66,524 9,950 330,941
16.4
47,419 43,309 70,826 16,170 1,401 90,728 Automobile Accident Deaths4 (per 100,000): 12.3
28,403
60,618 58,401 86,441 24,874 4,094 119,019
19,312 39,819 6,896 343 47,715
95.7
9.1
35,782 37,697 47,734 18,584 4,112 73,479 1.1
Female Male Non-Hispanic
White
Non-Hispanic
Black
Hispanic
8.1%
61.7
Gender Race Total 49.2
HamiltonDemographics Quick Facts
39.0
45,557
69.9%
48.0MaleDemographics, 2005-20091
$
38
1Data Source: U.S. Census Bureau, American Community Survey, 2005-2009.
4Data Source: Death Statistical System, Tennessee Department of Health, Division of Health Statistics, 2007-2009.
2Data Source: Tennessee Bureau of Investigation. "Tennessee Incident Based Reporting System (TIBRS)" accessed July 26, 2011. http://www.tennesseecrimeonline.com/tibrspublic2005, 2007-2009.
3Data Source: Birth Statistical System, Fetal Death Statistical System, and Induced Abortion Statistical System. Tennessee Department of Health, Division of Health Statistics, 2007-2009.
14.010.0
79.8
3.020.1
74.0
52.048.0
0 20 40 60 80 100
Individuals in PovertyFamilies in Poverty
HS Graduate
HispanicNH BlackNH White
Female Male
Percent
Demographics, 2005-20091
38
General HealthHamilton
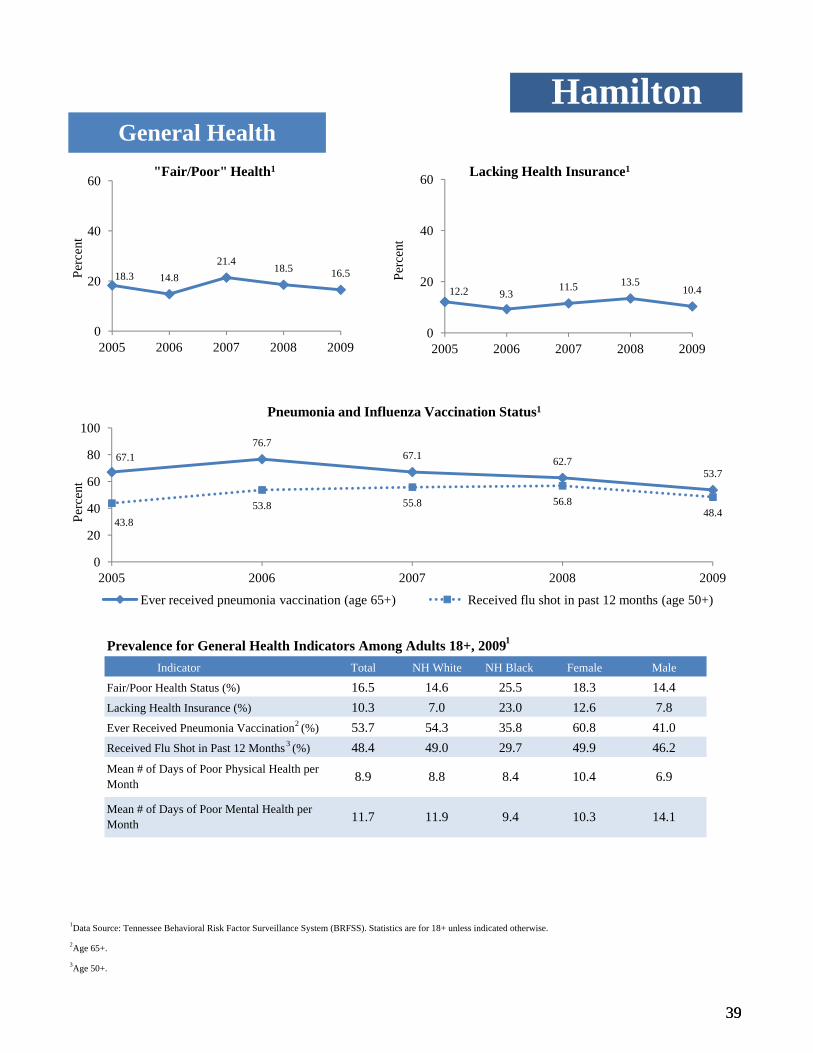
18.3 14.821.4
18.5 16.5
0
20
40
60
2005 2006 2007 2008 2009
Perc
ent
"Fair/Poor" Health1
67.176.7
67.1 62.753.7
43.853.8 55.8 56.8
48.4
0
20
40
60
80
100
2005 2006 2007 2008 2009
Perc
ent
Pneumonia and Influenza Vaccination Status1
12.2 9.311.5 13.5
10.4
0
20
40
60
2005 2006 2007 2008 2009
Perc
ent
Lacking Health Insurance1
39
Prevalence for General Health Indicators Among Adults 18+, 20091
1Data Source: Tennessee Behavioral Risk Factor Surveillance System (BRFSS). Statistics are for 18+ unless indicated otherwise.
2Age 65+.
3Age 50+.
6.9
Mean # of Days of Poor Mental Health per Month 11.7 11.9 9.4 10.3 14.1
Mean # of Days of Poor Physical Health per Month 8.9 8.8 8.4 10.4
7.8
Male
Fair/Poor Health Status (%) 16.5 14.6 25.5 18.3 14.4
Received Flu Shot in Past 12 Months3 (%) 48.4 49.0 29.7 49.9 46.2Ever Received Pneumonia Vaccination2 (%) 53.7 54.3 35.8 60.8 41.0
Indicator Total NH White NH Black Female
Lacking Health Insurance (%) 10.3 7.0 23.0 12.6
0
20
2005 2006 2007 2008 2009
Ever received pneumonia vaccination (age 65+) Received flu shot in past 12 months (age 50+)
39

HamiltonBehavioral Risk Factors
32.4 33.6 35.740.6
25.827.3
25.727.8
32.4
31.0
0
20
40
60
2005 2006 2007 2008 2009
Perc
ent
Overweight and Obesity1
Overweight Obese
73.8 71.7 73.8
63.2 64.7 63.6
20
40
60
80
100
Perc
ent
Nutrition and Physical Activity1
25.0
17.3 16 8
27.7 29.9 30.4
20
40
60
Perc
ent
Cholesterol Screening and High Cholesterol1
40
Prevalence for Behavioral Risk Factors, 20091
1Data Source: Tennessee Behavioral Risk Factor Surveillance System (BRFSS). Statistics are for 18+ unless indicated otherwise.
Ever Told High Blood Pressure (%) 31.1 26.9 47.7 31.5 30.7
Ever Told High Cholesterol (%) 30.4 32.4 32.2 30.8 30.0
Have Not Checked Cholesterol Within the Past 5 Years (%)
16.8 17.3 17.2 17.5 16.1
Overweight or Obese (%) 56.8 53.5 76.3 54.2 59.5
Not Meeting Physical Activity Recommendations (%)
63.6 62.1 80.3 67.0 59.5
Eating <5 Fruits & Vegetables per Day (%) 73.8 70.1 86.2 76.4 70.7
Risk factor Total NH White NH Black Female Male
0
20
40
2005 2007 2009
Perc
e
Eating <5 Fruit Vegetables/Day
Not Meeting Physical Activity Recommendations
25.0
17.3 16.8
0
20
2005 2007 2009
Perc
en
Cholesterol Not Checked in 5 Years
Ever Told Had High Cholesterol
40

HamiltonCigarette & Alcohol Use
6.1
4.74.1
2.3 2.7
10.0
6.18.6
12.410.2
5
10
15
20
Perc
ent
Alcohol Use1
22.7
17.6
22.6 23.5
17.6
05
10152025303540
2005 2006 2007 2008 2009
Perc
ent
Current Cigarette Smokers1
41
Prevalence for Alcohol and Tobacco Use, 20091
1Data Source: Tennessee Behavioral Risk Factor Surveillance System (BRFSS). Statistics are for 18+ unless indicated otherwise.
Current Smokers (%) 17.6 18.5 10.1 17.8 17.5Binge Drinking (%) 10.2 9.1 14.5 10.7 9.5Heavy Drinking (%) 2.7 3.0 1.0 3.5 1.8
Indicator Total NH White NH Black Female Male
6.1
4.74.1
2.3 2.7
6.1
0
5
2005 2006 2007 2008 2009
Per
Heavy Drinking Binge Drinking
41

Leading Causes of Death, 2007-20091
Rank2
9.1 15.210 Kidney disease 125 11.1 8.6 26.7
12.9 14.7
9 Suicide 129 13.4 15.1 7.2 6.7 20.6
8 Influenza and pneumonia 154 13.7 13.6 13.7
26.8 58.0
7 Diabetes mellitus 307 27.4 22.7 54.0 24.7 31.7
6 Accidents 409 40.8 42.7 34.7
49.1 49.7
5 Alzheimer’s disease 486 41.2 42.7 34.3 44.2 34.5
4 Stroke 565 49.7 48.4 55.0
3 Chronic lower respiratory diseases
615 54.6 54.9 54.7 46.4 69.0
2 Cancer 2,051 183.9 177.1 226.8
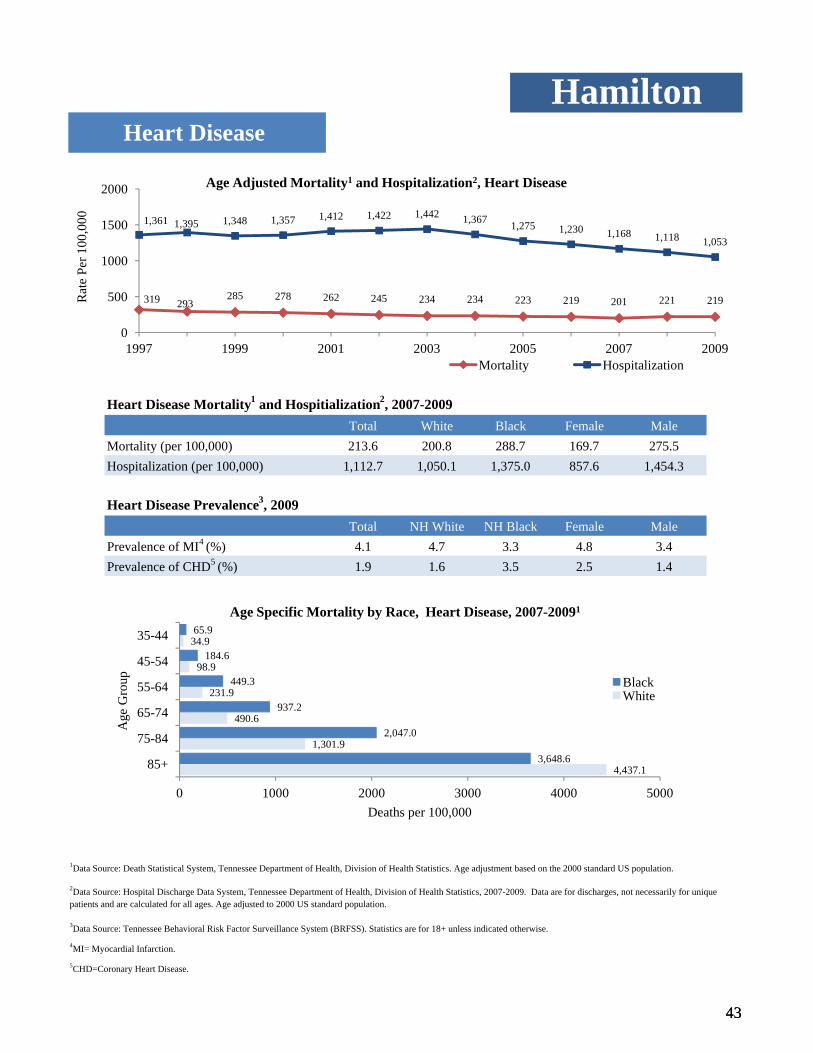
1 Heart disease 2,450 213.6 200.8 288.7 169.7 275.5
145.7 245.9
HamiltonLeading Causes of Death
Cause # Deaths Age Adjusted Mortality Rate3 and Demographic RankingTotal White Black Female Male
42
Ranking Key: 1 2 3 4 5
1Data Source: Death Statistical System, Tennessee Department of Health, Division of Health Statistics. Age adjusted to the 2000 standard US population.
2Ranking order is based on counts for the total population. Demographic ranking is based on counts for each subgroup.
3Annual mortality rate per 100,000 population. Age adjusted to the 2000 standard US population.
y
1,045.3
704.4
1,040.2
809.5
845.2
0 200 400 600 800 1000 1200
Male
Female
Black
White
Total
Deaths per 100,000
All Cause Mortality by Race, 2007-20091,3
42
Heart Disease Mortality1 and Hospitialization2, 2007-2009
Heart Disease Prevalence3, 2009
Pre alence of CHD5 (%) 1 9 1 6 3 5 2 5 1 4Prevalence of MI4 (%) 4.1 4.7 3.3 4.8 3.4
Total NH White NH Black Female Male
Hospitalization (per 100,000) 1,112.7 1,050.1 1,375.0 857.6 1,454.3Mortality (per 100,000) 213.6 200.8 288.7 169.7 275.5
HamiltonHeart Disease
Total White Black Female Male
319 293285 278 262 245 234 234 223 219 201 221 219
1,361 1,395 1,348 1,357 1,412 1,422 1,442 1,367 1,275 1,230 1,168 1,118 1,053
0
500
1000
1500
2000
1997 1999 2001 2003 2005 2007 2009
Rat
e Pe
r 100
,000
Age Adjusted Mortality1 and Hospitalization2, Heart Disease
Mortality Hospitalization
43
1Data Source: Death Statistical System, Tennessee Department of Health, Division of Health Statistics. Age adjustment based on the 2000 standard US population.
3Data Source: Tennessee Behavioral Risk Factor Surveillance System (BRFSS). Statistics are for 18+ unless indicated otherwise.
4MI= Myocardial Infarction.
5CHD=Coronary Heart Disease.
2Data Source: Hospital Discharge Data System, Tennessee Department of Health, Division of Health Statistics, 2007-2009. Data are for discharges, not necessarily for unique patients and are calculated for all ages. Age adjusted to 2000 US standard population.
Prevalence of CHD5 (%) 1.9 1.6 3.5 2.5 1.4
4,437.1
1,301.9
490.6
231.9
98.9
34.9
3,648.6
2,047.0
937.2
449.3
184.6
65.9
0 1000 2000 3000 4000 5000
85+
75-84
65-74
55-64
45-54
35-44
Deaths per 100,000
Age
Gro
up
Age Specific Mortality by Race, Heart Disease, 2007-20091
BlackWhite
43

Stroke Mortality1, Hospitialization2, and Prevalence3, 2007-2009
Prevalence4 (%) 1 3 1 5 1 0 1 6 1 0Hospitalization (per 100,000) 346.8 320.9 467.3 315.8 389.3Mortality (per 100,000) 49.7 48.4 55.0 49.1 49.6
HamiltonStroke
Total White Black Female Male
69 74 58 73 63 71 66 71 52 52 57 50 43
364 382422 440 436
477445
474424
393 374 361
307
0
100
200
300
400
500
1997 1999 2001 2003 2005 2007 2009
Rat
e pe
r 100
,000
Age Adjusted Mortality1 and Hospitalization2, Stroke
Mortality Hospitalization
44
1Data Source: Death Statistical System, Tennessee Department of Health, Division of Health Statistics. Age adjustment based on the 2000 standard US population.
3Data Source: Tennessee Behavioral Risk Factor Surveillance System (BRFSS). Statistics are for 18+ unless indicated otherwise.
42009 data, NH white and NH black race groups.
2Data Source: Hospital Discharge Data System, Tennessee Department of Health, Division of Health Statistics, 2007-2009. Data are for discharges, not necessarily for unique patients and are calculated for all ages. Age adjusted to the 2000 standard US population.
Prevalence4 (%) 1.3 1.5 1.0 1.6 1.0
1174.5
403.7
104.1
25.3
12.3
5.1
602.2
419.5
166.0
84.9
46.2
8.2
0 200 400 600 800 1000 1200 1400
85+
75-84
65-74
55-64
45-54
35-44
Deaths per 100,000
Age
Gro
up
Age Specific Mortality by Race, Stroke, 2007-20091
BlackWhite
44

Chronic Lower Respiratory Disease Mortality2 and Hospitialization3, 2007-2009
Currently Have Asthma (%) 5.8 4.1 8.3 8.3 3.0Ever Had Asthma (%) 7.2 5.5 9.3 9.5 4.6
Asthma Prevalence, 20094
Total NH White NH Black Female Male
Hospitalization (per 100,000) 260.0 238.1 355.5 289.2 235.0Mortality (per 100,000) 54.6 54.9 54.7 46.4 69.0
HamiltonCLRD1
Total White Black Female Male
39 45 49 54 63 62 59 65 63 50 48 61 54
358 321357
315 308 316 326 305 313265 245
281 254
0
100
200
300
400
500
600
1997 1999 2001 2003 2005 2007 2009
Rat
e pe
r 100
,000
Age Adjusted Mortality2 and Hospitalization3, CLRD
Mortality Hospitalization
45
1CLRD= Chronic Lower Respiratory Disease.
2Data Source: Death Statistical System, Tennessee Department of Health, Division of Health Statistics. Age adjustment based on the 2000 standard US population.
4Data Source: Tennessee Behavioral Risk Factor Surveillance System (BRFSS). Statistics are for 18+ unless indicated otherwise.
3Data Source: Hospital Discharge Data System, Tennessee Department of Health, Division of Health Statistics, 2007-2009. Data are for discharges, not necessarily for unique patients and are calculated for all ages. Age adjusted to the 2000 standard US population.
9.6
3.9
5.56.5
5.8
0
2
4
6
8
10
12
2005 2006 2007 2008 2009
Perc
ent
Prevalence of Self-Reported Current Asthma4
694.0
469.3
211.4
63.8
23.6
2.1
495.9
402.7
244.1
89.9
21.3
4.1
0 200 400 600 800
85+
75-84
65-74
55-64
45-54
35-44
Deaths per 100,000
Age
Gro
up Black
White
Age Specific Mortality by Race, CLRD, 2007-20092
45
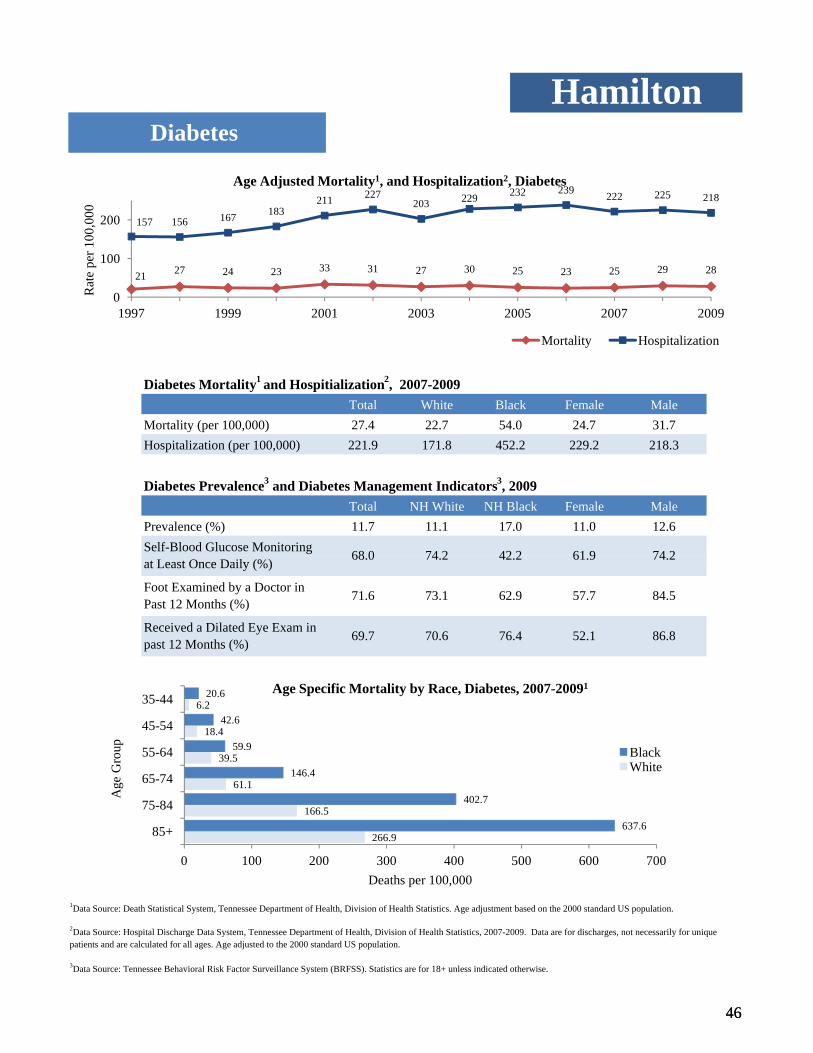
Self-Blood Glucose Monitoring at Least Once Daily (%) 68.0 74.2 42.2 61.9 74.2
Prevalence (%) 11.7 11.1 17.0 11.0 12.6
Diabetes Prevalence3 and Diabetes Management Indicators3, 2009Total NH White NH Black Female Male
Hospitalization (per 100,000) 221.9 171.8 452.2 229.2 218.3Mortality (per 100,000) 27.4 22.7 54.0 24.7 31.7
HamiltonDiabetes
Diabetes Mortality1 and Hospitialization2, 2007-2009 Total White Black Female Male
21 27 24 23 33 31 27 30 25 23 25 29 28
157 156 167 183211 227
203 229 232 239 222 225 218
0
100
200
1997 1999 2001 2003 2005 2007 2009
Rat
e pe
r 100
,000
Age Adjusted Mortality1, and Hospitalization2, Diabetes
Mortality Hospitalization
46
1Data Source: Death Statistical System, Tennessee Department of Health, Division of Health Statistics. Age adjustment based on the 2000 standard US population.
3Data Source: Tennessee Behavioral Risk Factor Surveillance System (BRFSS). Statistics are for 18+ unless indicated otherwise.
2Data Source: Hospital Discharge Data System, Tennessee Department of Health, Division of Health Statistics, 2007-2009. Data are for discharges, not necessarily for unique patients and are calculated for all ages. Age adjusted to the 2000 standard US population.
Received a Dilated Eye Exam in past 12 Months (%) 69.7 70.6 76.4 52.1 86.8
Foot Examined by a Doctor in Past 12 Months (%) 71.6 73.1 62.9 57.7 84.5
at Least Once Daily (%)
266.9
166.5
61.1
39.5
18.4
6.2
637.6
402.7
146.4
59.9
42.6
20.6
0 100 200 300 400 500 600 700
85+
75-84
65-74
55-64
45-54
35-44
Deaths per 100,000
Age
Gro
up
Age Specific Mortality by Race, Diabetes, 2007-20091
BlackWhite
46

Mortality (per 100,000) 186.1 182.1 212.8 147.6 246.6Incidence (per 100,000) 478.6 485.6 456.8 409.0 581.7
HamiltonCancer
Cancer Incidence1 and Mortality1, 2004-2008 Total White Black Female Male
452.5464.5 484.1 501.8 488.6
199.2 198.4 187.0 170.6 177.1
0
100
200
300
400
500
600
2004 2005 2006 2007 2008
Rat
e pe
r 100
,000
Age Adjusted Incidence1 and Mortality1, All Cancers
Incidence Mortality
47
1Data Source: Cancer Registry, Tennessee Department of Health, Office of Cancer Surveillance, all ages. Age adjusted to the 2000 standard US population.
2Data Source: Death Statistical System, Tennessee Department of Health, Division of Health Statistics.
1566.0
1312.0
721.8
259.2
98.9
51.3
1735.7
1610.7
800.5
469.2
174.0
45.3
0 500 1000 1500 2000
85+
75-84
65-74
55-64
45-54
35-44
Deaths Per 100,000
Age
Gro
up
Age Specific Mortality by Race, All Cancer, 2007-20092
BlackWhite
47
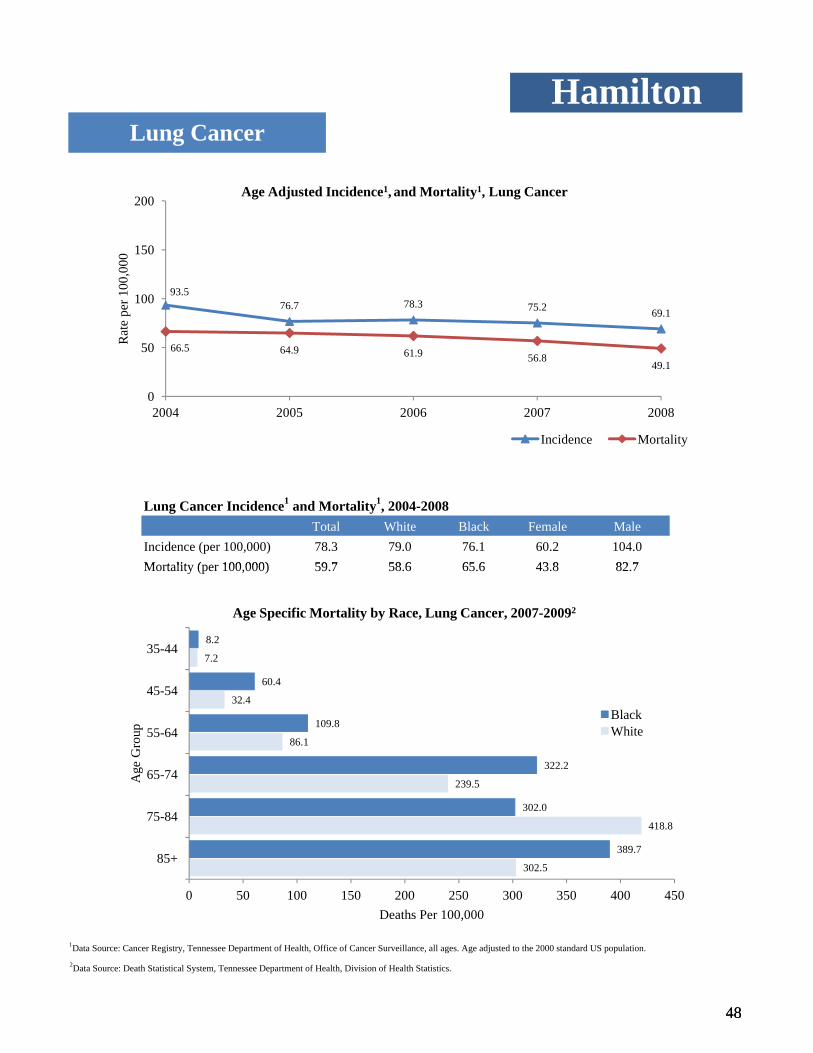
Mortalit (per 100 000) 59 7 58 6 65 6 43 8 82 7Incidence (per 100,000) 78.3 79.0 76.1 60.2 104.0
HamiltonLung Cancer
Lung Cancer Incidence1 and Mortality1, 2004-2008Total White Black Female Male
93.576.7 78.3 75.2 69.1
66.5 64.9 61.9 56.849.1
0
50
100
150
200
2004 2005 2006 2007 2008
Rat
e pe
r 100
,000
Age Adjusted Incidence1, and Mortality1, Lung Cancer
Incidence Mortality
48
1Data Source: Cancer Registry, Tennessee Department of Health, Office of Cancer Surveillance, all ages. Age adjusted to the 2000 standard US population.
2Data Source: Death Statistical System, Tennessee Department of Health, Division of Health Statistics.
Mortality (per 100,000) 59.7 58.6 65.6 43.8 82.7
302.5
418.8
239.5
86.1
32.4
7.2
389.7
302.0
322.2
109.8
60.4
8.2
0 50 100 150 200 250 300 350 400 450
85+
75-84
65-74
55-64
45-54
35-44
Deaths Per 100,000
Age
Gro
up
Age Specific Mortality by Race, Lung Cancer, 2007-20092
BlackWhite
48
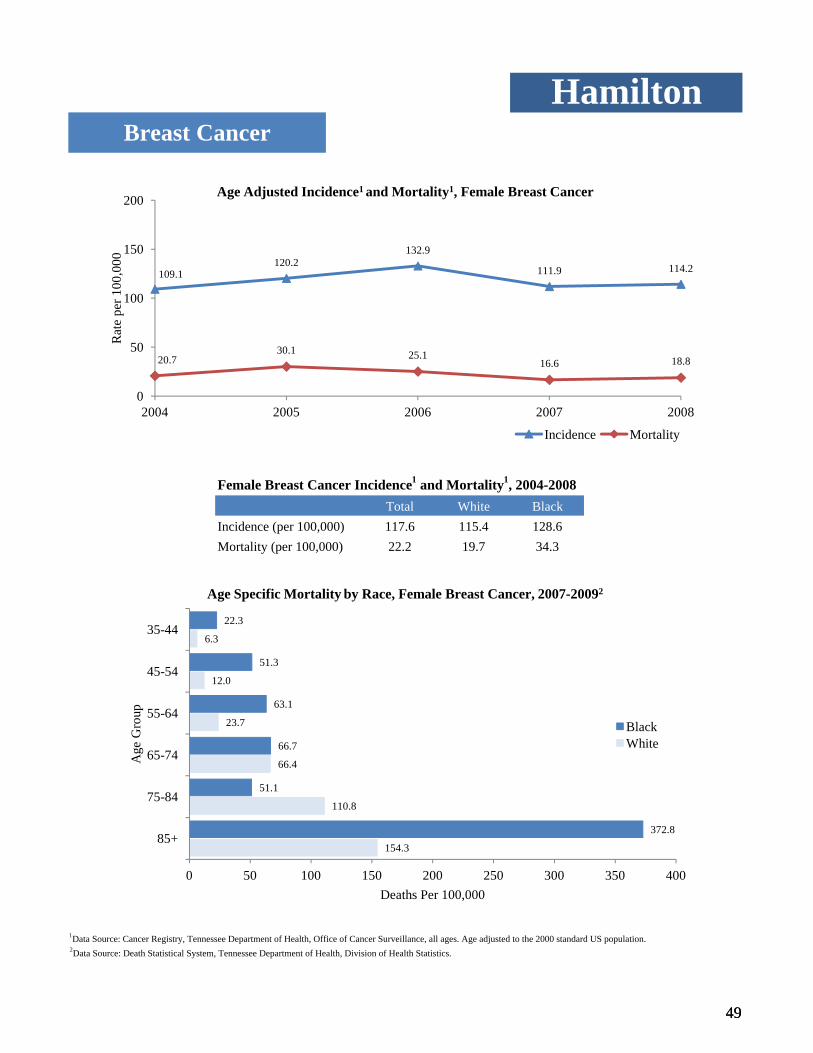
Female Breast Cancer Incidence1 and Mortality1, 2004-2008
Incidence (per 100,000) 117.6 115.4 128.6Mortality (per 100,000) 22.2 19.7 34.3
HamiltonBreast Cancer
Total White Black
109.1120.2
132.9
111.9 114.2
20.730.1 25.1
16.6 18.8
0
50
100
150
200
2004 2005 2006 2007 2008
Rat
e pe
r 100
,000
Age Adjusted Incidence1 and Mortality1, Female Breast Cancer
Incidence Mortality
49
1Data Source: Cancer Registry, Tennessee Department of Health, Office of Cancer Surveillance, all ages. Age adjusted to the 2000 standard US population.2Data Source: Death Statistical System, Tennessee Department of Health, Division of Health Statistics.
154.3
110.8
66.4
23.7
12.0
6.3
372.8
51.1
66.7
63.1
51.3
22.3
0 50 100 150 200 250 300 350 400
85+
75-84
65-74
55-64
45-54
35-44
Deaths Per 100,000
Age
Gro
up
Age Specific Mortality by Race, Female Breast Cancer, 2007-20092
BlackWhite
49

Mortality (per 100,000) 13.8 13.0 18.3 10.9 18.4Incidence (per 100,000) 45.3 44.5 48.8 40.9 51.2
Total White Black Female Male
HamiltonColorectal Cancer
Colorectal Cancer Incidence1 and Mortality1, 2004-2008
48.742.4 44.2
49.242.1
13.6 14.4 17.312.0 11.7
0
20
40
60
80
100
2004 2005 2006 2007 2008
Rat
e p
er 1
00,0
00
Age Adjusted Incidence1 and Mortality1, Colorectal Cancer
Incidence Mortality
50
1Data Source: Cancer Registry, Tennessee Department of Health, Office of Cancer Surveillance, all ages. Age adjusted to the 2000 standard US population.
2Data Source: Death Statistical System, Tennessee Department of Health, Division of Health Statistics.
172.0
103.4
49.6
13.2
9.6
3.1
141.7
218.1
78.1
49.9
0.0
4.1
0 50 100 150 200 250
85+
75-84
65-74
55-64
45-54
35-44
Deaths Per 100,000
Age
Gro
up
Age Specific Mortality by Race, Colorectal Cancer, 2007-20092
BlackWhite
50

Prostate Cancer Incidence1 and Mortality1, 2004-2008
Incidence (per 100,000) 164.3 155.5 224.1Mortality (per 100,000) 31.7 27.0 64.8
HamiltonProstate Cancer
Total White Black
129.5145.8
162.9
185.2193.8
33.2 33.6 33.0 27.6 31.8
0
50
100
150
200
2004 2005 2006 2007 2008
Rat
e pe
r 100
,000
Age Adjusted Incidence1 and Mortality1, Prostate Cancer
Incidence Mortality
51
1Data Source: Cancer Registry, Tennessee Department of Health, Office of Cancer Surveillance, all ages. Age adjusted to the 2000 standard US population.
2Data Source: Death Statistical System, Tennessee Department of Health, Division of Health Statistics.
615.7
261.9
87.5
10.4
3.6
738.6
537.1
188.5
44.8
7.9
0 100 200 300 400 500 600 700 800
85+
75-84
65-74
55-64
45-54
Deaths Per 100,000
Age
Gro
up
Age Specific Mortality by Race, Prostate Cancer, 2007-20092
BlackWhite
51
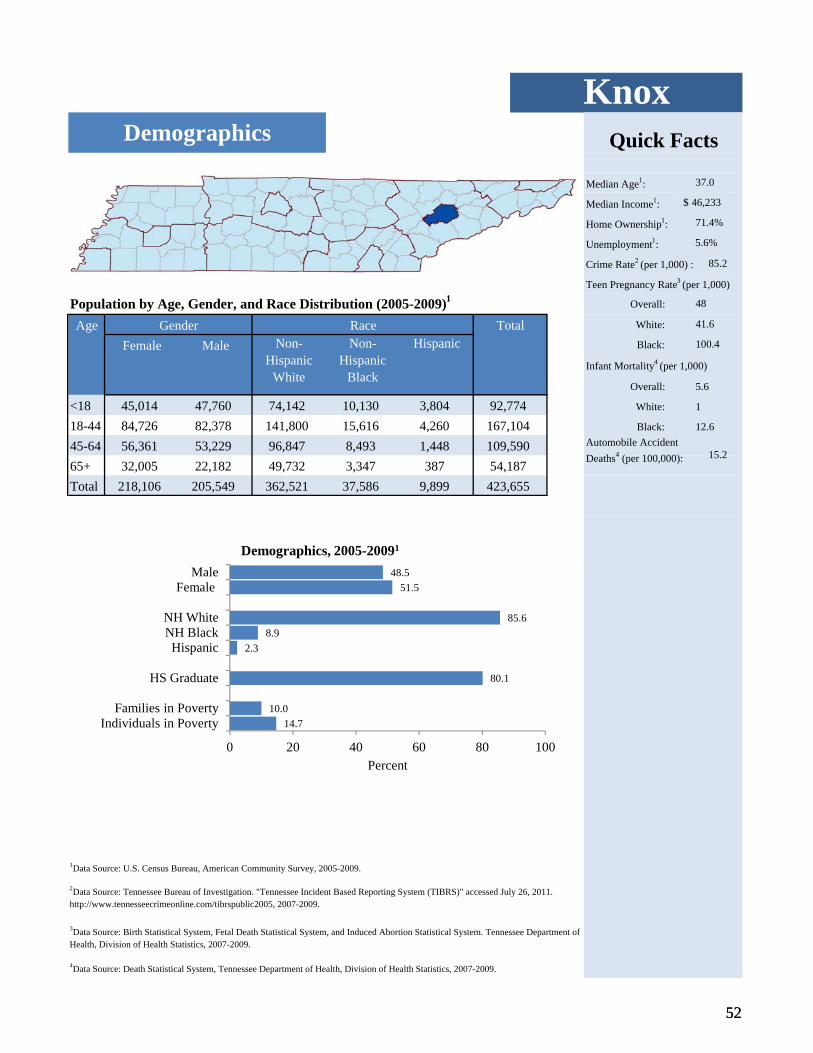
Median Age1:
Median Income1:
Home Ownership1:
Unemployment1:
Crime Rate2 (per 1,000) : 85.2
Teen Pregnancy Rate3 (per 1,000)
Population by Age, Gender, and Race Distribution (2005-2009)1 Overall:
Age White:
Black:
Infant Mortality4 (per 1,000)
Overall:
<18 White:
18-44 Black:
45-6465+Total 218,106 205,549 362,521 37,586 9,899 423,655
12.6
56,361 53,229 96,847 8,493 1,448 109,590 Automobile Accident Deaths4 (per 100,000): 15.2
32,005
84,726 82,378 141,800 15,616 4,260 167,104
22,182 49,732 3,347 387 54,187
100.4
5.6
45,014 47,760 74,142 10,130 3,804 92,774 1
Female Male Non-Hispanic
White
Non-Hispanic
Black
Hispanic
5.6%
48
Gender Race Total 41.6
KnoxDemographics Quick Facts
37.0
46,233
71.4%
48.5MaleDemographics, 2005-20091
$
52
1Data Source: U.S. Census Bureau, American Community Survey, 2005-2009.
4Data Source: Death Statistical System, Tennessee Department of Health, Division of Health Statistics, 2007-2009.
2Data Source: Tennessee Bureau of Investigation. "Tennessee Incident Based Reporting System (TIBRS)" accessed July 26, 2011. http://www.tennesseecrimeonline.com/tibrspublic2005, 2007-2009.
3Data Source: Birth Statistical System, Fetal Death Statistical System, and Induced Abortion Statistical System. Tennessee Department of Health, Division of Health Statistics, 2007-2009.
14.710.0
80.1
2.38.9
85.6
51.548.5
0 20 40 60 80 100
Individuals in PovertyFamilies in Poverty
HS Graduate
HispanicNH BlackNH White
Female Male
Percent
Demographics, 2005-20091
52

General HealthKnox
12.515.4 16.4
19.815.7
0
20
40
60
2005 2006 2007 2008 2009
Perc
ent
"Fair/Poor" Health1
79.3 76.5 77.9 74.369.1
40.6
57.763.1 67.3
61.5
0
20
40
60
80
100
2005 2006 2007 2008 2009
Perc
ent
Pneumonia and Influenza Vaccination Status1
10.5 6.412.8
9.3 11.6
0
20
40
60
2005 2006 2007 2008 2009
Perc
ent
Lacking Health Insurance1
53
Prevalence for General Health Indicators Among Adults 18+, 20091
1Data Source: Tennessee Behavioral Risk Factor Surveillance System (BRFSS). Statistics are for 18+ unless indicated otherwise.
2Age 65+.
3Age 50+.
11.1
Mean # of Days of Poor Mental Health per Month 10.6 11.0 7.7 10.7 10.5
Mean # of Days of Poor Physical Health per Month 11.0 11.1 13.8 10.9
16.8
Male
Fair/Poor Health Status (%) 15.6 16.4 11.4 14.4 16.9
Received Flu Shot in Past 12 Months3 (%) 61.5 62.3 67.7 64.7 57.4Ever Received Pneumonia Vaccination2 (%) 69.1 67.8 78.3 63.2 78.1
Indicator Total NH White NH Black Female
Lacking Health Insurance (%) 11.4 9.3 35.0 6.6
0
20
2005 2006 2007 2008 2009
Ever received pneumonia vaccination (age 65+) Received flu shot in past 12 months (age 50+)
53

KnoxBehavioral Risk Factors
36.4 35.2 35.9
25.2
33.6
21.8 25.0 26.0
31.0
31.2
0
20
40
60
2005 2006 2007 2008 2009
Perc
ent
Overweight and Obesity1
Overweight Obese
70.4 71.5 75.4
62.2 58.7 56.9
20
40
60
80
100
Perc
ent
Nutrition and Physical Activity1
17.914 5
21.0
34.629.9
34.9
20
40
60
Perc
ent
Cholesterol Screening and High Cholesterol1
54
Prevalence for Behavioral Risk Factors, 20091
1Data Source: Tennessee Behavioral Risk Factor Surveillance System (BRFSS). Statistics are for 18+ unless indicated otherwise.
Ever Told High Blood Pressure (%) 31.5 29.9 53.2 31.2 31.8
Ever Told High Cholesterol (%) 34.9 34.2 49.3 48.1 24.3
Have Not Checked Cholesterol Within the Past 5 Years (%)
21.0 19.8 34.9 15.9 26.5
Overweight or Obese (%) 64.7 65.2 79.3 58.2 71.3
Not Meeting Physical Activity Recommendations (%)
56.9 54.1 81.6 58.6 54.8
Eating <5 Fruits & Vegetables per Day (%) 75.4 74.7 73.2 69.3 82.5
Risk factor Total NH White NH Black Female Male
56.9
0
20
40
2005 2007 2009
Perc
e
Eating <5 Fruit Vegetables/Day
Not Meeting Physical Activity Recommendations
17.914.5
21.0
0
20
2005 2007 2009
Perc
en
Cholesterol Not Checked in 5 Years
Ever Told Had High Cholesterol
54

KnoxCigarette & Alcohol Use
2.1 1.62.7
6.7
1.2
11.3 11.2
7.0
13.4
6.0
5
10
15
20
Perc
ent
Alcohol Use1
21.818.8
20.6 21.1
15.7
05
10152025303540
2005 2006 2007 2008 2009
Perc
ent
Current Cigarette Smokers1
55
Prevalence for Alcohol and Tobacco Use, 20091
1Data Source: Tennessee Behavioral Risk Factor Surveillance System (BRFSS). Statistics are for 18+ unless indicated otherwise.
Current Smokers (%) 15.7 16.9 9.0 13.9 17.6Binge Drinking (%) 6.0 6.8 0.0 7.0 4.8Heavy Drinking (%) 1.2 1.4 0.0 2.3 0.0
Indicator Total NH White NH Black Female Male
2.1 1.62.7
6.7
1.2
6.0
0
5
2005 2006 2007 2008 2009
Per
Heavy Drinking Binge Drinking
55
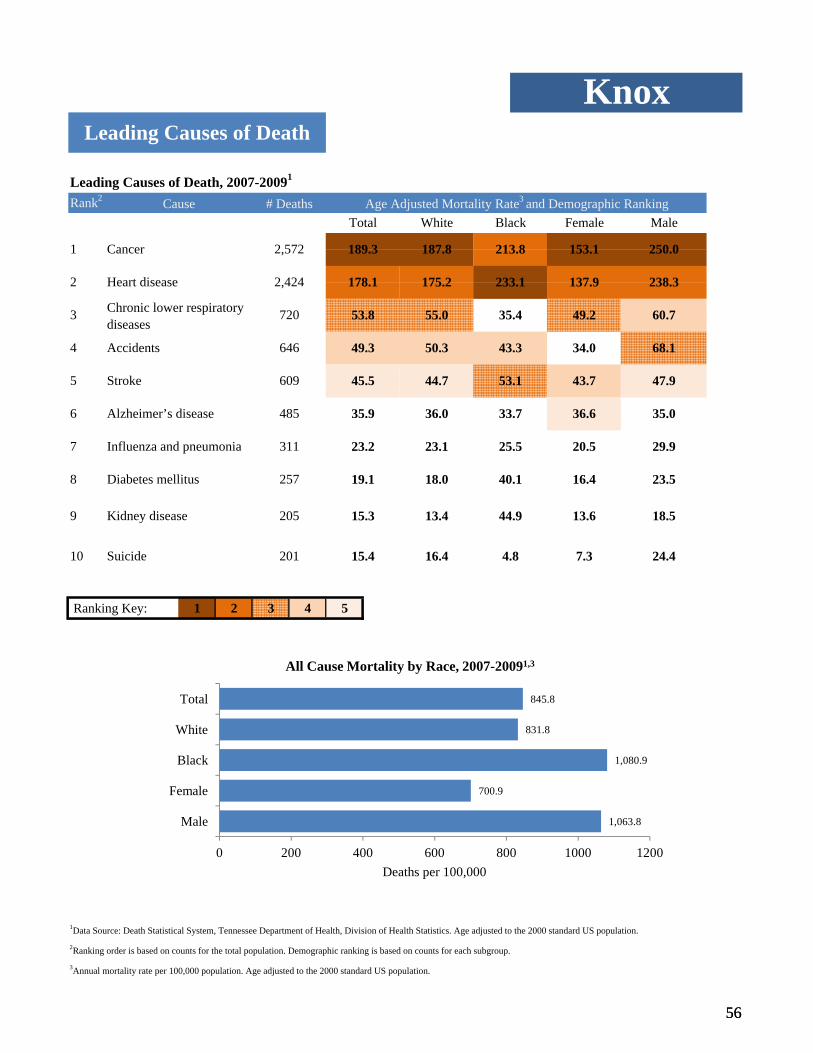
Leading Causes of Death, 2007-20091
Rank2
7.3 24.410 Suicide 201 15.4 16.4 4.8
16.4 23.5
9 Kidney disease 205 15.3 13.4 44.9 13.6 18.5
8 Diabetes mellitus 257 19.1 18.0 40.1
36.6 35.0
7 Influenza and pneumonia 311 23.2 23.1 25.5 20.5 29.9
6 Alzheimer’s disease 485 35.9 36.0 33.7
34.0 68.1
5 Stroke 609 45.5 44.7 53.1 43.7 47.9
4 Accidents 646 49.3 50.3 43.3
3 Chronic lower respiratory diseases
720 53.8 55.0 35.4 49.2 60.7
2 Heart disease 2,424 178.1 175.2 233.1
1 Cancer 2,572 189.3 187.8 213.8 153.1 250.0
137.9 238.3
KnoxLeading Causes of Death
Cause # Deaths Age Adjusted Mortality Rate3 and Demographic RankingTotal White Black Female Male
56
Ranking Key: 1 2 3 4 5
1Data Source: Death Statistical System, Tennessee Department of Health, Division of Health Statistics. Age adjusted to the 2000 standard US population.
2Ranking order is based on counts for the total population. Demographic ranking is based on counts for each subgroup.
3Annual mortality rate per 100,000 population. Age adjusted to the 2000 standard US population.
1,063.8
700.9
1,080.9
831.8
845.8
0 200 400 600 800 1000 1200
Male
Female
Black
White
Total
Deaths per 100,000
All Cause Mortality by Race, 2007-20091,3
56
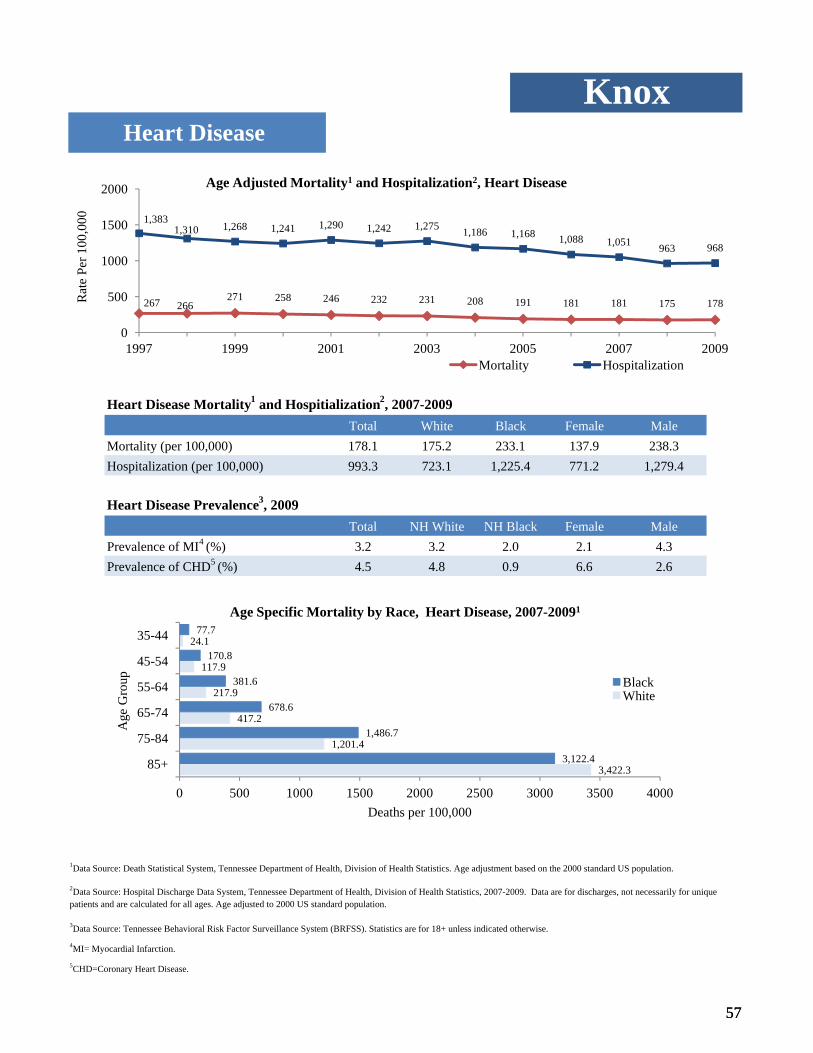
Heart Disease Mortality1 and Hospitialization2, 2007-2009
Heart Disease Prevalence3, 2009
Pre alence of CHD5 (%) 4 5 4 8 0 9 6 6 2 6Prevalence of MI4 (%) 3.2 3.2 2.0 2.1 4.3
Total NH White NH Black Female Male
Hospitalization (per 100,000) 993.3 723.1 1,225.4 771.2 1,279.4Mortality (per 100,000) 178.1 175.2 233.1 137.9 238.3
KnoxHeart Disease
Total White Black Female Male
267 266271 258 246 232 231 208 191 181 181 175 178
1,3831,310 1,268 1,241 1,290 1,242 1,275 1,186 1,168 1,088 1,051 963 968
0
500
1000
1500
2000
1997 1999 2001 2003 2005 2007 2009
Rat
e Pe
r 100
,000
Age Adjusted Mortality1 and Hospitalization2, Heart Disease
Mortality Hospitalization
57
1Data Source: Death Statistical System, Tennessee Department of Health, Division of Health Statistics. Age adjustment based on the 2000 standard US population.
3Data Source: Tennessee Behavioral Risk Factor Surveillance System (BRFSS). Statistics are for 18+ unless indicated otherwise.
4MI= Myocardial Infarction.
5CHD=Coronary Heart Disease.
2Data Source: Hospital Discharge Data System, Tennessee Department of Health, Division of Health Statistics, 2007-2009. Data are for discharges, not necessarily for unique patients and are calculated for all ages. Age adjusted to 2000 US standard population.
Prevalence of CHD5 (%) 4.5 4.8 0.9 6.6 2.6
3,422.3
1,201.4
417.2
217.9
117.9
24.1
3,122.4
1,486.7
678.6
381.6
170.8
77.7
0 500 1000 1500 2000 2500 3000 3500 4000
85+
75-84
65-74
55-64
45-54
35-44
Deaths per 100,000
Age
Gro
up
Age Specific Mortality by Race, Heart Disease, 2007-20091
BlackWhite
57

Stroke Mortality1, Hospitialization2, and Prevalence3, 2007-2009
Prevalence4 (%) 3 1 3 2 2 3 2 3 4 1Hospitalization (per 100,000) 278.9 203.1 348.0 265.4 300.1Mortality (per 100,000) 45.5 44.7 53.1 43.7 47.9
KnoxStroke
Total White Black Female Male
64 54 53 59 60 59 56 60 54 45 48 45 44
367 362327 320 332 316 297 298
272 292 300268 270
0
100
200
300
400
500
1997 1999 2001 2003 2005 2007 2009
Rat
e pe
r 100
,000
Age Adjusted Mortality1 and Hospitalization2, Stroke
Mortality Hospitalization
58
1Data Source: Death Statistical System, Tennessee Department of Health, Division of Health Statistics. Age adjustment based on the 2000 standard US population.
3Data Source: Tennessee Behavioral Risk Factor Surveillance System (BRFSS). Statistics are for 18+ unless indicated otherwise.
42009 data, NH white and NH black race groups.
2Data Source: Hospital Discharge Data System, Tennessee Department of Health, Division of Health Statistics, 2007-2009. Data are for discharges, not necessarily for unique patients and are calculated for all ages. Age adjusted to the 2000 standard US population.
Prevalence4 (%) 3.1 3.2 2.3 2.3 4.1
1025.7
374.6
84.9
30.9
15.9
7.2
821.7
389.4
135.7
78.3
44.3
7.1
0 200 400 600 800 1000 1200
85+
75-84
65-74
55-64
45-54
35-44
Deaths per 100,000
Age
Gro
up
Age Specific Mortality by Race, Stroke, 2007-20091
BlackWhite
58

Chronic Lower Respiratory Disease Mortality2 and Hospitialization3, 2007-2009
Currently Have Asthma (%) 6.3 5.6 14.9 6.7 5.8Ever Had Asthma (%) 7.9 7.3 14.9 7.3 8.7
Asthma Prevalence, 20094
Total NH White NH Black Female Male
Hospitalization (per 100,000) 286.9 218.6 404.7 312.9 258.0Mortality (per 100,000) 53.8 55.0 35.4 49.2 60.7
KnoxCLRD1
Total White Black Female Male
48 47 58 52 57 57 49 49 55 47 46 60 55
370 360 381331
412 405338 336 337
296 294 287 279
0
100
200
300
400
500
600
1997 1999 2001 2003 2005 2007 2009
Rat
e pe
r 100
,000
Age Adjusted Mortality2 and Hospitalization3, CLRD
Mortality Hospitalization
59
1CLRD= Chronic Lower Respiratory Disease.
2Data Source: Death Statistical System, Tennessee Department of Health, Division of Health Statistics. Age adjustment based on the 2000 standard US population.
4Data Source: Tennessee Behavioral Risk Factor Surveillance System (BRFSS). Statistics are for 18+ unless indicated otherwise.
3Data Source: Hospital Discharge Data System, Tennessee Department of Health, Division of Health Statistics, 2007-2009. Data are for discharges, not necessarily for unique patients and are calculated for all ages. Age adjusted to the 2000 standard US population.
6.5
11.9
9.3
14.2
6.3
0
2
4
6
8
10
12
14
16
2005 2006 2007 2008 2009
Perc
ent
Prevalence of Self-Reported Current Asthma4
661.5
473.6
237.3
66.3
12.4
2.6
493.0
212.4
135.7
48.9
25.3
0.0
0 200 400 600 800
85+
75-84
65-74
55-64
45-54
35-44
Deaths per 100,000
Age
Gro
up Black
White
Age Specific Mortality by Race, CLRD, 2007-20092
59
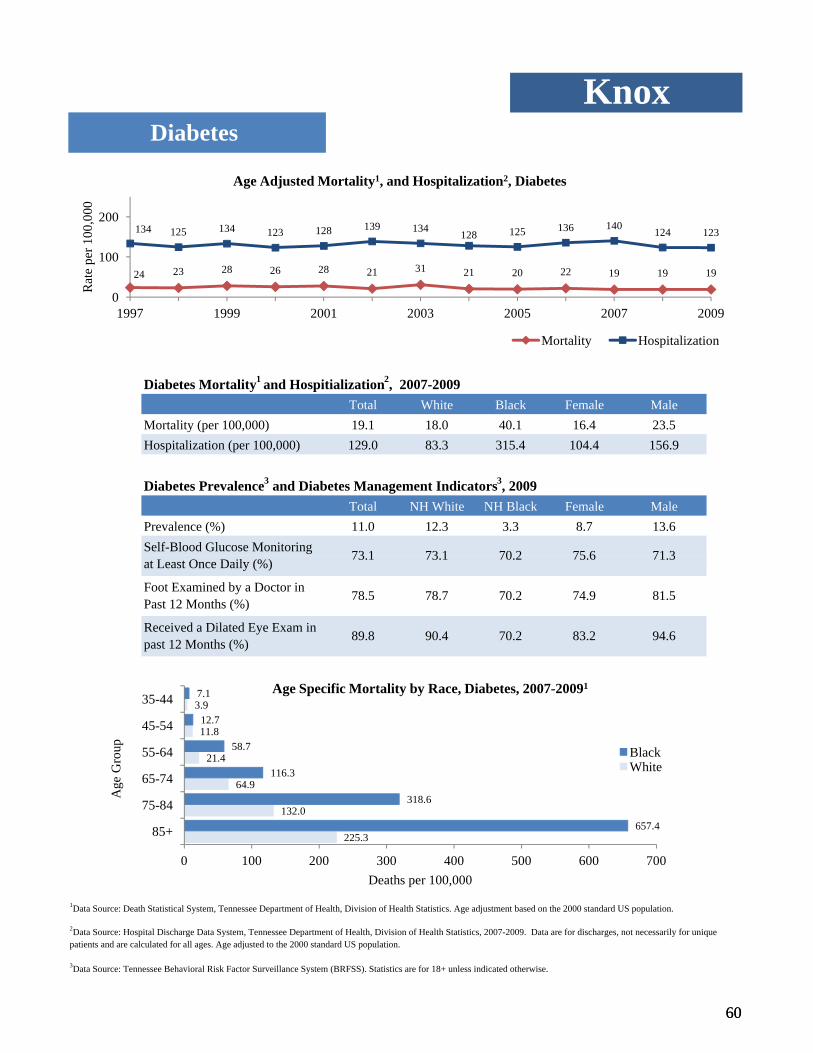
Self-Blood Glucose Monitoring at Least Once Daily (%) 73.1 73.1 70.2 75.6 71.3
Prevalence (%) 11.0 12.3 3.3 8.7 13.6
Diabetes Prevalence3 and Diabetes Management Indicators3, 2009Total NH White NH Black Female Male
Hospitalization (per 100,000) 129.0 83.3 315.4 104.4 156.9Mortality (per 100,000) 19.1 18.0 40.1 16.4 23.5
KnoxDiabetes
Diabetes Mortality1 and Hospitialization2, 2007-2009 Total White Black Female Male
24 23 28 26 28 21 31 21 20 22 19 19 19
134 125 134 123 128 139 134 128 125 136 140 124 123
0
100
200
1997 1999 2001 2003 2005 2007 2009
Rat
e pe
r 100
,000
Age Adjusted Mortality1, and Hospitalization2, Diabetes
Mortality Hospitalization
60
1Data Source: Death Statistical System, Tennessee Department of Health, Division of Health Statistics. Age adjustment based on the 2000 standard US population.
3Data Source: Tennessee Behavioral Risk Factor Surveillance System (BRFSS). Statistics are for 18+ unless indicated otherwise.
2Data Source: Hospital Discharge Data System, Tennessee Department of Health, Division of Health Statistics, 2007-2009. Data are for discharges, not necessarily for unique patients and are calculated for all ages. Age adjusted to the 2000 standard US population.
Received a Dilated Eye Exam in past 12 Months (%) 89.8 90.4 70.2 83.2 94.6
Foot Examined by a Doctor in Past 12 Months (%) 78.5 78.7 70.2 74.9 81.5
at Least Once Daily (%)
225.3
132.0
64.9
21.4
11.8
3.9
657.4
318.6
116.3
58.7
12.7
7.1
0 100 200 300 400 500 600 700
85+
75-84
65-74
55-64
45-54
35-44
Deaths per 100,000
Age
Gro
up
Age Specific Mortality by Race, Diabetes, 2007-20091
BlackWhite
60

Mortality (per 100,000) 189.4 188.1 227.4 158.2 237.8Incidence (per 100,000) 493.0 497.1 441.2 417.5 602.2
KnoxCancer
Cancer Incidence1 and Mortality1, 2004-2008 Total White Black Female Male
479.3496.8 498.5 499.3 490.6
201.2 190.0 184.2 192.8 179.9
0
100
200
300
400
500
600
2004 2005 2006 2007 2008
Rat
e pe
r 100
,000
Age Adjusted Incidence1 and Mortality1, All Cancers
Incidence Mortality
61
1Data Source: Cancer Registry, Tennessee Department of Health, Office of Cancer Surveillance, all ages. Age adjusted to the 2000 standard US population.
2Data Source: Death Statistical System, Tennessee Department of Health, Division of Health Statistics.
1586.5
1337.3
719.4
346.0
130.8
36.5
2218.6
1132.7
853.0
479.4
139.2
35.3
0 500 1000 1500 2000 2500
85+
75-84
65-74
55-64
45-54
35-44
Deaths Per 100,000
Age
Gro
up
Age Specific Mortality by Race, All Cancer, 2007-20092
BlackWhite
61

Mortalit (per 100 000) 62 3 61 8 77 9 48 1 82 4Incidence (per 100,000) 85.9 86.1 86.9 65.8 113.1
KnoxLung Cancer
Lung Cancer Incidence1 and Mortality1, 2004-2008Total White Black Female Male
85.390.4 87.8 83.4 82.8
65.6 66.6 60.6 61.8 57.7
0
50
100
150
200
2004 2005 2006 2007 2008
Rat
e pe
r 100
,000
Age Adjusted Incidence1, and Mortality1, Lung Cancer
Incidence Mortality
62
1Data Source: Cancer Registry, Tennessee Department of Health, Office of Cancer Surveillance, all ages. Age adjusted to the 2000 standard US population.
2Data Source: Death Statistical System, Tennessee Department of Health, Division of Health Statistics.
Mortality (per 100,000) 62.3 61.8 77.9 48.1 82.4
311.6
428.9
287.3
119.3
36.0
5.9
739.5
389.4
329.6
176.1
31.6
0.0
0 100 200 300 400 500 600 700 800
85+
75-84
65-74
55-64
45-54
35-44
Deaths Per 100,000
Age
Gro
up
Age Specific Mortality by Race, Lung Cancer, 2007-20092
BlackWhite
62

Female Breast Cancer Incidence1 and Mortality1, 2004-2008
Incidence (per 100,000) 129.1 130.2 116.7Mortality (per 100,000) 20.2 20.1 21.7
KnoxBreast Cancer
Total White Black
117.5
135.7128.3 127.6
137.3
24.0 23.1 17.7 17.9 18.4
0
50
100
150
200
2004 2005 2006 2007 2008
Rat
e pe
r 100
,000
Age Adjusted Incidence1 and Mortality1, Female Breast Cancer
Incidence Mortality
63
1Data Source: Cancer Registry, Tennessee Department of Health, Office of Cancer Surveillance, all ages. Age adjusted to the 2000 standard US population.2Data Source: Death Statistical System, Tennessee Department of Health, Division of Health Statistics.
142.7
100.1
63.5
43.9
25.5
6.5
212.1
53.6
32.3
54.0
48.4
26.1
0 50 100 150 200 250
85+
75-84
65-74
55-64
45-54
35-44
Deaths Per 100,000
Age
Gro
up
Age Specific Mortality by Race, Female Breast Cancer, 2007-20092
BlackWhite
63

Mortality (per 100,000) 15.6 14.8 29.5 12.7 19.4Incidence (per 100,000) 43.8 43.5 44.2 36.7 53.6
Total White Black Female Male
KnoxColorectal Cancer
Colorectal Cancer Incidence1 and Mortality1, 2004-2008
42.547.5 47.7
43.438.4
19.2 16.1 14.1 13.4 15.3
0
20
40
60
80
100
2004 2005 2006 2007 2008
Rat
e p
er 1
00,0
00
Age Adjusted Incidence1 and Mortality1, Colorectal Cancer
Incidence Mortality
64
1Data Source: Cancer Registry, Tennessee Department of Health, Office of Cancer Surveillance, all ages. Age adjusted to the 2000 standard US population.
2Data Source: Death Statistical System, Tennessee Department of Health, Division of Health Statistics.
167.8
81.5
50.0
25.8
11.2
7.2
164.3
106.2
96.9
48.9
0.0
0.0
0 20 40 60 80 100 120 140 160 180
85+
75-84
65-74
55-64
45-54
35-44
Deaths Per 100,000
Age
Gro
up
Age Specific Mortality by Race, Colorectal Cancer, 2007-20092
BlackWhite
64

Prostate Cancer Incidence1 and Mortality1, 2004-2008
Incidence (per 100,000) 171.1 168.1 215.9Mortality (per 100,000) 20.8 18.6 61.7
KnoxProstate Cancer
Total White Black
162.8 156.4165.3
176.9191.6
22.5 15.2 18.2 23.7 23.8
0
50
100
150
200
2004 2005 2006 2007 2008
Rat
e pe
r 100
,000
Age Adjusted Incidence1 and Mortality1, Prostate Cancer
Incidence Mortality
65
1Data Source: Cancer Registry, Tennessee Department of Health, Office of Cancer Surveillance, all ages. Age adjusted to the 2000 standard US population.
2Data Source: Death Statistical System, Tennessee Department of Health, Division of Health Statistics.
532.4
189.1
55.6
12.3
2.4
1,459.9
417.5
96.9
64.3
13.3
0 200 400 600 800 1000 1200 1400 1600
85+
75-84
65-74
55-64
45-54
Deaths Per 100,000
Age
Gro
up
Age Specific Mortality by Race, Prostate Cancer, 2007-20092
BlackWhite
65

Median Age1:
Median Income1:
Home Ownership1:
Unemployment1:
Crime Rate2 (per 1,000) : 133.7
Teen Pregnancy Rate3 (per 1,000)
Population by Age, Gender, and Race Distribution (2005-2009)1 Overall:
Age White:
Black:
Infant Mortality4 (per 1,000)
Overall:
<18 White:
18-44 Black:
45-6465+Total 49,932 46,414 59,237 31,966 2,899 96,346
14.7
12,795 11,541 16,507 7,160 310 24,336 Automobile Accident Deaths4 (per 100,000): 15.0
7,108
18,329 17,549 21,030 12,662 1,455 35,878
4,819 9,183 2,578 30 11,927
112.5
10.2
11,700 12,505 12,517 9,566 1,104 24,205 0.2
Female Male Non-Hispanic
White
Non-Hispanic
Black
Hispanic
8.3%
73.2
Gender Race Total 45.3
MadisonDemographics Quick Facts
35.7
39,743
69.1%
48.2MaleDemographics, 2005-20091
$
66
1Data Source: U.S. Census Bureau, American Community Survey, 2005-2009.
4Data Source: Death Statistical System, Tennessee Department of Health, Division of Health Statistics, 2007-2009.
2Data Source: Tennessee Bureau of Investigation. "Tennessee Incident Based Reporting System (TIBRS)" accessed July 26, 2011. http://www.tennesseecrimeonline.com/tibrspublic2005, 2007-2009.
3Data Source: Birth Statistical System, Fetal Death Statistical System, and Induced Abortion Statistical System. Tennessee Department of Health, Division of Health Statistics, 2007-2009.
18.014.9
78.0
3.033.2
61.5
51.848.2
0 20 40 60 80 100
Individuals in PovertyFamilies in Poverty
HS Graduate
HispanicNH BlackNH White
Female Male
Percent
Demographics, 2005-20091
66

General HealthMadison
19.3 17.2 15.919.6
25.1
0
20
40
60
2005 2006 2007 2008 2009
Perc
ent
"Fair/Poor" Health1
60.4 63.7
50.0
58.6 57.3
38.7
51.1
54.5
49.157.4
0
20
40
60
80
100
2005 2006 2007 2008 2009
Perc
ent
Pneumonia and Influenza Vaccination Status1
12.915.5 16.8
13.9 15.4
0
20
40
60
2005 2006 2007 2008 2009
Perc
ent
Lacking Health Insurance1
67
Prevalence for General Health Indicators Among Adults 18+, 20091
1Data Source: Tennessee Behavioral Risk Factor Surveillance System (BRFSS). Statistics are for 18+ unless indicated otherwise.
2Age 65+.
3Age 50+.
13.8
Mean # of Days of Poor Mental Health per Month 11.3 11.1 10.1 10.1 14.2
Mean # of Days of Poor Physical Health per Month 12.4 12.8 11.0 11.4
13.0
Male
Fair/Poor Health Status (%) 25.0 21.6 33.9 27.5 22.3
Received Flu Shot in Past 12 Months3 (%) 57.4 60.3 49.3 53.3 62.1Ever Received Pneumonia Vaccination2 (%) 57.3 59.2 47.0 63.7 48.2
Indicator Total NH White NH Black Female
Lacking Health Insurance (%) 15.4 11.8 22.2 17.3
38.7
0
20
2005 2006 2007 2008 2009
Ever received pneumonia vaccination (age 65+) Received flu shot in past 12 months (age 50+)
67

MadisonBehavioral Risk Factors
38.234.7
38.8 38.341.0
30.7 30.2 28.432.1 31.2
0
20
40
60
2005 2006 2007 2008 2009
Perc
ent
Overweight and Obesity1
Overweight Obese
79.7 74.379.3
67.3 64.5 67.9
20
40
60
80
100
Perc
ent
Nutrition and Physical Activity1
23.8
24.8
17.1
33.7
22.6
25.6
20
40
60
Perc
ent
Cholesterol Screening and High Cholesterol1
68
Prevalence for Behavioral Risk Factors, 20091
1Data Source: Tennessee Behavioral Risk Factor Surveillance System (BRFSS). Statistics are for 18+ unless indicated otherwise.
Ever Told High Blood Pressure (%) 25.9 26.7 26.1 29.8 21.7
Ever Told High Cholesterol (%) 25.6 29.3 18.8 22.2 28.7
Have Not Checked Cholesterol Within the Past 5 Years (%)
17.1 17.6 18.1 19.7 14.2
Overweight or Obese (%) 72.2 70.5 78.9 68.9 75.7
Not Meeting Physical Activity Recommendations (%)
67.9 67.9 65.8 66.2 70.0
Eating <5 Fruits & Vegetables per Day (%) 79.3 80.5 81.8 80.2 78.2
Risk factor Total NH White NH Black Female Male
0
20
40
2005 2007 2009
Perc
e
Eating <5 Fruit Vegetables/Day
Not Meeting Physical Activity Recommendations
23.817.1
22.6
0
20
2005 2007 2009
Perc
en
Cholesterol Not Checked in 5 Years
Ever Told Had High Cholesterol
68
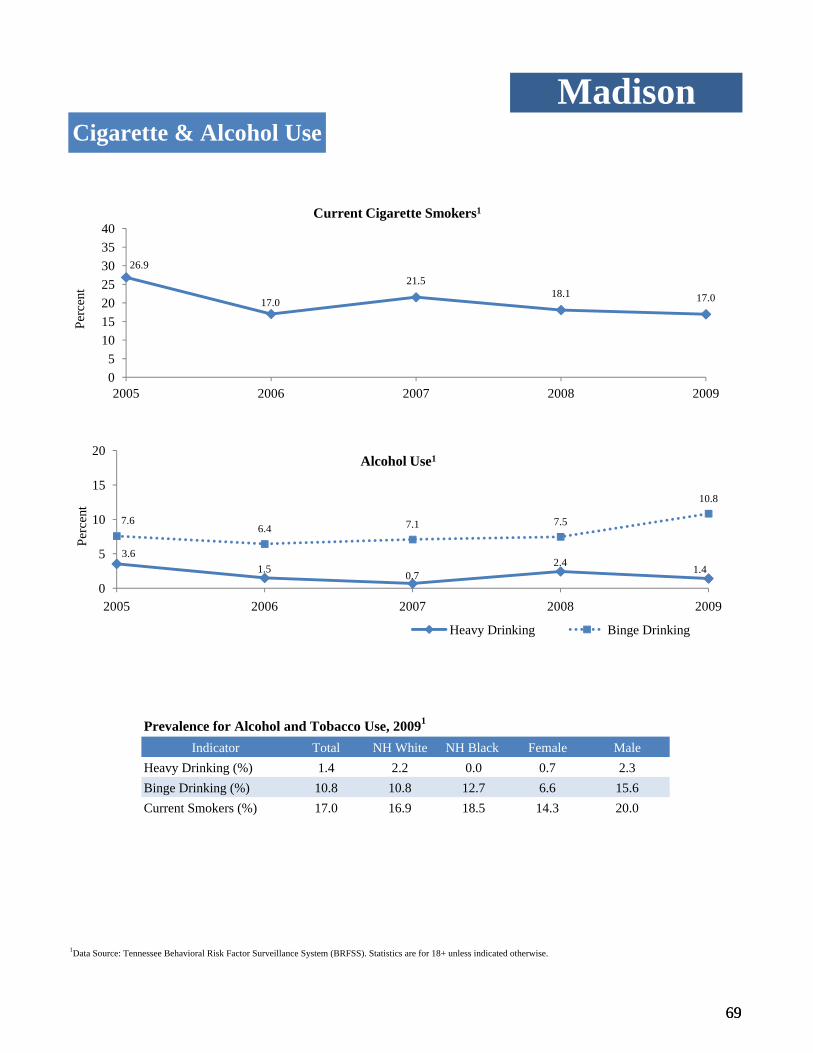
MadisonCigarette & Alcohol Use
3.61.5 0 7
2.41.4
7.66.4 7.1 7.5
10.8
5
10
15
20
Perc
ent
Alcohol Use1
26.9
17.0
21.518.1 17.0
05
10152025303540
2005 2006 2007 2008 2009
Perc
ent
Current Cigarette Smokers1
69
Prevalence for Alcohol and Tobacco Use, 20091
1Data Source: Tennessee Behavioral Risk Factor Surveillance System (BRFSS). Statistics are for 18+ unless indicated otherwise.
Current Smokers (%) 17.0 16.9 18.5 14.3 20.0Binge Drinking (%) 10.8 10.8 12.7 6.6 15.6Heavy Drinking (%) 1.4 2.2 0.0 0.7 2.3
Indicator Total NH White NH Black Female Male
3.61.5 0.7
2.41.4
0
5
2005 2006 2007 2008 2009
Per
Heavy Drinking Binge Drinking
69

Leading Causes of Death, 2007-20091
Rank2
17.4 9.610 Septicemia 44 14.3 13.8 17.1
12.2 21.0
9 Suicide 45 14.9 18.2 7.0 5.0 26.4
8 Influenza and pneumonia 50 16.0 15.9 16.0
30.8 37.0
7 Diabetes mellitus 86 28.0 17.8 64.1 23.0 34.8
6 Alzheimer’s disease 105 33.3 35.0 28.7
43.8 63.0
5 Accidents 111 36.9 38.9 34.1 22.4 54.8
4 Chronic lower respiratory diseases
145 49.6 53.6 33.0
3 Stroke 190 61.5 51.6 90.8 56.7 66.8
2 Cancer 547 181.1 170.0 213.4
1 Heart disease 651 209.0 197.3 246.3 171.0 264.0
145.0 238.6
MadisonLeading Causes of Death
Cause # Deaths Age Adjusted Mortality Rate3 and Demographic RankingTotal White Black Female Male
70
Ranking Key: 1 2 3 4 5
1Data Source: Death Statistical System, Tennessee Department of Health, Division of Health Statistics. Age adjusted to the 2000 standard US population.
2Ranking order is based on counts for the total population. Demographic ranking is based on counts for each subgroup.
3Annual mortality rate per 100,000 population. Age adjusted to the 2000 standard US population.
p
1,056.8
694.9
1,019.0
785.5
844.9
0 200 400 600 800 1000 1200
Male
Female
Black
White
Total
Deaths per 100,000
All Cause Mortality by Race, 2007-20091,3
70
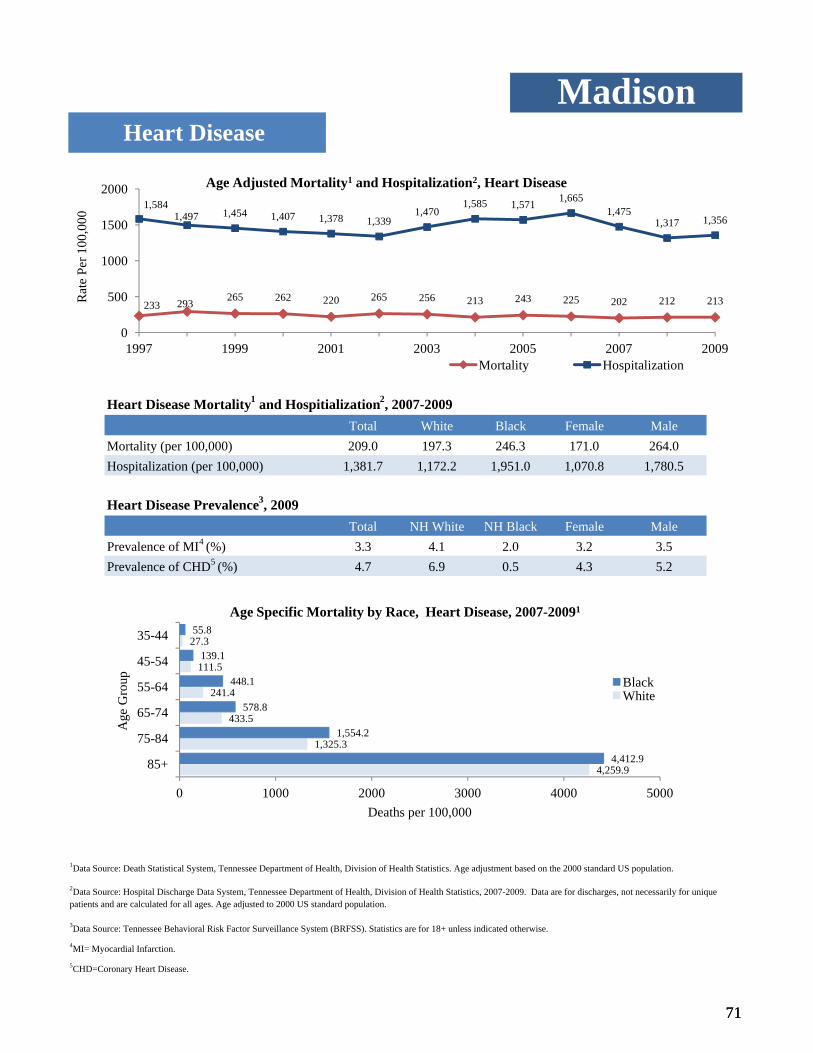
Heart Disease Mortality1 and Hospitialization2, 2007-2009
Heart Disease Prevalence3, 2009
Pre alence of CHD5 (%) 4 7 6 9 0 5 4 3 5 2Prevalence of MI4 (%) 3.3 4.1 2.0 3.2 3.5
Total NH White NH Black Female Male
Hospitalization (per 100,000) 1,381.7 1,172.2 1,951.0 1,070.8 1,780.5Mortality (per 100,000) 209.0 197.3 246.3 171.0 264.0
MadisonHeart Disease
Total White Black Female Male
233 293 265 262 220 265 256 213 243 225 202 212 213
1,5841,497 1,454 1,407 1,378 1,339
1,4701,585 1,571 1,665
1,4751,317 1,356
0
500
1000
1500
2000
1997 1999 2001 2003 2005 2007 2009
Rat
e Pe
r 100
,000
Age Adjusted Mortality1 and Hospitalization2, Heart Disease
Mortality Hospitalization
71
1Data Source: Death Statistical System, Tennessee Department of Health, Division of Health Statistics. Age adjustment based on the 2000 standard US population.
3Data Source: Tennessee Behavioral Risk Factor Surveillance System (BRFSS). Statistics are for 18+ unless indicated otherwise.
4MI= Myocardial Infarction.
5CHD=Coronary Heart Disease.
2Data Source: Hospital Discharge Data System, Tennessee Department of Health, Division of Health Statistics, 2007-2009. Data are for discharges, not necessarily for unique patients and are calculated for all ages. Age adjusted to 2000 US standard population.
Prevalence of CHD5 (%) 4.7 6.9 0.5 4.3 5.2
4,259.9
1,325.3
433.5
241.4
111.5
27.3
4,412.9
1,554.2
578.8
448.1
139.1
55.8
0 1000 2000 3000 4000 5000
85+
75-84
65-74
55-64
45-54
35-44
Deaths per 100,000
Age
Gro
up
Age Specific Mortality by Race, Heart Disease, 2007-20091
BlackWhite
71

Stroke Mortality1, Hospitialization2, and Prevalence3, 2007-2009
Prevalence4 (%) 2 3 3 3 0 4 2 4 2 1Hospitalization (per 100,000) 302.9 254.2 438.1 267.4 346.4Mortality (per 100,000) 61.5 51.6 90.8 56.7 66.8
MadisonStroke
Total White Black Female Male
81 85 93 85 85 6896
59 67 67 57 70 58
330370 374
341373 382 379 360 367 355 337
280 293
0
100
200
300
400
500
1997 1999 2001 2003 2005 2007 2009
Rat
e pe
r 100
,000
Age Adjusted Mortality1 and Hospitalization2, Stroke
Mortality Hospitalization
72
1Data Source: Death Statistical System, Tennessee Department of Health, Division of Health Statistics. Age adjustment based on the 2000 standard US population.
3Data Source: Tennessee Behavioral Risk Factor Surveillance System (BRFSS). Statistics are for 18+ unless indicated otherwise.
42009 data, NH white and NH black race groups.
2Data Source: Hospital Discharge Data System, Tennessee Department of Health, Division of Health Statistics, 2007-2009. Data are for discharges, not necessarily for unique patients and are calculated for all ages. Age adjusted to the 2000 standard US population.
Prevalence4 (%) 2.3 3.3 0.4 2.4 2.1
1395.9
413.5
117.0
16.9
3.5
7.8
1497.2
532.9
251.6
160.9
73.2
8.0
0 200 400 600 800 1000 1200 1400 1600
85+
75-84
65-74
55-64
45-54
35-44
Deaths per 100,000
Age
Gro
up
Age Specific Mortality by Race, Stroke, 2007-20091
BlackWhite
72
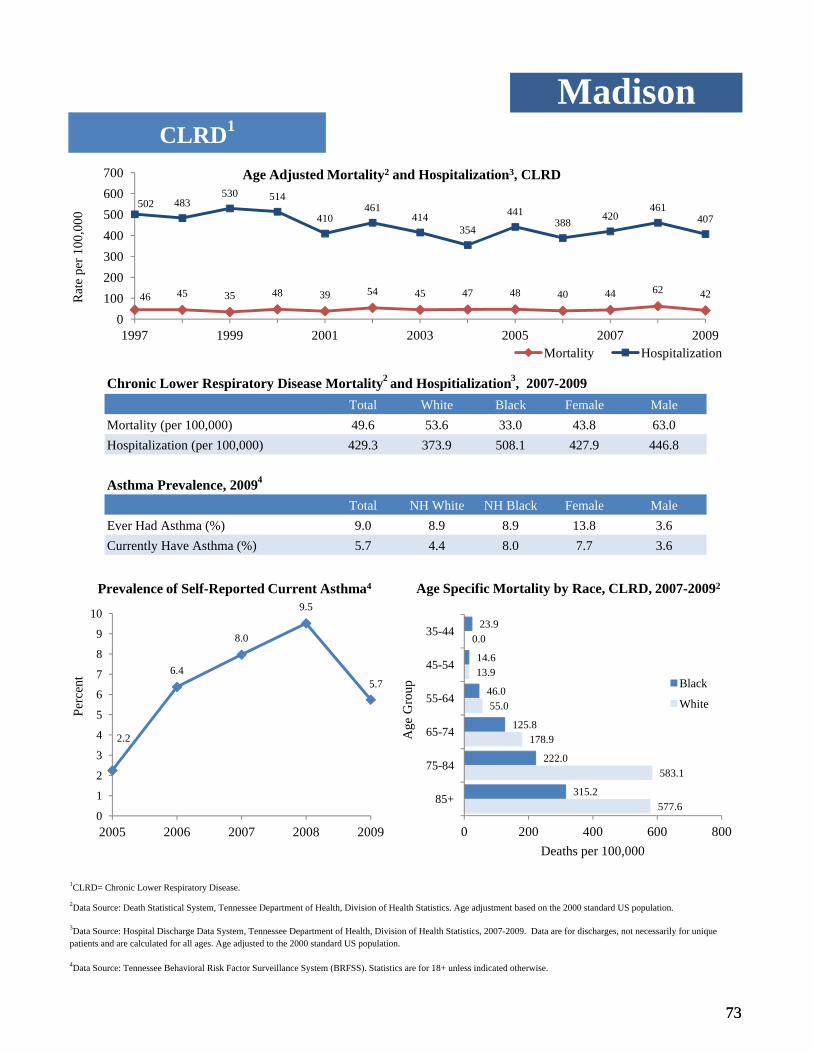
Chronic Lower Respiratory Disease Mortality2 and Hospitialization3, 2007-2009
Currently Have Asthma (%) 5.7 4.4 8.0 7.7 3.6Ever Had Asthma (%) 9.0 8.9 8.9 13.8 3.6
Asthma Prevalence, 20094
Total NH White NH Black Female Male
Hospitalization (per 100,000) 429.3 373.9 508.1 427.9 446.8Mortality (per 100,000) 49.6 53.6 33.0 43.8 63.0
MadisonCLRD1
Total White Black Female Male
46 45 35 48 39 54 45 47 48 40 44 62 42
502 483530 514
410461
414354
441388 420
461407
0100200300400500600700
1997 1999 2001 2003 2005 2007 2009
Rat
e pe
r 100
,000
Age Adjusted Mortality2 and Hospitalization3, CLRD
Mortality Hospitalization
73
1CLRD= Chronic Lower Respiratory Disease.
2Data Source: Death Statistical System, Tennessee Department of Health, Division of Health Statistics. Age adjustment based on the 2000 standard US population.
4Data Source: Tennessee Behavioral Risk Factor Surveillance System (BRFSS). Statistics are for 18+ unless indicated otherwise.
3Data Source: Hospital Discharge Data System, Tennessee Department of Health, Division of Health Statistics, 2007-2009. Data are for discharges, not necessarily for unique patients and are calculated for all ages. Age adjusted to the 2000 standard US population.
2.2
6.4
8.0
9.5
5.7
0
1
2
3
4
5
6
7
8
9
10
2005 2006 2007 2008 2009
Perc
ent
Prevalence of Self-Reported Current Asthma4
577.6
583.1
178.9
55.0
13.9
0.0
315.2
222.0
125.8
46.0
14.6
23.9
0 200 400 600 800
85+
75-84
65-74
55-64
45-54
35-44
Deaths per 100,000
Age
Gro
up Black
White
Age Specific Mortality by Race, CLRD, 2007-20092
73

Self-Blood Glucose Monitoring at Least Once Daily (%) 75.9 71.7 82.1 71.1 82.0
Prevalence (%) 13.0 13.3 12.1 13.5 12.4
Diabetes Prevalence3 and Diabetes Management Indicators3, 2009Total NH White NH Black Female Male
Hospitalization (per 100,000) 231.3 98.1 537.8 250.0 217.1Mortality (per 100,000) 28.0 17.8 64.1 23.0 34.8
MadisonDiabetes
Diabetes Mortality1 and Hospitialization2, 2007-2009 Total White Black Female Male
39 35 27 34 28 28 38 37 41 32 31 25 28
194 174 164 145192
226259
234 221 229 238 248208
0
100
200
300
1997 1999 2001 2003 2005 2007 2009
Rat
e pe
r 100
,000
Age Adjusted Mortality1, and Hospitalization2, Diabetes
Mortality Hospitalization
74
1Data Source: Death Statistical System, Tennessee Department of Health, Division of Health Statistics. Age adjustment based on the 2000 standard US population.
3Data Source: Tennessee Behavioral Risk Factor Surveillance System (BRFSS). Statistics are for 18+ unless indicated otherwise.
2Data Source: Hospital Discharge Data System, Tennessee Department of Health, Division of Health Statistics, 2007-2009. Data are for discharges, not necessarily for unique patients and are calculated for all ages. Age adjusted to the 2000 standard US population.
Received a Dilated Eye Exam in past 12 Months (%) 67.3 60.1 100.0 55.7 90.3
Foot Examined by a Doctor in Past 12 Months (%) 55.4 51.9 62.4 50.6 61.4
at Least Once Daily (%)
240.7
106.0
55.1
38.1
17.4
0.0
709.2
444.1
302.0
91.9
22.0
8.0
0 100 200 300 400 500 600 700 800
85+
75-84
65-74
55-64
45-54
35-44
Deaths per 100,000
Age
Gro
up
Age Specific Mortality by Race, Diabetes, 2007-20091
BlackWhite
74
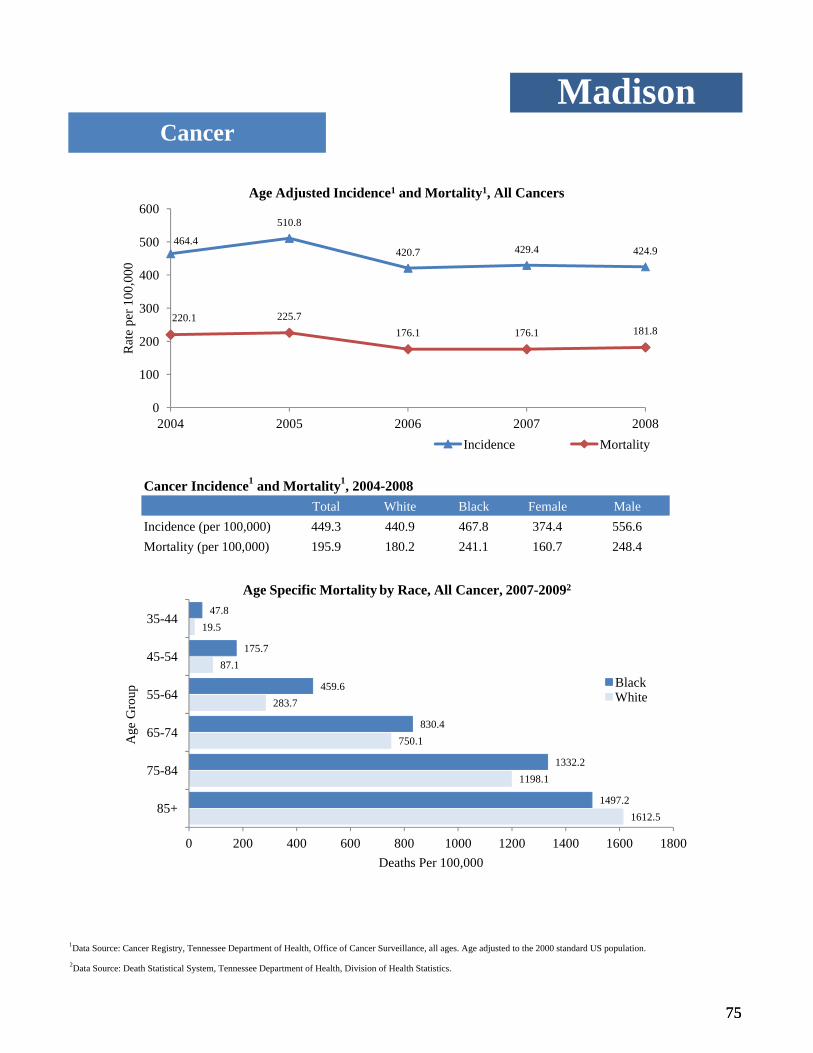
Mortality (per 100,000) 195.9 180.2 241.1 160.7 248.4Incidence (per 100,000) 449.3 440.9 467.8 374.4 556.6
MadisonCancer
Cancer Incidence1 and Mortality1, 2004-2008 Total White Black Female Male
464.4
510.8
420.7 429.4 424.9
220.1 225.7176.1 176.1 181.8
0
100
200
300
400
500
600
2004 2005 2006 2007 2008
Rat
e pe
r 100
,000
Age Adjusted Incidence1 and Mortality1, All Cancers
Incidence Mortality
75
1Data Source: Cancer Registry, Tennessee Department of Health, Office of Cancer Surveillance, all ages. Age adjusted to the 2000 standard US population.
2Data Source: Death Statistical System, Tennessee Department of Health, Division of Health Statistics.
1612.5
1198.1
750.1
283.7
87.1
19.5
1497.2
1332.2
830.4
459.6
175.7
47.8
0 200 400 600 800 1000 1200 1400 1600 1800
85+
75-84
65-74
55-64
45-54
35-44
Deaths Per 100,000
Age
Gro
up
Age Specific Mortality by Race, All Cancer, 2007-20092
BlackWhite
75

Mortalit (per 100 000) 59 0 53 3 76 1 38 1 89 0Incidence (per 100,000) 76.7 74.1 82.9 51.6 112.6
MadisonLung Cancer
Lung Cancer Incidence1 and Mortality1, 2004-2008Total White Black Female Male
87.3 80.2 76.0 79.8
61.4
68.0 71.1
47.9 52.4 56.2
0
50
100
150
200
2004 2005 2006 2007 2008
Rat
e pe
r 100
,000
Age Adjusted Incidence1, and Mortality1, Lung Cancer
Incidence Mortality
76
1Data Source: Cancer Registry, Tennessee Department of Health, Office of Cancer Surveillance, all ages. Age adjusted to the 2000 standard US population.
2Data Source: Death Statistical System, Tennessee Department of Health, Division of Health Statistics.
Mortality (per 100,000) 59.0 53.3 76.1 38.1 89.0
288.8
360.5
295.9
72.0
27.9
3.9
236.4
355.2
327.1
114.9
43.9
8.0
0 50 100 150 200 250 300 350 400
85+
75-84
65-74
55-64
45-54
35-44
Deaths Per 100,000
Age
Gro
up
Age Specific Mortality by Race, Lung Cancer, 2007-20092
BlackWhite
76

Female Breast Cancer Incidence1 and Mortality1, 2004-2008
Incidence (per 100,000) 108.1 105.8 108.9Mortality (per 100,000) 23.3 22.4 22.6
MadisonBreast Cancer
Total White Black
113.4121.5
96.4105.0 103.6
25.2 23.5 24.131.9
0
50
100
150
200
2004 2005 2006 2007 2008
Rat
e pe
r 100
,000
Age Adjusted Incidence1 and Mortality1, Female Breast Cancer
Incidence Mortality
^
77
1Data Source: Cancer Registry, Tennessee Department of Health, Office of Cancer Surveillance, all ages. Age adjusted to the 2000 standard US population.2Data Source: Death Statistical System, Tennessee Department of Health, Division of Health Statistics.^ Indicates data has been suppressed due to small numbers.
265.9
104.9
89.3
16.5
27.3
8.0
213.2
265.8
0.0
84.4
92.0
0.0
0 50 100 150 200 250 300
85+
75-84
65-74
55-64
45-54
35-44
Deaths Per 100,000
Age
Gro
up
Age Specific Mortality by Race, Female Breast Cancer, 2007-20092
BlackWhite
77

Mortality (per 100,000) 18.3 15.6 25.9 13.1 24.4Incidence (per 100,000) 52.2 50.6 55.7 42.4 66.4
Colorectal Cancer Incidence1 and Mortality1, 2004-2008 Total White Black Female Male
MadisonColorectal Cancer
43.0
66.356.8 53.4
42.3
15.122.3
17.1 18.2 18.2
0
20
40
60
80
100
2004 2005 2006 2007 2008
Rat
e p
er 1
00,0
00
Age Adjusted Incidence1 and Mortality1, Colorectal Cancer
Incidence Mortality
78
1Data Source: Cancer Registry, Tennessee Department of Health, Office of Cancer Surveillance, all ages. Age adjusted to the 2000 standard US population.
2Data Source: Death Statistical System, Tennessee Department of Health, Division of Health Statistics.
168.5
180.2
55.1
42.3
0.0
0.0
236.4
177.6
100.7
34.5
7.4
15.9
0 50 100 150 200 250
85+
75-84
65-74
55-64
45-54
35-44
Deaths Per 100,000
Age
Gro
up
Age Specific Mortality by Race, Colorectal Cancer, 2007-20092
BlackWhite
78

Prostate Cancer Incidence1 and Mortality1, 2004-2008
Incidence (per 100,000) 132.8 114.4 196.9Mortality (per 100,000) 24.2 20.8 38.6
MadisonProstate Cancer
Total White Black
111.7122.3 121.1 123.5
181.2
0
50
100
150
200
2004 2005 2006 2007 2008
Rat
e pe
r 100
,000
Age Adjusted Incidence1, Prostate Cancer*
Incidence
79
1Data Source: Cancer Registry, Tennessee Department of Health, Office of Cancer Surveillance, all ages. Age adjusted to the 2000 standard US population.
2Data Source: Death Statistical System, Tennessee Department of Health, Division of Health Statistics.
*All mortality trend data suppressed due to small numbers.
523.6
215.6
44.8
8.7
0.0
604.2
401.6
59.6
75.7
0.0
0 100 200 300 400 500 600 700
85+
75-84
65-74
55-64
45-54
Deaths Per 100,000
Age
Gro
up
Age Specific Mortality by Race, Prostate Cancer, 2007-20092
BlackWhite
79

Median Age1:
Median Income1:
Home Ownership1:
Unemployment1:
Crime Rate2 (per 1,000) : 141.1
Teen Pregnancy Rate3 (per 1,000)
Population by Age, Gender, and Race Distribution (2005-2009)1 Overall:
Age White:
Black:
Infant Mortality4 (per 1,000)
Overall:
<18 White:
18-44 Black:
45-6465+Total 480,031 438,155 379,289 464,816 41,744 918,186
18
120,010 105,697 113,410 101,383 4,978 225,707 Automobile Accident Deaths4 (per 100,000): 14.8
55,592
179,290 168,584 131,982 184,412 18,251 347,874
35,719 54,833 33,398 1,317 91,311
118.2
12.6
125,139 128,155 79,064 145,623 17,198 253,294 0.6
Female Male Non-Hispanic
White
Non-Hispanic
Black
Hispanic
9.6%
90.8
Gender Race Total 43.8
ShelbyDemographics Quick Facts
34.1
44,146
63.6%
47.7MaleDemographics, 2005-20091
$
80
1Data Source: U.S. Census Bureau, American Community Survey, 2005-2009.
4Data Source: Death Statistical System, Tennessee Department of Health, Division of Health Statistics, 2007-2009.
2Data Source: Tennessee Bureau of Investigation. "Tennessee Incident Based Reporting System (TIBRS)" accessed July 26, 2011. http://www.tennesseecrimeonline.com/tibrspublic2005, 2007-2009.
3Data Source: Birth Statistical System, Fetal Death Statistical System, and Induced Abortion Statistical System. Tennessee Department of Health, Division of Health Statistics, 2007-2009.
19.315.2
79.5
4.550.6
41.3
52.347.7
0 20 40 60 80 100
Individuals in PovertyFamilies in Poverty
HS Graduate
HispanicNH BlackNH White
Female Male
Percent
Demographics, 2005-20091
80

General HealthShelby
14.918.9
12.615.7 16.6
0
20
40
60
2005 2006 2007 2008 2009
Perc
ent
"Fair/Poor" Health1
59.2 59.4
49.6
66.8
49.047.4 47.6
54.2
50.5
57.8
0
20
40
60
80
100
2005 2006 2007 2008 2009
Perc
ent
Pneumonia and Influenza Vaccination Status1
18.211.2 13.4
18.812.6
0
20
40
60
2005 2006 2007 2008 2009
Perc
ent
Lacking Health Insurance1
81
Prevalence for General Health Indicators Among Adults 18+, 20091
1Data Source: Tennessee Behavioral Risk Factor Surveillance System (BRFSS). Statistics are for 18+ unless indicated otherwise.
2Age 65+.
3Age 50+.
8.3
Mean # of Days of Poor Mental Health per Month 13.8 11.4 16.1 11.1 18.0
Mean # of Days of Poor Physical Health per Month 9.0 9.3 9.5 9.5
12.9
Male
Fair/Poor Health Status (%) 16.5 11.6 23.3 21.7 10.6
Received Flu Shot in Past 12 Months3 (%) 57.8 63.7 47.4 56.2 60.1Ever Received Pneumonia Vaccination2 (%) 49.0 54.2 43.5 47.9 50.7
Indicator Total NH White NH Black Female
Lacking Health Insurance (%) 12.5 6.7 17.4 12.2
0
20
2005 2006 2007 2008 2009
Ever received pneumonia vaccination (age 65+) Received flu shot in past 12 months (age 50+)
81
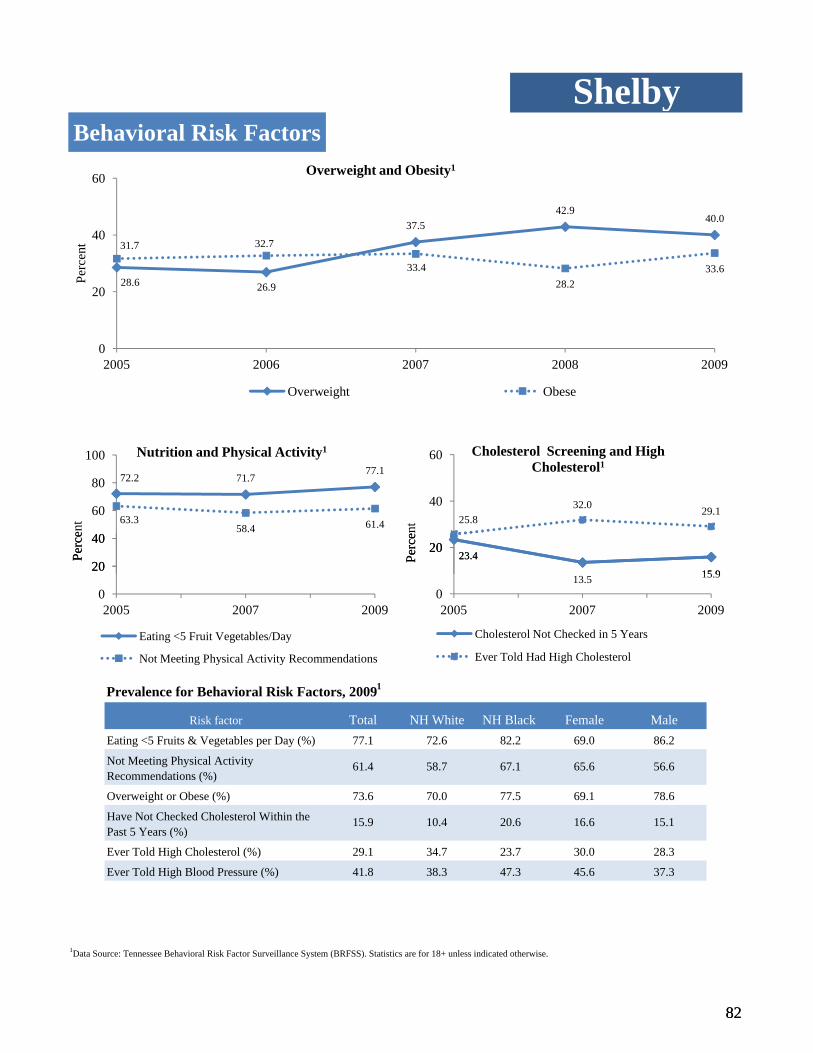
ShelbyBehavioral Risk Factors
28.6 26.9
37.542.9
40.0
31.7 32.7
33.428.2
33.6
0
20
40
60
2005 2006 2007 2008 2009
Perc
ent
Overweight and Obesity1
Overweight Obese
72.2 71.777.1
63.358.4 61.4
20
40
60
80
100
Perc
ent
Nutrition and Physical Activity1
23.4
15 9
25.832.0 29.1
20
40
60
Perc
ent
Cholesterol Screening and High Cholesterol1
82
Prevalence for Behavioral Risk Factors, 20091
1Data Source: Tennessee Behavioral Risk Factor Surveillance System (BRFSS). Statistics are for 18+ unless indicated otherwise.
Ever Told High Blood Pressure (%) 41.8 38.3 47.3 45.6 37.3
Ever Told High Cholesterol (%) 29.1 34.7 23.7 30.0 28.3
Have Not Checked Cholesterol Within the Past 5 Years (%)
15.9 10.4 20.6 16.6 15.1
Overweight or Obese (%) 73.6 70.0 77.5 69.1 78.6
Not Meeting Physical Activity Recommendations (%)
61.4 58.7 67.1 65.6 56.6
Eating <5 Fruits & Vegetables per Day (%) 77.1 72.6 82.2 69.0 86.2
Risk factor Total NH White NH Black Female Male
0
20
40
2005 2007 2009
Perc
e
Eating <5 Fruit Vegetables/Day
Not Meeting Physical Activity Recommendations
23.4
13.5 15.9
0
20
2005 2007 2009
Perc
en
Cholesterol Not Checked in 5 Years
Ever Told Had High Cholesterol
82

ShelbyCigarette & Alcohol Use
5.57.5
4.05.0
2.3
10.2
14.512.3 13.1
7.9
5
10
15
20
Perc
ent
Alcohol Use1
25.8
18.218.8
22.8
14.8
05
10152025303540
2005 2006 2007 2008 2009
Perc
ent
Current Cigarette Smokers1
83
Prevalence for Alcohol and Tobacco Use, 20091
1Data Source: Tennessee Behavioral Risk Factor Surveillance System (BRFSS). Statistics are for 18+ unless indicated otherwise.
Current Smokers (%) 14.8 12.0 17.9 16.3 13.1Binge Drinking (%) 7.9 11.1 4.1 6.5 9.4Heavy Drinking (%) 2.3 4.3 0.7 1.6 3.1
Indicator Total NH White NH Black Female Male
5.54.0
5.0
2.3
0
5
2005 2006 2007 2008 2009
Per
Heavy Drinking Binge Drinking
83

Leading Causes of Death, 2007-20091
Rank2
13.8 21.010 Kidney disease 391 16.4 10.5 26.2
5.7 31.2
9 Influenza and pneumonia 463 19.5 19.0 18.8 16.9 24.7
8 Homicide 494 18.0 5.8 29.3
39.8 36.2
7 Diabetes mellitus 715 28.9 16.9 47.9 26.5 32.6
6 Alzheimer’s disease 880 38.9 40.4 36.4
27.4 64.6
5 Chronic lower respiratory diseases
968 41.7 48.3 30.1 37.1 50.8
4 Accidents 1,172 43.9 42.8 43.1
3 Stroke 1,382 57.6 41.8 80.8 53.3 64.2
2 Cancer 5,100 206.7 175.8 252.4
1 Heart disease 5,577 231.0 198.8 276.6 187.2 298.6
170.3 271.4
ShelbyLeading Causes of Death
Cause # Deaths Age Adjusted Mortality Rate3 and Demographic RankingTotal White Black Female Male
84
Ranking Key: 1 2 3 4 5
1Data Source: Death Statistical System, Tennessee Department of Health, Division of Health Statistics. Age adjusted to the 2000 standard US population.
2Ranking order is based on counts for the total population. Demographic ranking is based on counts for each subgroup.
3Annual mortality rate per 100,000 population. Age adjusted to the 2000 standard US population.
y
1,147.0
761.3
1,090.3
777.9
914.8
0 200 400 600 800 1000 1200 1400
Male
Female
Black
White
Total
Deaths per 100,000
All Cause Mortality by Race, 2007-20091,3
84

Heart Disease Mortality1 and Hospitialization2, 2007-2009
Heart Disease Prevalence3, 2009
Pre alence of CHD5 (%) 3 4 4 2 3 1 2 6 4 1Prevalence of MI4 (%) 3.9 3.9 4.5 3.7 4.1
Total NH White NH Black Female Male
Hospitalization (per 100,000) 1,346.7 1,034.0 1,726.6 1,139.8 1,629.7Mortality (per 100,000) 231.0 198.8 276.6 187.2 298.6
ShelbyHeart Disease
Total White Black Female Male
348 340346 344 305 318 308 287 277 243 239 229 225
1,519 1,557 1,548 1,579 1,554 1,628 1,6601,561 1,490 1,453 1,412 1,339 1,290
0
500
1000
1500
2000
1997 1999 2001 2003 2005 2007 2009
Rat
e Pe
r 100
,000
Age Adjusted Mortality1 and Hospitalization2, Heart Disease
Mortality Hospitalization
85
1Data Source: Death Statistical System, Tennessee Department of Health, Division of Health Statistics. Age adjustment based on the 2000 standard US population.
3Data Source: Tennessee Behavioral Risk Factor Surveillance System (BRFSS). Statistics are for 18+ unless indicated otherwise.
4MI= Myocardial Infarction.
5CHD=Coronary Heart Disease.
2Data Source: Hospital Discharge Data System, Tennessee Department of Health, Division of Health Statistics, 2007-2009. Data are for discharges, not necessarily for unique patients and are calculated for all ages. Age adjusted to 2000 US standard population.
Prevalence of CHD5 (%) 3.4 4.2 3.1 2.6 4.1
4,645.1
1,420.9
477.3
178.1
73.4
27.6
4,142.2
1,859.5
864.7
408.4
162.7
63.0
0 1000 2000 3000 4000 5000
85+
75-84
65-74
55-64
45-54
35-44
Deaths per 100,000
Age
Gro
up
Age Specific Mortality by Race, Heart Disease, 2007-20091
BlackWhite
85

Stroke Mortality1, Hospitialization2, and Prevalence3, 2007-2009
Prevalence4 (%) 2 8 3 6 2 5 4 2 1 3Hospitalization (per 100,000) 369.8 275.7 483.0 361.6 379.8Mortality (per 100,000) 57.6 41.8 80.8 53.3 64.2
ShelbyStroke
Total White Black Female Male
89 87 83 87 79 84 73 73 73 63 65 57 51
470495 483 483 488 479 477
436464
441
382 378350
0
100
200
300
400
500
1997 1999 2001 2003 2005 2007 2009
Rat
e pe
r 100
,000
Age Adjusted Mortality1 and Hospitalization2, Stroke
Mortality Hospitalization
86
1Data Source: Death Statistical System, Tennessee Department of Health, Division of Health Statistics. Age adjustment based on the 2000 standard US population.
3Data Source: Tennessee Behavioral Risk Factor Surveillance System (BRFSS). Statistics are for 18+ unless indicated otherwise.
42009 data, NH white and NH black race groups.
2Data Source: Hospital Discharge Data System, Tennessee Department of Health, Division of Health Statistics, 2007-2009. Data are for discharges, not necessarily for unique patients and are calculated for all ages. Age adjusted to the 2000 standard US population.
Prevalence4 (%) 2.8 3.6 2.5 4.2 1.3
1068.2
331.6
73.6
29.4
14.0
2.9
1174.0
570.7
267.4
102.9
46.1
20.6
0 200 400 600 800 1000 1200 1400
85+
75-84
65-74
55-64
45-54
35-44
Deaths per 100,000
Age
Gro
up
Age Specific Mortality by Race, Stroke, 2007-20091
BlackWhite
86

Chronic Lower Respiratory Disease Mortality2 and Hospitialization3, 2007-2009
Currently Have Asthma (%) 7.5 9.3 6.1 8.3 6.4Ever Had Asthma (%) 11.2 11.2 9.6 11.2 11.2
Asthma Prevalence, 20094
Total NH White NH Black Female Male
Hospitalization (per 100,000) 347.6 247.7 439.9 368.4 323.9Mortality (per 100,000) 41.7 48.3 30.1 37.1 50.8
ShelbyCLRD1
Total White Black Female Male
42 46 43 45 41 38 43 40 44 36 46 40 38
375 355 372 365 360 377 378 362393 369
334 354 354
0
100
200
300
400
500
600
1997 1999 2001 2003 2005 2007 2009
Rat
e pe
r 100
,000
Age Adjusted Mortality2 and Hospitalization3, CLRD
Mortality Hospitalization
87
1CLRD= Chronic Lower Respiratory Disease.
2Data Source: Death Statistical System, Tennessee Department of Health, Division of Health Statistics. Age adjustment based on the 2000 standard US population.
4Data Source: Tennessee Behavioral Risk Factor Surveillance System (BRFSS). Statistics are for 18+ unless indicated otherwise.
3Data Source: Hospital Discharge Data System, Tennessee Department of Health, Division of Health Statistics, 2007-2009. Data are for discharges, not necessarily for unique patients and are calculated for all ages. Age adjusted to the 2000 standard US population.
5.9
7.8
5.3
6.7
7.5
0
1
2
3
4
5
6
7
8
9
2005 2006 2007 2008 2009
Perc
ent
Prevalence of Self-Reported Current Asthma4
793.1
448.3
173.4
36.7
6.3
1.2
388.6
246.9
98.4
39.4
16.2
2.6
0 200 400 600 800 1000
85+
75-84
65-74
55-64
45-54
35-44
Deaths per 100,000
Age
Gro
up Black
White
Age Specific Mortality by Race, CLRD, 2007-20092
87

Self-Blood Glucose Monitoring at Least Once Daily (%) 77.9 72.7 85.1 79.1 75.4
Prevalence (%) 10.8 12.0 11.1 13.8 7.4
Diabetes Prevalence3 and Diabetes Management Indicators3, 2009Total NH White NH Black Female Male
Hospitalization (per 100,000) 250.7 113.0 413.0 230.2 273.1Mortality (per 100,000) 28.9 16.9 47.9 26.5 32.6
ShelbyDiabetes
Diabetes Mortality1 and Hospitialization2, 2007-2009 Total White Black Female Male
25 27 31 36 34 31 34 29 36 28 28 30 28
172 193 190 200 212 222251 251 258 243 248 249 256
0
100
200
300
400
1997 1999 2001 2003 2005 2007 2009
Rat
e pe
r 100
,000
Age Adjusted Mortality1, and Hospitalization2, Diabetes
Mortality Hospitalization
88
1Data Source: Death Statistical System, Tennessee Department of Health, Division of Health Statistics. Age adjustment based on the 2000 standard US population.
3Data Source: Tennessee Behavioral Risk Factor Surveillance System (BRFSS). Statistics are for 18+ unless indicated otherwise.
2Data Source: Hospital Discharge Data System, Tennessee Department of Health, Division of Health Statistics, 2007-2009. Data are for discharges, not necessarily for unique patients and are calculated for all ages. Age adjusted to the 2000 standard US population.
Received a Dilated Eye Exam in past 12 Months (%) 55.2 64.7 46.6 47.6 71.6
Foot Examined by a Doctor in Past 12 Months (%) 76.3 82.0 46.4 72.6 84.0
at Least Once Daily (%)
194.2
103.2
58.2
34.3
11.1
5.9
487.8
352.7
173.9
71.9
26.9
13.2
0 100 200 300 400 500 600
85+
75-84
65-74
55-64
45-54
35-44
Deaths per 100,000
Age
Gro
up
Age Specific Mortality by Race, Diabetes, 2007-20091
BlackWhite
88

Mortality (per 100,000) 213.5 177.2 271.8 182.0 267.1Incidence (per 100,000) 465.2 446.7 484.4 402.6 563.7
ShelbyCancer
Cancer Incidence1 and Mortality1, 2004-2008 Total White Black Female Male
405.6
503.2 484.6 471.5 460.2
210.7 223.6 218.8 209.7 205.0
0
100
200
300
400
500
600
2004 2005 2006 2007 2008
Rat
e pe
r 100
,000
Age Adjusted Incidence1 and Mortality1, All Cancers
Incidence Mortality
89
1Data Source: Cancer Registry, Tennessee Department of Health, Office of Cancer Surveillance, all ages. Age adjusted to the 2000 standard US population.
2Data Source: Death Statistical System, Tennessee Department of Health, Division of Health Statistics.
1739.9
1370.2
686.3
274.8
88.9
22.3
1885.1
1686.3
1025.5
512.8
175.4
48.7
0 500 1000 1500 2000
85+
75-84
65-74
55-64
45-54
35-44
Deaths Per 100,000
Age
Gro
up
Age Specific Mortality by Race, All Cancer, 2007-20092
BlackWhite
89

Mortalit (per 100 000) 59 6 52 8 70 2 44 4 83 1Incidence (per 100,000) 67.0 61.4 74.5 53.2 87.5
ShelbyLung Cancer
Lung Cancer Incidence1 and Mortality1, 2004-2008Total White Black Female Male
67.074.8
67.5 62.1 63.3
57.7 63.3 62.1 56.4 58.6
0
50
100
150
200
2004 2005 2006 2007 2008
Rat
e pe
r 100
,000
Age Adjusted Incidence1, and Mortality1, Lung Cancer
Incidence Mortality
90
1Data Source: Cancer Registry, Tennessee Department of Health, Office of Cancer Surveillance, all ages. Age adjusted to the 2000 standard US population.
2Data Source: Death Statistical System, Tennessee Department of Health, Division of Health Statistics.
Mortality (per 100,000) 59.6 52.8 70.2 44.4 83.1
424.9
421.2
233.9
79.5
18.4
5.3
264.6
432.8
301.9
147.7
40.7
7.4
0 100 200 300 400 500
85+
75-84
65-74
55-64
45-54
35-44
Deaths Per 100,000
Age
Gro
up
Age Specific Mortality by Race, Lung Cancer, 2007-20092
BlackWhite
90

Female Breast Cancer Incidence1 and Mortality1, 2004-2008
Incidence (per 100,000) 123.3 124.4 118.7Mortality (per 100,000) 32.1 24.0 43.1
ShelbyBreast Cancer
Total White Black
110.0126.9 127.0 128.7 123.3
33.9 33.5 33.7 28.6 30.8
0
50
100
150
200
2004 2005 2006 2007 2008
Rat
e pe
r 100
,000
Age Adjusted Incidence1 and Mortality1, Female Breast Cancer
Incidence Mortality
91
1Data Source: Cancer Registry, Tennessee Department of Health, Office of Cancer Surveillance, all ages. Age adjusted to the 2000 standard US population.2Data Source: Death Statistical System, Tennessee Department of Health, Division of Health Statistics.
93.8
121.7
76.3
53.7
16.3
2.4
338.0
220.8
141.1
97.7
45.0
11.5
0 50 100 150 200 250 300 350 400
85+
75-84
65-74
55-64
45-54
35-44
Deaths Per 100,000
Age
Gro
up
Age Specific Mortality by Race, Female Breast Cancer, 2007-20092
BlackWhite
91
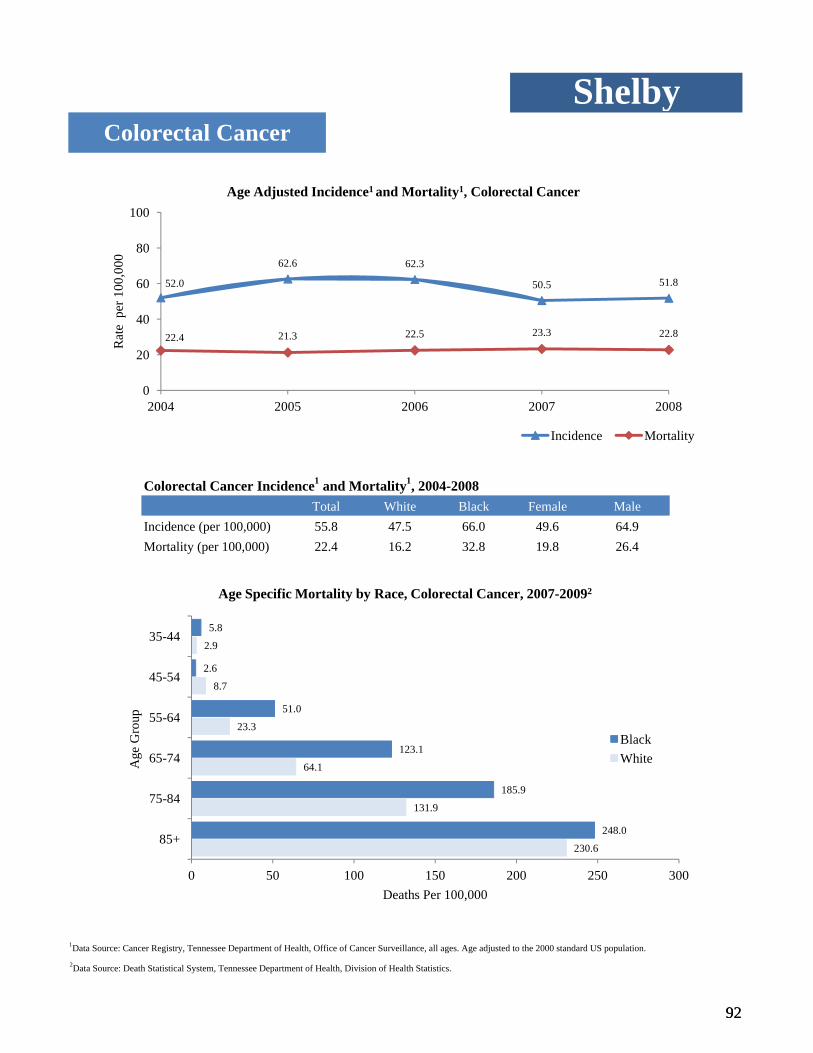
Mortality (per 100,000) 22.4 16.2 32.8 19.8 26.4Incidence (per 100,000) 55.8 47.5 66.0 49.6 64.9
Total White Black Female Male
ShelbyColorectal Cancer
Colorectal Cancer Incidence1 and Mortality1, 2004-2008
52.0
62.6 62.3
50.5 51.8
22.4 21.3 22.5 23.3 22.8
0
20
40
60
80
100
2004 2005 2006 2007 2008
Rat
e p
er 1
00,0
00
Age Adjusted Incidence1 and Mortality1, Colorectal Cancer
Incidence Mortality
92
1Data Source: Cancer Registry, Tennessee Department of Health, Office of Cancer Surveillance, all ages. Age adjusted to the 2000 standard US population.
2Data Source: Death Statistical System, Tennessee Department of Health, Division of Health Statistics.
230.6
131.9
64.1
23.3
8.7
2.9
248.0
185.9
123.1
51.0
2.6
5.8
0 50 100 150 200 250 300
85+
75-84
65-74
55-64
45-54
35-44
Deaths Per 100,000
Age
Gro
up
Age Specific Mortality by Race, Colorectal Cancer, 2007-20092
BlackWhite
92

Prostate Cancer Incidence1 and Mortality1, 2004-2008
Incidence (per 100,000) 173.7 155.4 203.5Mortality (per 100,000) 39.4 25.2 71.2
ShelbyProstate Cancer
Total White Black
115.7
183.5193.9 196.9
176.5
39.2 45.937.0 44.7
30.8
0
50
100
150
200
250
2004 2005 2006 2007 2008
Rat
e pe
r 100
,000
Age Adjusted Incidence1 and Mortality1, Prostate Cancer
Incidence Mortality
93
1Data Source: Cancer Registry, Tennessee Department of Health, Office of Cancer Surveillance, all ages. Age adjusted to the 2000 standard US population.
2Data Source: Death Statistical System, Tennessee Department of Health, Division of Health Statistics.
562.0
244.0
51.3
11.3
4.9
1,265.4
647.2
177.3
45.9
0.0
0 200 400 600 800 1000 1200 1400
85+
75-84
65-74
55-64
45-54
Deaths Per 100,000
Age
Gro
up
Age Specific Mortality by Race, Prostate Cancer, 2007-20092
BlackWhite
93

Median Age1:
Median Income1:
Home Ownership1:
Unemployment1:
Crime Rate2 (per 1,000) : 97.5
Teen Pregnancy Rate3 (per 1,000)
Population by Age, Gender, and Race Distribution (2005-2009)1 Overall:
Age White:
Black:
Infant Mortality4 (per 1,000)
Overall:
<18 White:
18-44 Black:
45-6465+Total 79,238 74,076 145,924 3,078 1,624 153,314
9.3
22,712 21,390 42,411 913 157 44,102 Automobile Accident Deaths4 (per 100,000): 12.3
15,578
25,092 24,811 47,421 1,116 638 49,903
11,215 26,041 332 175 26,793
64.3
9.2
15,856 16,660 30,051 717 654 32,516 0.2
Female Male Non-Hispanic
White
Non-Hispanic
Black
Hispanic
7.0%
55.4
Gender Race Total 55.3
SullivanDemographics Quick Facts
42.2
39,106
76.8%
48.3MaleDemographics, 2005-20091
$
94
1Data Source: U.S. Census Bureau, American Community Survey, 2005-2009.
4Data Source: Death Statistical System, Tennessee Department of Health, Division of Health Statistics, 2007-2009.
2Data Source: Tennessee Bureau of Investigation. "Tennessee Incident Based Reporting System (TIBRS)" accessed July 26, 2011. http://www.tennesseecrimeonline.com/tibrspublic2005, 2007-2009.
3Data Source: Birth Statistical System, Fetal Death Statistical System, and Induced Abortion Statistical System. Tennessee Department of Health, Division of Health Statistics, 2007-2009.
16.112.4
77.7
1.12.0
95.2
51.748.3
0 20 40 60 80 100
Individuals in PovertyFamilies in Poverty
HS Graduate
HispanicNH BlackNH White
Female Male
Percent
Demographics, 2005-20091
94

General HealthSullivan
21.921.0
24.4 22.5 22.9
0
20
40
60
2005 2006 2007 2008 2009
Perc
ent
"Fair/Poor" Health1
71.075.4
69.980.6
74.1
47.0
62.3 59.0
72.1 68.8
0
20
40
60
80
100
2005 2006 2007 2008 2009
Perc
ent
Pneumonia and Influenza Vaccination Status1
14.413.8 17.7 15.3 15.8
0
20
40
60
2005 2006 2007 2008 2009
Perc
ent
Lacking Health Insurance1
95
Prevalence for General Health Indicators Among Adults 18+, 20091
1Data Source: Tennessee Behavioral Risk Factor Surveillance System (BRFSS). Statistics are for 18+ unless indicated otherwise.
2Age 65+.
3Age 50+.
12.2
Mean # of Days of Poor Mental Health per Month 15.0 14.7 24.0 13.9 16.8
Mean # of Days of Poor Physical Health per Month 12.9 13.0 19.7 13.4
18.3
Male
Fair/Poor Health Status (%) 22.9 22.0 28.9 25.6 19.9
Received Flu Shot in Past 12 Months3 (%) 68.8 68.5 71.3 69.8 67.7Ever Received Pneumonia Vaccination2 (%) 74.1 73.5 100.0 69.0 81.1
Indicator Total NH White NH Black Female
Lacking Health Insurance (%) 15.8 15.0 78.9 13.5
0
20
2005 2006 2007 2008 2009
Ever received pneumonia vaccination (age 65+) Received flu shot in past 12 months (age 50+)
95
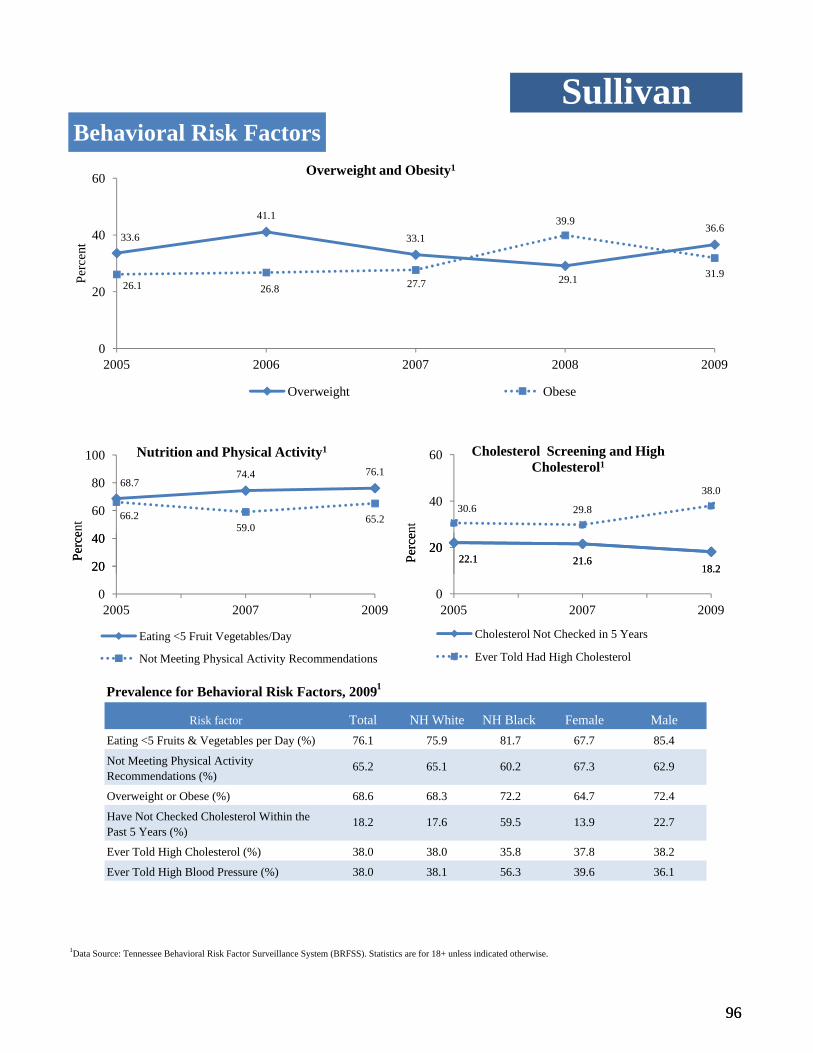
SullivanBehavioral Risk Factors
33.6
41.1
33.1
29.1
36.6
26.1 26.8 27.7
39.9
31.9
0
20
40
60
2005 2006 2007 2008 2009
Perc
ent
Overweight and Obesity1
Overweight Obese
68.774.4 76.1
66.259.0
65.2
20
40
60
80
100
Perc
ent
Nutrition and Physical Activity1
22.1 21.618.2
30.6 29.8
38.0
20
40
60
Perc
ent
Cholesterol Screening and High Cholesterol1
96
Prevalence for Behavioral Risk Factors, 20091
1Data Source: Tennessee Behavioral Risk Factor Surveillance System (BRFSS). Statistics are for 18+ unless indicated otherwise.
Ever Told High Blood Pressure (%) 38.0 38.1 56.3 39.6 36.1
Ever Told High Cholesterol (%) 38.0 38.0 35.8 37.8 38.2
Have Not Checked Cholesterol Within the Past 5 Years (%)
18.2 17.6 59.5 13.9 22.7
Overweight or Obese (%) 68.6 68.3 72.2 64.7 72.4
Not Meeting Physical Activity Recommendations (%)
65.2 65.1 60.2 67.3 62.9
Eating <5 Fruits & Vegetables per Day (%) 76.1 75.9 81.7 67.7 85.4
Risk factor Total NH White NH Black Female Male
0
20
40
2005 2007 2009
Perc
e
Eating <5 Fruit Vegetables/Day
Not Meeting Physical Activity Recommendations
22.1 21.618.2
0
20
2005 2007 2009
Perc
en
Cholesterol Not Checked in 5 Years
Ever Told Had High Cholesterol
96
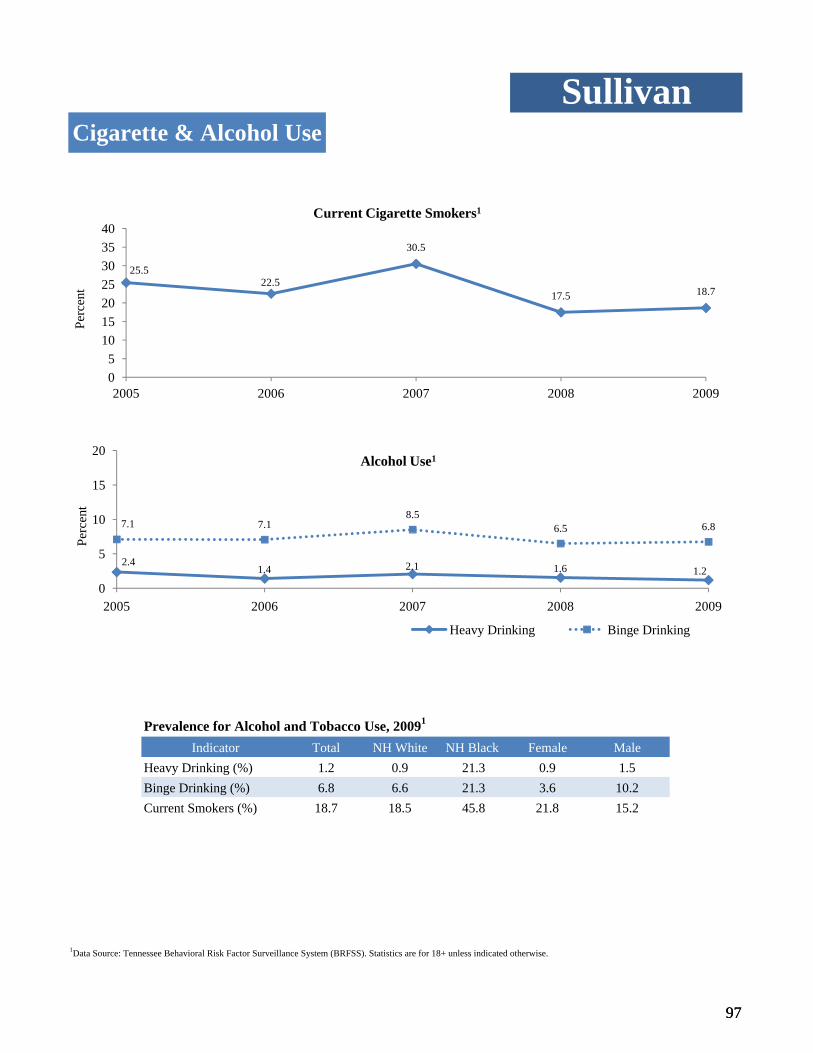
SullivanCigarette & Alcohol Use
2.41.4 2.1 1.6 1.2
7.1 7.18.5
6.5 6.8
5
10
15
20
Perc
ent
Alcohol Use1
25.522.5
30.5
17.5 18.7
05
10152025303540
2005 2006 2007 2008 2009
Perc
ent
Current Cigarette Smokers1
97
Prevalence for Alcohol and Tobacco Use, 20091
1Data Source: Tennessee Behavioral Risk Factor Surveillance System (BRFSS). Statistics are for 18+ unless indicated otherwise.
Current Smokers (%) 18.7 18.5 45.8 21.8 15.2Binge Drinking (%) 6.8 6.6 21.3 3.6 10.2Heavy Drinking (%) 1.2 0.9 21.3 0.9 1.5
Indicator Total NH White NH Black Female Male
2.41.4 2.1 1.6 1.2
0
5
2005 2006 2007 2008 2009
Per
Heavy Drinking Binge Drinking
97

Leading Causes of Death, 2007-20091
Rank2
11.7 12.110 Essential hypertension and hypertensive renal disease 76 11.9 11.6 36.6
17.0 24.9
9 Kidney disease 91 14.4 14.3 18.0 14.5 14.7
8 Influenza and pneumonia 125 19.9 19.8 39.7
34.2 30.0
7 Diabetes mellitus 165 26.7 25.9 89.2 23.7 31.0
6 Alzheimer’s disease 214 33.4 33.6 24.6
41.8 38.7
5 Accidents 225 45.8 46.1 19.1 27.5 65.7
4 Stroke 262 41.1 40.2 103.7
3 Chronic lower respiratory diseases
305 47.9 48.6 13.6 42.2 59.2
2 Cancer 1,208 194.1 194.5 188.0
1 Heart disease 1,249 199.4 197.7 325.1 151.5 262.3
161.4 242.7
SullivanLeading Causes of Death
Cause # Deaths Age Adjusted Mortality Rate3 and Demographic RankingTotal White Black Female Male
98
Ranking Key: 1 2 3 4 5
1Data Source: Death Statistical System, Tennessee Department of Health, Division of Health Statistics. Age adjusted to the 2000 standard US population.
2Ranking order is based on counts for the total population. Demographic ranking is based on counts for each subgroup.
3Annual mortality rate per 100,000 population. Age adjusted to the 2000 standard US population.
hypertensive renal disease
1,056.2
712.0
1,115.1
858.2
860.4
0 200 400 600 800 1000 1200
Male
Female
Black
White
Total
Deaths per 100,000
All Cause Mortality by Race, 2007-20091,3
98

Heart Disease Mortality1 and Hospitialization2, 2007-2009
Heart Disease Prevalence3, 2009
Pre alence of CHD5 (%) 7 3 7 1 9 5 9 7 5 1Prevalence of MI4 (%) 6.7 6.7 9.5 4.8 8.8
Total NH White NH Black Female Male
Hospitalization (per 100,000) 1,256.4 261.5 205.3 1,041.1 1,504.7Mortality (per 100,000) 199.4 197.7 325.1 151.5 262.3
SullivanHeart Disease
Total White Black Female Male
287 269 244 240 245 250 250 224 218 224 199 196 204
1,4311,271 1,156 1,168
1,310 1,353 1,293 1,223 1,301 1,314 1,250 1,263 1,257
0
500
1000
1500
2000
1997 1999 2001 2003 2005 2007 2009
Rat
e Pe
r 100
,000
Age Adjusted Mortality1 and Hospitalization2, Heart Disease
Mortality Hospitalization
99
1Data Source: Death Statistical System, Tennessee Department of Health, Division of Health Statistics. Age adjustment based on the 2000 standard US population.
3Data Source: Tennessee Behavioral Risk Factor Surveillance System (BRFSS). Statistics are for 18+ unless indicated otherwise.
4MI= Myocardial Infarction.
5CHD=Coronary Heart Disease.
2Data Source: Hospital Discharge Data System, Tennessee Department of Health, Division of Health Statistics, 2007-2009. Data are for discharges, not necessarily for unique patients and are calculated for all ages. Age adjusted to 2000 US standard population.
Prevalence of CHD5 (%) 7.3 7.1 9.5 9.7 5.1
3,562.3
1,172.8
543.2
282.4
132.6
57.1
3,521.1
3,039.5
378.1
795.2
138.4
0.0
0 500 1000 1500 2000 2500 3000 3500 4000
85+
75-84
65-74
55-64
45-54
35-44
Deaths per 100,000
Age
Gro
up
Age Specific Mortality by Race, Heart Disease, 2007-20091
BlackWhite
99
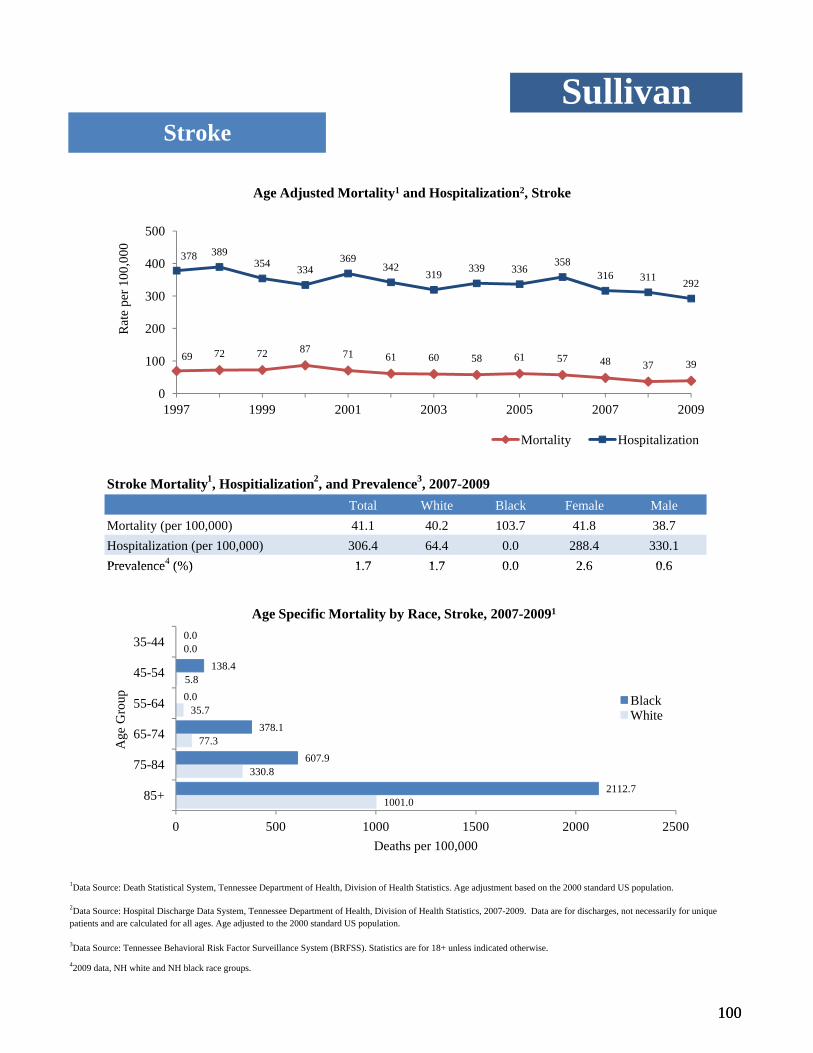
Stroke Mortality1, Hospitialization2, and Prevalence3, 2007-2009
Prevalence4 (%) 1 7 1 7 0 0 2 6 0 6Hospitalization (per 100,000) 306.4 64.4 0.0 288.4 330.1Mortality (per 100,000) 41.1 40.2 103.7 41.8 38.7
SullivanStroke
Total White Black Female Male
69 72 72 87 71 61 60 58 61 57 48 37 39
378 389354 334
369342
319 339 336358
316 311 292
0
100
200
300
400
500
1997 1999 2001 2003 2005 2007 2009
Rat
e pe
r 100
,000
Age Adjusted Mortality1 and Hospitalization2, Stroke
Mortality Hospitalization
100
1Data Source: Death Statistical System, Tennessee Department of Health, Division of Health Statistics. Age adjustment based on the 2000 standard US population.
3Data Source: Tennessee Behavioral Risk Factor Surveillance System (BRFSS). Statistics are for 18+ unless indicated otherwise.
42009 data, NH white and NH black race groups.
2Data Source: Hospital Discharge Data System, Tennessee Department of Health, Division of Health Statistics, 2007-2009. Data are for discharges, not necessarily for unique patients and are calculated for all ages. Age adjusted to the 2000 standard US population.
Prevalence4 (%) 1.7 1.7 0.0 2.6 0.6
1001.0
330.8
77.3
35.7
5.8
0.0
2112.7
607.9
378.1
0.0
138.4
0.0
0 500 1000 1500 2000 2500
85+
75-84
65-74
55-64
45-54
35-44
Deaths per 100,000
Age
Gro
up
Age Specific Mortality by Race, Stroke, 2007-20091
BlackWhite
100

Chronic Lower Respiratory Disease Mortality2 and Hospitialization3, 2007-2009
Currently Have Asthma (%) 9.4 9.5 11.6 10.9 7.8Ever Had Asthma (%) 13.4 13.6 11.6 13.9 12.8
Asthma Prevalence, 20094
Total NH White NH Black Female Male
Hospitalization (per 100,000) 319.8 81.8 81.8 346.9 290.5Mortality (per 100,000) 47.9 48.6 13.6 42.2 59.2
SullivanCLRD1
Total White Black Female Male
59 53 46 61 57 57 65 54 51 51 49 52 42
273 275 269 271 275317
272 299 312 324292
323 345
0
100
200
300
400
500
600
1997 1999 2001 2003 2005 2007 2009
Rat
e pe
r 100
,000
Age Adjusted Mortality2 and Hospitalization3, CLRD
Mortality Hospitalization
101
1CLRD= Chronic Lower Respiratory Disease.
2Data Source: Death Statistical System, Tennessee Department of Health, Division of Health Statistics. Age adjustment based on the 2000 standard US population.
4Data Source: Tennessee Behavioral Risk Factor Surveillance System (BRFSS). Statistics are for 18+ unless indicated otherwise.
3Data Source: Hospital Discharge Data System, Tennessee Department of Health, Division of Health Statistics, 2007-2009. Data are for discharges, not necessarily for unique patients and are calculated for all ages. Age adjusted to the 2000 standard US population.
9.5
14.7
10.49.5 9.4
0
2
4
6
8
10
12
14
16
2005 2006 2007 2008 2009
Perc
ent
Prevalence of Self-Reported Current Asthma4
461.2
432.3
194.3
74.7
16.0
1.6
0.0
304.0
0.0
0.0
0.0
0.0
0 100 200 300 400 500
85+
75-84
65-74
55-64
45-54
35-44
Deaths per 100,000
Age
Gro
up Black
White
Age Specific Mortality by Race, CLRD, 2007-20092
101

Self-Blood Glucose Monitoring at Least Once Daily (%) 83.2 83.5 0.0 88.6 77.9
Prevalence (%) 14.2 13.9 31.0 13.8 14.7
Diabetes Prevalence3 and Diabetes Management Indicators3, 2009Total NH White NH Black Female Male
Hospitalization (per 100,000) 189.2 45.6 35.6 189.0 191.8Mortality (per 100,000) 26.7 25.9 89.2 23.7 31.0
SullivanDiabetes
Diabetes Mortality1 and Hospitialization2, 2007-2009 Total White Black Female Male
22 20 23 27 33 30 40 36 34 36 33 24 23
136152 149 139
163
214174
157182
209183 197 188
0
100
200
1997 1999 2001 2003 2005 2007 2009
Rat
e pe
r 100
,000
Age Adjusted Mortality1, and Hospitalization2, Diabetes
Mortality Hospitalization
102
1Data Source: Death Statistical System, Tennessee Department of Health, Division of Health Statistics. Age adjustment based on the 2000 standard US population.
3Data Source: Tennessee Behavioral Risk Factor Surveillance System (BRFSS). Statistics are for 18+ unless indicated otherwise.
2Data Source: Hospital Discharge Data System, Tennessee Department of Health, Division of Health Statistics, 2007-2009. Data are for discharges, not necessarily for unique patients and are calculated for all ages. Age adjusted to the 2000 standard US population.
Received a Dilated Eye Exam in past 12 Months (%) 82.1 84.4 100.0 80.3 84.0
Foot Examined by a Doctor in Past 12 Months (%) 71.3 73.0 0.0 71.4 71.3
at Least Once Daily (%)
255.2
172.9
77.3
55.2
11.7
14.7
2112.7
607.9
0.0
198.8
0.0
0.0
0 500 1000 1500 2000 2500
85+
75-84
65-74
55-64
45-54
35-44
Deaths per 100,000
Age
Gro
up
Age Specific Mortality by Race, Diabetes, 2007-20091
BlackWhite
102

Mortality (per 100,000) 198.1 198.8 204.6 158.7 254.7Incidence (per 100,000) 491.3 494.2 389.8 428.3 581.2
SullivanCancer
Cancer Incidence1 and Mortality1, 2004-2008 Total White Black Female Male
496.7 471.7 483.2 487.0517.4
199.3 197.8 204.6 197.1 193.1
0
100
200
300
400
500
600
2004 2005 2006 2007 2008
Rat
e pe
r 100
,000
Age Adjusted Incidence1 and Mortality1, All Cancers
Incidence Mortality
103
1Data Source: Cancer Registry, Tennessee Department of Health, Office of Cancer Surveillance, all ages. Age adjusted to the 2000 standard US population.
2Data Source: Death Statistical System, Tennessee Department of Health, Division of Health Statistics.
1432.8
1338.3
779.7
332.7
154.5
48.9
1408.5
0.0
1134.2
695.8
138.4
0.0
0 200 400 600 800 1000 1200 1400 1600
85+
75-84
65-74
55-64
45-54
35-44
Deaths Per 100,000
Age
Gro
up
Age Specific Mortality by Race, All Cancer, 2007-20092
BlackWhite
103

Mortalit (per 100 000) 69 3 69 7 60 6 49 1 96 8Incidence (per 100,000) 87.4 88.2 ^ 66.7 115.8
SullivanLung Cancer
Lung Cancer Incidence1 and Mortality1, 2004-2008Total White Black Female Male
95.9 91.1 89.377.9 83.8
74.5 71.4 68.8 67.6 64.4
0
50
100
150
200
2004 2005 2006 2007 2008
Rat
e pe
r 100
,000
Age Adjusted Incidence1, and Mortality1, Lung Cancer
Incidence Mortality
104
1Data Source: Cancer Registry, Tennessee Department of Health, Office of Cancer Surveillance, all ages. Age adjusted to the 2000 standard US population.
2Data Source: Death Statistical System, Tennessee Department of Health, Division of Health Statistics.
^ Indicates data has been suppressed due to small numbers.
Mortality (per 100,000) 69.3 69.7 60.6 49.1 96.8
333.7
443.6
330.1
120.1
53.9
6.5
0.0
0.0
189.0
298.2
0.0
0.0
0 100 200 300 400 500
85+
75-84
65-74
55-64
45-54
35-44
Deaths Per 100,000
Age
Gro
up
Age Specific Mortality by Race, Lung Cancer, 2007-20092
BlackWhite
104
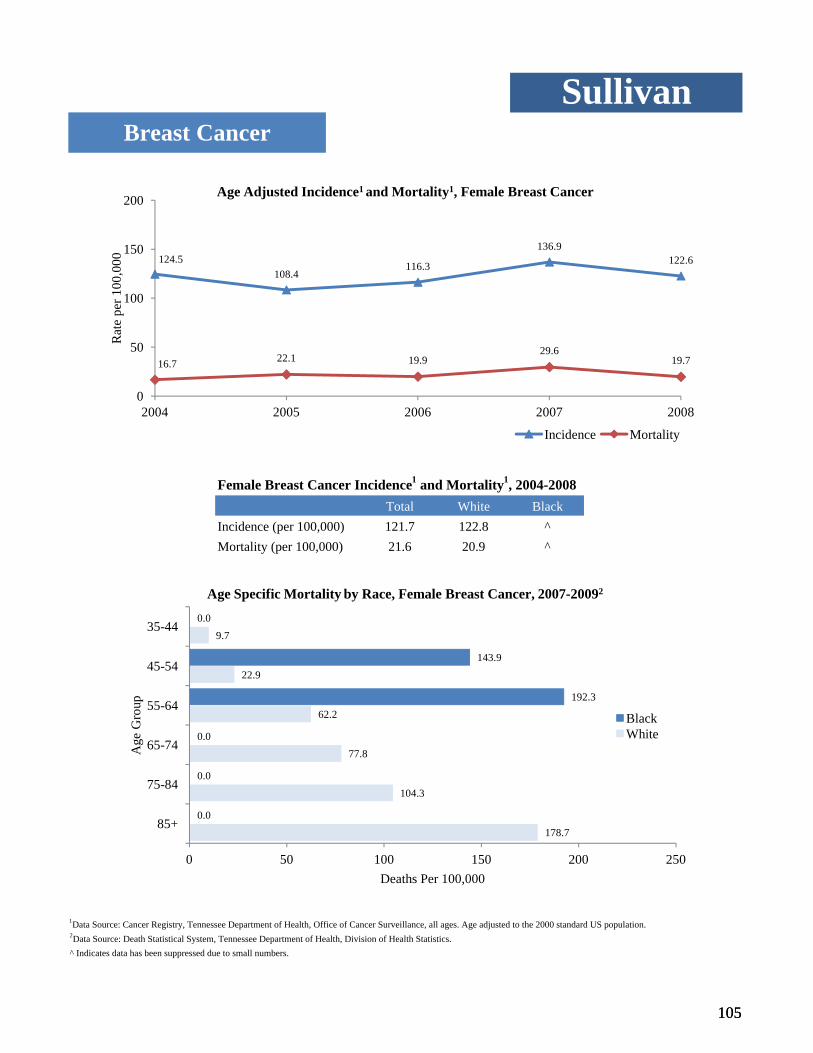
Female Breast Cancer Incidence1 and Mortality1, 2004-2008
Incidence (per 100,000) 121.7 122.8 ^Mortality (per 100,000) 21.6 20.9 ^
SullivanBreast Cancer
Total White Black
124.5108.4
116.3
136.9122.6
16.7 22.1 19.929.6
19.7
0
50
100
150
200
2004 2005 2006 2007 2008
Rat
e pe
r 100
,000
Age Adjusted Incidence1 and Mortality1, Female Breast Cancer
Incidence Mortality
105
1Data Source: Cancer Registry, Tennessee Department of Health, Office of Cancer Surveillance, all ages. Age adjusted to the 2000 standard US population.2Data Source: Death Statistical System, Tennessee Department of Health, Division of Health Statistics.^ Indicates data has been suppressed due to small numbers.
178.7
104.3
77.8
62.2
22.9
9.7
0.0
0.0
0.0
192.3
143.9
0.0
0 50 100 150 200 250
85+
75-84
65-74
55-64
45-54
35-44
Deaths Per 100,000
Age
Gro
up
Age Specific Mortality by Race, Female Breast Cancer, 2007-20092
BlackWhite
105

Mortality (per 100,000) 16.6 16.7 ^ 12.9 21.2Incidence (per 100,000) 44.6 44.5 ^ 39.8 50.4
Colorectal Cancer Incidence1 and Mortality1, 2004-2008 Total White Black Female Male
SullivanColorectal Cancer
52.346.4
40.3 38.245.8
16.1 17.0 15.0 18.5 16.7
0
20
40
60
80
100
2004 2005 2006 2007 2008
Rat
e p
er 1
00,0
00
Age Adjusted Incidence1 and Mortality1, Colorectal Cancer
Incidence Mortality
106
1Data Source: Cancer Registry, Tennessee Department of Health, Office of Cancer Surveillance, all ages. Age adjusted to the 2000 standard US population.
2Data Source: Death Statistical System, Tennessee Department of Health, Division of Health Statistics.
^ Indicates data has been suppressed due to small numbers.
186.5
146.6
39.8
32.5
18.9
1.6
0.0
0.0
0.0
99.4
0.0
0.0
0 50 100 150 200
85+
75-84
65-74
55-64
45-54
35-44
Deaths Per 100,000
Age
Gro
up
Age Specific Mortality by Race, Colorectal Cancer, 2007-20092
BlackWhite
106

Prostate Cancer Incidence1 and Mortality1, 2004-2008
Incidence (per 100,000) 139.4 138.8 203Mortality (per 100,000) 18.8 18.5 ^
SullivanProstate Cancer
Total White Black
163.3
129.2120.5
154.1
130.7
20.6
0.0
27.613.4 20.0
0
50
100
150
200
2004 2005 2006 2007 2008
Rat
e pe
r 100
,000
Age Adjusted Incidence1 and Mortality1, Prostate Cancer
Incidence Mortality
107
1Data Source: Cancer Registry, Tennessee Department of Health, Office of Cancer Surveillance, all ages. Age adjusted to the 2000 standard US population.
2Data Source: Death Statistical System, Tennessee Department of Health, Division of Health Statistics.
^ Indicates data has been suppressed due to small numbers.
445.8
106.7
51.1
17.0
0.0
0.0
0.0
0.0
0.0
0.0
0 100 200 300 400 500
85+
75-84
65-74
55-64
45-54
Deaths Per 100,000
Age
Gro
up
Age Specific Mortality by Race, Prostate Cancer, 2007-20092
BlackWhite
107

108
Technical Notes Data Sources American Community Survey (ACS) The American Community Survey is an ongoing survey administered by the U.S. Census Bureau that captures information related to demographic, socioeconomic status, employment status, and housing status. Demographic indicator definitions are as follows:
• Percent high school graduates: adults aged 18 and over that have completed high school, including those that have completed an education beyond high school.
• Poverty: families and individuals who are identified as having income at or below the 100% federal poverty level. http://www.census.gov/acs.
State Tobacco Activities Tracking and Evaluation (STATE) System
The STATE System is an electronic data warehouse maintained by the Centers of Disease Control and Prevention (CDC) in the Office on Smoking and Health (OSH), National Center for Chronic Disease Prevention and Health Promotion. It contains up-to-date and historical state-level data on tobacco use prevention and control. http://www.cdc.gov/tobacco/statesystem. Tennessee Incident Based Reporting System (TIBRS) TIBRS is an incident based reporting system that collects data on crimes that occur in the State of Tennessee. All law enforcement agencies, including colleges and universities, report monthly crime statistics to TIBRS. Population estimates used for calculating crime rates were taken from the 2010 U.S. Census. Crime statistics in this report include any crimes against persons, properties, or society. http://www.tennesseecrimeonline.com/tibrspublic2005.
Tennessee Population Estimates The population estimates used to calculate rates for incidence, mortality, hospitalization and teen pregnancy were the 2003 Population Estimates and Projections, 2008 Revision, from the Tennessee Department of Health’s Division of Health Statistics.
Tennessee Death Statistical System (DSS) The DSS is an annual, state-based compilation of mortality data. Analyses were limited to Tennessee residents. The DSS was used to calculate infant mortality, automobile accident mortality, leading causes of death, age-specific mortality for selected chronic diseases and mortality time trends for non-cancer chronic diseases. An infant death is defined as one that occurs before one year of age and infant mortality rates were calculated by dividing the number of infant deaths in a calendar year(s) by the number of live births registered for the same period of time. DSS data were provided by the Tennessee Department of Health’s Division of Health Statistics.
Tennessee Birth Statistical System (BSS) The BSS is an annual, state-based compilation of birth data. All data included in this report are for births to Tennessee residents that occurred both in and out of state. Data were collected on the 2003 revision of the Tennessee version of the U.S. Standard Certificate of Live Birth. The BSS was used to calculate teen pregnancy rate and to determine the denominator for infant mortality rates based on the DSS. BSS data were provided by the Tennessee Department of Health’s Division of Health Statistics.
Hospital Discharge Data System (HDDS) The HDDS is an annual, state-based compilation of data on patients discharged from all acute care hospitals licensed by the Tennessee Department of Health. The HDDS does not include federal facilities (i.e., VA hospitals, etc.) or facilities licensed by the Tennessee Department of Mental Health and Developmental Disabilities. Analyses were limited to the records of Tennessee residents. HDDS data were provided by the Tennessee Department of Health’s Division of Health Statistics.
Tennessee Cancer Registry (TCR) Cancer incidence data contain records of cases of primary cancer that were first diagnosed among Tennessee residents between January 1, 2004 and December 31, 2008, and that were reported to the TCR as of December 2010. Cases with unknown race (732 cases) were included in the “All Races” category. Seven cases with gender reported

109
as hermaphrodite or transsexual and twelve cases with unknown age were excluded from all analyses. TCR data were provided by the Tennessee Department of Health’s Office of Cancer Surveillance.
Behavioral Risk Factor Surveillance System (BRFSS) The BRFSS is an annual, state-based, random-digit-dialed telephone survey of the U.S. non-institutionalized population, 18 years of age and older, which gathers self-reported data on certain health conditions and behavioral risk factors. BRFSS data were used to calculate time trends and prevalence for many of the behavioral risk factors presented in this report. Risk factor definitions are as follows: • Overweight: body mass index (BMI) greater than or equal to 25 and less than 30. • Obese: BMI greater than or equal to 30. • Meeting physical activity recommendations: participating in either moderate physical activity for 30 or more
minutes per day on five or more days per week, or vigorous activity for 20 or more minutes per day on three or more days per week.
• Current cigarette smokers: individuals who have smoked at least 100 cigarettes in their lifetime and who now smoke everyday or some days.
• Heavy drinking: men having more than two drinks per day or women having more than one drink per day. • Binge drinking: men having five or more drinks on one occasion or women having four or more drinks on one
occasion. • Ever had asthma: having ever been told by a doctor, nurse, or other health care professional you have asthma. • Currently having asthma: having been told by a doctor, nurse, or other health care professional you have
asthma and still having asthma at the time of the survey. Definition of Terms Disease classifications For mortality data through 1998 and hospital discharge data for all years the International Classification of Diseases, 9th Revision (ICD-9) was used; for mortality data after 1999 the ICD-10 was used; for cancer incidence data International Classification of Diseases Oncology, 3rd Revision (ICD-O3) was used.
List of the International Classification of Diseases codes for select diseases:
Disease Category ICD-10 ICD-9 ICD-O3 All cancers C00-C97 140-208 C00.0-C80.9
Colorectal cancer C18-C21 153-154 C18.0-C18.9, C19.9, C20.9,C26.0
Lung cancer C33-C34 162 C34.0-C34.9 Breast cancer (Female) C50 174 C50.0-C50.9 Prostate cancer C61 185 C61.9 Diabetes mellitus E10-E14 250 N/A Diseases of heart I00-I09, I11, I13, I20-I51 390-398,402,404,410-429 N/A Stroke I60-I69 430-434,435,436-438 N/A Chronic lower respiratory diseases (CLRD) J40-J47 490-494,496 N/A
Motor vehicle accidents
V02-V04, V09.0, V09.2, V12-V14, V19.0, V19.2, V19.4-V19.6, V20-V79, V80.3-V80.5, V81.0-V81.1, V82.0-V82.1, V83-V86, V87.0-V87.8, V88.0-V88.8, V89.0, V89.2
E810-E825 N/A
Race and ethnicity For BSS, DSS and HDDS data the terms “white” and “black” refer to persons of any ethnicity. For BRFSS and U.S. Census data, the terms “NH white” and “NH black” refer to persons of non-Hispanic origin only, and the term “Hispanic” refers to persons of Hispanic ethnicity regardless of race.
110
Leading causes of death ranking Leading causes of death for the total population are listed in tables. A color code key was used to highlight the top five leading causes of death for each demographic group: total, white, black, female, and male. Ranks were based on number of deaths; however only diseases that appear in the top 10 leading causes of death for the total population are shown and/or highlighted for demographic subgroups. In most cases, the top five leading causes of death among demographic subgroups fall within the leading causes of death for the total population.
Site-specific cancers Due to small numbers of site-specific (i.e. lung, female breast, colorectal, prostate) cancer deaths in most counties, county-level mortality time trends are not presented. Cancer incidence data were suppressed when there were only 1-9 cases. Cancer incidence time trends were presented for counties where at least three years of data were not suppressed.
Teen pregnancy Teen pregnancy was defined as pregnancies among females aged 15-19 and was reported as rate per 1,000. The number of pregnancies was the sum of live births, reportable fetal deaths, and reported induced abortions. Teen pregnancy data were provided by Tennessee Department of Health, Division of Health Statistics.
Ranking Regional and county rankings for select indicators are in descending order, where a rank of 1 indicates the highest value for that indicator among all regions or counties.
Age-adjusted rate Cancer incidence and mortality rates were age-adjusted to the 2000 U.S. standard population with 5-year age intervals (19 age groups) except for age-specific rates. Counting of cases and calculation of rates were performed in SEER*STAT 7.0.4. Mortality rates for other diseases and hospitalization rates for all diseases were age-adjusted to the 2000 U.S. standard population with 10-year age intervals (11 age groups) unless indicated otherwise. Counting of cases and calculation of rates were performed using the SAS 9.2 software.
Suppression of data Rates were suppressed for all conditions in which the population at risk was less than 100 persons. For cancer incidence data, rates were suppressed if the count was between 1 and 9 cases. Suppression of data is represented by a ‘^’ symbol. A rate of ‘0’ indicates that there were no events.