chronic poverty and economic growth in uganda: the role of markets
TRANSCRIPT

Background Paper for the Chronic Poverty Report 2007/08
Chronic Poverty and Economic Growth in Uganda: The Role of Markets
Sarah N. Ssewanyana
Lawrence Bategeka
January 2007
Chronic Poverty and Economic Growth in Uganda
2
CPRC Research for BASIS Collaborative Research Support Program
Abstract
To design effective strategies to combat poverty, policy makers need to know precisely who have and have not benefited from the impressive macroeconomic performance Uganda enjoyed between 1992 and 2000. And this is what the paper endeavours to provide insights into, with a bias in favour of, and thereby focus on the role of, markets. Broadly speaking, the good macroeconomic performance during this period contributed to the reduction of poverty. The agricultural growth policies during 1992 and 2000 are perhaps the most important causes of the increased participation of the chronically poor individuals/households in labour and commodity markets. Some areas benefited more than the others. Because of the conflict that has ravaged the North over 20 years, the benefits were minimal.
To make markets operate in ways that include the chronically poor on beneficial terms, Government and other development partners should remove constraints that inhibit the participation of the poor in those markets.
The chronically poor need to be specifically targeted with a view to enhancing their productivity through better access to land, credit, agricultural inputs, and extension services.
Keywords: Uganda, markets, growth, macroeconomic, poverty dynamics
About the authors
Sarah N. Ssewanyana, Economic Policy Research Centre, Makerere University, Kampala, Uganda
E-mail: [email protected]
Lawrence Bategeka, Economic Policy Research Centre, Makerere University, Kampala, Uganda

Chronic Poverty and Economic Growth in Uganda
3
CPRC Research for BASIS Collaborative Research Support Program
Table of Contents 1. Basic growth environment ...............................................................................5
1.1 General growth environment ....................................................................5
1.2 Main sources of growth ............................................................................6
1.3 Major economic growth shocks ................................................................7
1.4 Main growth policies that underlie the growth environment......................7
2. Poverty dynamics............................................................................................10
2.1 Poverty trends ........................................................................................10
2.2 Sources of income for different poverty groups......................................12
2.3 Basic characteristics of each poverty state ............................................13
3. Agricultural growth policies and chronic poverty .......................................15
3.1 General policy issues and performance in agriculture............................15
3.2 Labour market ........................................................................................18
3.3 Commodity market .................................................................................19
3.4 Financial market .....................................................................................21
4. Urban economic policies and chronic poverty ............................................23
4.1 General issues in urban poverty.............................................................23
4.2 Labour market ........................................................................................24
4.3 Financial Market .....................................................................................25
4.4 Housing market ......................................................................................25
5. Infrastructure, poverty dynamics and chronic poverty ...............................26
5.1 General issues in infrastructure..............................................................26
5.2 Infrastructure and commodity markets ...................................................28
5.3 Infrastructure and financial markets .......................................................28
5.4 Infrastructure and labour markets...........................................................29
5.5 Conclusions and emerging issues..........................................................29
References................................................................................................................32

Chronic Poverty and Economic Growth in Uganda
4
CPRC Research for BASIS Collaborative Research Support Program
Tables Table 1: Uganda: Policy variables ..............................................................................35 Table 2: Uganda: Annual average growth rates of GDP.............................................35 Table 3: Poverty headcount trends and growth rates (%), 1992-2000........................37 Table 4: Poverty transition matrix, 1992-2000 ............................................................38 Table 5: Poverty state by geographical location and occupation of household
head..............................................................................................................38 Table 6: Changes in monthly mean consumption expenditure among panel
households ...................................................................................................39 Table 7: Annual sources of income per capita by poverty state (Ug.Shs),
Uganda .........................................................................................................39 Table 8: Share of household source of income by poverty state, Uganda..................40 Table 9: Selected basic household characteristics by poverty state, Uganda ............41 Table 10: Agro-ecological zones, market access and population density by
poverty state, rural ........................................................................................42 Table 11: Major event experienced by crop farmers by poverty state, rural .................42 Table 12: Household enterprise by poverty state (%), rural..........................................44 Table 13: Ownership of household enterprise by poverty state, rural ...........................44 Table 14: Participation and access to key facilities by poverty state, rural ...................46 Table 15: Simple correlation of Urban proximity and crop yield by poverty
state, rural.....................................................................................................47 Table 16: Access to financial markets by poverty state, rural .......................................47 Table 17: Access to credit by poverty state, rural .........................................................47 Table 18: Occupation status of persons 15-64 years, urban ........................................48 Table 19: Working population by age-cohort and poverty state, urban.........................48 Table 20: Housing characteristics by poverty state, urban ...........................................50 Table 21: Access to social services by poverty state, Uganda .....................................50 Table 22: Access to social services by poverty state, Uganda .....................................52 Table 23: Source of credit by poverty state, Uganda....................................................52 Table 24: Purpose of loan by poverty state, Uganda....................................................53 Table 25: Distance to local government by poverty state, Uganda...............................54 Table 26: Average distance to selected infrastructure by poverty state,
Uganda .........................................................................................................54 Table 27: Access to agricultural inputs by poverty state, rural Uganda ........................55 Table 28: Source of main information on technology by poverty state, rural
Uganda .........................................................................................................56 Table 29: Crop cultivated by poverty state....................................................................57
Chronic Poverty and Economic Growth in Uganda
5
CPRC Research for BASIS Collaborative Research Support Program
1. Basic growth environment
1.1 General growth environment
For Uganda, the 1990s were characterised by strong economic growth, partly driven by external and internal shocks. These shocks had both positive and negative effects on the performance of the economy. Table 1 presents selected macro policy variables. Uganda’s growth environment between 1992 and 2000 focused mainly on inflation control, which was seen as the overarching condition for investment and consequently economic growth. Annual underlying inflation rates fell from 26% in 1992/93 to 5% in 1999/2000. Since 1996/97, annual underlying inflation has been in single digits. Low inflation was expected to provide an environment conducive to private sector investment and consequently growth.
The Government’s liberalisation and privatisation policies, which were implemented onwards of 1992, were intended to improve efficiency in the allocation of resources, and the management of business - both of which were expected to maximise economic growth. Internal liberalisation in particular was expected to increase the production of agricultural export commodities because of the farmers’ increased share of the international prices of such commodities, such as coffee. Indeed, following liberalisation in the marketing and pricing of coffee, the farmers’ share of the international price of coffee increased to 80% compared to 20% prior to liberalisation (Kasekende and Atingi-Ego, 1999).
In addition to controlling inflation and improving production price incentives through liberalisation, the Government created the Uganda Investment Authority (UIA), which was to identify investment constraints, propose appropriate interventions to address the identified constraints, and be a one stop centre for foreign investors so as to quicken business start ups. The UIA put in place an investment code that was mainly geared to attracting foreign direct investment.
The economic policies and measures Uganda implemented from 1992 led to a significant improvement in the performance of the economy. From 1992 to 2000 real Gross Domestic Product (GDP) grew by nearly 7% per annum, on average, but declined between 1999 and 2002 to 5.9% (see Table 2). Growth in the agricultural sector was much slower than growth in industry or services, making it harder for people

Chronic Poverty and Economic Growth in Uganda
6
CPRC Research for BASIS Collaborative Research Support Program
employed in this sector to move out of poverty. Other notable features, shown in Table 1, were the deteriorating internal terms of trade, associated in part with a fall in crop prices relative to prices of goods and services, and positive growth although at a decreasing rate in private consumption.
The good economic performance from 1992 to 2000 benefited all categories of people, including the chronically poor. However, it is difficult to assess the impact of the slow down in the economy thereafter on the chronically poor1. Nevertheless, since 2000 the investment climate was hardly supportive of private domestic investment, because of their poor access to financial services, high interest rates, an incentive structure that turned against agricultural production, and drought. The period has been characterised by slow growth in the agricultural sector, which is where the majority of the rural population and the chronically poor, in particular, derive their livelihoods.
While internal liberalisation led to increased farm gate prices, the impacts of liberalisation on agricultural performance were mixed at best. The incentive structure obtaining in the goods and services market tilted against agriculture. Although farm gate prices of agricultural commodities increased following liberalisation, prices of inputs also increased but proportionately much more. In addition, prices of non-farm goods and services increased proportionately more than the prices of agricultural commodities thus tilting the incentive structure in favour of non-farm goods and services. Indeed, there was significant movement of labour out of farm to non-farm activities. Similarly, non-agricultural wages increased proportionality than agricultural wages, which pitted agriculture against other sectors.
1.2 Main sources of growth
We provide a summary the main sources of growth in Uganda for the period 1992 to 2000 (for a discussion of said sources since 1986 see Okidi et al (2005)). Uganda’s main sources of growth from 1992 to 2000 were the good economic policies that led to increases in agricultural incomes, foreign direct investment, remittances by Ugandans living abroad, and the high growth of the real sector. In addition, Uganda’s economic growth has thus been partly driven by increased private sector investment, especially in industry and construction, and increased
1 The last national panel data collected by the Uganda Bureau of Statistics was in 1999 but plans are underway to have panel data collection as a routine exercise.
Chronic Poverty and Economic Growth in Uganda
7
CPRC Research for BASIS Collaborative Research Support Program
donor support geared towards public sector spending on social services. The performance of agriculture has been mixed at best, growing at rates lower than the growth in population (of 3.2% per annum). Until 1995 services and industry grew at an increasing rate, while agriculture grew at a low and erratic rate, depending mainly on weather conditions.
Exports increased significantly and the structure of exports changed drastically with new exports, particularly fish, cut flowers, and maize, coming on board. While total exports increased from US$171 million in 1992 to US$478 million in 1999, the share of coffee in exports decreased from 78% in 1992 to 67% in 1999 and more recently to less than 30% in 2005.
The significant increase in the price of robusta coffee on the international market from US$0.94 per kilogram in 1992 to US$2.77 per kilogram in 1995 largely explains the significant increase in Uganda’s export earning between 1992 and 1995. The price of robusta coffee on the international market fell significantly from $2.77 in 1995 to $0.61 in 2001. However, exports generally continued to rise on account of export diversification.
1.3 Major economic growth shocks
The rebel insurgency caused by the Lords Resistance Army (LRA) in Northern Uganda disrupted economic activities in that part of the country throughout the period under review. Economic performance in rebel infested areas remained poor from 1992 to 2000, and remained unchanged in 2005.
As pointed out already, Uganda’s coffee growing areas registered significant growth in incomes in the years 1995/96 because of significant increase in the international price of coffee, a phenomenon that was in Uganda called the “the coffee boom”. Soon after benefiting from the coffee boom of 1995/96, Uganda suffered severe floods or an El Niño weather phenomenon in 1997 that affected agriculture adversely. As pointed out already, the price of robusta coffee on the international market fell significantly from 1996 to 2000 causing an economic shock. The prices of robusta coffee on the international market remained low from 2000 to 2005, registering dismal increases from $0.61 in 2001 to $1.09 in 2005. The terms of trade that had improved somewhat in 1995/96 deteriorated from 1997 to 2000.

Chronic Poverty and Economic Growth in Uganda
8
CPRC Research for BASIS Collaborative Research Support Program
Apart from worsening terms of trade, other shocks that have had a profound effect on agricultural production include crop diseases especially for coffee, banana and cassava. Coffee exports fell from 4.24 million bags in 1996 to 3.07 million bags in 2000 on account of declining production arising from the coffee wilt disease. Even when prices recovered somewhat from 2001, the quantity of coffee produced continued to fall due to the adverse effect of the coffee wilt disease. Coffee exports fell further from 3.07 million bags in 2000 to 2.30 million bags in 2005.
More recently in 2006, Uganda suffered a significant drop in the quantity of electricity produced from about 300 megawatts to below 150 megawatts. The economic impact of this shock is yet to be known.
1.4 Main growth policies that underlie the growth environment
Prior to 1992, Uganda’s economy was characterised by market disequilibrium. Markets were controlled and the state was engaged in business through public enterprises. To correct market disequilibrium Uganda began liberalising all markets with a view to obtaining market efficiency in resource allocation and distribution of goods and services. The openness of Uganda’s economy increased significantly from 1992 through 2000. Liberalisation and privatisation led to private sector led growth in Uganda during the period under review and beyond.
Liberalisation and privatisation took place in all four markets considered in this paper: the commodity, financial, labour, and housing markets. Liberalisation of markets and privatisation enhanced household participation in business in general, and agriculture related businesses in particular. From 1992 to 2000 households enjoyed their right to engage or not in the commodity market, or any other market, purely on economic considerations. Government’s role in markets became limited to regulation and to ensuring discipline. Agriculture was seen as a business and not as a public good for which public sector investment would be justified on account of fighting hunger and malnutrition. Later in 2000, the Government prepared and launched the Plan for Modernisation of Agriculture (PMA). The PMA is premised on the belief that agriculture is a business and farmers should purchase all inputs from the market without any Government subsidy.
From 1997, Government increased its focus on poverty reduction, through increased public spending on social sectors. In 1997 the Government launched its first Poverty Eradication Action Plan (PEAP), bringing poverty eradication into mainstream policy formulation. The
Chronic Poverty and Economic Growth in Uganda
9
CPRC Research for BASIS Collaborative Research Support Program
PEAP has been used as the basis for planning and policy formulation and as a planning framework for achieving national development objectives and modernising the economy.
In 1997 Uganda abolished school fees in government-aided primary schools with a view to enrolling all children of school going age in school. The share of education budget in the national budget increased significantly from 15% in 1996 to 21% in 2001. The share of agriculture in the national budget remained at about 4%.
Uganda liberalised the financial sector onwards of 1992. The country reformed the financial sector so that it could be supportive of the emerging private sector, particularly large businesses. The 1993 Bank of Uganda Act and 1994 Financial Institutions Statute were intended to strengthen Uganda’s financial system. The 1994 Financial Intuitions Statute focused on improvement of central bank’s supervision of commercial banks to ensure that the commercial banks were strong and sustainable.
The good aspects of financial sector reforms aside, rural areas became increasingly under banked as large commercial banks closed their branches in smaller towns and/or rural areas. Microfinance institutions emerged to fill the void, but the range of financial products offered was not suitable for the economic activities of rural areas. The loan interest rates microfinance institutions charged were on average 60% per annum. The loan repayment terms that require a client to make weekly repayments were harsh and inconsistent with the credit requirements of rural farming people. Even in the formal credit market, annual interest rates on loans rose to an average of 30%, driven mainly by monetary and fiscal operations that were geared towards maintaining macroeconomic stability.
With regard to the labour market, liberalisation was again the major driving policy. Market forces determined wage rates across different sectors. Paid labour supply in agriculture was low as most peasant farmers preferred to work on their own land. Accordingly, most labour in agriculture is self-employed, eking a living on small-holder subsistence agriculture. Preference by peasants to work on personal land, little pay in waged employment in agriculture, and low cash needs are other factors explaining the low supply of wage labour in agriculture. The agricultural wage labour market in rural areas was largely a missing market during the period under review. However, the poor were willing to supply labour for non-farm activities such as quarrying, mining, and making bricks. Nonetheless, the labour supplied to non-farm activities in rural areas was largely self-employment rather than wage labour, which is almost non-existent in rural areas in Uganda. There are exceptions such as employment in sugar cane cutting where sugar companies hire paid labour from places far away from where the sugar factories are located. As the sugar industry grew, paid employment in sugar cutting commensurately increased. The same thing can be said of
Chronic Poverty and Economic Growth in Uganda
10
CPRC Research for BASIS Collaborative Research Support Program
employment in the tea industry. However, the chronically poor particularly those in rural areas prefer to live a subsistence life. Their cash requirements are low, driven mainly by absence of bills to pay such as for electricity, water etc. The chronically poor hardly pay direct taxes. Graduated tax, which was a head tax that every adult male was required to pay, was abolished in 2004 thus decreasing further cash requirements of the chronically poor.
Regarding manpower planning and training, there appear to be mismatches between the skills supplied and the skills demanded. Young graduates from universities and other tertiary institutions find it difficult to find jobs (Okurut et al, 2005). In rural areas young people that drop out of school or complete the primary education cycle but fail to proceed to secondary or post-primary education find it difficult to get employment. Without any means of sustenance, the youth resort to crime, violence, abuse of alcohol and drugs, this exacerbates their poverty situation even further. Thus participation of the chronically poor in the labour market becomes very limited.
The policy of liberalisation has affected the housing industry in Uganda in a fundamental way. The National Housing and Construction Corporation (NHCC) sold off many houses to private buyers. The NHCC is in the process of privatisation. Government encourages individuals and private firms to build houses for themselves. Uganda has, during the last two decades, witnessed a significant expansion of the housing sector. The government’s role in the housing sector in urban areas is limited to approving building plans, and ensuring quality of building construction. There are hardly any housing schemes for the poor in urban areas, and where efforts are made by the public sector to provide housing for the poor the rich often grab such opportunities for themselves. There is neither a housing policy nor regulation of housing in rural areas.
Chronic Poverty and Economic Growth in Uganda
11
CPRC Research for BASIS Collaborative Research Support Program
2. Poverty dynamics
2.1 Poverty trends
During the period 1992-20002, Uganda recorded impressive economic growth as discussed in Section 0. The recovery and growth strategies during this period caused an impressive reduction on the poverty headcount index (see Table 3). In 2000, 34% of the population in Uganda was living in poverty down from 56% in 1992. But poverty increased to 38% in 2003. In absolute terms, the number of poor persons reduced from 9.2 million in 1992 to 7.2 million in 2000 before increasing to 9.8 million in 20033. The decline in national poverty is reflected in the regional and rural/urban poverty estimates, except in the North where it remained almost unchanged. Poverty in Uganda remains more pronounced in rural areas and among crop-based agricultural households. Notwithstanding the impressive decline in poverty headcount, income inequality as measured by the Gini coefficient increased from 0.364 in 1992 to 0.384 in 2000; with the Gini declining for rural areas from 0.326 to 0.322 and increasing for urban areas from 0.395 to 0.406 (Appleton, 2001).
Similar trends are observed regardless of the occupation category of the household head (see Table 3). Considering the panel and non-panel households within each survey year, we observe a similar declining trend. Poverty in households in the panel declined significantly from 55.4% to 35.5%. The only exceptions are those individuals in agricultural waged employment who are also residents in panel households. This period was also marked with strong growth in mean consumption4 but with substantial differences across geographical location. The growth rate in mean consumption per adult equivalent was 5.7% per annum, with 7.8% in urban areas and 4.8% in rural areas. All regions recorded impressive growth well above that for the entire Uganda. The only exception was the North, with only a 1.4% growth rate.
2 The period 1992 and 2000 refers to the period 1992/93 and 1999/2000 respectively. 3 These estimates exclude the districts of Gulu, Kitgum, Pader, Kasese and Bundibugyo. 4 This refers to consumption expenditure per adult equivalent, which is used as a measure of well-being.

Chronic Poverty and Economic Growth in Uganda
12
CPRC Research for BASIS Collaborative Research Support Program
Turning to occupation-employment status typology5, individuals in households whose head is a non-agricultural wage employee registered a growth rate of 5.8% compared to 3.9% for their counterparts whose head is self-employed outside agriculture. Considering self-employment, those in agriculture registered a higher growth rate than those in non-agriculture. Under waged employment, those in non-agricultural occupation experienced a higher growth rate than those in agriculture. Overall, the growth rate in mean consumption expenditure per adult equivalent is above the growth rate of private consumption per capita in the national accounts (see Appleton, 2001); it is also much higher than the growth in agricultural GDP. But the impressive reduction in poverty levels and overall macroeconomic performance mask movements into and out of poverty.
Next we narrow our analysis to households in the panel dataset of 1992/93 and 1999/20006. The analysis uses data on the 1,309 households7 that were first surveyed as part of the Integrated Household Survey (IHS) of 1992/93; and that were re-surveyed as part of the National Household Survey in 1999/2000 (UNHS I)8. Several studies have used this panel dataset but with differing objectives. Such studies include Kasirye (2005) on vulnerability; Okidi and McKay (2003) on poverty dynamics in general; Deininger and Okidi (2003) on growth and poverty reduction; and Lawson et al (2003) on poverty dynamics. The last three studies endeavour to provide insights into factors affecting poverty dynamics. Deininger and Okidi (2003) employed both descriptive and regression methods to identify factors influencing slipping into and moving out of poverty. They find agricultural prices to be the main driver of income growth and poverty reduction.
Clearly, these studies provide important detailed policy-relevant information but they do not empirically link up the poverty dynamics at household level in general and chronic poverty in particular to examine the role of markets, namely labour, financial, commodity and housing. And this is the focus of our study. While issues of representativeness of panel survey remain a key challenge in empirical panel data analysis, for the case of Uganda Okidi and McKay (2003) have empirically demonstrated that most estimates of panel and non-panel population based on the 1992/2000 dataset are not statistically different within each survey year. Consequently, their finding gives us confidence that the analysis using this panel dataset hereinafter portrays a picture for the entire Uganda.
5 Occupation-employment status typology was grouped into 4 categories. Those employed as (1) agricultural and fishery workers in self employment; (2) agricultural and fishery workers in waged employment; (3) non-agricultural workers in self employment; and (4) non-agricultural workers in waged employment. 6 For convenience, these survey dates are hereinafter referred to as 1992 and 2000. 7 The Uganda panel follows a household NOT an individual. 8 The attrition rate was 6.24%.

Chronic Poverty and Economic Growth in Uganda
13
CPRC Research for BASIS Collaborative Research Support Program
The poverty transition matrix between 1992 and 2000 is presented in Table 4. The results reveal that 64.4% of those households that were poor households in 1992 moved out of poverty by 2000, whereas nearly a quarter of those households that were not poor in 1992 descended into poverty by 2000. On the other hand, about 58% remained in the same state as they were in 1992. But mobility is very high, with nearly 48% of the panel households changing their poverty state. We further divide the panel households into four distinct poverty states, namely those who: remained poor in 1992 and 2000 (chronically poor); remained non-poor in both years (never poor); moved out of poverty; and slipped into poverty. Table 5 shows that close to 18.4% of the panel households were poor in both 1992 and 2000, a proportion that is slightly above that of those households that slipped into poverty (13.1%)9. This finding raises a challenge as to whether anti-poverty reduction interventions should focus on the chronically poor or on reducing the slippage into poverty.
Table 5 further reveals that almost one-fifth of the households in the panel were living in chronic poverty in rural areas compared to only 6.9% in urban areas. But almost one-third of the rural poor were chronically poor. Most poor Ugandans reside in rural areas, and it not surprising that the proportion of chronically poor people is greater in rural areas than in urban areas. Regionally, the proportion of chronically poor people in the East and the West is similar at about 15%. Chronic poverty is more pronounced in the North, with nearly 35% of households living in chronic poverty in both 1992 and 2000. The results further suggest that the relatively affluent households in this region are highly vulnerable as the proportion of those descending into poverty is higher than that of those households escaping poverty.
Considering occupation-employment status typology, households whose heads are self-employed were more likely to be stuck in chronic poverty than their counterparts with heads in wage/paid employment. However, the reverse is observed for those in non-agricultural occupations. Evidently, for those households moving out of poverty wage/paid employment seems to be an exit strategy relative to self employment. Overall rural areas, the East region, and agricultural wage employees10 recorded a higher proportion of those households moving out poverty. In addition, the results reveal that the chronically poor are less likely to be in agricultural employment and to be self-employed in the non-agricultural sector.
9 While there might be discrepancies in the distribution of each poverty state with the previous studies based on this same panel dataset, the magnitude between poverty states does not differ significantly. The discrepancies are probably due to level of analysis (individual/household) and use of sample weights to make the panel representative of the entire Uganda. 10 Unfortunately, no information was collected regarding tenure of employment for those in paid/waged employment.
Chronic Poverty and Economic Growth in Uganda
14
CPRC Research for BASIS Collaborative Research Support Program
Table 6 presents the changes in mean consumption for all households in the panel. All households in different poverty states benefited from the reforms/policies during the study period with the exception of those who slipped into poverty. Those who moved out seem to have benefited more with 13.3% annualised growth per annum well above the average of 6.3% per annum for all panel households. More notable, even chronically poor households realised growth of 2.5% per annum compared to 5.8% per annum for the never poor households. In other words, the overall growth during this period also benefited the chronically poor households though at a lower rate than those moving out of poverty.
2.2 Sources of income for different poverty groups
Clearly, there was growth in income derived from household enterprises and agriculture (see Table 7) – with strong growth from the former. This is true for all households in different poverty states. The growth patterns observed for income are similar to those of consumption expenditure (see Table 6). The only exceptions are those households in a state of chronic poverty. The results in
Table 8 reveal a shifting role of agriculture as a main source of income over the 8 year period. On average, agriculture contributed only 45.4% of total household income in 1992 but this increased to 50.7% in 2000. This increase was experienced by all households in the four poverty state groupings. Overall, the results suggest that there were structural changes in the composition of the income sources of the households in the panel. The strong growth in income derived from agriculture seems to have been an escape route. These findings re-affirm the critical role of agriculture in poverty reduction. More notable, the share is larger for the chronically poor households relative to the other poverty groupings. Growth in incomes at the household level is partly as a result of good macro-economic performance. So far the results suggest that self-employment in agriculture is not only the main source of livelihood (in terms of income and employment) but also one of the major characteristics of the chronically poor.
Chronic Poverty and Economic Growth in Uganda
15
CPRC Research for BASIS Collaborative Research Support Program
2.3 Basic characteristics of each poverty state
Okidi and McKay (2003) and Lawson et al (2003) do highlight some of the basic characteristics for each of the poverty states. They found that household size and education were key factors influencing a change in a household’s poverty state, of either slipping into or moving out of poverty. The former study goes further to suggest that the initial physical and human resource endowment were an important contributory factor. Building on their findings, in Table 9 we present additional characteristics at household level. The changes in household size and structure for all households are consistent with the changes in Uganda’s population structure, with the number of children growing faster than that of adults. Household size makes a difference the likelihood of escape from, or descent into, poverty. Small household size was an important factor for those households that escaped or remained non-poor in both years. Larger households were more likely than others to experience chronic poverty, mostly because they contained more children than adults. This finding implies that the chronically poor seem to have more mouths to feed than they have hands productive. Large household size in general and increase in number of children in particular were important causes of movements into poverty.
Considering working adults, the numbers did not change much except for those households slipping into poverty. However, the increase in numbers alone does not reflect the quality of labour and type of employment. At the same time, households in this poverty state had more of these adults work in the agricultural sector. Notable is the declining share of working children for all households in different poverty states. This result would be picking up the effect of UPE, with more children likely to be attending school than before. Most striking is the disproportionate increase in the share of elderly persons across poverty states. The share of members in domestic activities is several-fold that of members in unpaid work in household enterprises. More important the share of the latter increased but with a larger share among the chronically poor households. The rise is partly attributed to increased participation in non-crop enterprises, as will be discussed latter.

Chronic Poverty and Economic Growth in Uganda
16
CPRC Research for BASIS Collaborative Research Support Program
3. Agricultural growth policies and chronic poverty
3.1 General policy issues and performance in agriculture
Uganda implemented comprehensive reforms in all sectors starting mainly from 1990. The reforms were intended to improve market efficiency and thus maximise growth in all sectors, including agriculture. Broadly therefore, liberalisation and privatisation were the key policies that defined the operational environment in all sectors, including agriculture. However, the phasing and implementation of these policies varied, even within the same sector. For example in agriculture, privatisation occurred faster in the coffee industry (Coffee marketing Board) than in the dairy industry (the Uganda Diary Corporation).
In January 1991, the Coffee Board was split into two entities: The Coffee Marketing Board Ltd, which assumed the trading and processing functions of the former Coffee Marketing Board (CMB), and the Uganda Coffee Development Authority (UCDA), with responsibilities for monitoring and regulating the industry and advising Government on policy issues. That marked the starting point of liberalisation in the coffee industry. The Government outfit for coffee marketing soon folded up and private coffee export firms emerged on the market and increased in number from 0 in 1991 to over 70 by 1995.
Prior to liberalisation, Government heavily taxed coffee producers: the coffee grower’s share of export prices was as low as 15% in some years. Following liberalisation, the share increased to about 75%. This happened across a range of agricultural products. The thinking was that increased share of export prices would increase farmer incentives to produce for export. However, the effects of liberalisation and privatisation on production have been mixed, mainly because of other constraints that face agriculture including pests, diseases, and drought. The challenges that face agriculture notwithstanding, Uganda has maintained the same policy environment that obtained from 1991 and 2000 formalised now in the Plan for Modernisation of Agriculture (PMA).
There is almost a consensus in the literature that agricultural growth is the most crucial factor for reducing rural poverty (see Okidi et al, 2005). Currently in Uganda, nearly 80% of the population lives in rural areas and 85% of the workforce is engaged in agricultural sector (UBoS, 2005). However, it remains unclear whether this growth benefits chronically poor individuals/ households as well. But, as we have
Chronic Poverty and Economic Growth in Uganda
17
CPRC Research for BASIS Collaborative Research Support Program
demonstrated above, the growth realised during the study period did trickle down to the chronically poor households, though at a rate lower than the national average.
In Uganda most households in rural areas engage in agricultural activities as a source of livelihood. Agriculture includes crop and non-crop agriculture (including livestock, poultry and fishing farming). On average, the national picture shows that the population share in agriculture remained almost stable for the period of study, 69.6% in 1992 and 70.8% in 2000. But the share in rural areas increased by nearly 2 percentage points, from 77.7% in 1992 to 79.2% in 2000 (see also Appleton, 2001). The changes in the agricultural sector were largely driven by changes that took place in the crop agricultural sub-sector. The population share in the crop agriculture sub-sector increased from 66.6% in 1992 to 67.6% in 2000; compared to 3.0% in 1992 and 3.2% in 2000 for the non-crop agriculture sub-sector. But within the crop agriculture sub-sector, the proportion of individuals in households headed by cash crop farmers increased from 19.3% in 1992 to 22.1% in 2000 (Appleton, 2001). In rural areas alone, the share of the crop agriculture sub-sector increased from 74.3% in 1992 to 75.8% in 2000. Again, these findings seem to suggest that there was growth in employment in the agriculture sectors.
While the agricultural sector experienced growth between 1992 and 2000, there are growth differentials across sub-sectors. The growth in crop agriculture was 5.3% compared to 4.6% for all other agricultural sub-sectors (see Table 3). Earlier we demonstrated that consumption expenditure per adult equivalent and total household income per capita increased for agricultural workers employment in either self or waged employment. Additionally, agriculture ranked highest as the main source of income by 2000.
The rest of this section narrows the analysis on rural areas where agriculture is the dominant activity. Linking poverty state in the panel with agro-ecological zones11 (see Figure 1:) some interesting results emerge (see Table 10). The results reveal that chronic poverty is highly linked to less favoured agro-ecological zones. In other words, households in these areas are more vulnerable to chronic poverty. This finding is unsurprising since agriculture in these areas is prone to natural disasters such as drought. Besides natural disasters, households in these zones are involved in low value agriculture and have less access to markets with the exception of the unimodal high zone. The unimodal high zone has a ready market for its agricultural produce, especially maize in Kenya. More notable, unimodal high zone has the lowest proportion
11 The agro-ecological zone classification is based on Ruecker et al (2003) cited in Pender et al (2004). Classification is based on average length of growing period, rainfall pattern, maximum annual temperature and altitude. These zones were broadly categorized into unimodal and bimodal pattern rainfall zones. Within the unimodal class further categorization included very low, low, medium and high rainfall zones; the bimodal class had low, medium and high rainfall zones.
Chronic Poverty and Economic Growth in Uganda
18
CPRC Research for BASIS Collaborative Research Support Program
of those households in a descending poverty state and highest proportion of those moving out of poverty. The most plausible explanation is the zone’s engagement in high value agriculture (see Obwona and Ssewanyana, 2004).
Turning to market access12 (see
12 Market access classification based on Wood et al (1999) using the potential market integration (PMI) index and index of travel time of each location to the nearest five markets weighted by the population size of those markets.

Chronic Poverty and Economic Growth in Uganda
19
CPRC Research for BASIS Collaborative Research Support Program
Figure 2: U), Table 10 further reveals that households with less access to markets are more likely to be chronically poor and at the same time more likely than others to descend into poverty. While the rate of escaping poverty is similar regardless of market remoteness, the rate is higher for those households located in high population density13 areas. At the same time rate of remaining chronically poor is higher for those households located in low population density.
The community module in the 1999/2000 survey gathered information on the major events in communities retrospectively since 1990. Here the analysis is restricted to crop agricultural households in rural areas. Overall the likelihood of experiencing a drought increased for all households (see Table 11); a drastic change between 1996 and 1998 is observed especially among the chronically poor. The drastic change could possibly be picking up the effect of El Niño of 1997. Notably, the chronically poor and those households that slipped into poverty had a higher chance of being affected by drought in the initial period (1990). Table 11 further shows that households in chronic poverty and those that descended into poverty were more likely to be hit by famine than their counterparts in the other poverty states. As previously discussed, the North region has the highest rate of chronic poverty and persons therein have the greatest vulnerability to poverty. The study by Deininger and Okidi (2003) found civil strife to be a key contributory factor.
In Uganda there are no formal safety nets to address poverty and the poor have adopted numerous survival strategies including the diversification of income sources. More than 90% of rural panel households operated a crop enterprise in both years, with a higher participation of the never poor households in 2000 (see Table 12). On the other hand, the proportion of households operating a non-crop enterprise increased from 30.6% in 1992 to 39.8% in 2000, with a higher percentage change for those households that remained non-poor in both years followed by those households that managed to escape poverty by 2000. By 2000 some households had exited crop/non-crop enterprises but at the same time there were new entrants in these activities. But the proportions were higher for non-crop enterprises (Table 13). The results in Table 12 further reveal an increase in the proportion of households operating both a crop and non-crop enterprise, from 28.1% in 1992 to 38.8% in 200014. In other words, some degree of activity diversification is taking place in rural areas, regardless of poverty state. Households that had both crop and non-crop enterprises only in 1992 were 13.5% compared to 24.1% only in 2000. Nearly 15% of all
13 For details on how this was derived see Pender et al (2004). 14 But Okidi et al (2005) point out that these household enterprises are quite small and a small proportion of the households do hire labour. In other words, most of these enterprises depend heavily on unpaid family labour.

Chronic Poverty and Economic Growth in Uganda
20
CPRC Research for BASIS Collaborative Research Support Program
households operated both enterprises in both years, with those households never in poverty recording the highest share of 17.6% and least share by those moving out of poverty (10.3%). Of those households that were engaged in non-crop activities, we observe changes in the importance of these activities at the household level. Similar changes were observed for sources of income. For all poverty states, the proportion of households engaged in livestock enterprises declined, with a highest decline recorded by the chronically poor. However, the proportion of chronically poor households owning a trade enterprise increased by 2000. Evidently, the analysis seems to suggest that a combination of agricultural and non-agricultural enterprises is an important route of moving out of poverty even if the non-agricultural element remains relatively small. So far the results tend to indicate that diversification on income sources, residing in more favourable agro-ecological zone and high market access contribute to a household’s moving out of poverty.
3.2 Labour market
The study by Okurut et al. (2005) provides insights into the evolution of the labour market in Uganda since 1992/93, but restricted to age cohort 15-64 years. Specifically, the study reveals that there has been a remarkable shift in the sectoral composition of employment. For instance, the share of agriculture declined from about 80% in 1992 to 78% in 1999 and further declined to 68% in 2002. A majority of the employed population in Uganda is own-account workers, suggesting limited job growth in the formal sector. While there has been a shift in the sectoral composition of employment, the growth in labour demand lags that of the labour supply.
Waged/paid employment accounts for only a seventh of the total employment. Between the panel period, waged employment grew by only 0.9% per annum. The growth was driven mainly by the private sector while the public sector recorded negative growth. The civil service reforms and restructuring of the public enterprises partly explain the job losses in the public sector. Older individuals and individuals with higher education are more likely to be employed in the public sector.
The labour market reform package included relaxation of the minimum wage legislation so as to eliminate distortions and enhance the mobility of labour in accordance to changes in the relative factor prices across sectors/regions. The market determined wages were expected to provide private sector investment incentives, thereby create more employment opportunities. While both the private and public sector
Chronic Poverty and Economic Growth in Uganda
21
CPRC Research for BASIS Collaborative Research Support Program
employees witnessed real increases in their wages during the 1990s, the start of the new millennium was marked with declining real wages in the private sector.
Unemployment in Uganda based on the 2002 survey round stood at 2.8%, based on the conventional ILO definition. This figure seems to be relatively low for a developing country like Uganda. Nevertheless, unemployment is higher in urban areas, and of females, better educated individuals and non-poor households.
Narrowing our discussion to rural Uganda and the panel period, nearly 80% of the households relied on subsistence agriculture as their main activity in 2000. Nearly 76.8% of households had all their adult members engaged in agricultural activities and only 13.6% combined agriculture with other activities. The results further reveal that households in chronic poverty were less likely to have all their adult members engaged in non-agricultural activities. Low participation could possibly be explained by entry barriers into such activities such as lack of requisite skills, credit rationing etc. Overall, the bulk of the chronically poor households depended on agriculture, where demand for paid labour is low. Consequently, the observed change in the household welfare of the chronically poor households hardly depended on changes in the wage rate in agriculture. On the other hand, while there was a decline in public sector employment during the panel period as previously discussed, the share of the chronically poor and those descending into poverty were very much below those in other poverty states.
The community module gathered information on the operation of the local labour markets, with a special focus on daily wages for agricultural and non-agricultural workers by gender. The median wage was Shs. 1,000, regardless of gender and type of worker. However, there is a regional dimension. The wage rate for an agricultural worker is highest in the Central region (Shs. 1,500) and lowest in the North (Shs. 500). A gender dimension is observed for the non-agricultural workers, with men receiving a wage rate of almost 1.5 times that of women in the Central region; and a ratio of 1.2 times in the North. The majority of the communities reported a rise in the wage rate since 1992; with that of the agricultural workers rising faster than that of non-agricultural workers. Regionally, the share of communities reporting increases in the wage rate was highest in the West and lowest in the North.

Chronic Poverty and Economic Growth in Uganda
22
CPRC Research for BASIS Collaborative Research Support Program
3.3 Commodity market
Agriculture is not only the main source of livelihood to the rural population but also the main source of export earnings in Uganda. This suggests that price shocks and accessibility to markets directly affect the performance of the economy. Not only did Ugandans’ share of cash crop prices increase but so did their earnings, between 1992 and 2000. The increase in their earnings was largely due to favourable world coffee prices as previously discussed in Section 0. But more importantly, the liberalisation of the coffee sub-sector helped farmers to directly benefit from the increase in coffee prices (Appleton, 2001).
While some progress has been made to improve rural transportation networks and electrification, more needs to be done if those employed in the agriculture sector are to move out of poverty. Rural feeder roads and community roads remain in a poor state. During rainy season most of the rural roads are impassable, resulting into loss of income from agricultural produce. Besides the state of these feeder roads, empirical research (see for example, Obwona and Ssewanyana, 2004) has shown that commodity farm gate prices are negatively associated with distance to feeder roads.
The crop agricultural households are highly integrated with output markets. Over 70% of the crop agricultural households sold some portion of their crop production. And the households’ level of participation in the produce/output market as sellers has remained the same, regardless of their poverty state (see Table 14). Notably, the chronically poor households were more likely to participate in these markets than those households that had slipped into poverty by 2000. Broadly speaking access to market information, extension services and improved varieties remains very low for all households in the panel but continued to improve over time. Because of the enabling environment at the time, farming households invested more in adopting improved varieties for their staple food production. Table 14 further reveals that those households that slipped into poverty were less likely than their counterparts in other poverty states to have access to market information, less likely to have storage facilities and less likely to have their area under staple food cultivation planted with improved varieties. Those households that moved out of poverty were more likely to have more access to extension services compared to those who either slipped into poverty or remained chronically poor. This is also true for the adoption of improved varieties of food staples. Overall, access to market information and effective access to extension services are possible routes for exiting poverty as they indirectly boost agricultural production.

Chronic Poverty and Economic Growth in Uganda
23
CPRC Research for BASIS Collaborative Research Support Program
Table 15 presents simple correlations between key infrastructure and crop yield controlled for poverty state. As expected, distance is negatively related to crop yield, and the association is significant in most cases. By extension, households closer to urban setting are more likely to have readily available markets for their produce; and more likely to have more access to market information.
3.4 Financial market
Uganda implemented financial sector reforms onwards of 1993 with the objective of strengthening financial institutions that would effectively support private sector led economic growth. The Government revised the legal framework relating to the financial system to enable the central bank (Bank of Uganda) to conduct monetary policy effectively and supervise financial institutions effectively. Parliament enacted the 1993 Bank of Uganda Act and the 1994 Financial Institutions Statute with the objective of strengthening Uganda’s financial system to make it effectively support private sector led economic growth. Improvement in efficiency of commercial banks entailed closing of unprofitable bank branches that were located mainly in rural areas, thus reducing the poor’s access to financial services.
Despite the liberalisation of the financial sector, the period under review was marked with a sudden fall in households’ access to credit. We first look at the incidence of receiving a loan at the household level15 in the past 12 months prior to the survey. Broadly speaking, the incidence was very low in the initial year (1992) for all households. The rates declined further by 2000, with the chronically poor households registering the highest decline. These results confirm that there was poor access to credit, which would constrain the performance of agriculture and its related activities. Table 17 shows that the share of households that only accessed credit in 1992 was greater than for those households that only accessed credit in 2000, and the most affected were those households in chronic poverty. On average, only 6% of households, and 4.3% of the chronically poor, were able to access credit in both years - with most of these receiving credit from informal sources. The increasing lack of physical access to formal banking institutions (Table 16) in part explains the low incidence of acquiring loans. Additionally, the closure of the rural branches of the former Uganda Commercial Bank and the demise of the Rural Finance schemes etc could possibly explain the increased distance to banks in the rural areas. More importantly, these households are rationed out by administrative costs and lack of collateral security. Overall, the financial sector liberalisation seems not have favoured those households living in chronic poverty.
15 A household is said to have received a loan if at least one of its usual members reported to have got a loan in the past 12 months prior to the survey.

Chronic Poverty and Economic Growth in Uganda
24
CPRC Research for BASIS Collaborative Research Support Program
Regardless of poverty state, individuals are more likely to have access to informal than formal market financial markets in rural Uganda. Relatives/friends are the main source of credit. Individuals opt for this informal source since no collateral security is required. More importantly access to credit does not seem to favour agricultural related activities as discussed in the next paragraph.
In summation of this section, agriculture remains central in the Uganda economy, contributing about 35% of GDP, about 80% of the country’s exports and over 60% of employment. The economic growth Uganda experienced during the period under review was more labour intensive than capital intensive. And since agriculture remains labour intensive, the majority benefited from the growth in employment opportunities and in turn the growth in incomes. More importantly, in areas where growth improved chronically poor households also benefited. On the other hand, the agricultural sector faces a challenge of maintaining the high growth rates recorded during the 1990s. The low utilisation of productivity enhancing technologies suggests that most of the growth in the sector is attributed to growth in the amount of land under cultivation. However, given the prevailing constraints in accessing land, this expansion cannot continue indefinitely.
Chronic Poverty and Economic Growth in Uganda
25
CPRC Research for BASIS Collaborative Research Support Program
4. Urban economic policies and chronic poverty
4.1 General issues in urban poverty
The rate of urbanisation in Uganda remains low compared to other African countries. In 1992, 12.4% of the Uganda population was urban and increased to 13.1% in 2000 and 13.5% in 200316. Over the panel period, the urban population grew at a rate of 4.4% per annum. But even this relatively low growth rate is worrisome, given the fact that the infrastructure provision and provision of social services are not growing at similar rates.
Trade in goods and services is the main broad economic activity that the poor in urban areas engage in. Liberalisation and privatisation fundamentally improved prospects for participation by the urban poor in trade in goods and services. Prior to liberalisation and privatisation, the state operated public enterprises, some of which occupied business space that the poor and private firms would have occupied. Mention can be made of the following: Uganda Foods and Beverages that was dealing in trade of foods and beverages; Uganda Hardware that was dealing in trade of hardware; Uganda Transport Corporation that was dealing in public transport; National Housing and Construction Corporation that was dealing in housing; and Uganda Commercial Bank that was dealing in financial services.
Liberalisation and privatisation led to the closure of most of these public enterprises from 1992 to 2000 and beyond, thus widening the space for private sector participation in various markets. For example, Uganda’s transport industry was completely liberalised and privatised by 1992. Public transport services are privately provided and range from big buses to bicycles. Motorcycles (locally referred to as ’bodaboda‘) are a very important component of the public transport system. Private sector participation in the transport industry increased significantly, paucity of data notwithstanding. The Uganda Foods and Beverages was among the first public enterprises to be privatised, thereby ending the Government monopoly in selling of consumer goods. The sector attracted private sector participation across the entire income distribution range, including the chronically poor in urban areas.
Liberalisation and privatisation saw fundamental changes in Uganda’s financial market with the emergence of microfinance institutions. However, microfinance institutions became more pronounced after 2000, implying that the impact of microfinance institutions during the period under review was limited. However, microfinance institutions seem to have become the major sources of credit for the urban poor from 2000 to 2005. The housing sector also grew with the urban poor registering improvement in the quality of their personal dwelling places during the period under review as discussed later.
16 In absolute numbers, urban population stood at 2,026,166 in 1992, 2,805,905 in 2000 and 3,202,991 in 2003 (as estimated from the national household surveys).

Chronic Poverty and Economic Growth in Uganda
26
CPRC Research for BASIS Collaborative Research Support Program
Whereas it is difficult to attribute the poverty changes observed during the period under review to the policies that were implemented, urban poverty declined, nationally, from 27.8% in 1992 to a single digit of 9.6% in 2000. But the decline in poverty was faster in rural areas than in urban areas. Nonetheless, the urban population enjoyed a faster growth rate in mean consumption (of 7.8%) than their counterparts in rural areas (of 4.8%) (Table 3). The average growth rate in urban areas (7.8%) exceeded the national growth rate of 5.7%. These changes in the urban areas could have played a crucial role in keeping households’ incomes above the poverty line. These impressive declines have taken place alongside increases in inequality of income as measured by the Gini coefficient from 0.412 in 1992 to 0.427 in 2000. Unlike the rural areas, 6 in every 10 households remained non-poor over the eight year period compared to only about 4 in every 10 households in the rural areas. On average, 7.6% of the households in chronic poverty are in urban areas.
4.2 Labour market
Over 70% of the urban workers were in non-waged employment. Table 18 shows that the majority of chronically poor persons were in self-employment in agriculture; whilst the majority of those that managed to escape poverty were self-employed outside agriculture. However, such persons are as vulnerable to slipping into poverty as moving out of it. While the results in Table 18 seem to reveal that agriculture plays a role in urban areas, the local authorities have actively opposed urban agriculture, especially in Kampala city.
The panel period witnessed a reduction in waged employment especially in the public sector. This was mainly due to the reforms that took place in the civil services17, and the privatisation of state enterprises. Taking the urban sample alone, the panel evidence shows a reduction in waged employment by nearly 13%, with the public sector witnessing a 50% reduction and 11% increase for the private sector. The positive growth might be explained by the incentive provided to the private sector under the reforms. Notwithstanding a reduction in waged employment, monthly wages increased; in real terms from Ug.Shs 95,128 in 1992 to Shs. 117,372 in 2000; for the private sector from Shs. 105,081 to Shs. 108,765 and public sector from Shs. 84,346 to Shs. 135,543 over the same period. The observed higher pay in the public sector was mainly due to the policy of having smaller and well remunerated public services, whilst changes in the private sector may be due to the deregulation of the labour markets.
By extension, there have been some changes in the employment patterns by age cohorts as presented in Table 19. A declining trend in the proportion of child workers can be observed among chronically poor and never poor households, whereas the
17 These reforms were driven towards creating a well motivated workforce and control of public expenditures.

Chronic Poverty and Economic Growth in Uganda
27
CPRC Research for BASIS Collaborative Research Support Program
reverse is observed in the other two poverty states. Similar patterns are observed among youth workers of these states, with the exception of those individuals in those households moving out of poverty. Notably, there is an increasing participation of the elderly in the labour markets across poverty states, with the exception of those in households descending into poverty.
4.3 Financial Market
During the period under review the sources of credit for the urban poor were mainly informal for understandable reasons. As pointed out already, the formal banking sector could not meet the credit needs of the urban poor for various reasons. Microfinance institutions began to emerge from 1992 but their coverage remained limited till 2000. However, the Government has since been implementing measures to increase poor people’s access to financial services through microfinance institutions. The Micro Finance Deposit-Taking Institutions Act of 2003 enables the central bank to supervise a category of microfinance institutions that take deposits from the public. The Financial Institutions Act of 2004 strengthens the Bank of Uganda’s supervisory role of financial institutions and the financial system.
These developments have tremendously increased poor urban people’s access to credit, since 2000. Between 1992 and 2000, only a small proportion of the urban poor received credit and the majority of those that did get credit received it from relatives and friends, not microfinance institutions. However, broadly speaking, financial markets have not helped to facilitate investment in productive activities at the household level.
4.4 Housing market
According to UBOS (2006), one in every 4 households in urban areas live in temporary dwelling units compared to 4 in every 5 households in rural areas. In other words, as much as most households in Uganda own their houses there are temporary or semi-temporary housing units. Nevertheless, the housing sector is said to have recorded a general improvement between the two recent Population and Housing Censi (of 1991 and 2002). Turning to the panel data, the housing conditions of the panel households improved over time. The share of urban households with dwellings made of permanent material has changed: for walls from 51% to 60% and for floor from 46.4% to 50%. These trends are similar to the national picture as reported in Deininger and Okidi (2003). Housing conditions have also improved for the chronically poor, with 50%, up from 33.3%, now having permanent walls. But a declining trend is observed for permanent flooring material, from 16.7% in 1992 to 11.1% in 2000.

Chronic Poverty and Economic Growth in Uganda
28
CPRC Research for BASIS Collaborative Research Support Program
5. Infrastructure, poverty dynamics and chronic poverty
5.1 General issues in infrastructure18
Here we first examine the extent to which individuals belonging to different poverty state groupings utilise social services. The results are presented in Table 21. The chronically poor as well as those individuals in households that slipped into poverty are less likely to access primary and secondary education at the appropriate age. And these individuals reside in communities that are far from such services. Those households whose members slipped into poverty are located more than 8.6km away from secondary schools compared to only 4.9km for their counterparts in households that were non-poor in both years (
18 Infrastructure refers to both soft and hard infrastructure. The former includes credit, market information, extension services and the latter includes roads, schools, health facilities, water and electricity.
Chronic Poverty and Economic Growth in Uganda
29
CPRC Research for BASIS Collaborative Research Support Program
Table 22).
The survey collected information on access to credit facilities at the level of the individual. Access to financial markets is mainly via informal sources regardless of poverty state, with the chronically poor individuals less likely to have such access. The results in
Table 23 show that relatives/friends are the major source of credit, and only 4% of those individuals that received a loan in the last 12 months accessed credit through banks. Worth noting is the higher likelihood of those individuals that slipped into poverty to have acquired loan from banks and relatives/friends than those of any other poverty state grouping. Individuals normally get credit for different purposes including: production, future investment and consumption. The purposes chosen vary across poverty states and years (see Table 24). In 1992, most individuals borrowed for consumption purposes, whereas in 2000 most borrowed for production purposes. A majority of chronically poor individuals acquire credit to purchase agricultural inputs, a smaller proportion use it to start/expand a business and fewer still for health purposes. Borrowing for purchase of agricultural inputs was ranked first by those individuals that had slipped into poverty as the major cause of their descent.
In general, urban households are closer to district headquarters, municipality and to Kampala city than their rural counterparts, as expected. We further observe that distances vary according to poverty state. The never poor households have the best access to physical infrastructure, followed by those households that have moved out of poverty (see Table 25).
Table 26 presents average distances to selected infrastructure by poverty state in 2000. Broadly speaking, households that slipped into poverty are more likely to be located in areas that are less endowed with physical infrastructure, followed by the chronically poor households.
The community module of 1999/2000 gathered information on access to agricultural inputs retrospectively and the results are presented in Table 27. Over the two years, access to these agricultural inputs declined and we find fewer households likely to access these inputs. All households, regardless of their poverty state grouping experienced a decline in access to these inputs.
Broadly speaking the main source of information on new technology is public source followed by extension service agents Table 28. This is true regardless of poverty state grouping. But notably, chronically poor households are less likely to receive information from either the private sector or traders.
The provision of public infrastructure services has improved over time although the some services have recorded faster improvements than the others. Most importantly, public investment in infrastructure generated growth in the agricultural sector and

Chronic Poverty and Economic Growth in Uganda
30
CPRC Research for BASIS Collaborative Research Support Program
consequently contributed to the reduction in overall poverty levels. There is a positive correlation between agricultural productivity (proxied by value of agricultural produce per acre19) and access to infrastructure.
5.2 Infrastructure and commodity markets
In order to present a brief discussion relating infrastructure and commodity markets simple correlation coefficients are estimated. There is a negative association between consumer markets (-0.107), agricultural output (-0.003) and input markets (-0.010) and proximity to feeder roads. These associations are statistically significant except for the agricultural produce markets. On the other hand, agricultural productivity is negative and significantly associated with distance to agricultural inputs (-0.031) and agricultural produce (-0.009). All these correlations are small, implying that there are other contributory factors. A very high correlation of 0.882 is observed among those households using fertilizers and with access to extension services. Additionally, households with access to extension services are more likely to have higher yields per acreage. This suggests that the chronically poor should be helped to access fertilizer and extension services.
Rural households in Uganda grow a variety of crops, but we have deliberately chosen to focus on high value crops namely maize, tobacco, cotton and coffee. Coffee is an important export crop, while the importance of maize as an important source of income has increased recently. Table 29 shows the percentages of households involved in the growing of these crops by region. Clearly, maize is a predominant crop regardless of geographical location, unlike the rest of the crops. In the Central region, households engaged in coffee farming were more likely to have moved out poverty – partly explained by good coffee prices at the time.
5.3 Infrastructure and financial markets
Individuals with more years of formal schooling are more likely to access credit (0.072), but the correlation is small. On the other hand, those individuals involved in the agricultural sector are less likely to access credit (-0.059). The money lenders, including formal banking institutions, still regard agriculture as a risky activity.
19 In Uganda, measuring agricultural productivity as crop yield per acre is complicated by the fact that most farmers do practise mixed farming.

Chronic Poverty and Economic Growth in Uganda
31
CPRC Research for BASIS Collaborative Research Support Program
5.4 Infrastructure and labour markets
Studies on Uganda have demonstrated that access to electricity improves one’s well-being (see citations in Okidi et al 2005). Evidence based on the panel dataset shows that households with access to electricity are more likely to engage in non-crop enterprises - the correlation was about 0.062. Disaggregating non-crop enterprises, we find significant and positive correlations for trade (0.092), hotel and restaurants (0.088) and others (0.090). On the other hand, households in communities with access to electricity are less likely to engage in livestock farming and mining and quarrying.
5.5 Conclusions and emerging issues
To design effective strategies to combat poverty, policy makers need to know precisely who have and have not benefited from the impressive macroeconomic performance Uganda enjoyed between 1992 and 2000. And this is what the paper has endeavoured to provide insights into, with a bias in favour of, and thereby focus on the role of, markets. Broadly speaking, the good macroeconomic performance during this period contributed to the reduction of poverty. The agricultural growth policies during 1992 and 2000 are perhaps the most important causes of the increased participation of the chronically poor individuals/households in labour and commodity markets. Some areas benefited more than the others. Because of the conflict that has ravaged the North over 20 years, the benefits were minimal. Notwithstanding the increased participation of the chronically poor in output markets as sellers, these households witnessed a limited access to: financial markets, agricultural inputs (such as improved seeds, extension service) and market information.
As pointed out already, Uganda registered phenomenal growth between 1992 and 2000. However, because of limited participation by the chronically poor in the commodity, financial, labour and housing markets, their incomes improved proportionally less than those households who either remained non-poor or moved out of poverty. Increased participation of the chronically poor in those markets is required to enable such persons to benefit from the favourable growth policies and environment that prevail in Uganda.
To bring the chronically poor peasants into the market economy would involve putting in place measures that would significantly increase their incomes. Basically the policies would focus on the commodity market for those with access to productive assets, and on the labour market for those without access to productive assets but with labour to sell.
Chronic Poverty and Economic Growth in Uganda
32
CPRC Research for BASIS Collaborative Research Support Program
If chronically poor people’s access to extension services and fertilizer could be increased, their incomes would increase commensurately. Low productivity in agriculture in part explains the low wages in the sector. The demand driven approach, which Uganda’s PMA proposes, leaves out the chronically poor with regards access to vital inputs, especially fertilizer and extension services.
To make markets operate in ways that include the chronically poor on beneficial terms, Government and other development partners should remove constraints that inhibit the participation of the poor in those markets. In agriculture, peasant participation in the marketing of produce is limited to the lower end of the marketing chain. Strengthening of farmer organisations, as envisaged in the PMA, would enable farmers to move up the marketing chain and derive more benefits. Farmer organisations could be strengthened through the mobilisation and training of farmers that produce similar products or through supporting the emergence of contract farming, in which peasant producers enter into contracts with a company to produce a commodity at an agreed price. Government should support the emergence of contracting firms and individuals alongside farmer organisation to enable the poor derive higher prices for their produce.
To increase chronically poor people’s participation in production means ensuring that they have better access to productive assets, particularly land and credit. As already pointed out, the credit system leaves out the chronically poor. Credit schemes tailored to the needs and activities of the poor would go a long way in increasing their incomes. The public sector should encourage the emergence of financial institutions that meet the special requirements of agriculture, particularly long term financing.
The issue of access to land is also very important. The chronically poor hardly own land. In many instances they do not even enjoy user rights to land, thus limiting their participation in production. Land reform that would increase chronically poor people’s access to land is likely to increase their participation in production and consequently improve their incomes. However, land reforms should be implemented carefully so as to avoid social unrest, which could worsen the plight of the chronically poor.
Creation of more employment in agriculture is possible only if productivity constraints are addressed more fully. The low productivity in agriculture leads to low wages that act as a disincentive to waged employment in the sector. Productivity enhancing measures include ensuring farmer access to, and use of, fertilizer and other agricultural inputs. Access to extension services is very important with regards increasing agricultural productivity. Broadly, the public sector should efficiently deliver the broad range of social services that includes education, health, water and sanitation, and agriculture extension, with a view to increasing productivity of the chronically poor.
Other policies that would encourage a dynamic labour market in rural areas include increasing the monetisation of the rural areas. Increased use of cash and a reduction

Chronic Poverty and Economic Growth in Uganda
33
CPRC Research for BASIS Collaborative Research Support Program
of the subsistence sector would auger well for the development of markets in rural areas, including the labour market.
As noted already, the housing market has evolved over time and is not a crisis matter in Uganda. With increased incomes, the chronically poor in rural areas should improve the quality of their dwelling places over time.
Government should avoid making policy reversals that will introduce controls, supply inputs and provide extension services to commercial farmers; commercial farmers can and should access such services on the market. However, the chronically poor do need to be specifically targeted with a view to enhancing their productivity through better access to land, credit, agricultural inputs, and extension services. Incentives that drive a liberalised market economy should continue to drive the entire growth process to prevent economic stagnation. However, the special needs of the chronically poor that entail targeting should be addressed alongside, with a view to bringing them into the market in the medium term.

Chronic Poverty and Economic Growth in Uganda
34
CPRC Research for BASIS Collaborative Research Support Program
References
Appleton (2001), Poverty Reduction during Growth: The case of Uganda, 1992-2000, University of Nottingham, mimeo.
Deininger, K. and J.A. Okidi (2003), “Growth and poverty reduction in Uganda, 1999-2000: Panel evidence”, Development Policy Review, 21(4):481-509.
Kasekende, L.A. and M. Atingi-Ego. 1999. “The Impact of Liberalization on key markets in sub-Saharan Africa: The Case of Uganda”, Journal of International Development, Vol. 11: 411-436.
Kasirye, I. (2005), ‘Vulnerability and poverty dynamics in Uganda, 1992-1999”, Mimeo, Economic Policy Research Centre.
Lawson, D., A. McKay and J. Okidi (2003), “Poverty persistence and transitions in Uganda: A combined qualitative and quantitative analysis”, Chronic Poverty Research Centre (CPRC) Working Paper No. 38: University of Manchester, UK.
Obwona, M. and S. Ssewanyana (2004), Rural infrastructural services and agricultural marketing and food security in Uganda, mimeo, IFPRI.
Okidi, A. J., S. Ssewanyana, L. Bategeka and F. Muhumuza (2005), Operationalizing Pro-poor growth: The Uganda case study.
Okidi, J.A. and A. McKay (2003), Poverty Dynamics in Uganda: 1992 to 2000, Research Series #32, Economic Policy Research Centre, Kampala.
Okurut, N., S.N. Ssewanyana and A. Adebua (2006), Poverty and labour market response to reforms in Uganda, African Economic Research Consortium.
UBoS (2006), 2002 Uganda Population and Housing Census: Analytical Report, Abridged version , Kampala.
Wood, S., K. Sebastian, F. Nachtergaele, D. Nielsen, and A. Dai. 1999. Spatial aspects of the design and targeting of agricultural development strategies. Environment and Production Technology Division Discussion Paper 44. Washington, DC: International Food Policy Research Institute.

Chronic Poverty and Economic Growth in Uganda
35
CPRC Research for BASIS Collaborative Research Support Program
Figure 1: Agro-ecological zones, Uganda
Source: Ruecker et al (2003)

Chronic Poverty and Economic Growth in Uganda
36
CPRC Research for BASIS Collaborative Research Support Program
Figure 2: Uganda: Classification of market access
Source: Wood et al (1999)

Chronic Poverty and Economic Growth in Uganda
37
CPRC Research for BASIS Collaborative Research Support Program
Table 1: Uganda: Policy variables
Table 2: Uganda: Annual average growth rates of GDP
1992-1999 1999-2002 1992-2002
GDP, constant prices 6.9 5.9 6.6
Agriculture 4.5 4.1 4.2
Industry 12.3 6.8 10.9
Services 7.8 7.3 7.7
Note: 1997/98=100
Source: Okurut et al. (2005)
1992/93 1993/94 1994/95 1995/96 1996/97 1997/98 1998/99 1999/00 2000/01 2001/02 2002/03
GDP, constant prices (%) 8.4 5.4 10.6 7.8 4.5 5.4 7.3 5.9 6.5 6.3 4.9
Agriculture 9.3 1.8 5.9 4.3 1.1 1.9 5.8 5.6 4.8 3.9 2.3
Industry 8.4 13.0 20.3 16.6 11.4 11.5 12.0 5.3 6.6 7.9 7.2
Services 7.1 7.8 13.2 8.6 5.7 6.5 6.8 6.5 8.3 8.0 6.3
Annual growth rates (%) Exports -4.4 31.6 28.6 27.2 29.5 -14.9 -13.1 5.3 72.7 26.0 -3.3
Imports 11.6 55.4 13.1 2.0 3.1 35.9 -23.2 -8.6 54.2 18.2 -2.3
Internal terms of trade (index) 0.6 6.7 -10.3 -6.9 13.7 -11.5 -3.8 -2.1 -18.2 11.2
Private Consumption 7.1 5.0 15.3 7.0 2.6 6.9 2.6 2.7 9.8 6.2 3.1
Private Investment 10.8 19.7 42.8 11.6 3.1 6.1 17.5 -2.9 -1.0 15.7 16.5
As share of GDP (%) (factor cost) Agriculture 50.3 48.6 46.5 45.0 43.5 42.0 41.4 41.3 40.7 39.7 38.7
Industry 12.7 13.6 14.8 16.0 17.1 18.0 18.8 18.7 18.7 19.0 19.5
Services 37.1 37.9 38.8 39.1 39.5 39.9 39.7 39.9 40.6 41.2 41.8
Share of GDP (%) (market prices) Exports 5.8 7.2 8.3 9.7 11.9 9.7 7.8 7.8 12.7 15.0 13.8
Imports 11.7 17.0 17.3 16.1 15.8 20.5 14.6 12.7 18.4 20.4 19.0
Annual underlying inflation rate (%) 26.0 10.3 7.1 10.9 4.4 1.0 2.8 5.0 5.3 3.5 2.4
Source: Okurut et al (2005)
Note: 1997/98=100
Chronic Poverty and Economic Growth in Uganda
38
CPRC Research for BASIS Collaborative Research Support Program

Chronic Poverty and Economic Growth in Uganda
39
CPRC Research for BASIS Collaborative Research Support Program
Table 3: Poverty headcount trends and growth rates (%), 1992-2000
1992/93 1999/00 All households
All Non-panel Panel All Non-panel Panel
Growth rate in mean income
Mean percentile growth rate
Uganda 55.7 55.8 55.4 33.8 33.5 35.5 5.7 5.1 Place of residence: Rural 59.7 60.7 56.1 37.4 37.4 37.4 4.8 4.7 Urban 27.8 27.0 39.3 9.6 9.3 13.2 7.8 7.3 Region: Central 45.6 45.2 47.3 19.7 19.0 23.9 7.1 6.7 Eastern 58.8 58.7 59.6 34.9 35.4 31.3 5.8 5.4 Northern 72.2 72.7 69.4 63.7 62.8 68.2 1.4 1.4 Western 53.1 53.0 53.5 26.2 25.9 28.0 6.1 6.2 Occupation: Jobless 59.2 58.0 58.9 42.2 41.4 45.9 5.8 3.5 Agriculture, self employed 63.5 64.8 52.7 39.1 39.3 38.0 5.3 5.1 Agriculture, wage employee 55.0 55.5 38.2 40.5 40.3 41.4 5.4 5 Non-agriculture, self employed 28.9 27.5 43.3 17.5 17.4 18.3 3.9 3.6 Non-agriculture, wage employee 37.8 36.4 0.0 15.8 14.8 24.2 8.5 7.5 Others 21.7 21.2 26.0 Sector of employment: Crop agriculture 63.7 64.7 59.7 39.1 38.2 67.4 5.3 5.2 Non-crop agriculture 54.9 57.6 42.8 41.9 40.9 74.7 4.6 3.7 Mining 31.5 0.0 100.0 41.5 39.2 100.0 -3.5 -4.2 Manufacturing 44.4 43.8 47.0 23.3 23.4 10.6 6.5 6.2 Public utilities 28.3 29.4 25.8 0.0 0.0 0.0 10.3 9.8 Construction 36.8 33.2 56.6 20.1 19.7 40.3 2.5 3.9 Trade 26.5 25.7 31.8 12.6 12.0 42.7 5.5 4.7 Hotels 26.2 26.8 11.6 11.6 11.6 0.0 6.6 6.0 Transport and communications 34.5 27.0 61.0 13.8 13.8 4.5 7.4 7.5 Miscellaneous services 30.3 26.6 52.4 20.2 16.6 73.5 6.7 5.2 Public services 36.8 37.1 35.5 15.2 13.8 43.1 7.6 6.5 Not working 59.2 58.0 65.5 42.2 38.5 94.4 5.8 3.5 Source: Author's calculations based on UNHS I and IHS. Notes: All estimates are weighted

Chronic Poverty and Economic Growth in Uganda
40
CPRC Research for BASIS Collaborative Research Support Program
Table 4: Poverty transition matrix, 1992-2000
2000 Numbers Percent
1992 Poor Non-poor All Poor Non-poor All Poor 233 422 655 35.6 64.4 50.0 Non-poor 128 526 654 19.6 80.4 50.0 All 361 948 1,309 27.6 72.4 100.0
Source: Author's calculations based on panel data of 1992/93 and 1999/00
Notes: Estimates are derived at household level and are unweighted
Table 5: Poverty state by geographical location and occupation of household head
Poverty state
Chronically poor
Moved out
Slipped into
Never poor
Valid households
All households 18.4 31.3 13.1 37.1 1,309 Place of residence: Rural 19.2 31.8 13.5 35.5 1,117 Urban 6.9 25.1 7.7 60.3 192 Region: Central 13.6 30.2 8.0 48.2 403 Eastern 14.9 38.4 11.4 35.3 302 Northern 34.7 22.7 30.3 12.2 201 Western 15.2 32.6 8.4 43.8 403 Occupation: Jobless 19.4 36.0 18.0 26.6 72 Agriculture, self employed 20.2 31.9 13.1 34.8 878 Agriculture, wage employee 6.3 40.8 20.0 32.9 32 Non-agriculture, self employed 5.4 24.9 13.8 55.9 115 Non-agriculture, wage employee 17.6 26.8 5.2 50.4 212 Others
Source: Author’s calculations based on IHS and UNHS I
Notes: The estimates are weighted using re-calculated weights for the panel households in 1999/00

Chronic Poverty and Economic Growth in Uganda
41
CPRC Research for BASIS Collaborative Research Support Program
Table 6: Changes in monthly mean consumption expenditure among panel households
Ug. Shs (1997/98=100) Poverty state 1992 2000 Growth rate (%) Chronically poor 12,647 15,191 2.5 Moved out poverty 14,340 38,100 13.3 Slipped into poverty 30,580 15,509 -9.2 Never poor 36,353 55,476 5.8 All households 24,472 38,795 6.3 Source: Author’s calculations based on IHS and UNHS I Notes: The estimates are unweighted
Table 7: Annual sources of income per capita by poverty state (Ug.Shs), Uganda
Type of enterprise
Poverty state Agriculture Non-agriculture Employment Others Total
1992 Chronically poor 79,732 10,687 17,870 53,358 157,701 Moved out poverty 84,837 13,537 27,376 71,159 193,722 Slipped into poverty 138,556 14,171 22,397 109,113 274,659 Never poor 142,797 44,615 78,131 135,620 396,620
All households 112,515 25,687 45,792 97,699 276,756
1999 Chronically poor 70,563 11,738 13,026 40,043 135,370 Moved out poverty 146,835 28,230 34,297 71,502 280,568 Slipped into poverty 64,603 15,867 12,729 61,691 154,890 Never poor 155,102 91,740 75,679 110,939 433,460
All households 128,540 49,639 45,047 80,790 303,871
Growth rates (%) p.a Chronically poor -1.7 1.3 -4.3 -3.9 -2.1 Moved out poverty 7.5 10.0 3.1 0.1 5.0 Slipped into poverty -10.4 1.5 -7.7 -7.8 -7.8 Never poor 1.1 9.8 -0.4 -2.7 1.2
All households 1.8 9.0 -0.2 -2.6 1.3

Chronic Poverty and Economic Growth in Uganda
42
CPRC Research for BASIS Collaborative Research Support Program
Source: Author's calculations based on panel data of 1992/93 and 1999/00 Notes: i) Other sources include property income, current transfers and other benefits ii) The estimates are calculated on per capita basis NOT per adult equivalent as is usually done in poverty analysis iii) Income expressed in 1997 prices Table 8: Share of household source of income by poverty state, Uganda
Type of enterprises
Poverty state Agriculture Non-agriculture Employment Others 1992 Chronically poor 51.9 2.6 7.7 37.8 Moved out poverty 47.2 5.9 11.6 35.3 Slipped into poverty 48.1 4.0 8.0 39.9 Never poor 40.4 8.3 16.3 35.0 All households 45.4 6.1 12.4 36.1 1999 Chronically poor 53.7 9.7 8.8 27.8 Moved out poverty 52.9 9.1 11.2 26.8 Slipped into poverty 48.9 11.4 10.5 29.3 Never poor 48.2 14.4 12.0 25.5 All households 50.7 11.6 11.0 26.7
Source: Author's calculations based on panel data of 1992/93 and 1999/00
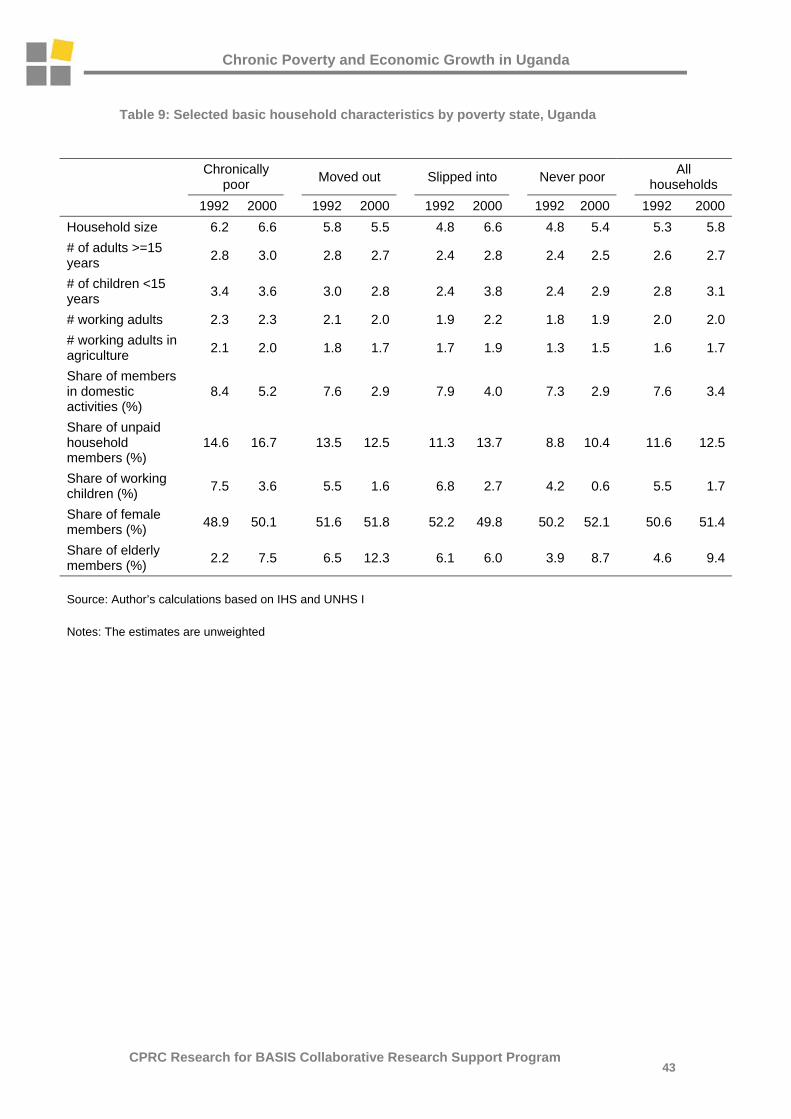
Chronic Poverty and Economic Growth in Uganda
43
CPRC Research for BASIS Collaborative Research Support Program
Table 9: Selected basic household characteristics by poverty state, Uganda
Chronically poor Moved out Slipped into Never poor All
households 1992 2000 1992 2000 1992 2000 1992 2000 1992 2000Household size 6.2 6.6 5.8 5.5 4.8 6.6 4.8 5.4 5.3 5.8# of adults >=15 years 2.8 3.0 2.8 2.7 2.4 2.8 2.4 2.5 2.6 2.7
# of children <15 years 3.4 3.6 3.0 2.8 2.4 3.8 2.4 2.9 2.8 3.1
# working adults 2.3 2.3 2.1 2.0 1.9 2.2 1.8 1.9 2.0 2.0# working adults in agriculture 2.1 2.0 1.8 1.7 1.7 1.9 1.3 1.5 1.6 1.7
Share of members in domestic activities (%)
8.4 5.2 7.6 2.9 7.9 4.0 7.3 2.9 7.6 3.4
Share of unpaid household members (%)
14.6 16.7 13.5 12.5 11.3 13.7 8.8 10.4 11.6 12.5
Share of working children (%) 7.5 3.6 5.5 1.6 6.8 2.7 4.2 0.6 5.5 1.7
Share of female members (%) 48.9 50.1 51.6 51.8 52.2 49.8 50.2 52.1 50.6 51.4
Share of elderly members (%) 2.2 7.5 6.5 12.3 6.1 6.0 3.9 8.7 4.6 9.4
Source: Author’s calculations based on IHS and UNHS I
Notes: The estimates are unweighted

Chronic Poverty and Economic Growth in Uganda
44
CPRC Research for BASIS Collaborative Research Support Program
Table 10: Agro-ecological zones, market access and population density by poverty state, rural
Poverty state
Chronically poor
Moved out
Slipped into
Never poor
Valid households
Agro-ecological zones: Unimodal low 40.2 28.3 18.9 12.6 127 Unimodal medium 26.2 30.8 14.0 29.0 107 Unimodal high 13.0 47.8 4.3 34.8 23 Bi-modal low 11.4 31.5 5.4 51.7 149 Bi-modal medium 17.9 34.3 10.6 37.1 396 Bi-modal high 12.4 31.4 7.5 48.7 507 Market access: Low access 24.9 32.3 11.4 31.4 437 High access 14.2 32.2 8.9 44.6 872 Population density Low density 24.6 30.1 12.3 33.0 382 High density 14.5 33.4 8.7 43.3 909
Source: Author's calculations based on panel data of 1999/00 and using the Agro-ecological zone information by IFPRI
Table 11: Major event experienced by crop farmers by poverty state, rural 1990 1992 1994 1996 1998 Drought Chronically poor 9.9 17.9 17.4 19.2 50.6 Moved out 5.8 10.3 9.5 14.5 42.7 Slipped into 15.3 40.3 36.1 22.7 63.7 Never poor 3.3 11.0 6.7 12.9 42.3 All households 7.0 16.0 13.6 16.0 46.9 Famine Chronically poor 15.2 24.1 26.3 22.9 42.9 Moved out 7.4 16.5 16.2 16.7 31.5 Slipped into 15.8 45.5 40.6 26.1 57.1 Never poor 4.7 18.2 12.8 17.1 35.7 All households 9.1 22.5 20.2 19.3 38.6
Source: Author's calculations based on panel data of 1999/00

Chronic Poverty and Economic Growth in Uganda
45
CPRC Research for BASIS Collaborative Research Support Program

Chronic Poverty and Economic Growth in Uganda
46
CPRC Research for BASIS Collaborative Research Support Program
Table 12: Household enterprise by poverty state (%), rural
Type of enterprise Type of non-crop enterprise (%) Poverty
state Crop Non-crop Livestock Mining Trade Hotel Others Diversifiedenterprise
1992 Chronically poor 96.3 32.1 62.3 39.1 20.3 1.4 1.4 31.2 Moved out 94.6 25.5 42.6 38.3 23.4 0.0 1.1 23.3 Slipped into 96.6 30.2 40.0 34.3 34.3 0.0 2.9 30.2 Never poor 91.6 34.5 46.5 35.4 38.2 1.4 1.4 30.2 Total 94.0 30.6 48.0 36.8 30.1 0.9 1.5 28.1 2000 Chronically poor 96.3 39.5 38.8 43.5 28.2 2.4 2.4 39.1 Moved out 96.5 34.8 45.3 38.3 32.0 3.1 3.1 34.0 Slipped into 97.4 37.1 32.6 30.2 32.6 4.7 7.0 37.1 Never poor 96.4 45.2 41.0 29.3 37.2 6.9 1.6 43.5 Total 96.5 39.8 41.0 34.7 33.6 4.7 2.7 38.8
Source: Author's calculations based on panel data of 1992/93 and 1999/00
Notes: i) Mining refers to mining and quarrying, and hotel refer to hotel and restaurants
Table 13: Ownership of household enterprise by poverty state, rural
Household operated a crop/non-crop enterprise Never Only in 1992 Only in 2000 In both years
Poverty state Crop
Non-crop Crop
Non-crop Crop
Non-crop Crop
Non-crop
Chronically poor 1.9 44.7 1.9 15.8 1.9 23.3 94.4 16.3 Moved out 0.5 51.1 3.0 14.1 4.6 23.6 91.9 11.1 Slipped into 0.0 49.1 2.6 13.8 3.5 20.7 94.0 16.4 Never poor 1.9 40.9 1.7 13.9 6.3 24.5 90.1 20.7 Total 1.3 45.8 2.2 14.4 4.6 23.6 91.9 16.2 # households 14 511 25 160 51 263 1,025 181 Source: Author's calculations based on panel data of 1992/93 and 1999/00

Chronic Poverty and Economic Growth in Uganda
47
CPRC Research for BASIS Collaborative Research Support Program
Notes: Estimates derived at household level

Chronic Poverty and Economic Growth in Uganda
48
CPRC Research for BASIS Collaborative Research Support Program
Table 14: Participation and access to key facilities by poverty state, rural
Participated in output market Has storage facilities
Access to market information
Access to extension services
Has staple food area under improved
1992 1994 1996 1998 1992 1994 1996 1998 1992 1994 1996 1998 1992 1994 1996 1998 1992 1994 1996 1998
Chronically poor 72.9 71.8 73.0 70.6 42.8 42.8 41.7 43.9 28.3 28.3 29.4 29.5 6.4 6.1 5.5 10.8 1.3 0.9 2.3 6.7
Moved out 81.2 81.0 80.6 80.3 39.4 40.6 40.8 42.9 27.9 28.6 29.4 31.7 7.5 7.1 10.0 13.1 4.0 4.9 5.2 7.7
Slipped into 58.8 63.6 65.3 65.3 26.9 32.5 38.6 39.4 13.1 13.3 14.9 16.4 4.5 3.4 4.6 6.5 0.6 1.0 2.6 7.3
Never poor 82.1 82.0 83.8 83.0 36.5 38.1 37.2 37.8 28.9 28.5 29.3 30.9 8.1 8.9 9.4 11.4 2.5 3.0 5.3 9.7
All households 76.9 77.2 78.2 77.3 37.3 39.0 39.4 40.8 26.3 26.4 27.4 28.9 7.1 7.0 8.2 11.1 2.5 3.0 4.3 8.2
Source: Author’s calculations based on survey of 1999/00 Notes: i) Estimated restricted to only those individual households that responded to the crop module ii) This information was gathered in the crop module of 1999/00, retrospectively

Chronic Poverty and Economic Growth in Uganda
49
CPRC Research for BASIS Collaborative Research Support Program
Table 15: Simple correlation of urban proximity and crop yield by poverty state, rural
Poverty state
Chronically poor Moved out Slipped into Never poor All
District headquarters -0.031 -0.093 -0.311 -0.008 -0.119
Kampala -0.152 0.135 -0.148 0.031 -0.032
Nearest municipality 0.050 -0.051 -0.235 0.046 -0.052
Notes: In bold, are statistically significant at 0.00 level and in italic, at 0.05 level
Table 16: Access to financial markets by poverty state, rural
Distance to the bank Incidence of a loan 1992 2000
Poverty state 1992 2000 Mean Median Mean Median
Chronically poor 23.7 8.8 32.1 25.6 34.9 28.0
Moved out 19.5 15.8 26.6 25.0 29.2 27.0
Slipped into 25.0 13.8 45.6 32.4 49.7 36.8
Never poor 25.7 21.2 26.4 22.0 28.0 24.0
All households 23.2 16.2 30.0 25.0 32.6 27.0
Source: Author's calculations based on panel data of 1999/00
Note: Estimated derived at household level
Table 17: Access to credit by poverty state, rural
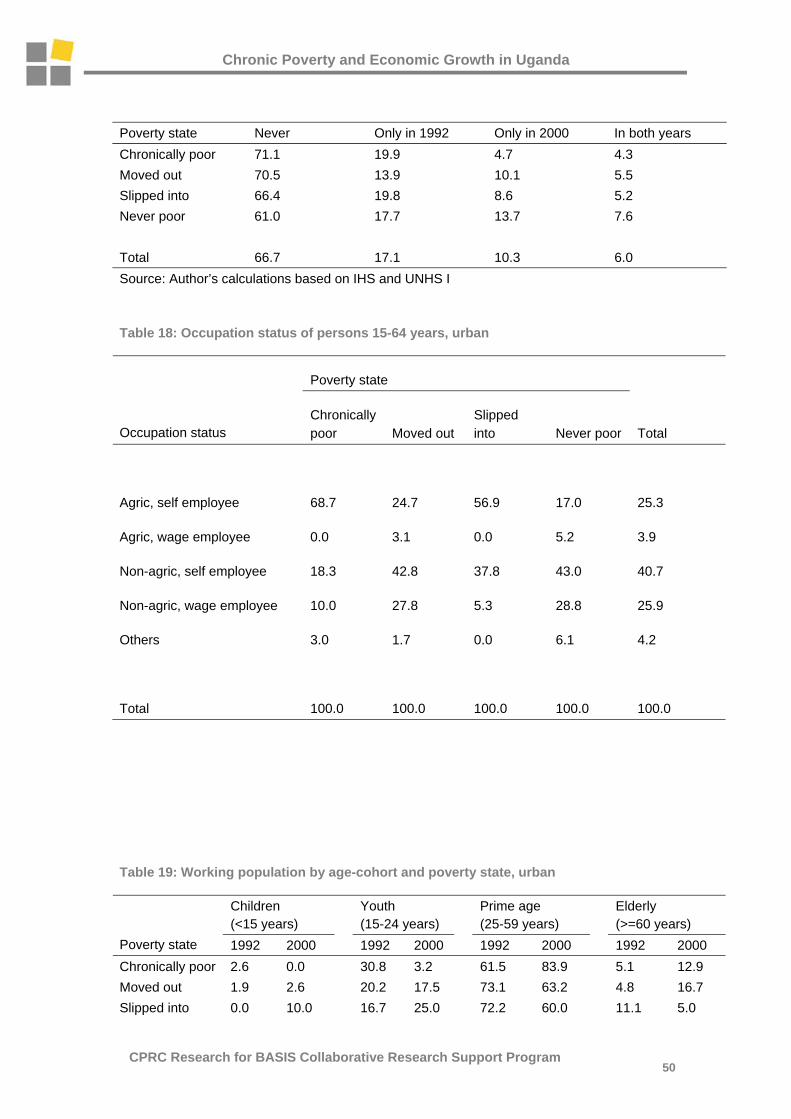
Chronic Poverty and Economic Growth in Uganda
50
CPRC Research for BASIS Collaborative Research Support Program
Poverty state Never Only in 1992 Only in 2000 In both years Chronically poor 71.1 19.9 4.7 4.3 Moved out 70.5 13.9 10.1 5.5 Slipped into 66.4 19.8 8.6 5.2 Never poor 61.0 17.7 13.7 7.6 Total 66.7 17.1 10.3 6.0 Source: Author’s calculations based on IHS and UNHS I
Table 18: Occupation status of persons 15-64 years, urban
Poverty state
Occupation status Chronically poor Moved out
Slipped into Never poor Total
Agric, self employee 68.7 24.7 56.9 17.0 25.3
Agric, wage employee 0.0 3.1 0.0 5.2 3.9
Non-agric, self employee 18.3 42.8 37.8 43.0 40.7
Non-agric, wage employee 10.0 27.8 5.3 28.8 25.9
Others 3.0 1.7 0.0 6.1 4.2
Total 100.0 100.0 100.0 100.0 100.0
Table 19: Working population by age-cohort and poverty state, urban
Children (<15 years)
Youth (15-24 years)
Prime age (25-59 years)
Elderly (>=60 years)
Poverty state 1992 2000 1992 2000 1992 2000 1992 2000 Chronically poor 2.6 0.0 30.8 3.2 61.5 83.9 5.1 12.9 Moved out 1.9 2.6 20.2 17.5 73.1 63.2 4.8 16.7 Slipped into 0.0 10.0 16.7 25.0 72.2 60.0 11.1 5.0

Chronic Poverty and Economic Growth in Uganda
51
CPRC Research for BASIS Collaborative Research Support Program
Never poor 3.8 0.6 19.0 12.2 68.4 71.3 8.9 16.0 All 2.8 1.7 20.7 13.9 69.3 69.1 7.2 15.3
Source: Author’s calculations based on IHS and UNHS I.

Chronic Poverty and Economic Growth in Uganda
52
CPRC Research for BASIS Collaborative Research Support Program
Table 20: Housing characteristics by poverty state, urban
Type of dwelling Has permanent material
Poverty state House Muzigo Hut Roof Wall Floor Own dwelling
1992
Chronically poor 66.7 0.0 33.3 44.4 33.3 16.7 94.4
Moved out 75.5 3.8 20.8 67.9 35.8 34.0 64.2
Slipped into 58.3 0.0 41.7 50.0 16.7 8.3 83.3
Never poor 89.0 4.6 6.4 89.0 65.1 61.5 53.2
All households 81.3 3.6 15.1 76.6 51.0 46.4 62.0
2000
Chronically poor 58.8 5.9 35.3 44.4 50.0 11.1 88.9
Moved out 63.0 22.2 14.8 74.1 49.1 37.0 64.8
Slipped into 50.0 25.0 25.0 50.0 33.3 16.7 66.7
Never poor 67.0 27.5 5.5 85.5 70.0 66.4 66.4
All households 64.1 24.0 12.0 76.3 60.1 50.0 68.0
Table 21: Access to social services by poverty state, Uganda
Enrolment at school by age cohort
6 - 25 years 6 - 12 years 13 - 16 years Sought health care
Poverty state 1992 2000 1992 2000 1992 2000 1992 2000
Chronically poor 41.7 54.8 52.0 56.3 1.4 2.7 44.1 64.4

Chronic Poverty and Economic Growth in Uganda
53
CPRC Research for BASIS Collaborative Research Support Program
Moved out 54.6 64.2 65.9 69.6 8.3 9.0 48.6 68.3
Slipped into 46.5 56.4 61.2 58.3 2.6 3.5 50.0 67.0
Never poor 58.2 65.8 77.3 69.7 12.2 8.3 61.3 75.1
All 52.5 61.9 66.3 65.5 7.9 6.7 53.1 69.9
Source: Author’s calculations based on IHS and UNHS I
Notes: Estimates derived at individual level

Chronic Poverty and Economic Growth in Uganda
54
CPRC Research for BASIS Collaborative Research Support Program
Table 22: Access to social services by poverty state, Uganda
School (km)
Poverty state Primary Secondary Safe water (%)
Chronically poor 1.6 5.8 52.6
Moved out 1.4 5.5 53.5
Slipped into 1.3 8.6 47.7
Never poor 1.4 4.9 56.1
Total 1.4 5.8 53.5
Source: Author's calculations based on panel data of 1992/93 and 1999/00
Table 23: Source of credit by poverty state, Uganda
Poverty state Bank Co-op Government NGO
Money lender Relatives Community Others
1992
Chronically poor 0.0 6.9 0.0 1.7 1.7 79.3 6.9 5.2
Moved out 0.0 3.1 2.1 3.1 2.1 83.3 5.2 3.1
Slipped into 0.0 8.6 0.0 0.0 8.6 80.0 0.0 2.9
Never poor 3.4 2.7 0.0 0.7 2.7 81.9 2.7 6.0
All 1.5 4.1 0.6 1.5 3.0 81.7 3.8 4.7
2000
Chronically poor 5.9 0.0 8.8 17.6 0.0 52.9 11.8 2.9

Chronic Poverty and Economic Growth in Uganda
55
CPRC Research for BASIS Collaborative Research Support Program
Moved out 1.2 10.5 7.0 15.1 8.1 38.4 17.4 2.3
Slipped into 8.3 12.5 8.3 8.3 0.0 45.8 16.7 0.0
Never poor 7.6 9.8 14.4 14.4 3.8 34.1 13.6 2.3
All 5.4 9.1 10.9 14.5 4.3 38.8 14.9 2.2
Source: Author’s calculations based on IHS and UNHS I
Notes: Estimates at individual level
Table 24: Purpose of loan by poverty state, Uganda
Purpose of the loan
Production Future investment Consumption Number of individuals
Poverty state 1992 2000 1992 2000 1992 2000 1992 2000
Chronically poor 19.0 55.9 62.1 23.5 24.1 20.6 62 34
Moved out 25.0 47.7 54.2 23.3 24.0 30.2 108 86
Slipped into 22.9 60.0 65.7 24.0 20.0 16.0 42 25
Never poor 22.8 64.9 59.1 17.2 25.5 17.9 169 134
Total 22.8 58.1 58.9 20.4 24.3 21.9 381 279
Source: Author's calculations based on panel data of 1992/93 and 1999/00
Notes: i) Estimates derived at individual level
ii) Production includes purchase of agricultural land, livestock and agricultural inputs and start/expand enterprise; future investment includes education and health; consumption includes housing, household consumer goods and services, ceremonies and others (unspecified).

Chronic Poverty and Economic Growth in Uganda
56
CPRC Research for BASIS Collaborative Research Support Program
Table 25: Distance to local government by poverty state, Uganda
Table 26: Average distance to selected infrastructure by poverty state, Uganda Roads Most common market Others Feeder Trunk Input Produce Consumer Post Telephone Bank Electricity (%) Chronically poor 1.3 8.2 10.7 10.5 10.3 21.2 25.7 34.3 10.0 Moved out 1.2 5.0 10.1 9.9 9.9 16.1 19.4 27.8 12.7 Slipped into 2.4 3.9 14.0 11.7 14.0 38.2 41.5 48.7 11.9 Never poor 2.5 4.0 9.2 9.1 8.0 13.3 16.6 25.4 21.4 Total 1.9 5.1 10.4 9.9 9.8 18.9 22.2 30.8 15.3 Source: Author's calculations based on panel data of 1999/00
All households Urban households Rural households Poverty state
District headquarter
Nearest municipality Kampala
District headquarter
Nearest municipality Kampala
District headquarter
Nearest municipality Kampala
Chronically poor 42.2 83.2 311.1 11.3 59.8 203.0 43.0 83.8 313.9
Moved out 38.3 61.7 252.7 6.8 24.4 158.6 40.1 63.8 257.9
Slipped into 66.0 81.9 297.8 17.0 32.9 133.7 68.0 83.9 304.5
Never poor 36.5 56.9 224.8 9.9 23.3 94.1 39.8 61.0 240.6
Total 42.0 66.5 258.9 9.7 26.8 120.7 44.3 69.4 268.7
Source: Author's calculations based on panel data of 1992/93 and 1999/00

Chronic Poverty and Economic Growth in Uganda
57
CPRC Research for BASIS Collaborative Research Support Program
Table 27: Access to agricultural inputs by poverty state, rural Uganda
Poverty state Chronically poor Moved out Slipped into Never poor All households 1992 1999 1992 1999 1992 1999 1992 1999 1992 1999 Access to improved seeds All 6.9 0.0 8.1 0.0 1.6 0.0 11.8 1.1 8.3 0.4 Many 14.1 2.9 22.2 2.3 15.0 1.3 21.0 3.0 19.3 2.5 About half 67.4 1.7 54.8 6.0 51.3 3.3 49.6 6.5 54.9 5.0 Few 5.5 39.0 7.6 48.5 23.8 28.0 7.8 48.8 9.5 44.0 None 6.1 56.5 7.4 43.3 8.3 67.5 9.7 40.6 8.1 48.2 Access to extension services All 2.7 0.6 3.2 0.9 0.0 0.0 5.1 1.0 3.4 0.7 Many 13.9 4.2 9.8 3.5 6.9 0.7 10.6 4.4 10.4 3.6 About half 72.9 2.5 69.5 2.1 59.6 0.4 64.1 2.4 66.9 2.1 Few 2.7 22.1 4.3 31.3 4.5 20.4 5.6 26.7 4.5 26.4 None 7.9 70.6 13.2 62.2 29.1 78.5 14.6 65.5 14.8 67.2 Extension services to women All 3.0 0.7 4.1 1.6 1.2 1.1 5.6 1.3 4.2 1.3 Many 13.5 5.0 9.0 4.1 10.5 1.0 10.1 4.7 10.4 4.2 About half 70.3 2.4 70.7 1.0 66.0 0.6 65.9 1.3 68.3 1.3 Few 2.5 20.4 4.7 30.7 5.1 24.0 5.3 25.0 4.6 25.9 None 10.7 71.5 11.5 62.6 17.1 73.2 13.1 67.7 12.5 67.3 Bought food in lean period All 5.2 16.8 7.6 9.3 27.8 39.3 5.2 9.1 9.0 14.8 Many 30.8 52.0 35.6 45.9 22.6 32.9 34.8 43.3 32.6 44.4 About half 47.5 7.0 42.3 10.5 41.3 4.5 44.8 12.2 44.1 9.6 Few 10.6 16.5 9.4 22.5 3.5 16.5 7.9 24.7 8.3 21.3 None 6.0 7.7 5.1 11.9 4.8 6.8 7.3 10.7 6.0 10.0 Source: Author's calculations based on panel data of 1999/00 Notes: This information was gathered in the community module of 1999/00, retrospectively

Chronic Poverty and Economic Growth in Uganda
58
CPRC Research for BASIS Collaborative Research Support Program
Table 28: Source of main information on technology by poverty state, rural Uganda
Poverty state
Source of information Chronically poor Moved out Slipped in Never poor Total Extension agents 18.4 24.0 39.6 19.2 23.3 Farmers in other villages 6.7 8.4 7.5 9.1 8.2 Private sector 0.8 0.5 0.9 1.0 0.8 Traders 10.7 12.8 6.2 20.0 14.0 Public source 50.8 40.7 27.9 35.2 39.0 Others 12.6 13.7 17.8 15.5 14.7 Total 100.0 100.0 100.0 100.0 100.0
Source: Author's calculations based on panel data of 1999/00

Chronic Poverty and Economic Growth in Uganda
59
CPRC Research for BASIS Collaborative Research Support Program
Table 29: Crop cultivated by poverty state
All households Central region East region North region West region
Maize Tobacco Cotton Coffee Maize Tobacco Cotton Coffee Maize Tobacco Cotton Coffee Maize Tobacco Cotton Coffee Maize Tobacco Cotton Coffee
Chronically poor 75.3 4.4 10.1 23.9 85.7 0.0 0.0 56.6 81.5 0.0 15.6 26.9 60.7 3.2 18.8 2.9 83.7 12.7 1.6 26.1
Moved out 80.5 2.6 6.2 40.6 82.5 0.6 1.6 83.0 84.2 0.0 11.2 37.6 66.2 10.8 20.1 0.9 81.9 3.0 0.0 24.1
Slipped into 83.1 0.6 6.6 23.6 73.3 0.0 11.7 73.1 84.6 0.0 8.6 35.5 90.6 1.3 6.8 0.6 73.4 0.0 0.0 20.9
Never poor 83.6 2.1 4.9 39.3 88.1 2.1 0.0 68.8 95.6 0.0 17.6 40.2 74.7 9.2 15.3 0.0 74.4 2.2 0.0 20.6
Total 80.9 2.5 6.5 34.6 84.6 1.1 1.6 72.0 87.8 0.0 13.8 36.6 72.8 5.0 14.9 1.4 78.2 3.9 0.2 22.6