chronic poverty in the united states joan r. rodgers; john l. rodgers … · chronic poverty in the...
TRANSCRIPT

Chronic Poverty in the United States
Joan R. Rodgers; John L. Rodgers
The Journal of Human Resources, Vol. 28, No. 1. (Winter, 1993), pp. 25-54.
Stable URL:
http://links.jstor.org/sici?sici=0022-166X%28199324%2928%3A1%3C25%3ACPITUS%3E2.0.CO%3B2-F
The Journal of Human Resources is currently published by University of Wisconsin Press.
Your use of the JSTOR archive indicates your acceptance of JSTOR's Terms and Conditions of Use, available athttp://www.jstor.org/about/terms.html. JSTOR's Terms and Conditions of Use provides, in part, that unless you have obtainedprior permission, you may not download an entire issue of a journal or multiple copies of articles, and you may use content inthe JSTOR archive only for your personal, non-commercial use.
Please contact the publisher regarding any further use of this work. Publisher contact information may be obtained athttp://www.jstor.org/journals/uwisc.html.
Each copy of any part of a JSTOR transmission must contain the same copyright notice that appears on the screen or printedpage of such transmission.
The JSTOR Archive is a trusted digital repository providing for long-term preservation and access to leading academicjournals and scholarly literature from around the world. The Archive is supported by libraries, scholarly societies, publishers,and foundations. It is an initiative of JSTOR, a not-for-profit organization with a mission to help the scholarly community takeadvantage of advances in technology. For more information regarding JSTOR, please contact [email protected].
http://www.jstor.orgFri Aug 31 16:33:54 2007

Chronic Poverty in the United States
Joan R. Rodgers John L. Rodgers
A B S T R A C T
This paper proposes a method of measuring chronic and transi-tory poverty using an axiomutically sound, additively decompos-able index of aggregate poverty. Our approach is contrasted with alternative methods of meas~lringpoverty persistence. W e use our method to measure chronic and transitory poverty in the United States during the 1980s and late 1970s and find that chronic poverty is a more serious problem than previously thought. Between the late 1970s and mid 1980s poverty not only increased, it became more chronic and less transitory in nature. This is true for the population as a whole and for some, but not all, of the subpopulations we considered. The latter were defined according to race, type of social unit, and educational qual$ca-tions of the head of the social unit. All empirical analyses are based on data fiom the Panel Study of Income Dynamics.
I. Introduction
This paper is concerned with the measurement of chronic and transitory poverty. The measures we propose capture important as-
The autllors are professors of economics at the University of North Carolina at Greens-boro. They would like to thank Ken Koford, Chris Ruhm, and three anonymous referees for helpful comments and staff of the Survey Research Center at the University of Michi-gan for technical advice. This research was supported in part by a Fellowship from the Jerome Levy Economics Institute of Bard College. The data used in this article can be obtained beginning in May 1993 through May 1996 from the a~lthorsat the following ad-dress: Department of Economics, University of North Carolina at Greensboro, NC 27412. [Submitted November 1991; accepted August 19921
T H E J O U R N A L O F H U M A N R E S O L 7 R C E S . X X V I I l 1

26 The Journal of Human Resources
pects of poverty not reflected in existing poverty indices and therefore are likely to be helpful in developing more realistic models of poverty causation and persistence. For example, the concept of an "underclass" rests upon the assumption that certain groups experience poverty that is both severe and long term in nature, so much so that poverty is likely to be passed from one generation to another (Auletta 1982, Wilson 1987). If all poverty is short term, then theories about the existence of an "un- derclass" lack credibility. Measurement of chronic and transitory pov- erty is also important from a policy perspective. Since chronic and transi- tory poverty are likely to have different causes, they are likely to require different preventive policies. A society with limited resources may wish to give greater emphasis to programs that specifically target chronic pov- erty. Appropriate measurement of chronic and transitory poverty is im- portant, therefore, for designing, targeting, and evaluating poverty pro- grams.'
Central to the measurement of poverty is the choice of time period over which to measure income. Cross-section studies typically base their computations on a one-year income period. The collection of data on an annual basis makes a one-year income period convenient but not neces- sarily the best choice; the latter depends on the objective to be accom- plished. If the objective is to identify and assist people in need of emer- gency aid, then a one-year income period may be too long. If the objective is to understand why some people are unable to achieve a satisfactory standard of living, then a one-year income period may be too short. The orientation of this paper is in the latter direction. We agree with Rainwa- ter (1981, p. 5) that permanent income (or the lack of it) is "probably the principal influence on people's standard of living and style of life." Therefore, we argue that longer income periods are better suited to under- standing the nature of chronic poverty than shorter income periods.
Most previous investigators of persistent and transitory poverty have eschewed the concept of permanent income in their analyses. Typically, longitudinal data are used to assess the adequacy of income in meeting needs in each of a sequence of years. These longitudinal studies, like cross-section analyses, adopt the (usually implicit) assumption that in- come can be used for consumption only within the year in which it is earned. Yet, the savings and borrowing behavior of households over ex- tended periods suggests that inter-temporal transfers of income are im- portant. Furthermore, the economic theory of household behavior con- tends that rational agents will engage in inter-temporal income transfers
1. The measures we propose are not intended to be used in establishing eligibility for short-term welfare benefits because both the chronically poor and the transitorily poor may, at times, require emergency assistance.

Rodgers and Rodgers 27
if their income-to-needs ratios vary through time and if interest rates are "moderate" relative to rates of time preference (King 1985). Accord- ingly, measures of chronic poverty should reflect this behavior.
The objectives of this paper are: (1) to propose a method for measuring chronic and transitory poverty based on axiomatically sound indices of aggregate poverty (Sen 1976), (2) to report the results obtained when our method is applied to U.S. income data, and (3) to compare our findings with those based on other methods. Chronic poverty in the United States, measured with our method, is found to be a more serious problem than previously thought. Furthermore, between the late 1970s and mid-1980s chronic poverty increased both absolutely and as a proportion of total poverty.
The paper proceeds as follows. Section I1 reviews current methods of measuring chronic and transitory poverty, while Section I11 explains the logic of our approach. In Section IV we describe the data used in the application of our procedure to the measurement of poverty in the United States, and in Section V we present and discuss our results. Section VI compares and contrasts our results with those obtained with a tabulation study. In Section VII we offer some concluding remarks.
11. Previous Measures of Chronic and Transitory Poverty
Previous studies of persistent and transitory poverty have adopted one of four approaches. The first is a "model-based" approach which was used by Duncan and Rodgers (1991) to measure persistent poverty among children. Individual i's income-to-needs ratio in year t is represented by a fixed-effects model in which the individual-specific intercept is interpreted as the individual's "permanent" income-to-needs ratio while the error term captures the transitory component of the indi- vidual's income-to-needs ratio. Persistent poverty is measured by the proportion of individuals with permanent income-to-needs ratios less than one. The concept of permanent income inherent in the model-based ap- proach is that of a smoothed, or averaged, income, but no account is taken of the cost of saving and borrowing necessary to achieve consump- tion levels consistent with this notion of permanent i n ~ o m e . ~ A second approach by Duncan and Rodgers, which measures persistent poverty as the proportion of the population with n-year aggregate income less than
2. See Bane and Ellwood (1986, pp. 2-4) for further discussion of the model-based ap- proach.

28 The Journal of Human Resources
n-year aggregate needs, implicitly assumes that saving and borrowing are costless. Duncan and Rodgers' measures of persistent poverty, the head-count ratio based on permanent income and the head-count ratio based on n-year aggregate income, cannot take account of the depth of poverty except by calculating head-count ratios based on different pov- erty thresholds.
The third approach to the measurement of persistent and transitory poverty tabulates the proportion of people with incomes below the pov- erty line in x out of n time periods, where 0 5 x 5 n (Levy 1977; Coe 1978; Rainwater 1981; Hill 1981; Duncan, Coe, and Hill 1984; Gaiha and Deolalikar 1991). The prevalence of persistent versus transitory poverty is then assessed by comparing the proportion of people who were poor in all or most periods (the persistently poor) with the proportion of people poor in just a few periods (the transitorily poor). For example, Duncan, Coe, and Hill (1984) found that nearly 24.4 percent of the U.S. population had incomes below the official poverty line for at least one year between 1969 and 1978, but only about 2.6 percent were persistently poor, defined as poor for eight or more years. Therefore, (2.610.244 =) 10.7 percent of the ever-poor population were persistently poor. Tabulation studies can be criticized on the grounds that the number of years that delineate chronic poverty is an arbitrary choice. The method has also been criti- cized on the grounds that it is subject to censoring problems (Bane and Ellwood 1986, p. 4): some of the people who were poor for a few periods at either the beginning, or end, of the observed sequence of time periods may have been in the midst of a poverty spell that either began before, or ended after, the sequence of time periods actually observed.
The fourth approach to measuring persistent and transitory poverty avoids censoring problems by modeling the duration of completed pov- erty spells (Bane and Ellwood 1986, Ruggles and Williams 1989). Persis- tent poverty is measured by the percentage of spells that are long, transi- tory poverty by the percentage of spells that are short. For example, Bane and Ellwood found that nearly 45 percent of poverty spells end within one year; only 12 percent last ten years or more. Bane and Ell- wood's study has contributed significantly to our knowledge of the dy- namics of poverty. For example, it reconciled the conflicting views of the 1960s (that poverty is mostly long term) and 1970s (that poverty is mostly short term) by demonstrating that a large percentage of those who are poor at a particular point in time are in long-term poverty, but only a small percentage of the ever-poor population experience a long poverty spell. Duration studies are also useful in identifying events, such as changes in family structure, that may cause the beginning or the end of a poverty spell.

Rodgers and Rodgers 29
Duration studies regard chronic poverty as a state in which income is less than needs during a long and continuous period of time. The claim that tabulation studies are subject to problems of censoring reflects the view that persistent poverty is low income in many consecutive years. But chronic poverty can be defined as low income in a large proportion of time periods in which case tabulation studies are not subject to censor- ing. Both approaches are potentially misleading if the time period ob- served does not provide a representative picture of each person's lifetime income profile. The longer the time period observed, the more accurate is the information provided by both types of studies, the ideal being observation over an entire lifetime.
If recurrent, though not continuous, poverty is viewed as chronic, then chronic poverty is better captured by the tabulation approach than by a duration study. The treatment of multiple poverty spells in existing dura- tion studies is unsatisfactory. Ruggles and Williams discard all but the first observed poverty spell experienced by each individual. Their ap- proach ignores a lot of poverty, but it has the advantage of creating a one-to-one correspondence between poverty spells and people. Bane and Ellwood, on the other hand, include all poverty spells and in consequence must conduct their analysis in terms of spells rather than people. Their result that 45 percent of all poverty spells end within one year could have occurred because 45 percent of poor people each had one brief poverty spell, or because a few poor individuals each had many short spells.
All previous studies of chronic and transitory poverty, except those of Rainwater (1981) and Duncan and Rodgers (1991), have employed a sequence of income periods of one year (or less) and consequently as- sume that income cannot be transferred between years. They would have us believe, for example, that, given a poverty line of z = 100, Persons A and B with the following six-year incomes are indistinguishable from one another.
Example 1 Year 1 Year2 Year3 Year4 Year5 Year6
PersonA 300 300 300 99 99 300 PersonB 101 101 101 10 10 101 z = 100 Person C 300 300 99 99 99 300
The tabulation approach would record both people as being poor for two out of six years. A duration study would record both people as experienc- ing a poverty spell of two years in length. Yet, it seems to us unreasonable to view Person A in years four and five as being in a state in which resources are insufficient to meet basic needs (that is, "poor"). Person A could save enough during the first three years to compensate for his

30 The Journal of Human Resources
or her reduced income in years four and five. Person B, on the other hand, probably is in a state of poverty, not only in years four and five but in other years as well.
Both tabulation and duration studies treat poverty as a discrete state. One is either poor or not poor; the severity of poverty is ignored. Even if one accepts the argument that inter-year income transfers do not occur, it seems unreasonable to regard Persons A and B as equally poor in years four and five. It also seems unreasonable, as both tabulation and duration studies would allege, to regard Person C in Example 1 as more chronically poor than Person B.
In the next section we describe an alternative approach that determines whether people are chronically poor on the basis of a measure of their permanent incomes. Our measure of permanent income, however, is dif- ferent from that of the "model-based" approach in that it explicitly takes account of agents' potential saving and borrowing behavior. Unlike dura- tion studies, our method treats multiple poverty spells in a meaningful way, and unlike all previous studies of persistent poverty, our method reflects the depth as well as the incidence of poverty. For example, if borrowing is prohibited but people can save at a zero rate of interest, our "permanent-income approach" would rank the people in Example 1 {B, C, A} in descending order of poverty, but only Person B would be classi- fied as chronically poor. Persons A and C experience poverty but it is entirely transitory in nature. Using our methodology, a few bad years do not render an otherwise rich person (Person A) chronically poor and a few good years do not raise an otherwise impoverished person (Person B) out of chronic p ~ v e r t y . ~
111. Chronic and Transitory Poverty
A. An Illustrative Example
We begin by defining a T-year aggregate-poverty index, Ap(T), which is comprised of chronic and transitory components. Ap(T) is a weighted average of the corresponding T annual-poverty index values, P,, P,, . . .
3. The distinction between Persons A and B in Example 1 is empirically, as well as theoreti- cally, important. Of the 75,618 people in our (weighted) sample who were poor for at least one of the ten years from 1977 through 1986 (the ever-poor), 14,143 (18.7 percent) resemble PersonA in that their permanent incomes, as defined in Section 3.1, were greater than twice the poverty line. 16,994 people (22.4 percent of the ever-poor) resemble Person B in that they had permanent incomes below the poverty line but experienced at least one year out of poverty.

Rodgers and Rodgers 3 1
P,, where P is an additively-decomposable poverty index.4 That is,
where C,=,,, w,= 1. In the remainder of this paper A p ( T )is called the "average-annual-poverty index." If all members of the population are present in all T years then w,= 1/T ( t = 1 , 2, . . . T). For the illustrative examples in this section we assume equal weights. In Section 1II.B we shall discuss situations where births, deaths, and migration cause some population members to be absent in some years. As a measure of poverty, A p ( T )adheres to the traditionally made assumption in the poverty litera- ture that no agent makes inter-year income transfers.
Our measurement of chronic poverty requires a measure of "perma- nent income" that can be compared with "permanent needs." Given a T-year observation period, our measure of an agent's permanent income, Y*, is equal to the maximum sustainable annual consumption level that the agent could achieve with his or her actual income stream over the same T years, if the agent could save and borrow at prevailing interest rates. For simplicity, we shall assume in this section that the annual interest rate is the same for saving and borrowing, is nonzero, and is constant through time. In Section 1II.B we shall discuss the complexi- ties introduced when different interest rates apply to saving and borrow- ing, and when interest rates vary through time. Using an additively- decomposable poverty index, P, we measure chronic poverty over T years, C p ( T ) ,as:
where n is the population size, Y;i is agent i's permanent income over T years, and P(.) is the poverty index. Unlike A p ( T ) , C p ( T ) assumes agents can make inter-year transfers for the purpose of equalizing their income- to-needs ratio^.^
An agent may be chronically poor but temporarily out of poverty in year t . Alternatively, an agent who is not chronically poor may experi-
4. An additively decomposable poverty index for a population can be written as a weighted average of the poverty indices of a set of mutually exclusive and collectively exhaustive subpopulations (see Foster, Greer, and Thorbecke 1984). The advantages of using an addi- tively decomposable poverty index will become evident in Section 1II.C. 5. Duncan and Rodgers' (1991) measure of persistent poverty, the proportion of the popula- tion with T-year aggregate income less than T-year aggregate-poverty thresholds, is a special case of our Cp(T) index, in which P is the head-count ratio and both borrowing and savings interest rates are zero.

32 The Journal of Human Resources
ence transitory poverty in year t. Our measure of transitory poverty in year t , based on an additively decomposable poverty index, P , is defined as the difference between annual poverty in year t, P,, and chronic pov- erty, Cp(T) .A positive value for P, - C p ( T )indicates that some of the poverty experienced in year t is not chronic poverty. A negative value means that some chronic poverty is temporarily absent in year t . Transi-tory poverty, averaged over T years, Tp(T) ,is equal to the residual:
A positive Tp(T)equals the amount of poverty which is not chronic in an average year. A negative Tp(T)equals the amount of chronic poverty which is temporarily absent in an average year.6
Equations ( 1 ) through (3) allow poverty to be measured with indices that are axiomatically sound. The aggregate-poverty index, P , used in our empirical analysis is that of Foster, Greer, and Thorbecke (1984). We chose Foster, Greer, and Thorbecke's index (FGT) because it is addi- tively decomposable and has additional desirable properties.' FGT is given by:
where n is the population size; m is the number of poor; y , is the real income of the ith agent, y i p ] 5 y , (i = 2 , 3, . . . ,n), and z is the poverty line.
When FGT is used in Equation ( I ) ,and MI,= l / T ( t = 1 , 2 , . . . T ) , the average-annual-poverty index is:
where y , is the real income of the ith agent in year t , m, is the number of agents for whom yil < z , and N = nT. When FGT is used in Equation
6 . We have found that negative values for T,(T) occur quite frequently when the poverty index, P, is the head-count ratio, defined as the proportion of the population that is poor. Negative values seldom occur when P is a function of poverty gaps. To fabricate examples of negative T p ( T ) when P is an axiomatically sound poverty index we had to use interest rates that prohibited either almost all borrowing or almost all savings. 7. Another index with highly desirable properties is that of Blackburn (1989). Donaldson and Weymark (1986),Blackburn (1989),and Rodgers and Rodgers (1991)discuss the proper- ties of poverty indices. Results based on Blackburn's index that correspond to those pre- sented in Section V of this paper are available from the authors on request.

Rodgers and Rodgers 33
(2) the chronic poverty index is:
where m y is the number of agents in the population whose permanent incomes (Y?;)fall below the annual-poverty level, and Y?,,-, Y;i (i = 2, 3, . . . n) .
Suppose the poverty level is 100 per year. Consider a population of three agents, A , B, and C , with the following two-year income streams:
Example 2 Year 1 Year 2
Person A 20 20 Person B 20 200 z = 100 Person C 200 200
The FGT index values in the two years are FGT, = (113) ( 2 ) ( 1 - 115), = 32175 and FGT, = (113) ( 1 - 115), = 16175, respectively. Therefore, AF,,(2) = 24175. Given an annual interest rate of 10 percent, the perma- nent incomes of agents A, B, and C are the annuities 20, 105.714, and 200, respectively. Therefore, C,,,(2) = (113) ( 1 - 115)2 = 16175 and TF,,(2) = 24175 - 16175 = 8175.
Contrast the above situation with a population of three agents, X, Y, and Z, who have the following two-year incomes:
Example 3 Year 1 Year 2
Person X 20 200 Person Y 20 200 z = 100 Person Z 200 20
FGT indices are FGT, = 32175 and FGT, = 16175, and so AF,,(2) = 241 75. At a 10 percent annual interest rate the permanent incomes of agents X, Y, and Z are the annuities 105.714, 105.714, and 114.286, respectively. Therefore, CF,,(2) = 0 and TF,,(2) = 24175.
Examples 2 and 3 illustrate several characteristics of multi-period pov- erty measurement. The examples portray quite different sets of income profiles yet in both examples poverty in Year 1 is 32175 and poverty in Year 2 is 16175. Therefore, average-annual poverty is also the same (namely, 24175) in both examples. The two examples demonstrate the inability of cross-section "snapshots" of poverty, and by implication of A p ( T ) ,to capture the nature of poverty over time. The chronic poverty index, C p ( T ) ,can distinguish between the two cases. In Example 2, agent

34 The Journal of Human Resources
A is poor on the basis of permanent income, and chronic poverty equals 16175. The residual, 8175, is transitory in the sense that this amount of measured poverty disappears when inter-year income transfers occur. In Example 3 , each agent is poor for only one year if inter-year income transfers are disallowed but when inter-year income transfers are as- sumed, no agent is poor and so chronic poverty is zero. This means that all observed poverty in Example 3 is transitory.
Our measure of chronic poverty assumes that inter-year income trans- fers are feasible, although not necessarily actual. Our concept of chronic poverty is a response to the question: "What level of deprivation, relative to the poverty threshold, would be experienced if individuals could un- dertake consumption-equalizing inter-period income transfers at reason- able rates of interest, and did so?" We do not suggest that such consump- tion-equalizing transfers always take place, although, as we shall see, there is evidence that some poor do engage in borrowing and saving behavior. On the other hand, many individuals whose annual incomes are normally well above the poverty threshold do experience, sometimes by choice, occasional periods when their incomes fall below the poverty line. In such instances consumption and other expenses may be funded substantially from saving and borrowing. For example, more than one third of those who were poor for at least one of the ten years from 1977 through 1986 were poor for only one year; half were poor for no more than two years. A significant proportion of these people could have achieved consumption levels above the poverty threshold by appropriate saving and borrowing. If they do not save and borrow and in consequence their consumption levels drop below the poverty threshold, we argue that such people should not be counted as chronically poor, although they do experience transitory poverty. Our measure of transitory poverty cap- tures this.
What of people whose annual incomes are normally below the poverty threshold? Do they, or could they, engage in saving and borrowing? First, the conceptual basis of our method does not depend on actual saving and borrowing behavior. Indeed, our measure of transitory poverty is an acknowledgment that such saving and borrowing may not occur. Second, there is increasing evidence that some poor people can, and do, save and borrow. The evidence includes consumer expenditure analyses that find that the poor spend more than their income over the course of a year (for example, Slesnick 1992, p. 2, p. 24, and p. 27; Mayer and Jencks 1989, p. 109);~survey information about the poor's perception of their own
8. We recognize that borrowing or consuming out of past savings is only one possible explanation of why annual expenditures exceed annual incomes. Another explanation is that the poor underreport their incomes.

Rodgers and Rodgers 35
ability to save and borrow (Mayer and Jencks 1989, pp. 108-109); and t.he prevalence of pawn shops and money lenders in poor neighborhood^.^ The recent work of Slesnick (1992) in this respect is particularly interest- ing and relevant. Using data from the Consumer Expenditure Surveys, he finds that "the service flows from the stock of consumer durables account for between 10 and 13 percent of the budgets of poor house- holds'' (p. 2); that "the mean level of total expenditure of the income poor exceeds the mean income level in each (of thirteen) year(s) examined" (p. 27); and that there is evidence of "consumption smoothing" (p. 24). Of particular interest is Slesnick's finding that "approximately 40 percent of the income poor are homeowners" (p. 27).
The permanent-income approach proposed here is a practical way of taking account of the ability to accumulate and run down wealth over extended periods of time, either through borrowing and saving-or through the purchase of durable items during high-income years. If data on wealth at the beginning of the income period were available, it could be directly incorporated into our calculation of permanent income. We know of only one suitable longitudinal data set which records assets as well as income, the Survey of Income and Program Participation (SIPP). Unfortunately, it provides only a short series of panel data.
B. Some Complications and Their Resolution
Several practical problems are involved in measuring the chronic and transitory components of poverty: individuals who change social units during the income period considered; the definition of the population within which poverty is to be measured; the weights used in computing average-annual poverty; the calculation of permanent income when the rate of interest varies through time and is different for saving and bor- rowing; and the length of income period over which to measure chronic poverty. We shall discuss these problems in order.
Over time, the compositions of families and households may change. Therefore, any analysis of poverty based upon longitudinal data must use the individual as the sampling unit. When the poverty index is an aggre- gate of poverty gaps, rather than a simple head count, a problem is en- countered: how to measure each individual's poverty gap. We assume that in a given year each individual has access to an income equal to the income per adult equivalent of the social unit in which he or she resides
9. It might be argued that the poor face higher interest rates on borrowing and lower interest rates on saving than the rest of society. Our methodology can accommodate this view by allowing interest rates to be an inverse function of income, although we have not done so in the present analysis.

36 The Journal of Human Resources
during that year. We measure his or her poverty gap by the differ- ence between that income and the poverty threshold for a single adult. Throughout the rest of this paper an individual's income should be taken to mean his or her income per adult equivalent. The number of adult equivalents in a social unit is calculated as the poverty threshold for that social unit, divided by the poverty threshold for a single adult.''
When poverty is measured over two or more years "the population" is an ambiguous concept because of births, deaths and migration. We define the population of interest to be all individuals who are present at the end of the income period. Our justification is that individuals present at the end of the income period are likely to provide the most up-to-date representation of the then-current U.S. population.
We can now consider the choice of weights in computing average- annual-poverty indices, Ap(T). Having defined our population of interest, it is apparent that some members of the population will not be observed in all years prior to year T; that is, n, will be less than n , for some 1 I t < T. In computing Ap(T), a weight of n,/N, where N = E,=,,, n,, is applied to the poverty index in year t. With N = C,=,,,n, , Equation (5 ) remains valid.
Next, we consider the calculation of permanent income, which is de- fined as the maximum level of annual consumption which can be sus- tained over the income period from the individual's actual income stream when savings (equal to positive end-of-year balances) earn a savings in- terest rate and borrowing (equal to negative end-of-year balances) incur a borrowing interest rate. We assume zero cash balances at the beginning and end of the income period. However, our method outlined below can accommodate nonzero balances if deemed appropriate.
When the borrowing and savings interest rates are the same it is rela- tively easy to compute permanent income, which is the annuity equiva- lent to the actual income stream. When the savings rate differs from the borrowing rate, permanent income must be computed with an iterative procedure (see Figure 1)."
Finally, we need to consider the length of the income period to be used in measuring poverty. Conceptually, T is the number of years over which agents actually can transfer income by saving and borrowing. Thus de-
10. According to this method, which was suggested by Blackorby and Donaldson (1980), an individual's income-to-needs ratio equals the income-to-needs ratio of the social unit in which he or she resides, and the sum of poverty gaps over all adult equivalents in a family equals the family poverty gap. See Rodgers and Rodgers (1991) for a more detailed discus- sion of the concept of income per adult equivalent. 11. Details and an illustration of the procedure are available from the authors on request.

Rodgers and Rodgers 37
Given: savings interest rate, rs, t = 1 , 2, . . . T
borrowing interest rate, rb, t = 1 , 2, . . . T income, y, t = 1 , 2, . . . T .
1. Compute = C,,,,, y,lT-4
2. Compute saving and borrowing in each year:
where st > 0 for saving and st < 0 for borrowing.
J-3. Compute the balance at the end of each year:
6, = st + d*(l + rs,_,)*b,_,+ ( 1 - d)*(l + rb,_ ,)*b,., t = 1 , 2, . . . T
I where b, = 0; d = 1 if b t _ ,> 0; d = 0 otherwise.
9I 4. b, =
I
O? - yes I 1
5. Adjust savings and borrowing st = s, - b,/T. 9-
6. Compute permanent income
Y T = y , - s t t = 1 , 2, . . . T
Figure 1 Algorithm to Determine Permanent Income
The first approximation of permanent income is the mean annual in- come (Step I ) . The resulting implied savingsiborrowing pattern (Step 2) and actual interest rates are used to compute end-of-year balances (Step 3). If the balance at the end of the fiizal year of tlze income pe- riod is not acceptably close to zero (Step 4) tlzen the savingsiborrowing levels are appropriately adjusted (Step 5). Tlze procedure is repeated until the final eizd-ofyear balance is acceptably close to zero. Perma- nent income is computed as annclal iizcome minus (plus) saving (bor- rowing) (Step 6) .

38 The Journal of Human Resources
fined, T probably varies among agents.12 T may be directly related to the wealth and income of the agent, but it could also depend on other factors. For example, if a married couple divorces and most of the accumulated wealth of the union stays with one partner, then the other partner may not have access to income earned and saved within the former family unit. In this paper we select several values of T and observe the sensitiv- ity of our results to the choice of T. While not an ideal solution to the problem, our approach is preferable to using an annual income period as if it were the "natural" period over which to measure income.
C . Chronic and Transitory Poverty: Decornpositions
Our measures of multi-period aggregate poverty, based on any additively decomposable poverty index, P, can themselves be decomposed ac-cording to the characteristics of mutually exclusive subpopulations. Aver- age-annual poverty can be written in the form:
chronic poverty can be expressed as:
and transitory poverty as:
where L is the number of mutually exclusive and collectively exhaustive subpopulations, vj is the proportion of the population in subpopulation j , and AP(T) j , C p ( T ) j , and Tp(T)j are average-annual, chronic, and transi- tory poverty indices, respectively, for subpopulation j.
Comparisons of poverty in various subpopulations can be performed using poverty-intensity indices (Rodgers and Rodgers 1991). In general, given any additively decomposable poverty index, P, poverty intensity in subpopulation j equals the value of the poverty index for subpopulation j divided by the value of the poverty index for the entire population.
12. If T varies substantially among agents, there is no appropriate concept of T at the aggregate level. Of course. "no appropriate concept of T" is not the same as "T equals one year."

Rodgers and Rodgers 39
Average-annual-poverty intensity, chronic-poverty intensity, and transi- tory-poverty intensity in the various subpopulations can all be calculated in this way. Poverty-intensity indices provide a measure of the intensity of poverty in subpopulation j relative to poverty within the entire popula- tion. A value greater (less) than one means that poverty in subpopulation j is more (less) intense than poverty in the entire population.
Poverty-intensity indices are helpful in identifying the poorest groups. Such comparisons also suggest possible causes of poverty and its persis- tence. Subpopulations examined in this paper are those defined according to the following characteristics of the social unit in which the individual resides at the end of year T: (i) the race of the head of the social unit; (ii) the type of social unit (female-headed family, etc.); and (iii) the educa- tional achievement of the head of the social unit.13
IV. Data
The data used in this study come from the 1968-87 "fam- ily-individual-response" and "family-individual-nonresponse" files of the Panel Study of Income Dynamics (PSID), conducted by the Survey Re- search Center (SRC) of the University of Michigan (see SRC 1987). The 1968-87 family-individual-response file contains panel data on 20,487 per- sons living in the 7,061 social units (families and unrelated individuals) who were interviewed in 1987. The 1968-87 family-individual-nonre-sponse file contains panel data on persons who were members of social units interviewed prior to 1987 but who had dropped out of the survey by 1987. People who were members, or are direct descendants of mem- bers, of the original social units who were interviewed in 1968 are referred to as "sample members." Other people who have joined the social units of sample members are called "nonsample members." When appropriate weighting procedures are applied, sample members are representative of the United States population except for immigration since 1968. Poverty indices for income periods ending in 1986 were computed using sample members in the family-individual-response file who were present in the social unit at the time of the 1987 interview. PSID-supplied individual weights for 1987 were used. Poverty indices for income periods ending
13. Many characteristics, including those considered here, change through time. We define subpopulations according to characteristics observed at the end of the income period be- cause this is most compatible with our definition of the population of interest and it allows individuals to be classified independently of the length of the income period. We can there- fore examine how our measure of chronic poverty changes as the income period is in-creased, ceteris paribus.

40 The Journal of Human Resources
in 1979 were computed using sample members from the (merged) family- individual-response and family-individual-nonresponse files who were present in the social unit at the time of the 1980 interview. PSID-supplied individual weights for 1980 were used. Information about each person and the social unit to which he or she belongs has been recorded for all years during which the individual participated in the survey. Some of the information collected, including that on income and needs, refers to the year preceding that in which the interview was held. Hence, in our study, income periods end with the year 1986 or 1979 rather than 1987 or 1980.
Chronic and transitory poverty are analyzed using all sample members, except for a small number of individuals who were temporarily absent from the survey during the income period.14 Permanent incomes of chil- dren born during a given income period were computed using income and needs data for each year of the person's lifetime. The definition of income used in this study consists of income from labor and capital assets, trans- fer income, lump-sum receipts (insurance payouts, inheritances, etc.), and the value of food stamps received by the social unit.'' PSID estimates of federal taxes were subtracted from gross income to obtain disposable income. The definition of needs is that employed by the PSID.'~ Both incomes and needs were expressed in 1967 dollars. The real interest rates used in computing permanent incomes are the savings account interest rate (equal to savings rate) and the credit card interest rate (equal to
14. The computation of permanent income requires an uninterrupted sequence of annual incomes. Since PSID income data for temporary absentees are unreliable, we had no alter- native but to exclude the 182 individuals who were temporarily absent between 1977 and 1986 and the 84 individuals who were temporarily absent between 1975 and 1979. 15. When interest, dividends and rental incomes are included in the income base our method could involve some double-counting. If wealth at the beginning of the income period were available then the double-counting problem could be avoided but, unfortunately, the PSID has little wealth data. To assess the effect of double counting we recomputed our main results, which appear in Tables 1, 2, and 3 below, with interest, dividends and rents excluded from gross incomes. The results are available from the authors on request. Of course, when unearned income is excluded, measured poverty increases, but the general conclusions reached in this paper are robust. 16. PSID poverty thresholds are 25 percent higher than official poverty thresholds, but PSID incomes are higher than those collected by the Bureau of the Census. Head-count ratios based on PSID incomes and official poverty thresholds are consistently lower than the Census Bureau's poverty rates (see Minarik 1975; Duncan, Coe, and Hill 1984, p. 40; Bane and Ellwood 1986, p. 6). Using PSID thresholds and PSID incomes produces head- count ratios that approximate official poverty rates. The only change we made to the PSID's poverty thresholds was to multiply the poverty line for women living alone by 1.156, so as to give these women the same needs standard as that of elderly men living alone (see SRC 1987, p. D-5).

Rodgers and Rodgers 41
borrowing rate), net of the annual rate of inflation as measured by the consumer price index. 17, l8
V. Results
Table 1 presents average-annual, chronic, and transitory FGT-poverty indices for the entire U.S. population in the periods 1977 through 1986. As expected, the choice of income period affects the out- come of the poverty measurement process. Average-annual poverty among the 1987 population is largest during 1985-86 and declines as the income period is extended backwards to 1977-86.19 Chronic poverty indi- ces fall monotonically as the income period is e~ tended ,~ ' the rate of decrease being rapid initially but then slowing. During 1982-86 chronic poverty is about two-thirds its 1985-86 value (0.0081 compared with 0.0122) and, with 1977-86 as the income period, chronic poverty is about 45 percent its 1985-86 value (0.0055 compared with 0.0122).21 Transitory
17. Prior to April 1, 1986 maximum interest rates were imposed on time and savings depos- its at federally insured institutions. In this paper it is assumed that agents can save at the savings-account interest rate and borrow at a rate 12.94 percentage points higher than they can save; 12.94 is the mean difference between the savings-account interest rate and the credit-card interest rate for the period 1980-86, the longest period during which both rates were published. Nominal interest rates were extracted from various issues of the Federal Reserve Bulletin, Board of Governors of the Federal Reserve System, Washington, D.C. The consumer price index used to deflate nominal incomes and interest rates is the CPI-U- X1 (U.S. Department of Commerce 1990), which provides a consistent treatment of housing costs over the income periods considered in this paper. 18. Our measure of chronic poverty is sensitive to the difference between the borrowing interest rate and the savings interest rate, but is insensitive to the absolute levels of these two interest rates. A sensitivity analysis of chronic poverty to alternative savings and borrowing interest rates is available from the authors on request. 19. This pattern is not entirely consistent with the official poverty rate among individuals in the United States. Between 1977 and 1986, the official poverty rate was highest in 1983 and 1982 (see, for example, U.S. Department of Commerce, Bureau of the Census 1990). The inconsistency results from the fact that our data set excludes people who died between 1977 and 1986, from our use of disposable (rather than gross) income, and from our use of FGT instead of the axiomatically inferior head-count ratio used by the Bureau of the Census. 20. Although C,,,(T) decreases as T increases, this is not a mathematical property of the index. It is easy to construct hypothetical cases where Cp(T) is not monotonically decreas- ing in T, and we observed some examples in our empirical study. 21. The decline is probably because a longer income period is more likely to include higher- income years from which an individual can borrow and save. It is possible, however, that the chronic poverty results presented in Table 1 might be biased because of the fact that each time the income period is extended, the new year added is one in which individuals

42 The Journal of Human Resources
Table 1 Post-Transfer, Post-Tax Poverty in the 1987 U.S. Population, Measured over Income Periods of Different Lengths Using Foster, Greer, and Thorbecke's Indexa
Proportion Average- of Poverty
Income Annual Chronic Transitory Which is T Period Poverty Poverty Poverty Chronic
Source: PSID, Family-Individual-Response File, 1987. a. Computations are based on 15,088 "sample members" present in the PSID family unit in 1987.
poverty is nonnegative in all income periods. Chronic poverty, as a pro- portion of average-annual poverty, falls from 0.6857 in 1985-86 to about 0.3650 in 1977-86. Further extensions of the income period resulted in only small reductions in chronic poverty and in the proportion of poverty that is chronic. These results suggest that, whatever the conceptually appropriate income period is, about 36 percent of average-annual poverty among the 1987 U.S. population is chronic.
Table 2 compares poverty in the mid 1980s with poverty in the late 1970s using the FGT index. Average-annual, chronic, and transitory pov- erty are presented for a decomposition of the population according to
were younger than in the previous income period. To judge the importance of this potential age-effect bias we compared chronic poverty over the periods 1977-78, 1977-79, . . . . 1977-86 with chronic poverty for 1985-86, 1984-86, . . . , 1977-86. The results, which are available from the authors on request, indicate that there is no serious age-effect bias. Poverty was lower in 1977 than in 1986 but the pattern of decline is basically the same in both sets of chronic poverty measures.

Rodgers and Rodgers 43
type of social unit, race and educational achievement of the head of the social unit, all as of the end of the income period (1986 or 1979). For each of the eight subgroups, and the total, the change in the FGT index be- tween the two time periods, and the standard error of that change, are pre~ented.~'
For the total population, the increases in average-annual poverty and chronic poverty from the late 1970s to the mid 1980s were statistically ~ignificant.'~In the 1982-86 period chronic poverty was 47.1 percent of average-annual poverty, while in 1975-79, chronic poverty was 42.8 per- cent of average-annual poverty. Transitory poverty increased between 1975-79 and 1982-86 but the increase was not statistically significant. These results indicate that poverty in the United States was on the rise in the 1980s (an already-known fact), and also that chronic poverty (as defined here) was increasing. In simple terms, not only was poverty greater in the mid 1980s than seven or so years earlier, but there was reduced ability to avoid poverty through saving and borrowing.
Not all groups fared the same, however, between 1975-79 and 1982-86. Statistically significant increases in average-annual and chronic poverty were observed among people living in families headed by females without high-school diplomas, and among people living in "other" social units headed by African-Americans with high-school diplomas (see Columns 1, 4 and 5 in Table 2). A significant increase in average-annual poverty was also observed among people living in "other" social units, headed by non-African-Americans without high-school diplomas (Column 7 in Table 2). People living in families headed by non-African-American fe- males without high-school diplomas experienced a significant increase in transitory (as well as chronic) poverty. Although the increased poverty levels of other groups are not significant, Table 2 gives us no reason to be sanguine about poverty in the United States.
22. We calculated standard errors of changes in the FGT index using the method of "bal- anced repeated replications" (BRR) (see Hill 1992; Kish and Frankel 1970; Plackett and Burman 1946). This involved using the BRR STRATUM and BRR SECU variables provided in the PSID panel. This BRR numerical method of computing standard errors is necessary because the PSID is a stratified multistage sample. The PSID consists of two samples which could overlap, both of which involve stratification and clustering (Hill 1992, p. 62). Simple-random-sample standard-error computations are inappropriate and will likely under- estimate the sampling variation. Kakwani (1990) has derived a formula for the standard error of an FGT index computed from a simple random sample. Out of curiosity, we computed FGT-index standard errors for the two separate time periods, 1975-79 and 1982-86, using both the BRR method and Kakwani's formula. It is of interest to note that the BRR standard errors were generally 1.5 to three times as large as Kakwani's standard errors. 23. A change in FGT poverty between 1975-79 and 1982-86 is regarded as (statistically) significant if it is at least twice as large as its standard error.

Table 2 Post-Transfer, Post-Tux Poverty in the U.S. Population, Decomposed by Race, Type of Social Unit, and Education of Head, Measured Using Foster, Greer, and Thorbecke's Index (comparison between the late 1970s and mid-1980s)
African-American Other Races
Female Headed Family
Other Social Unit
Female Headed Family
Other Social Unit
Income Period
No High School
Diploma (1)
High School
Diploma (2)
No High School
Diploma (3)
High School
Diploma (4)
No High School
Diploma (5)
High School
Diploma (6)
No High School
Diploma (7)
High School
Diploma (8) Total"
Average-annual poverty 1982-86 1975-79 Change Standard error of change
0.1129 0.0813 0.0316 0.0138
0.0575 0.0456 0.0118 0.0083
0.0523 0.0431 0.0092 0.0066
0.0270 0.0163 0.0106 0.0053
0.0631 0.0276 0.0355 0.0114
0.0172 0.0149 0.0023 0.0053
0.0183 0.0145 0.0038 0.0018
0.0080 0.0060 0.0020 0.0015
0.0172 0.0132 0.0040 0.0013

Rodgers and Rodgers 45
m r - 2 2 d00Q0 m Ttr- Q m -0 0 0 0 Z S 2 2 zc2 g g g g g g g g 22 2z
t . * m ' 0 m m m a - 0m m c o m m c m m - 0 0 0 - - 0 0 g z g g g g g g g g 2: s s

46 The Journal of Human Resources
Table 3 presents annual-FGT-poverty intensity in 1986 and FGT- poverty-intensity indices, measured over income periods of different lengths, for the same decomposition of the population as appears in Table 2. Chronic poverty is more intense than 1986 poverty in families headed by African-American females (Columns 1 and 2); in "other" social units headed by African-Americans without high-school diplomas (Column 3); and in families headed by non-African-American females without high- school diplomas (Column 5). In general, our chronic poverty measure emphasizes poverty disparities. The poorest group in 1986 represented in Table 3, people living in families headed by African-American females without high-school diplomas, are indicated as more chronically poor (6.321 compared with 10.55 I), while the least poor group in 1986, individ- uals living in "other" social units headed by non-African-Americans with high-school diplomas, are indicated as less chronically poor (0.388 com- pared with 0.198).
People living in families headed by African-American females without high-school diplomas constitute the most chronically poor group identi- fied in this study. With a 1982-86 income period, their chronic poverty is more than ten times as intense as poverty in the entire population; with a 1977-86 income period, more than twelve times as intense! Chronic poverty in this group from 1977 through 1986 is about 69 percent of average-annual poverty; transitory poverty about 31 percent. In contrast, with a 1977-86 income period, only about 9 percent of poverty experi- enced by the least poor group (those living in "other" social units headed by non-African-Americans with high-school diplomas) is chronic poverty; the remaining 91 percent is transitory in nature.
Table 3 displays strong partial correlations between each of the three control variables and chronic poverty; the correlations with transitory poverty are weaker. In each of the four groups defined by race and type of social unit, chronic poverty is much less intense among those living in social units headed by high-school graduates than among those in social units the heads of which do not have high-school diplomas. This is partic- ularly so for families headed by females who are not African-Americans. In fact, chronic poverty among families headed by non-African-American females with high-school diplomas is about half as intense as poverty in the entire population. If the observed correlation reflects a causal rela- tionship between education and chronic poverty then the result is encour- aging from a policy perspective. On the other hand, the strong positive correlations between race and chronic poverty and type of social unit and chronic poverty are discouraging, since policy has limited potential for severing the links between poverty and race or poverty and family structure. In each of the four groups defined by education and type of social unit, chronic poverty is much more intense among those living

Table 3 Post-Transfer, Post-Tax Poverty Intensity in the 1987 U.S. Population, Decomposed by Race, Type of Social Unit, and Education of Head, Measured over Income Periods of Different Lengths Using Foster, Greer, and Thorbecke's Indexa
African-American Other Races
Female Other Female Other Headed Social Headed Social Family Unit Family Unit
T Income Period
No High School
Diploma (1)
High School
Diploma (2)
No High School
Diploma (3)
High School
Diploma (4)
No High School
Diploma (5)
High School
Diploma (6)
No High School
Diploma (7)
High School
Diploma (8)
Average-poverty intensity 1 1986 6.321
Chronic-poverty intensity 2 1985-86 7.909 5 1982-86 10.551
10 1977-86 12.393 Transitory-poverty intensity
2 1985-86 3.235 5 1982-86 3.002
10 1977-86 3.233 Proportion of poverty that is chronic
2 1985-86 0.842 5 1982-86 0.758
4.255
5.182 4.521 4.562
1.719 2.282 2.409
0.868 0.638
2.952
3.069 3.939 4.777
1.497 2.231 2.342
0.817 0.61 1
1.835
1.279 1.690 1.396
1.465 1.455 1.723
0.656 0.508
3.608
4.614 5.369 4.446
3.294 2.144 2.763
0.753 0.690
10 1977-86 0.688 0.521 0.540 0.318 0.481
1987 sample 1,020 1,177 1,605 2,011 316
Source: PSID, Family-Individual-Response File 1987. a. Computations are based on 15,088 "sample members" present in the PSID family unit in 1987.

48 The Journal of Human Resources
in social units headed by African-Americans than in other social units. Similarly, in each of the four groups defined by race and education, chronic poverty is much more intense among those living in female- headed families than in other social units.
VI. Other Measures of Chronic Poverty
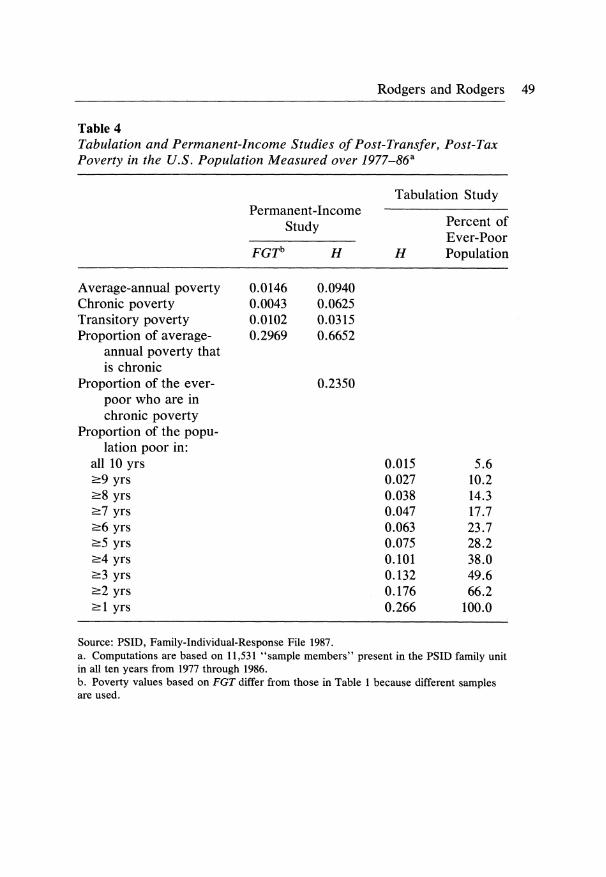
Tables 4 and 5 present the results of a tabulation study, using all "sample members" of the PSID who were present in all years 1977 through 1986. Also presented are results computed with the same data set and our permanent-income approach. Both FGT and the head- count ratio, H , are the underlying poverty indices. We do not advocate the use of H because it has few desirable properties; reluctantly, we present it here because it provides the most meaningful comparison with the tabulation study.
In the tabulation study we found that 26.6 percent of the population were poor in at least one of the ten years considered (see Table 4). The percentage of the population poor in eight or more years was 3.8 percent, while 1.5 percent were poor in all ten years. Duncan, Coe, and Hill (1984) defined persistent poverty as having income below the poverty line in eight or more years of ten years. Under this definition, the persistently poor in Table 4 are 14.3 percent of the ever-poor population.
Using the H-based permanent income approach we found that, on aver- age, the annual poverty rate was 9.4 percent between 1977 and 1986. The percentage of the population with ten-year permanent incomes below the poverty line was 6.25, considerably more than the 3.8 percent of the population persistently poor according to the tabulation approach. The tabulation study would have to define persistent poverty as "poor in six or more years" for it to equal our H-based chronic poverty measurement. H-based chronic poverty, as a percentage of average-annual poverty, was 66.52, and as a percentage of the ever-poor population was (0.062510.266 =) 23.5, both of which are much higher than the 14.3 percent of the ever-poor population who are persistently poor according to the tabula- tion approach. With our preferred method, which is based on FGT, 29.69 percent of measured poverty is chronic. This is also much higher than the tabulation study's 14.3 percent.
Poverty-intensity values are presented in Table 5. With a couple of exceptions the permanent-income study and the tabulation method give approximately the same results. The permanent-income study based on FGT estimates that people in families headed by African-American fe- males without high-school diplomas are about fourteen times as poor as the population as a whole. The estimates given by the tabulation study
Rodgers and Rodgers 49
Table 4 Tabulation and Permanent-Income Studies of Post-Transfer, Post-Tax Poverty in the U.S. Population Measured over 1977-86"
Tabulation Study Permanent-Income
Study Percent of Ever-Poor
F G T ~ H H Population
Average-annual poverty Chronic poverty Transitory poverty Proportion of average-
annual poverty that is chronic
Proportion of the ever- poor who are in chronic poverty
Proportion of the popu- lation poor in:
all 10 yrs 2 9 yrs 2 8 yrs 2 7 yrs 2 6 yrs r 5 yrs 2 4 yrs 2 3 yrs 2 2 yrs 2 1 yrs
Source: PSID, Family-Individual-Response File 1987. a. Computations are based on 11,531 "sample members" present in the PSID family unit in all ten years from 1977 through 1986. b. Poverty values based on FGT differ from those in Table 1 because different samples are used.

Table 5 Tabulation and Permanent-Income Studies of Post-Transfer, Post-Tax Poverty Intensity in the U.S. Population, Measured Over 1977-86, Decomposed by Race, Type of Social Unit, and Education of Heada
African-American Other Races
Female Other Female Other Headed Social Headed Social Family Unit Family Unit
No High High No High High No High High No High High School School School School School School School School
Diploma Diploma Diploma Diploma Diploma Diploma Diploma Diploma Methodology (1) (2) (3) (4) (5) (6) (7) (8) - --
Permanent-income study Chronic-poverty intensityb based on:
FGT 14.053 4.487 5.516 Head-count 10.204 4.159 5.566
Tabulation study Persistent-poverty intensity defined as poor in:
all 10 yrs 11.909 4.201 4.763 2 9 yrs 11.354 5.598 6.266 2 8 yrs 11.840 4.962 5.589 2 7 yrs 11.602 4.763 5.303 2 6 yrs 9.633 4.227 5.391
Sample 732 814 1,330
Source: PSID, Family-Individual-Response File 1987. a. Computations are based on 11,531 "sample members" present in the PSlD family unit in all ten years from 1977 through 1986. b. Chronic-poverty-intensity values based on FGT differ from those in Table 3 because different samples are used.

Rodgers and Rodgers 51
and the permanent-income study using H, although lower, are of the same order of magnitude. The permanent-income study found poverty among those in "other social units," with heads who are African-Americans with high-school diplomas, to be more intense than poverty in the entire population. The tabulation study, with the two most strict definitions of persistent poverty, found poverty among this group to be less intense than in the population as a whole.
VII. Summary and Conclusions
In this paper we have proposed a method of measuring chronic and transitory poverty. Our method requires longitudinal income data and can be based upon any additively decomposable index of aggre- gate poverty although we advocate the use of indices that are axiomati- cally sound such as Foster, Greer, and Thorbecke's (1984) index or Blackburn's (1989) index.
Like tabulation studies we regard chronic poverty as a state of inade- quate income during a large proportion of a given time period. Our view differs from that underlying duration studies, which regard persistent poverty as a state in which income is less than needs in many consecutive years (or months). Our method, however, differs from both tabulation and duration studies in two further respects. First, in the spirit of the theories of life-cycle consumption and savings behavior, we suppose that agents can make inter-year income transfers at realistic savings and bor- rowing rates. To the extent that inter-year income transfers do not occur (for example, because events such as marital disruption deny agents ac- cess to savings from income earned in previous years) our results under- estimate chronic poverty. Second, our measure of chronic poverty re- flects the severity as well as the incidence of poverty. We measure transitory poverty as a residual: the amount of measured poverty that disappears when inter-year income transfers occur. Our measures of chronic and transitory poverty are additively decomposable, a property which allows chronic-poverty and transitory-poverty intensity to be cal- culated for various subpopulations.
We apply our method to PSID data for the 1980s and late 1970s. Our results indicate that about 36 percent of measured poverty in the 1987 U.S. population can be regarded as chronic, a larger amount than that suggested by previous research. According to our analysis, between the late 1970s and the mid 1980s poverty not only increased, it became more chronic and less transitory in nature. For the United States as a whole, the observed increase in chronic poverty was statistically significant over this time period; the observed increase in transitory poverty was not.

52 The Journal of Human Resources
Various subpopulations, which were defined according to the type of social unit and the race and educational qualifications of the head of the social unit, were also observed between the late 1970s and the mid 1980s. People living in families headed by females without high-school diplomas, and people living in "other" social units (that is, social units other than female-headed families) headed by African-American high-school gradu- ates all experienced significant increases in chronic poverty.
Decompositions of poverty indices revealed that those segments of society that are poorest according to cross-section data are also the most chronically poor, and the intensity of their poverty is more pronounced than annual-poverty measures reveal. The poorest group identified con- sists of people living in families headed by African-American females without high-school diplomas, for whom chronic poverty is about twelve times as intense as in the entire population. Between 1977 and 1986 about 69 percent of poverty among these people was chronic, compared with about 36 percent for the population as a whole. More generally, poverty among people living in female-headed families is high and chronic, unless the woman heading the family is not an African-American and has a high-school diploma. Chronic poverty for this latter group was found to be only about half as intense as in the population as a whole. Education is negatively correlated with chronic poverty. With race and type social unit held constant, chronic poverty is much more intense among people living in social units headed by people without high-school diplomas than among those in social units headed by high-school graduates.
References
Auletta, Ken. 1982. The Underclass. New York: Random House. Bane, Mary Jo, and David Ellwood. 1986. "Slipping Into and Out of Poverty:
The Dynamics of Spells. " Journal of Human Resources 21(1): 1-23. Blackburn, McKinley L. 1989. "Poverty Measurement: An Index Related to a
Theil Measure of Inequality." Journal of Business and Economic Statistics 7(2):475-81.
Blackorby, Charles, and David Donaldson. 1980. "Ethical Indices for the Measurement of Poverty." Econometrica 48(4): 1053-60.
Coe, Richard. 1978. "Dependency and Poverty in the Short and Long Run." In Five Thousand American Families: Patterns of Economic Progress, Volume 6, ed. Greg J. Duncan and James N. Morgan, 273-96. Ann Arbor, Michigan: Institute for Social Research.
Donaldson, David, and John A. Weymark. 1986. "Properties of Fixed-Population Poverty Indices." International Economic Review 27(3):667-88.

Rodgers and Kodgers 53
Duncan, Greg J. , Richard D. Coe, and Martha S. Hill. 1984. "The Dynamics of Poverty." In Years of Poverty, Years of Plenty, ed. Greg J. Duncan, Richard D. Coe, Mary E. Corcoran, Martha S. Hill, Saul D. Hoffman, and James N. Morgan, 33-70. Ann Arbor, Michigan: Institute for Social Research.
Duncan, Greg J., and Willard Rodgers. 1991. "Has Children's Poverty Become More Persistent'?" American Sociological Revie++, 56(August):538-50.
Foster, James, Joel Greer, and Erik Thorbecke. 1984. "A Class of Decomposable Poverty Measures." Econometrica 52(3):761-66.
Gaiha, Raghav, and Anil B. Deolalikar. 1991. "Persistent, Expected and Innate Poverty: Estimates for Semi-Arid Rural South India, 1975-84." Presented at the Econometric Society's European Meetings, Cambridge, England.
Hill, Martha S. 1981. "Some Dynamic Aspects of Poverty." In Five Thousand American Families: Patterns of Economic Progress, Volume 9, ed. Martha S. Hill, Daniel H. Hill, and James N. Morgan, 93-120. Ann Arbor, Michigan: Institute for Social Research.
. 1992. The Panel Stzrdy o f Income Dynamics, A User's Guide. Newbury Park: Sage Publications.
Kakwani, Nanak. 1990. "Testing for Significance of Poverty Differences, with Application to Cote d'ivoire." LShfS Working Paper Number 62. Washington, D.C.: The World Bank.
King, Mervin. 1985. "The Economics of Savings: A Survey of Recent Contributions." In Frontiers of Economics, ed. Kenneth Arrow and Seppo Honkapohja, 227-94. Oxford, U .K.: Blackwell.
Kish, Leslie, and Martin R. Frankel. 1970. "Balanced Repeated Replications for Standard Errors." Jolirnal of the American Statisticitl Association 65(331): 1071-94.
Levy, Frank. 1977. "How Big is the American Underclass?" Working Paper 0090-1. Washington, D.C.: Urban Institute.
Mayer, Susan, and Christopher Jencks. 1989. "Poverty and the Distribution of Material Hardship." Jozlrnal of Human Resources 24(1):88-113.
Minarik. Joseph. 1975. "The Evidence on the Poverty Count." In the American Statistical Association, Proceedings of the Social Statistics Section, 544-59.
Plackett, R. L., and P. J. Burman. 1946. "The Design of Optimal Multifactorial Experiments." Biometrika 33 Part IV(June):305-25.
Rainwater, Lee. 1981. "Persistent and Transitory Poverty: A New Look." Working Paper No. 70. Joint Center for Urban Studies of the Massachusetts Institute of Technology and Harvard University. Cambridge: MIT, Harvard.
Rodgers, John L., and Joan R. Rodgers. 1991. "Measuring the Intensity of Poverty Among Subpopulations, Applications to the United States." Jolrrnal of Human Resolrrces 26(2):338-61.
Ruggles, Patricia, and Roberton Williams. 1989. "Longitudinal Measures of Poverty: Accounting for Income and Assets over Time." Review of Income and Wealth 35(3):225-43.
Sen, Amartya. 1976. "Poverty: An Ordinal Approach to Measurement." Econometrica 44(2): 219-32.

54 The Journal of Human Resources
Slesnick, Daniel T. 1992. "Gaining Ground: Poverty in the Postwar United States." Working Paper, University of Texas-Austin, Texas.
Survey Research Center. 1987. User Guide to the Panel Study of Income Dynamics. Ann Arbor. Inter-university Consortium for Political and Social Research, The University of Michigan.
U.S. Department of Commerce, Bureau of the Census. 1990. "Money Income and Poverty Status in the United States: 1989." Current Population Reports, Consumer Income, Series P-60, No. 168.
Wilson, William J . 1987. The Truly Disadvantaged. Chicago: University of Chicago Press.

You have printed the following article:
Chronic Poverty in the United StatesJoan R. Rodgers; John L. RodgersThe Journal of Human Resources, Vol. 28, No. 1. (Winter, 1993), pp. 25-54.Stable URL:
http://links.jstor.org/sici?sici=0022-166X%28199324%2928%3A1%3C25%3ACPITUS%3E2.0.CO%3B2-F
This article references the following linked citations. If you are trying to access articles from anoff-campus location, you may be required to first logon via your library web site to access JSTOR. Pleasevisit your library's website or contact a librarian to learn about options for remote access to JSTOR.
[Footnotes]
2 Slipping into and out of Poverty: The Dynamics of SpellsMary Jo Bane; David T. EllwoodThe Journal of Human Resources, Vol. 21, No. 1. (Winter, 1986), pp. 1-23.Stable URL:
http://links.jstor.org/sici?sici=0022-166X%28198624%2921%3A1%3C1%3ASIAOOP%3E2.0.CO%3B2-S
4 A Class of Decomposable Poverty MeasuresJames Foster; Joel Greer; Erik ThorbeckeEconometrica, Vol. 52, No. 3. (May, 1984), pp. 761-766.Stable URL:
http://links.jstor.org/sici?sici=0012-9682%28198405%2952%3A3%3C761%3AACODPM%3E2.0.CO%3B2-O
5 Has Children's Poverty Become More Persistent?Greg J. Duncan; Willard RodgersAmerican Sociological Review, Vol. 56, No. 4. (Aug., 1991), pp. 538-550.Stable URL:
http://links.jstor.org/sici?sici=0003-1224%28199108%2956%3A4%3C538%3AHCPBMP%3E2.0.CO%3B2-J
7 Poverty Measurement: An Index Related to a Theil Measure of InequalityMcKinley L. BlackburnJournal of Business & Economic Statistics, Vol. 7, No. 4. (Oct., 1989), pp. 475-481.Stable URL:
http://links.jstor.org/sici?sici=0735-0015%28198910%297%3A4%3C475%3APMAIRT%3E2.0.CO%3B2-6
http://www.jstor.org
LINKED CITATIONS- Page 1 of 5 -
NOTE: The reference numbering from the original has been maintained in this citation list.

7 Properties of Fixed-Population Poverty IndicesDavid Donaldson; John A. WeymarkInternational Economic Review, Vol. 27, No. 3. (Oct., 1986), pp. 667-688.Stable URL:
http://links.jstor.org/sici?sici=0020-6598%28198610%2927%3A3%3C667%3APOFPI%3E2.0.CO%3B2-R
7 Poverty Measurement: An Index Related to a Theil Measure of InequalityMcKinley L. BlackburnJournal of Business & Economic Statistics, Vol. 7, No. 4. (Oct., 1989), pp. 475-481.Stable URL:
http://links.jstor.org/sici?sici=0735-0015%28198910%297%3A4%3C475%3APMAIRT%3E2.0.CO%3B2-6
7 Measuring the Intensity of Poverty among Subpopulations: Applications to the United StatesJohn L. Rodgers; Joan R. RodgersThe Journal of Human Resources, Vol. 26, No. 2. (Spring, 1991), pp. 338-361.Stable URL:
http://links.jstor.org/sici?sici=0022-166X%28199121%2926%3A2%3C338%3AMTIOPA%3E2.0.CO%3B2-Z
10 Ethical Indices for the Measurement of PovertyCharles Blackorby; David DonaldsonEconometrica, Vol. 48, No. 4. (May, 1980), pp. 1053-1060.Stable URL:
http://links.jstor.org/sici?sici=0012-9682%28198005%2948%3A4%3C1053%3AEIFTMO%3E2.0.CO%3B2-M
10 Measuring the Intensity of Poverty among Subpopulations: Applications to the United StatesJohn L. Rodgers; Joan R. RodgersThe Journal of Human Resources, Vol. 26, No. 2. (Spring, 1991), pp. 338-361.Stable URL:
http://links.jstor.org/sici?sici=0022-166X%28199121%2926%3A2%3C338%3AMTIOPA%3E2.0.CO%3B2-Z
16 Slipping into and out of Poverty: The Dynamics of SpellsMary Jo Bane; David T. EllwoodThe Journal of Human Resources, Vol. 21, No. 1. (Winter, 1986), pp. 1-23.Stable URL:
http://links.jstor.org/sici?sici=0022-166X%28198624%2921%3A1%3C1%3ASIAOOP%3E2.0.CO%3B2-S
http://www.jstor.org
LINKED CITATIONS- Page 2 of 5 -
NOTE: The reference numbering from the original has been maintained in this citation list.

22 Balanced Repeated Replications for Standard ErrorsLeslie Kish; Martin R. FrankelJournal of the American Statistical Association, Vol. 65, No. 331. (Sep., 1970), pp. 1071-1094.Stable URL:
http://links.jstor.org/sici?sici=0162-1459%28197009%2965%3A331%3C1071%3ABRRFSE%3E2.0.CO%3B2-V
22 The Design of Optimum Multifactorial ExperimentsR. L. Plackett; J. P. BurmanBiometrika, Vol. 33, No. 4. (Jun., 1946), pp. 305-325.Stable URL:
http://links.jstor.org/sici?sici=0006-3444%28194606%2933%3A4%3C305%3ATDOOME%3E2.0.CO%3B2-W
References
Slipping into and out of Poverty: The Dynamics of SpellsMary Jo Bane; David T. EllwoodThe Journal of Human Resources, Vol. 21, No. 1. (Winter, 1986), pp. 1-23.Stable URL:
http://links.jstor.org/sici?sici=0022-166X%28198624%2921%3A1%3C1%3ASIAOOP%3E2.0.CO%3B2-S
Poverty Measurement: An Index Related to a Theil Measure of InequalityMcKinley L. BlackburnJournal of Business & Economic Statistics, Vol. 7, No. 4. (Oct., 1989), pp. 475-481.Stable URL:
http://links.jstor.org/sici?sici=0735-0015%28198910%297%3A4%3C475%3APMAIRT%3E2.0.CO%3B2-6
Ethical Indices for the Measurement of PovertyCharles Blackorby; David DonaldsonEconometrica, Vol. 48, No. 4. (May, 1980), pp. 1053-1060.Stable URL:
http://links.jstor.org/sici?sici=0012-9682%28198005%2948%3A4%3C1053%3AEIFTMO%3E2.0.CO%3B2-M
http://www.jstor.org
LINKED CITATIONS- Page 3 of 5 -
NOTE: The reference numbering from the original has been maintained in this citation list.

Properties of Fixed-Population Poverty IndicesDavid Donaldson; John A. WeymarkInternational Economic Review, Vol. 27, No. 3. (Oct., 1986), pp. 667-688.Stable URL:
http://links.jstor.org/sici?sici=0020-6598%28198610%2927%3A3%3C667%3APOFPI%3E2.0.CO%3B2-R
Has Children's Poverty Become More Persistent?Greg J. Duncan; Willard RodgersAmerican Sociological Review, Vol. 56, No. 4. (Aug., 1991), pp. 538-550.Stable URL:
http://links.jstor.org/sici?sici=0003-1224%28199108%2956%3A4%3C538%3AHCPBMP%3E2.0.CO%3B2-J
A Class of Decomposable Poverty MeasuresJames Foster; Joel Greer; Erik ThorbeckeEconometrica, Vol. 52, No. 3. (May, 1984), pp. 761-766.Stable URL:
http://links.jstor.org/sici?sici=0012-9682%28198405%2952%3A3%3C761%3AACODPM%3E2.0.CO%3B2-O
Balanced Repeated Replications for Standard ErrorsLeslie Kish; Martin R. FrankelJournal of the American Statistical Association, Vol. 65, No. 331. (Sep., 1970), pp. 1071-1094.Stable URL:
http://links.jstor.org/sici?sici=0162-1459%28197009%2965%3A331%3C1071%3ABRRFSE%3E2.0.CO%3B2-V
Poverty and the Distribution of Material HardshipSusan E. Mayer; Christopher JencksThe Journal of Human Resources, Vol. 24, No. 1. (Winter, 1989), pp. 88-114.Stable URL:
http://links.jstor.org/sici?sici=0022-166X%28198924%2924%3A1%3C88%3APATDOM%3E2.0.CO%3B2-M
The Design of Optimum Multifactorial ExperimentsR. L. Plackett; J. P. BurmanBiometrika, Vol. 33, No. 4. (Jun., 1946), pp. 305-325.Stable URL:
http://links.jstor.org/sici?sici=0006-3444%28194606%2933%3A4%3C305%3ATDOOME%3E2.0.CO%3B2-W
http://www.jstor.org
LINKED CITATIONS- Page 4 of 5 -
NOTE: The reference numbering from the original has been maintained in this citation list.

Measuring the Intensity of Poverty among Subpopulations: Applications to the United StatesJohn L. Rodgers; Joan R. RodgersThe Journal of Human Resources, Vol. 26, No. 2. (Spring, 1991), pp. 338-361.Stable URL:
http://links.jstor.org/sici?sici=0022-166X%28199121%2926%3A2%3C338%3AMTIOPA%3E2.0.CO%3B2-Z
Poverty: An Ordinal Approach to MeasurementAmartya SenEconometrica, Vol. 44, No. 2. (Mar., 1976), pp. 219-231.Stable URL:
http://links.jstor.org/sici?sici=0012-9682%28197603%2944%3A2%3C219%3APAOATM%3E2.0.CO%3B2-Z
http://www.jstor.org
LINKED CITATIONS- Page 5 of 5 -
NOTE: The reference numbering from the original has been maintained in this citation list.