church and state an economic analysis - boston university · church and state: an economic analysis...
TRANSCRIPT
CHURCH AND STATE: AN ECONOMIC ANALYSIS
Boston University School of Law Working Paper No. 08-24
Keith N. Hylton Yulia Rodionova
Fei Deng
This paper can be downloaded without charge at:
http://www.bu.edu/law/faculty/scholarship/workingpapers/2008.html
The Social Science Research Network Electronic Paper Collection:
http://ssrn.com/abstract_id=1156433

1
Church and State: An Economic Analysis
Keith N. Hylton∗
Yulia Rodionova**
Fei Deng***
(May 2008)
Abstract: What purpose is served by a government’s protection of religious liberty? Many have been suggested, the most prominent of which center on the protection of freedom of belief and expression. However, since every regulation potentially interferes with religious freedom, it is useful to consider more concrete purposes that could suggest limits on the degree to which religious liberty should be protected. This paper focuses on the concrete economic consequences of state regulation of religion. We examine the effects of state regulation on corruption, economic growth, and inequality. The results suggest that laws and practices burdening religion enhance corruption. Laws burdening religion reduce economic growth and are positively associated with inequality. Keywords: regulation of religion, economics of religion, corruption, inequality JEL Classification: D3, D73, H41, K0, N4, Z12
∗ Professor of Law, Boston University, [email protected]. ** UCL SSEES. *** NERA Economic Consulting. For helpful comments, we thank Randolph Bruno, Richard Craswell, Richard Epstein, Bill Marshall, Steve Marks, Alexander Muravyev, Mitch Polinsky, Andrei Shleifer and workshop participants at Boston University Law School, University of Michigan Law School, Stanford Law School, and University of Maine Law School. The authors are responsible for remaining errors and omissions.
2
I. Introduction
What purpose is served by a government’s protection of religious liberty, such as that observed in the United States Constitution? Many have been suggested, the most prominent of which center on the protection of freedom of belief and expression. While it is clear that the guarantee of religious freedom does serve these purposes, they are such demanding goals that they could put an end to virtually all regulation. Every regulation potentially interferes with religious freedom – e.g., a requirement to pay taxes interferes with someone’s belief that the payment of tax is a sin.1 In light of this, it is useful to consider more concrete purposes that could suggest limits on the degree to which religious liberty should be protected.2
This paper focuses on the concrete economic consequences of state regulation of religion. Specifically, we examine the effects of state regulation on corruption, growth, and inequality. The results suggest that laws and practices burdening religion enhance corruption. Laws and practices subsidizing religion, however, do not appear to enhance corruption. Laws burdening religion reduce economic growth. Laws subsidizing religion and practices either burdening or subsidizing religion do not appear to affect growth. Laws burdening religion are positively associated with inequality. Practices burdening religion and laws subsidizing religion appear to have no significant impact on inequality. There is weak evidence that practices subsidizing religion may reduce inequality.
These results have several implications. First, the positive association between corruption and laws burdening religion provides empirical confirmation of one part of Adam Smith’s analysis of religions in The Wealth of Nations. Under Smith’s analysis, state regulation of religion would produce corruption as rulers sought to tax and prohibit churches that failed to support them. The finding that laws burdening religion harm economic growth suggests that the corruptive effect is economically significant. Lastly, while the inequality findings are inconsistent with a Marxian view of state religious regulation, they are not inconsistent with the rent-seeking theory.
As we explain below, Smith’s corruption analysis was largely repeated in a pamphlet by James Madison that has become one of the key writings used to understand the purpose of the United States Constitution’s protection of religious liberty. The empirical results in this paper provide support to Madison’s theory of the purpose of a state guarantee of religious liberty. This view is more limited than the “freedom of expression” theory that has dominated public discourse. Examining the theory and evidence behind the corruption argument suggests a clearer picture of the precise limits on government regulation suggested by Smith and probably intended by Madison. It also
1 Friedman (1962, p.8-9) recounts the case of the Amish sect that refused on religious principle to pay for or accept social security benefits. 2 McConnell and Posner (1989), at 6, also take as a starting point of their analysis the notion that every law could potentially interfere with religious freedom. However, their approach is to use economics to constrain the definition of interference, and much of the non-economic literature has tried to use some theory to constrain the notion of interference. Our approach is different; we make no effort here to constrain the notion of interference.

3
has implications for current policy issues, such as school vouchers and the subsidization of religious institutions. II. The Policy Debate in America
The optimal relationship between the state and religion has been a controversial issue in the United States since its birth. The U.S. Constitution contains a guarantee of religious liberty in the First Amendment:
Congress shall make no law respecting an establishment of religion, or prohibiting the free exercise thereof; or abridging the freedom of speech, or of the press; or the right of the people peaceably to assemble, and to petition the government for a redress of grievances.
The dominant views of the original purpose of the First Amendment have been
attributed to James Madison and Thomas Jefferson. Madison’s views were set out in his open letter titled “Memorial and Remonstrance Against Religious Assessments, 1785.”3 The letter was published in opposition to a bill before the Virginia colonial legislature that would have required citizens to pay a tax to support Christian sects in Virginia.
Madison saw the bill as a breach of the “great Barrier which defends the rights of the people,”4 by forcing citizens to contribute money to churches that they might not otherwise wish to support. The negative consequences Madison identified were harm to the state and harm to the subsidized churches. The state would be harmed because the expanded governmental authority recognized by the bill would eventually be abused. In addition, the subsidized churches would use their newfound influence and power, fed through forced contributions, to seek further restrictions on the liberty of citizens.
Religion would be harmed, according to Madison, because the subsidized churches would become unresponsive to the needs of congregants, secure in the knowledge that their funding would be guaranteed by government’s strong hand. Madison noted that the historical experience of ecclesiastical establishments had been “pride and indolence in the Clergy; ignorance and servility in the laity; in both, superstition, bigotry, and persecution.”5
Although Jefferson was the author of a bill establishing religious freedom (enacted in the wake of the defeat of the subsidization bill attacked by Madison), he never took the time to carefully set out his views on the proper relation between church and state. The most important statement from Jefferson comes from a letter he wrote to the Danbury Baptist Association in 1802. In the letter, Jefferson referred to the First Amendment as “building a wall of separation between Church and State.”6
3 See Padover (1953), at 299-306. 4 Id. at 300. 5 Padover (1953), at 302. 6 Letter from Thomas Jefferson to Danbury Baptist Association (January 1, 1802), in Lipscomb and Bergh (1903), at 281-282.

4
Jefferson’s wall metaphor seems to paraphrase Madison’s reference to the “Great
Barrier” in his Memorial and Remonstrance. However, the two metaphors represent very different images. Madison never referred to a barrier between church and state; he argued that the Virginia church subsidization bill breached a hypothetical barrier between government’s power and individual rights. Madison’s concern was that the subsidization bill authorized the Virginia colonial government to assume powers that would have been equally threatening to individual rights even if the bill had nothing to do with religion. Religion, being more central to personality and important as a motivator of action than other belief systems, simply made the potential harm greater and more probable.
These two notions of the First Amendment’s purpose; one of a rigid barrier preventing the state from doing anything that substantially affects religion, and the other of a more ambiguous set of constraints designed to avoid specific harms likely to result from government taxation, subsidization, or regulation of religion; summarize the opposing views that have influenced courts and legislatures over the years. Modern first amendment case law largely reflects the more restrictive view of Jefferson. However, the Supreme Court’s school voucher case, Zelman v. Simmons-Harris,7 represents a shift toward Madison’s view with its conclusion that taxpayer-financed vouchers could be given to students attending religious schools without violating the First Amendment.
In spite of the success of the view attributed to Jefferson, Madison’s argument remains the most careful explanation of the First Amendment’s purpose by one of its framers. However, Madison’s letter was not designed as a policy analysis, and contains arguments that would be considered inappropriate for policy analysis today (e.g., on the validity of Christian beliefs). And Madison was not writing on a clean slate. The economics of religion had been explored in Adam Smith’s The Wealth of Nations, published eight years before Madison’s letter. Madison’s argument appears to be based on Smith. In order to explore the policy basis for a rule protecting religious freedom (i.e., restricting government regulation of religion), we look directly at the economic literature next. III. Economics of Religion
There earliest economic treatments of religion were by Adam Smith and Karl Marx. The Marxian treatment of religion is better known. However, if James Madison’s views had been shaped in part by reading Smith, which is plausible given the publication date of The Wealth of Nations, Smith’s treatment would have to be regarded as far more influential. A. From Adam Smith to the Modern Literature
As we noted before, a large part of Smith’s analysis is described in Madison’s Memorial and Remonstrance, though in summary form. Smith treated religions as if they were firms selling a product to customers. Entry of new religious firms would occur in 7 536 U.S. 639 (2002).

5
order to meet consumer demand. The creation of monopoly power through government licensing, or the establishment of a state religion, would diminish the religious seller’s effort to meet consumer tastes. Over time, the clergy of a state-supported church would become distant from the concerns of the church members. State support creates a lazy monopoly (Seidler, 1979; Hirschman, 1971). Smith described that as the experience of state-supported churches.
A competitive market in religions would allow new churches to continually enter in order to meet the needs of customers. The threat of new churches entering would force established churches to remain in touch with the desires of their members and to charge competitive prices for religious services.
More provocatively, Smith argued that a competitive market in religions would reduce religious-based strife.
The interested and active zeal of religious teachers can be dangerous and troublesome only where there is, either but one sect tolerated in society, or where the whole of society is divided into two or three great sects… But that zeal must be altogether innocent where the society is divided into two or three hundred, or perhaps into as many thousand small sects, of which no one could be considerable enough to disturb publick tranquility. The teachers of each sect, seeing themselves surrounded on all sides with more adversaries than friends, would be obliged to learn that candour and moderation which is so seldom to be found among the teachers of those great sects, whose tenets being supported by the civil magistrate, are held in veneration by almost all the inhabitants of extensive kingdoms and empires,…(Smith, p. 793)
Smith envisioned competition among sects eventually yielding a “pure and rational religion,” free from absurdity and fanaticism. Thus, the threat of losing members to new religions would make religious teachers more tolerant of other religions and produce better religious doctrine.
Since the mid-1970s, the economics literature has begun to explore religion – 200 years after Smith’s book. The literature has focused on four topics: the industrial organization of religions, control of free-riders, human capital and time allocation, and, more recently, the effects of religion on economic growth (Barro and McCleary, 2003). The first topic, industrial organization, follows Smith’s earlier contributions with empirical studies largely confirming his predictions (e.g., monopoly religions effects, religious diversity and attachment) (Iannacone, 1991; 1998). The free-rider studies find, predictably, that the more demanding churches, requiring relatively greater sacrifices, are associated with higher levels of participation and support from members (Iannacone, 1992; 1998). The human capital and time allocation studies go beyond Smith’s examination by generating and testing predictions regarding the timing and extent of religious activity (Azzi and Ehrenberg, 1975). The most recent contribution is the growth

6
literature finding that religious belief is positively associated with economic growth (Barro and McCleary, 2003).
The new literature on the economics of religion has only recently begun to address two important parts of Smith’s analysis. One is Smith’s description of religion as largely a rational response to real consumer needs,8 rather than arbitrary preferences. Smith suggests that religions, particularly new entrants, were social institutions that arose in response to social problems.9 The smaller sects that developed in cities were collusive societies that monitored and punished members for engaging in conduct, such as excessive alcohol consumption, that might bring short run benefits in exchange for long term ruin. The rise of Muslim sects in American inner cities reflects this tendency of religions to spring up in response to social problems on the ground. The Muslims are known in cities for an aggressive anti-drug, anti-crime, and anti-welfare program. The Muslim program was adopted in the apparent belief that drug use, crime, and welfare dependency were the key social problems in the cities – problems that were being addressed by few other social institutions. B. State Intervention in Religion and Corruption
The other major topic addressed by Smith but so far not adequately addressed in the new economics of religion literature is the connection between state regulation of religion and corruption. This takes us back to James Madison’s remarks (though Madison had probably read Smith). State regulation of religion has a corrupting effect on religion and on the state.
It is easy to see why a religious institution would prefer to gain some degree of power within the government. A religious institution could benefit from taking advantage of the state’s power to tax and regulate rival institutions and to transfer subsidies in its direction. A religion could use the state’s regulatory power to block the entry of new religions and to ban competing ones. The state could require citizens to support the established church (or churches) through their taxes.
8 Berman (2003) provides the clearest example of recent work viewing religion as a response to consumer needs. Berman explains radical religious groups as emerging in response to government’s failure to provide local public goods. Ekelund, Hebert, and Tollison (2002) provide another recent example. They argue that the monopolistic practices of the Roman Catholic Church put members at the margin of defection, making Protestant entry easier. Theirs is a story of monopoly rent extraction driving consumers to a rival firm. I consider this distinguishable from Smith’s argument that detachment from the interests of members invited entry from rival churches willing to meet those preferences. 9“A man of rank and fortune is by his station the distinguished member of a great society, who attend to every part of his conduct,… A man of low condition, on the contrary, is far from being a distinguished member of any great society. While he remains in the country village his conduct may be attended to, and he may be obliged to attend to it himself. In this situation, and in this situation only, he may have what is called a character to lose. But as soon as he comes into a great city, he is sunk in obscurity and darkness. His conduct is observed and attended to by nobody, and he is therefore very likely to neglect it himself, and to abandon himself to every sort of low profligacy and vice. He never emerges so effectually from this obscurity, his conduct never excites so much the attention of any respectable society, as by his becoming the member of a small religious sect.” (Smith, p.795).

7
Taxing and regulating rival religious institutions, for no other reason than to limit their growth, is costly for society. This regulatory policy reduces the size and scope of the religious market, reducing societal wealth in the same way that taxation of a market in any other item would. Moreover, this policy creates interest groups, specifically the recipients of the taxes and the favored religious institutions, that have incentives to lobby for its maintenance.
Subsidization of a favored religious institution, again for no reason other than to increase its status relative to others, is also inefficient. On the other hand, there is a countervailing argument. One could view subsidization as a strong response to the free rider problem. Forcing citizens to support the established church prevents people from free riding on the religious investments of others (Iannacone, 1992), and to that extent corrects a potential market failure. The finding in Barro and McCleary (2003) of a positive relationship between the state’s promotion of religion and adherence to religious beliefs, itself a factor contributing to economic growth, provides some evidence for this view. However, the historical experience discussed by Smith (p, 788-794) suggests that the overall effect of subsidizing religion is harmful to welfare.
The state, on the other hand, has self-interested reasons to prefer some degree of control over religion, especially where there is an established church. The key reason is self protection. Smith notes that a ruler who goes against the established church, that is not dependent upon him, is unlikely to last long. The clergy will “proscribe him as a profane person, and “employ all the terrors of religion in order to oblige the people to transfer their allegiance to some more orthodox and obedient prince.” (Smith, p. 797) Given the risk of having a large church seeking to oust him, the ruler is better off trying to purchase its allegiance by offering benefits from the state.
The benefits the ruler is likely to offer the favored church are those that are most beneficial to the church and at the same time least costly to the ruler. The church wants subsidies from the state; prohibition and taxation of rival churches. The ruler prefers to give benefits that either enhance or do the least damage to his ability to stay in power. The most severe taxes and regulations, therefore, will be imposed on religious groups that oppose or threaten to oppose the ruler.10
Once this plan of church-state relations is put into effect, there are few limits on
the degree to which governmental processes can be corrupted. If we view corruption generally as the diversion of government offices and functions to benefit private parties, there are many ways in which the type of state intervention described above could generate corruption. The most obvious is the distortion of laws and law enforcement to benefit favored religious groups or to burden disfavored ones. These substantial distortions generate wealth transfers from disfavored to favored religions. Less obvious are the many retail level opportunities for bribe collection given to enforcement authorities with discretion to enforce religious prohibitions.
10 Communist regimes that prohibit or heavily regulate all religions fit this description, if we treat communism as equivalent to a state-sanctioned religion.
8
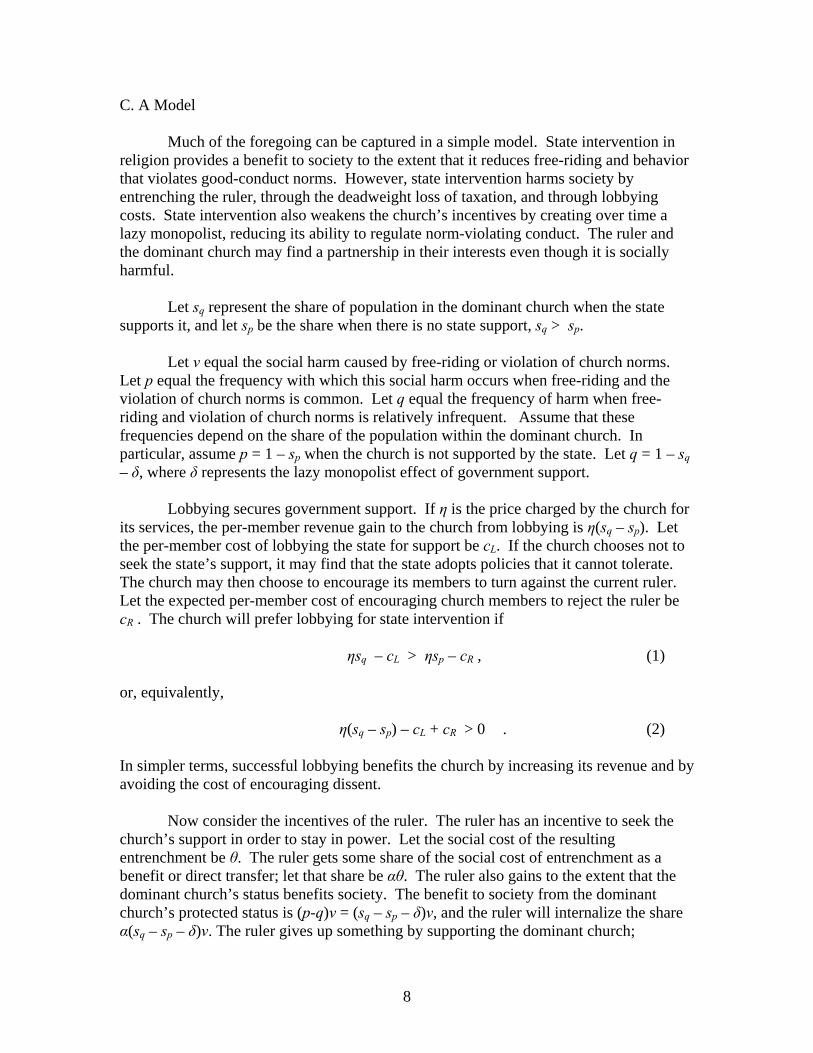
C. A Model
Much of the foregoing can be captured in a simple model. State intervention in religion provides a benefit to society to the extent that it reduces free-riding and behavior that violates good-conduct norms. However, state intervention harms society by entrenching the ruler, through the deadweight loss of taxation, and through lobbying costs. State intervention also weakens the church’s incentives by creating over time a lazy monopolist, reducing its ability to regulate norm-violating conduct. The ruler and the dominant church may find a partnership in their interests even though it is socially harmful.
Let sq represent the share of population in the dominant church when the state supports it, and let sp be the share when there is no state support, sq > sp.
Let v equal the social harm caused by free-riding or violation of church norms.
Let p equal the frequency with which this social harm occurs when free-riding and the violation of church norms is common. Let q equal the frequency of harm when free-riding and violation of church norms is relatively infrequent. Assume that these frequencies depend on the share of the population within the dominant church. In particular, assume p = 1 – sp when the church is not supported by the state. Let q = 1 – sq – δ, where δ represents the lazy monopolist effect of government support.
Lobbying secures government support. If η is the price charged by the church for
its services, the per-member revenue gain to the church from lobbying is η(sq – sp). Let the per-member cost of lobbying the state for support be cL. If the church chooses not to seek the state’s support, it may find that the state adopts policies that it cannot tolerate. The church may then choose to encourage its members to turn against the current ruler. Let the expected per-member cost of encouraging church members to reject the ruler be cR . The church will prefer lobbying for state intervention if
ηsq – cL > ηsp – cR , (1) or, equivalently,
η(sq – sp) – cL + cR > 0 . (2) In simpler terms, successful lobbying benefits the church by increasing its revenue and by avoiding the cost of encouraging dissent.
Now consider the incentives of the ruler. The ruler has an incentive to seek the church’s support in order to stay in power. Let the social cost of the resulting entrenchment be θ. The ruler gets some share of the social cost of entrenchment as a benefit or direct transfer; let that share be αθ. The ruler also gains to the extent that the dominant church’s status benefits society. The benefit to society from the dominant church’s protected status is (p-q)v = (sq – sp – δ)v, and the ruler will internalize the share α(sq – sp – δ)v. The ruler gives up something by supporting the dominant church;
9
specifically, the freedom to choose the best policies from his perspective. Let the cost of these restrictions be a simple linear function of the lobbying investment of the church: ρLcL. On the other hand, if the ruler does not support the dominant church, he runs the risk of having the church turn against him. Let that cost be a simple linear function of the church’s investment in revolt: ρRcR. The ruler will prefer to join forces with the church if α[θ + (sq – sp – δ)v] – ρLcL > – ρRcR . (2)
Finally, consider the social welfare condition. Let the social costs of the church’s different lobbying strategies (for support or revolt) be given by βLcL and βRcR. The social cost when there is no intervention (free-riding is common) is simply pv + βRcR. The social cost when there is intervention is qv + βLcL + τ + θ, where τ is the deadweight loss of taxation. State intervention to support the dominant church is socially desirable if the gains from preventing free-riding and norm violations exceed the social costs of lobbying, government entrenchment, and the deadweight loss of taxation, i.e.,
(sq – sp)v > βLcL – βRcR + τ + θ + δv . (3)
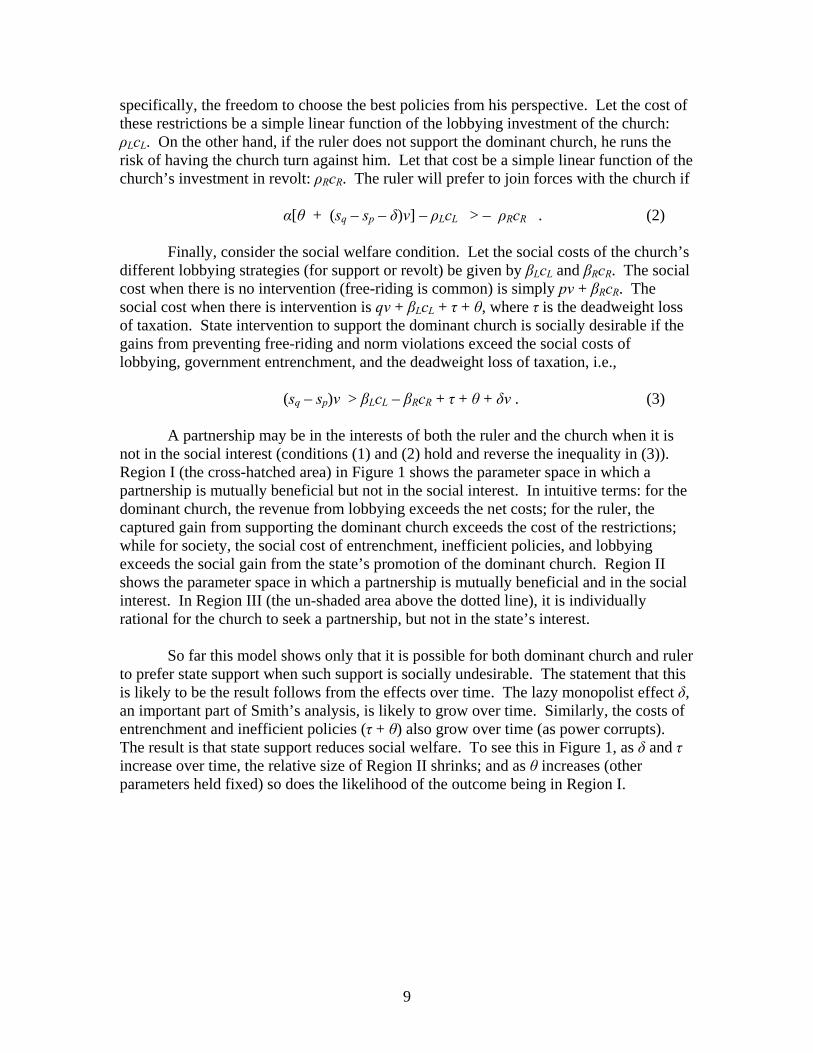
A partnership may be in the interests of both the ruler and the church when it is not in the social interest (conditions (1) and (2) hold and reverse the inequality in (3)). Region I (the cross-hatched area) in Figure 1 shows the parameter space in which a partnership is mutually beneficial but not in the social interest. In intuitive terms: for the dominant church, the revenue from lobbying exceeds the net costs; for the ruler, the captured gain from supporting the dominant church exceeds the cost of the restrictions; while for society, the social cost of entrenchment, inefficient policies, and lobbying exceeds the social gain from the state’s promotion of the dominant church. Region II shows the parameter space in which a partnership is mutually beneficial and in the social interest. In Region III (the un-shaded area above the dotted line), it is individually rational for the church to seek a partnership, but not in the state’s interest.
So far this model shows only that it is possible for both dominant church and ruler
to prefer state support when such support is socially undesirable. The statement that this is likely to be the result follows from the effects over time. The lazy monopolist effect δ, an important part of Smith’s analysis, is likely to grow over time. Similarly, the costs of entrenchment and inefficient policies (τ + θ) also grow over time (as power corrupts). The result is that state support reduces social welfare. To see this in Figure 1, as δ and τ increase over time, the relative size of Region II shrinks; and as θ increases (other parameters held fixed) so does the likelihood of the outcome being in Region I.

Region II
Region III
Region I
sq - sp =cL - cR
η
sq - sp
θ
sq - sp =
+ δ θβLcL - βRcR + τ
v v+
sq - sp =
+ δ
θρLcL - ρRcR
αv v-
Figure 1
10

11
One may well ask what is special about religion. Any corporation would prefer to
have a relationship with the state in which it received state subsidies and its rivals were taxed. Religion, however, holds a power over the thoughts and actions of ordinary people that is rarely seen among private corporations. Under the secularization thesis often attributed to Hume, this power would eventually wane as the public’s level of education in science increased. However, the evidence does not show that religious attachment has faded over time (Iannoccone, 1998).
Most modern religions, rather than being simply the byproducts of earlier superstitions, take rules that are clearly desirable (e.g., do not kill) and anchor them within a set of beliefs that are supposed to be accepted without question. Man’s ability to hold on to such beliefs, often irrationally, presumably conferred an evolutionary advantage (Wilson, 2002). This ability is unlikely to fade over time, as the secularization thesis predicts, unless natural selection pressures make it a disadvantage. The special feature of religion, in comparison to any other social institution, may be its ability to take advantage of the human capacity to commit to an abstract principle, in spite of the evidence against it.
As we noted earlier, in addition to Smith, the other early economic treatment of religion is that of Marx. Under the Marxian view, religion is a tool that the capitalist state uses in order to keep the mass of laborers in their exploited conditions without questioning society’s design.
To sum up, there are two general economic approaches to religion, a rent-seeking model and an efficiency model. The rent-seeking approach includes the work of Adam Smith and that of Karl Marx, though their theories and implications differ. The efficiency approach is reflected in the literature stressing religion’s role (and the state’s supportive role) as a solution to the public goods problem. IV. Data and Hypotheses
Our goal is to examine the empirical evidence for the Smithian (Madisonian), Marxian, and efficiency views of the state regulation of religion. Specifically, we examine the effect of the state’s regulation of religion on corruption, economic growth, and inequality. The state’s regulatory practices are summarized by a set of variables measuring the state’s efforts to subsidize or burden (regulate) religious institutions and practices. In the remainder of this paper, we examine the effect of each of the regulatory variables on corruption, growth, and inequality. The primary variables used in this analysis are described in Table 1.
In this part, we set out our predictions regarding the effects of the explanatory variables in Table 1a on corruption, economic growth and inequality. We will focus below on the predicted effects of our “church and state” variables: Staterelcons, Lawburdenrel, Lawbenrel, Practburdenrel, and Practbenrel.

12
Table 1b shows correlations among most of the independent variables of Table
1a. Of the factors correlated with the presence of laws benefiting religion only one stands out: common-law countries are less likely than others to enact laws that benefit religion. Of the factors correlated with the presence of laws burdening religion, several stand out. First, governments that have laws that burden religion also adopt practices that burden religion. Second, Catholic countries and democracies do not enact laws that burden religion. Third, Muslim countries tend to adopt laws that burden religion. Fourth, countries with a socialist legal tradition tend to adopt laws that burden religion. Of the factors correlated with government practices that burden religion, two stand out. Catholic countries do not adopt practices that burden religion, while Muslim countries do. A. Corruption
The corruption measure we use is the 2001 Corruption Perceptions Index, compiled by Transparency International. The index measures perceptions of the degree of corruption among public officials, based on surveys of business people and analysts. The index ranges from 10 (least corrupt) to 1 (most corrupt) for 93 countries in our sample. Since lower levels of corruption are associated with higher numbers in the index, all variables that enhance corruption will have a negative sign in the corruption regressions. Similarly, all variables that reduce corruption will have a positive sign in the corruption regression.
1. “Church-State Intervention” Variables
The rent-seeking theory emphasized in this paper implies a positive relationship (negative regression coefficient) between corruption and the existence of an official religion named in the state’s constitution (Staterelcons). The reason is that the official church would use its special status to gain advantages relative to other religions, and to compel support from the public (e.g., blocking entry of rivals). To the extent that the favored religion is that of a particular subpopulation, which could be defined by ethnic or racial as well as religious ties, that group could effectively use the special relationship between the state and the official church to expropriate wealth from other subpopulations. These arguments suggest that the existence of an official religion should be positively associated with corruption.
There is an alternative view of the effect of a state religion suggested in the free-riding literature (e.g., Iannacone, 1992) and in the work of Barro and McCleary (2003, 2005). To the extent that an official religion is subsidized, it promotes religious attachment and belief by making it less costly. To the extent these characteristics reduce corruption,11 we should expect a negative relationship between the existence of an official religion and corruption.
11 Guiso, Sapienza, and Zingales (2002) find that religious beliefs are associated with “good” economic attitudes, in the sense of being conducive to higher income and growth.
13
These arguments imply that the existence of an official religion has opposing effects on the level of corruption. There is a positive (corruption-enhancing) effect suggested in this paper’s framework, which leads to more corruption all else the same. There is also a corruption-reducing effect through the subsidization of religious attachment. All of this implies that the sign of our state religion variable (Staterelcons) is ambiguous a priori. The regression results will reveal which of the opposing effects dominates.
The contradictory effects on corruption implied by the existence of a state religion are also implied by the existence of laws favoring religion (Lawbenrel) and of practices favoring religion (Practbenrel). The existence of laws benefiting religion is likely to promote corruption for the same reasons that the existence of an official religion is likely to. On the other hand, subsidization may reduce corruption by promoting greater adherence to religious norms (e.g., truth telling) that are inconsistent with corrupt practices.
The existence of laws burdening religion and of practices burdening religion (Lawburdenrel and Practburdenrel respectively) should both be positively associated with the level of corruption under this paper’s framework (Smith-Madison model). There are no offsetting social benefits, such as the prevention of free-riding, that would reduce their harmful effects. The presence of laws or practices burdening a particular religion or set of religions reduce the scope of the market in religion and creates interest groups that have incentives to maintain those laws and to seek their expansion.
2. Other Variables
The other variables used in the corruption regression control for the type of regulation generally (Socialist), the size of the public sector (Govconsump2000), the type of legal regime (Commonlaw),12 the existence of democratic procedures (Democformal, Democlimit,Democold, Democnew), and the percentages of Catholics and Muslims (Catholic, Muslim).
Some empirical literature has suggested that democracies and common law systems tend to be less corrupt than their alternatives (see, e.g., Lipset and Lenz, 2000 (democracy); Mocan, 2004 (common law)). The link between corruption and democracy is intuitive. Rampant corruption reduces wealth. The typical voter is likely to be hurt by rampant corruption, and will vote against highly corrupt governments.13 But the
12 An attractive alternative approach, adopted in Glaeser, LaPorta, Lopez-de-Silanes, Shleifer, 2004, codes for different legal traditions. Specifically, Glaeser et al. introduce variables for English, Socialist, German, Scandinavian, and French legal regimes. Our preference is to use the common law indicator alone, since it is the clearest procedural distinction among types of legal regimes observed. Common law is decentralized in its evolutionary process, while civil law tends to be centralized. The creation of narrow legal categories introduces distinctions that are based as much on legal substance as on legal procedure. This introduces new difficulties for any study, such as this one, that examines the impact of differences in substantive laws. 13 Mocan (2004) treats democracy as endogenous in a regression with corruption as the dependant variable, on the theory that is correlated with an omitted “culture” variable that also determines corruption. We treat the democracy as exogenous in our regressions. Rather than being a function of culture, political freedom

14
estimated relationship between democracy and corruption appears to depend on how democracy is measured. The well known “Polity IV” democracy index, which codes the strength of democratic procedures on a scale of one to ten, is negatively correlated with corruption (Lipset and Lenz). However, another set of studies suggests that it is not the existence of democracy that matters but the age or stability of democracy. Old democracies are less corrupt than young democracies (Keefer, 2005).
As Glaeser et al. (2004) note, the Polity IV measure of democracy reflects not only the existence of democratic procedures, but the extent to which governments adhere to them as well. Since corrupt regimes are likely to take steps to obstruct the democratic process, one should expect corrupt regimes to also have low scores on the Polity measure of democracy. Because of this problem, we use variables that code for the existence of formal democratic procedures, making no attempt to account for the success of those procedures. In other words, Democformal counts a country as a democracy if it has formal democratic procedures, even if the existing government pays off and bullies voters in order to stay in office.
The link between corruption and common law has also been suggested in the empirical literature (e.g., Mocan, 2004), though the link is less intuitively obvious than that between corruption and democracy. Why is the common law system associated with low levels of corruption? There are several potential explanations. One is judicial independence: judges in common law countries typically enjoy life appointments. They are not worried that judicial decisions adverse to the current ruling regime will result in their removal from office. Another reason is that common law rules are protective of property rights, constraining state functionaries from expropriating wealth from citizens. Yet another reason is that common law rules are of general application, and do not provide special protections to identifiable groups, which makes them poor instruments for expropriating or redistributing wealth (see, e.g., Hayek, 1960, 148-161; Epstein, 1982).
Previous research has also shown the relationship between adherence to certain religious beliefs and corruption. Lipset and Lenz (2000) find that corruption tends to be negatively associated with adherence to Protestantism, and suggest that it is positively associated with adherence to Catholicism. This is not because the Catholic faith explicitly promotes corruption. The more plausible explanation is that the Catholic faith, in comparison to others, tends to downplay the importance of personal responsibility for one’s lot, and to emphasize society’s responsibility for the less fortunate (e.g., Lipset and Lenz, at 119).14 These norms tend to promote interventionist regimes that seek to redistribute income, which, in turn, provide fertile ground for corruption.
appears to have arisen generally as a byproduct of economic freedom (Friedman, 1962; Smith, 1978, pp.187-88; Glaeser, La Porta, Lopez-de-Silanes, Shleifer, 2004). The economic view of political freedom suggests that the existence of democracy would be virtually a proxy for decentralization of control over resources. 14 An alternative theory is that the Catholic tradition emphasizes the vertical bond with the church while downplaying the horizontal bond with fellow citizens, undermining trust. Putnam (1993).
15
Whether the state’s regulatory framework is socialist has implications for corruption. Socialist systems restrict a wide range of ordinary market activity, eliminating property rights and creating unregulated black markets. State officials, who typically receive low pay, are tempted to appropriate state property and are often willing to accept bribes in order to permit market transactions to occur. Given these incentives, one expects the presence of a socialist regulatory system to be positively associated with corruption.
The size of the public sector relative to the economy (Govconsump2000) has ambiguous implications for corruption. On one hand, a larger public sector implies more regulation, more licensing authorities, and more opportunities for corruption to flourish. This suggests pubic sector spending relative to GDP should be positively associated with the level of corruption. On the other hand, a larger public sector typically means that public sector employees are being paid more, so they have a lower incentive to take bribes. In many countries with large public sectors, policemen are actually being paid relatively well in order to enforce the law. In some countries with small public sectors, policemen are paid poorly, so they make up the shortfall in income by accepting bribes. These considerations suggest that the size of the public sector relative to GDP will be negatively associated with the level of corruption. Summing up, the relationship between public sector’s share of the economy and corruption is ambiguous a priori. B. Growth
Since corruption hinders economic growth (Mauro, 1995), the implications of this framework for the growth regressions follow from those for the corruption regressions. Specifically, the existence of an official religion and the both the existence of laws and the existence of practices benefiting religion are predicted to have ambiguous effects on growth. Whether these types of subsidization enhance economic growth, say, by promoting adherence to growth-productive norms, or retard growth by encouraging rent seeking on the part of subsidized groups will be revealed by the regression results. On the other hand, both the existence of laws and the existence of practices burdening religion should tend to retard growth, because these policies seldom have significant social benefits.
In addition to the state-religion variables, we have included the other variables used in the corruption regression, and additional variables that are typically used in growth regressions (Barro, 1991). We expect the other variables used in the corruption regression (Democformal, Commonlaw, and others) to have the same predicted signs as in the corruption regression. The additional variables (not used in the corruption regression) should have the same signs as those reported in the literature (Barro, 1991). C. Inequality
In order to compare this paper’s framework with the Marxian view of the state’s use of religion, we examine below the effects of state regulation of religion on inequality. Under this Smith-Madison view adopted in this paper, state-sponsored burdens and
16
subsidies to religion contribute to rent seeking and corruption. However, neither rent-seeking nor corruption has an absolutely clear implication for the degree of inequality. In spite of this, the more likely effect is an enhancement of inequality, given that politically dominant factions are also likely to be relatively wealthy.
The efficiency model does not have clear implications for inequality. If religions provide norms that solve social problems, state subsidization should make society more productive. However, enhancing productivity could either increase or reduce inequality, depending on the whether the productivity enhancements go to upper or lower income classes.
The Marxian theory implies that state control over religion should enhance the degree of inequality. The reason is that the state uses religion under this theory in order to keep people in their places. Put another way, religion is used to foster acceptance of an exploitative social order. This implies that both laws subsidizing and burdening religion should be designed to prevent social upheaval from exploited classes. Laws and practices subsidizing religion should aim chiefly to promote those religions that counsel acceptance of the social order. With the risk of upheaval reduced owners of capital are in a better position to exploit laborers more severely, which should make economic inequality more severe. V. Results A. Corruption
Results for the estimation of the church-state relationship on corruption appear in Tables 2a and 2b below. The first column (Table 2a) includes all of the variables used in this part of the analysis. The second column drops all of the variables coding for government practices, since unlike laws they cannot be described as reflecting constraints on, or explicit authorizations of, government action. We address the endogeneity problem in Table 2b.
The second and third regressions (Table 2a) drop insignificant variables or
variables that are correlated with one or more of the state-religion variables. Regressions four and five repeat results of the previous regressions while employing different democracy indicators.
1. “Church-State Intervention” Variables
The results suggest that both the existence of laws burdening religion and the existence of practices burdening religion increase corruption. Lawburdenrel and Practburdenrel are both statistically significant and have the expected negative signs in Table 2a. This supports the rent-seeking model of church-state relations originally set out by Adam Smith and elaborated in this paper.

17
Laws burdening religion are likely to be observed in regimes in which favored elites (including favored religious groups) have gained the power to direct the state’s regulatory efforts toward the suppression of religious groups that threaten their dominance. The state is most likely to wield this power in a manner least harmful to itself, primarily by putting the greatest burdens on groups hostile to the ruling regime. This provides an environment in which corruption is likely to flourish. The corruptive effect of legal constraints on religious practices appears to be largest in the fourth regression, which drops the socialist law indicator. As Table 1b shows, countries in the socialist legal tradition tend to have laws burdening religious practice. When the socialist legal tradition indicator is dropped, the variable reflecting the presence of laws burdening religion takes on a larger significance because it reflects the corruptive effect of socialism.
The results for laws and practices benefiting religion are statistically insignificant. In the regressions in Table 2a there are three variables that capture the state’s efforts to subsidize religion. One indicates the presence of laws benefiting religion (Lawbenrel). Another indicates the presence of practices benefiting religion (Practbenrel). The third indicates the presence of an official state religion named in the country’s constitution (Staterelcons). We will discuss the three in order below.
Laws benefiting religion appear to enhance corruption, but the results are statistically insignificant. We noted earlier that laws subsidizing religion could have offsetting effects; increasing corruption by encouraging rent-seeking, reducing corruption by encouraging adherence to desirable religious norms. The weak effects for laws benefiting religion are consistent with the offsetting-effects hypothesis.
Practices benefiting religion (Practbenrel) appear neither to enhance nor reduce corruption. The coefficient estimates are statistically insignificant and have different signs. This is also consistent with the offsetting-effects hypothesis.
The existence of an official religion declared in the country’s constitution (Staterelcons) is negatively associated with corruption, though it has a statistically insignificant effect. The naming of an official religion presumably comes with some state benefits for the favored religion, if nothing more than the state’s expression of preference. This suggests that the naming of an official religion should have the same effect as the subsidy variables, Lawbenrel and Practbenrel. In other words, we should expect offsetting effects on corruption. The offsetting-effects hypothesis is confirmed by the weak regression results.
Although our state religion variable differs from that used in Barro and McCleary (2003), our finding that the presence of an official religion does not enhance corruption is consistent with their results. They find that the presence of a state religion enhances church attendance and religious attachment rather than reducing both. The prediction that both would be reduced follows from Adam Smith’s argument that state support led established churches to grow indifferent to the needs of congregants. Barro and

18
McCleary (2002) hypothesize that their finding of an enhancement in attachment and attendance results because of the subsidies that flow in favor of the official religion.
2. Other Variables
Most of the remaining variables in the corruption regression have expected signs. Illiteracy is positively associated with corruption. Lipset and Linz (2000) say that this is because corruption is more likely to be caught in a more educated society, and citizens are more likely to be aware of norms that are consistent with sound government. The same can be said of urbanization, which by enhancing the flow of information makes it more likely that corrupt practices will be caught. Consistent with this prediction, the urbanization rate is negatively associated with corruption.
The results for the democracy variables are difficult to explain initially, since they
imply that democracy enhances corruption. Recall that the basic democracy indicator, Democformal, is a dummy variable taking the value one if there are no legal limitations on the power of citizens to change their government. Of ninety-three countries in the regression sample, eighty-seven are formal democracies in this sense. The other democracy measure, Democlimit, takes the value one if there are significant legal limitations on the power of citizens to change the government. Two of the countries in the regression sample (Jordan and Morocco) are limited democracies. In the remaining four countries (Vietnam, China, Egypt, Pakistan) citizens do not (or did not during the sample period) have the power to change their government.
The results show that it is easy to be a formal democracy and corrupt at the same
time. There are many corrupt regimes in which citizens have the formal power to vote the current government out of office. However, they are often unable to do so because corrupt regimes find ways to hang on to power by buying votes and bullying opponents. Because of this, the average formal democracy in the sample is, perhaps paradoxically, more corrupt than is the average non-democracy in the sample.
To further explore the relationship between democracy and corruption we split up
the formal democracy variable into two categories: old formal democracies (Democold) and new formal democracies (Democnew). The new formal democracy variable selects out regions in which most of the democracies are new: Africa, the formerly Socialist countries, and Latin America. There is evidence suggesting that the quality of government is higher in older formal democracies (Keefer, 2005). The results in columns five through seven of Table 2a are consistent with this claim. They suggest that the positive association between corruption and formal democracy is limited to new democracies.
The effect of having a socialist legal foundation weakens substantially in the
regressions that separate old and new democracies. The reason for this is that the new democracies include many of the formerly socialist states. Of the 20 countries in the regression sample that are classified as having a socialist legal tradition, 18 are also new democracies.

19
Government consumption as a percentage of GDP (Govconsump2000) is negatively associated with corruption. As we noted before, enhancing the public sector relative to the economy probably has two effects. By increasing the sheer size of the bureaucracy, putting in more officials to demand licenses, government spending enhances corruption. On the other hand, by paying police officers more, government spending reduces corruption by reducing the incentives law enforcement agents have to accept bribes. The results suggest that the latter effect dominates.
The effect of the population percentage of Catholics is positively associated with corruption, with a statistically significant coefficient in all of the regressions in Table 2a. This is consistent with the findings of Lipset and Linz (2000), who suggest that Catholic doctrine may foster corruption by downplaying the connection between individual responsibility and economic or social status.15 However, LaPorta et al. (1999) find that the percent-Catholic effect on corruption weakens to statistical insignificance once variables controlling for legal origin are included.
3. Instrumental Variables Regression
The approach taken up to this point reflects an assumption that the existence of laws and practices burdening religion results from the absence of constitutional or cultural constraints on such intervention. The intervention itself fosters corruption, for reasons given in Part III. However, there is an alternative view that the state’s intervention into religious matters is a byproduct of its inherently corrupt nature – i.e., corruption causes the state to intervene into religion. We find this view less attractive because it posits inherent corruption as an essential quality of certain governments, without explaining how this inherent quality appeared. However, it is a view that cannot be rejected a priori, or on the ground that it is inconsistent with our evidence. Under the alternative view that posits an inherent tendency toward corruption in some governments, the variables indicating the existence of laws and of practices burdening religion are endogenous.
In view of this problem, we ran instrumental variables regressions. Our
instrument choice was based on Smith’s theory, formalized in Part III.C. Ideal instruments would be variables that explain a state’s decision to intervene in religion, but would not be determined by or a function of corruption.
The core instrument we used is a measure of the degree of religious plurality,
which is calculated by summing the squared market shares of the major religions (Barro and McCleary, 2003). Under Smith’s theory, religious plurality generates greater tolerance and diminishes the state’s incentive to align with a particular dominant church. The remaining instruments attempt to capture the social conditions that would work against tolerance, such as illiteracy. Urbanization is also a factor that should reduce
15 The result seems inconsistent at first glance with Barro and McLeary’s (2003) findings that religious adherence is positively related to economic growth, but it need not be. Catholicism could be positively associated with both corruption and growth.
20
tolerance, since it means that different religions would practice side-by-side in a crowded space. Population size, other things equal, should give a ruler a greater incentive to align with a dominant church. Our instrument panel consisted of variables that should affect the degree of tolerance. All of the additional instruments are lagged 10 years (from 1990). Most of them are interacted with plurality, as explained in the notes to Table 2b. We continue to treat the naming of an official religion in the state’s constitution as exogenous in the corruption regression.
The results of the instrumental variable regressions appear in Table 2b. The new
results are consistent with those of the ordinary least squares regressions in Table 2a. Unlike the results in Table 2a, the results in Table 2b suggest that state imposed benefits as well as burdens on religion foster corruption. There are statistically significant negative coefficients for the existence of a state religion in the constitution (Staterelcons), and for laws benefiting religion (Lawbenrel). The negative estimate for laws benefiting religion is consistent with the rent-seeking hypothesis. On the other hand, the positive estimates for Staterelcons lends support to the view that a religious subsidy of this form enhances compliance with religious norms (Barro and McCleary, 2003). B. Growth
Results for the impact of the church-state relationship on economic growth are presented in Table 3. We report six regressions in the table, where the dependent variable is real economic growth between 1991 and 2000. The basic regression is styled after the growth regressions in Barro (1991).16 As we did in the previous section, we begin with a “kitchen sink” regression (all of the variables) followed by sparser models that drop insignificant variables.
1. “Church-State Intervention” Variables
There is weak evidence in Table 3 that the relationship between church and state affects economic growth. In general, the results suggest that laws burdening religion harm economic growth. On the other hand, practices burdening religion, and both laws and practices benefiting religion do not appear to affect growth. The coefficient for the variable indicating the existence of laws burdening religion (Lawburdenrel) appears with a negative and statistically significant coefficient in six of the regressions in Table 3.
The existence of practices burdening religion does not appear to affect growth, while it does appear to affect corruption (Table 2a). This suggests that the corruptive impact of these practices is not substantial enough to hurt growth. The beneficial interventions (both laws and practices) appear to affect neither corruption nor growth.
2. Other Variables
16 There are some differences between the regression here and Barro’s. For example, although it is statistically insignificant, we decided to include the interaction between population and the indicator of openness to trade (Expimpgdp) in every regression. The reason was to control for countries such as China and India, with large populations and relatively open economies (Fischer, 2003).

21
The socialist law indicator has the biggest impact on growth. The regression suggests that socialism takes 3 percentage points off the growth rate of an economy. In comparison, common law appears to have no effect on growth, especially when the regression controls for socialist law. This contradicts the results of Mahoney (2001), which showed common law having a positive impact on growth.
Formal democracies do not appear to grow any faster than non-democracies. Democformal, which indicates formal democracy, has a negative sign in every regression and is statistically significant in the last one. For comparison purposes, we included the Polity IV measure of democracy in column 3. Including the Polity IV democracy index causes the estimated effect of laws burdening religion (Lawburdenrel) to fall substantially. Presumably this occurs because regimes that intervene legally to burden religions also score low on the Polity IV democracy index. Clearly, the church-state intervention variables reflect the general interventionist stance of a state, and in light of this perhaps the more remarkable result is that Lawburdenrel remains marginally significant when the Polity IV democracy index is included.
Population size, population growth, primary education, and investment all appear
to enhance growth, consistent with previous studies (e.g., Barro, 1991). The negative result for government spending suggests that it hurts growth, even though the results from Tables 2a and 2b suggested that it reduces corruption. In other words, paying public sector workers more may help reduce corruption, but the inefficiency of the public sector remains a drag on growth. C. Inequality
As we noted earlier, the effects of religious regulation on inequality are ambiguous a priori. The Marxian position offers the most straightforward view of the connection between inequality and religious regulation. Under this view, state regulation should be associated with increased inequality, since the purpose of religion is to entice the public into accepting an expropriative relationship between capitalists and laborers.
Adam Smith’s version of the rent-seeking model implies that the dominant church and the state enter into a mutually protective relationship in which state benefits flow disproportionately to the favored church. If rent-seeking behavior increases inequality, then an expansion in state-sponsored burdens or subsidies should be associated with an increase in inequality, and conversely.
The efficiency theory yields ambiguous implications, since an increase in productivity could enhance or reduce inequality, depending on the distribution of productivity enhancements. To illustrate the ambiguous implications of the efficiency theory, consider a productivity-enhancing investment, such as education. As it happens, primary education enhances inequality significantly (Table 4). Still, one assumes that primary education is good for growth, and that is confirmed the results in Table 3. This

22
suggests that a law subsidizing religion could be good for growth, as suggested by the results in Table 3, and also increase inequality.
We adopted the model used for the growth regressions to study the effects state regulation of religion has on inequality. The dependent variable is the Gini index, which measures inequality over the distribution of income or consumption, with a value of 0 representing perfect equality and 100 representing perfect inequality. The Gini index data are from the World Bank, based on surveys conducted over the 1990s.17 Since the survey years differ, we included a time trend to capture the effect of passage of time. And since some Gini measures were based on consumption rather than income, we included a dummy variable to indicate the consumption-based measures. The regressions results in Table 4 assume that the snapshot of inequality provided by the Gini index is representative of the 1990s.
The results in Table 4 suggest that state subsidization of religion does not have a substantial impact on inequality. Laws benefiting religion (Staterelcons and Lawbenrel) appear to have no significant effect on inequality. Having an official state religion is negatively associated with inequality, but the effect is statistically insignificant in every regression. Practices that subsidize religion (Practbenrel) are also negatively associated with inequality, though the results are statistically insignificant at conventional levels.
The one exception to the general finding of “no effect” is the result for laws burdening religion. The presence of laws burdening religion appears to enhance inequality, with a positive and statistically significant effect in five of the six regressions reported in Table 4. Practices burdening religion (Practburdenrel) have a statistically insignificant impact in all regressions.18
To provide a rough summary, laws and practices subsidizing religion are negatively associated with inequality, but the effect is statistically insignificant for the most part. Laws and practices burdening religion, on the other hand, are positively associated with inequality. The effect is statistically significant only in the case of laws that burden religion. The finding that laws burdening religion are positively associated with inequality is the flip side of the coin for the growth regressions, which showed that legal burdens are negatively associated with growth.
We noted earlier, in connection with the growth regressions, that the religious subsidies could have offsetting effects: enhancing productivity by promoting beneficial norms and reducing wealth by encouraging rent-seeking. The marginally significant results for practices benefiting religion are consistent with the offsetting effects hypothesis, provided we take a certain view of the incidence of the productivity effect. 17 However, one observation, for Uruguay, is from 1989. 18 As for the “other variables” (not measuring state burdens and benefits to religion), the most interesting result is that for the population and trade-openness interaction term (Popexpimpgdp), which suggests that trade has an inequality reducing effect that gets stronger with population size. Since international trade presumably occurs only after an economy has reached a sufficient scale, this result suggests one mechanism that could generate an inverted U-shaped relationship between inequality and income (Kuznets, 1955).
23
The productivity enhancing effect of religious subsidies would reduce inequality if they primarily impacted individuals on the lower end of the income spectrum. The results in Table 4 are consistent with this theory, though they fall far short of providing solid empirical support.
If indeed the productivity enhancing effects of religion are negatively related to income, we might gain a different understanding of the empirical finding that church attendance is not affected by income (e.g., Iannacone, 1998, p. 1473). The findings on church attendance seem counterintuitive at first glance. The notion that the poor have always found a greater need for their churches than the rich is a common observation. Adam Smith, remarking on the harms of slavery, pointed to banishment from established churches as one of the most significant, given the great importance of religion among the poor (Smith, 1978, p.179-82). Our results suggesting that productivity enhancements go largely to the poor, coupled with the finding in the literature that church attendance is not reduced by income, suggest that churches serve different functions for the poor and the rich. For the poor, the services provided by churches have a material effect on their working lives. For the rich, churches may serve a primarily social function. Overall church involvement may not change as income increases, but the type of benefits enjoyed by members changes greatly with income.
We are inclined to view these results as more consistent with Smith’s description of the nature of religious regulation than that of Marx’s. Marx’s view is that the state promotes religion in order to enhance inequality. There is no support for this in the results. On the other hand, Smith’s view of state capture is easily reconciled with the finding that laws burdening religion have a positive and significant effect on inequality.
The efficiency theory, the notion that the state subsidizes or burdens religion in order to enhance the public good provision of religions, appears to gain weak support from the results for the subsidy variables, which show a negative relationship between subsidization and inequality – provided we stick with the weakly-confirmed view that the productivity enhancements flow largely to lower economic classes. But the inequality effects are weak and statistically insignificant. Moreover, the efficiency theory, again coupled with the assumption that the productivity effects go largely to lower economic classes, is contradicted by the results of the burden variables, which show constraints on religious expression to be associated with greater inequality. Admittedly, the efficiency theory has ambiguous implications, since its implications depend on the distribution of productivity enhancements. However, the results as they stand provide no support for it and appear on the most straightforward reading to contradict it. D. Summary and Policy Implications
The “hard” or statistically significant results of the empirical analysis can be summarized as follows. Laws and practices burdening religion enhance corruption. Laws burdening religion reduce economic growth. Laws burdening religion enhance inequality. The “soft” or statistically weak finding is that inequality is positively associated with practices subsidizing religion. Of the three frameworks examined, the

24
efficiency model, the Marxian model, and the Smith-Madison model, we view these results as most consistent with the Smith-Madison rent-seeking model.
Our findings have implications for the debate over the optimal degree of separation between church and state. Earlier in this paper, we distinguished the Madisonian and Jeffersonian views, which have dominated the American debate for many years. The Madisonian approach prohibits state regulation of religion in order to prevent concrete problems such as monopolization and corruption. The Jeffersonian view seeks to erect a strict separation between state action and all religious activity.
To illustrate the implications of this study, consider vouchers as a case study. In Zelman v. Harris-Simmons, the U.S. Supreme Court held that it does not violate the First Amendment for students to use state-funded vouchers to attend religious educational institutions. Of course, the vouchers question can be framed more generally: should the state prohibit the use of publicly funded vouchers for the purchase of any goods or services from religious institutions?
The Jeffersonian, strict separation view appears to offer a simple answer: the state should prohibit the use of vouchers at religious institutions. Any such use involves the state indirectly subsidizing a religious institution. The religious institutions that receive the largest amount of indirect state funding would grow relative others.
The Smith-Madison framework offers a different perspective. The Smith-Madison approach asks whether the proposed policy would have the effect of permitting a state-favored religion to obtain or maintain an advantage over rivals, or of permitting the state itself to protect its control of power by suppressing potentially threatening religious activity. Both of these questions lead to a largely favorable view of vouchers. As long as they are in the hands of individuals to spend as they please, they do not provide any particular church with a competitive advantage over rivals. More importantly, vouchers can have the effect of weakening rather than enhancing the state’s power to suppress potentially threatening religious expression. Moreover, vouchers enhance competition among religious institutions, and between religious institutions and state-funded non-religious institutions that provide similar services.
Many have noted before that the market in educational services would benefit, as do all markets, from competition. However, Smith’s arguments suggest benefits for the market in religious services as well. Since vouchers enhance competition in the market for religious services, they offer the potential, suggested by Smith, of reducing the degree of religious strife. Of course, much of this depends on how the voucher scheme is administered (Blasi, 2002). VI. Conclusion
The literature on church and state has tended to focus on the question of interference: what is the proper degree to which the state can either tax or subsidize religion? We have avoided the question of interference here, and instead examined the

25
concrete consequences of state burdens and subsidies on religious institutions. Our hope is that by identifying the concrete consequences, we can gain a better sense of the most plausible functions that might be served by a state guarantee of religious liberty. Our findings suggest that state regulation or suppression of religious activity fosters corruption, with negative consequences for economic growth and inequality.

26
Table 1a
Variable name Variable description Mean Std.
Variables used in Corruption Regressions
CPI2001 Corruption Perceptions Index in 2001
4.706 2.374
Staterelcons A dummy variable equal to one if there is a state religion in the country’s constitution
0.191 0.396
Lawbenrel A dummy variable equal to one if the state has laws benefiting a certain religion (or religions) (see appendix for details)
0.670 0.473
Lawburdenrel A dummy variable equal to one if the state has laws effectively banning certain religions
0.319 0.469
Practbenrel A dummy variable equal to one if the state has practices benefiting a certain religion
0.372 0.486
Practburdenrel A dummy variable equal to one the state discriminates against or harasses a religious group
0.287 0.455
Registrationlaw A dummy variable equal to one if the state requires religions to register
0.638 0.483
Lesslawburden A dummy variable equal to one if the state imposes lesser legal burdens falling short of a ban
0.234 0.426
Discrimlawben A dummy variable equal to one if the state has laws providing special benefits to religious groups
0.521 0.502
Lesspracburden A dummy variable equal to one if the state has burdensome practices falling short of harassment
0.106 0.310
Commonlaw A dummy variable equal to one if the country has a common law legal system
0.158 0.367
Catholic Catholics as percent of the population
37.527 39.289
Muslim Muslims as percent of population
15.399 30.602
Socialist A dummy variable equal to one for socialist legal regime
0.211 0.410
Govconsump2000, Govconsump1999
General government consumption as percent of GDP in year 2000, same in year 1990
15.224, 15.734
5.364, 5.630
Illiteratemalerate Illiteracy rate among males above 16 (average from 1996-2000)
9.680 12.767
27
DemocPolity Polity IV Democracy index 1990
5.853 4.005
Democformal A dummy variable equal to one if the state is formally a democracy
0.568 0.498
Plurality Index measuring religious plurality 22.993 18.431
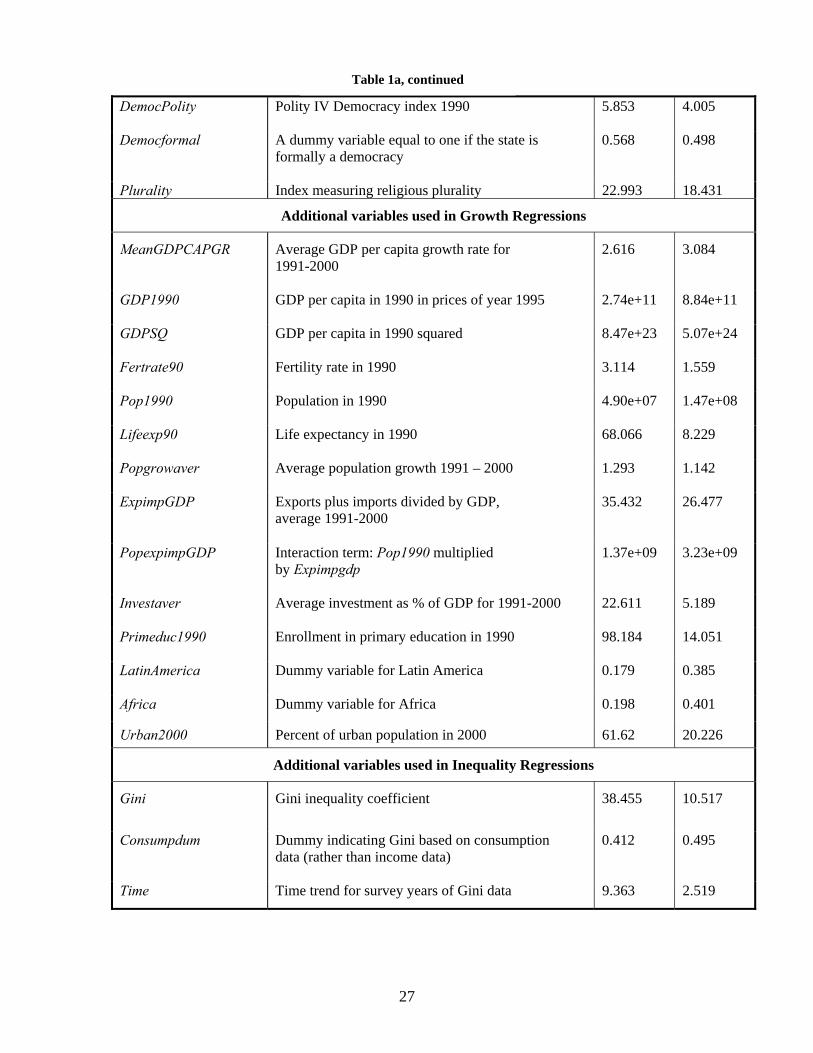
Additional variables used in Growth Regressions
MeanGDPCAPGR Average GDP per capita growth rate for 1991-2000
2.616 3.084
GDP1990 GDP per capita in 1990 in prices of year 1995
2.74e+11 8.84e+11
GDPSQ GDP per capita in 1990 squared
8.47e+23 5.07e+24
Fertrate90 Fertility rate in 1990
3.114 1.559
Pop1990 Population in 1990
4.90e+07 1.47e+08
Lifeexp90 Life expectancy in 1990
68.066 8.229
Popgrowaver Average population growth 1991 – 2000
1.293 1.142
ExpimpGDP Exports plus imports divided by GDP, average 1991-2000
35.432 26.477
PopexpimpGDP Interaction term: Pop1990 multiplied by Expimpgdp
1.37e+09 3.23e+09
Investaver Average investment as % of GDP for 1991-2000
22.611 5.189
Primeduc1990 Enrollment in primary education in 1990
98.184 14.051
LatinAmerica Dummy variable for Latin America
0.179 0.385
Africa Dummy variable for Africa 0.198 0.401
Urban2000 Percent of urban population in 2000 61.62 20.226
Additional variables used in Inequality Regressions
Gini Gini inequality coefficient
38.455 10.517
Consumpdum Dummy indicating Gini based on consumption data (rather than income data)
0.412 0.495
Time Time trend for survey years of Gini data 9.363 2.519
Table 1a, continued

28
Notes to Table 1: 1.The dependant variable is the 2001 Corruption Perceptions Index, compiled by Transparency International (see www.transparency.org/cpi/2001/). The index ranks countries in terms of the degree to which corruption is perceived to exist among public officials and politicians. The index is based on surveys of business people, academics, and country analysts. The index ranges from 10 (least corrupt) to 1 (most corrupt) for 93 countries in our sample. 2. DemocPolity: The democracy index runs from 0 to 10 and measures the degree to which the country’s political system approaches the ideal of one-man one-vote. The variable is part of the data collected by the Polity IV Project, University of Maryland, see www.cidcm.umd.edu/inscr/polity/index.htm (last visited 4/21/04). For a critical view of the index, see Glaeser, La Porta, Lopes-de-Silanes, and Shleifer (2004). 3. Staterelcons: State religion specified in constitution in year 2001 (see appendix for more). Our treatment of “state religion in constitution” represents the official position of the countries as opposed to the actual situation in the political and social sphere. A different approach is taken by Barrett, et al. (2001), who continue to classify some countries that abandoned an official state religion (examples in our sample include Italy, Portugal, Spain (Catholicism), and Sweden (Lutheranism)). Some governments are classified as “officially religious” by Barrett et al., though not maintaining a single official state religion (such as Australia, Belgium, Brazil, Ecuador, Ghana, Indonesia, Ireland, Namibia, South Africa, and Switzerland in our sample). Staterelcons, Lawbenrel, Lawburdenrel, Practbenrel, Practburdenrel, Registrationlaw, Lesspracburden, Lesslawburden, and Discrimlawben were all constructed using the Individual Country Reports released by the State Department in October 2001, and available at the University of Virginia Religious Freedom Institute (http://religiousfreedom.lib.virginia.edu/nationprofiles). 4. Lawbenrel: The laws of the country provide benefits to a religion (or religions) not provided to secular organizations; or some or all of the laws of the country are based on particular religious doctrine; or religious organizations or traditions are given specifically enumerated benefits in the constitution and other laws of the nation (see appendix for details). 5. Lawburdenrel: (1) The laws specifically ban all or some religious groups. (2) The discriminatory application of registration laws effectively bans certain religious groups. See appendix for details. 6.Practbenrel: National and municipal government officials treat religious groups better than comparable secular groups in ways not prescribed by law; OR membership in a particular religion imparts benefits not available to the general population (see appendix for details). 7. Practburdenrel: The government discriminates against or harasses at least one religious group or supports discrimination and harassment by others. The country was not coded as practburdenrel if the group discriminated against was directly linked to acts of terrorism or other group-wide illegal activity (see appendix for details). 8. Registrationlaw: The country has some system of registering religious groups (see appendix). 9. Lesslawburden: The laws of the country restrict or impair religious exercise in ways that do not amount to an explicit or effective ban on a religious group; OR members of religious groups or their officials are subject to laws not imposed on secular organizations (see appendix). 10. Discrimlawben: The government gives benefits to certain religious groups while excluding others (see appendix). 11. Lesspracburden: (1) The government imposes burdens on religious groups in ways not prescribed by law and which fall short of explicit harassment. (2) There are long and cumbersome registration processes. 12.Gini index: See World Bank, World Development Report 2000/2001. Survey years range over the 1990s. In the case of Uruguay, the survey year was 1989. For this reason, Uruguay was excluded from the sample for the inequality regression in Table 4. Some of the Gini figures are based on income, and others based on consumption. 13.Catholic and Muslim: source: Statistical Abstract of the World, 3d ed. Gale Research 1997, and World Christian Encyclopedia, 2d ed., David B. Barrett, George T. Kurian, and Todd M. Johson, Volume 1, Oxford University Press, 2001. 10.Plurality index is equal to the sum of Catholic, Muslim, and 1-Catholic-Muslim, each quantity squared. It is similar to the Hirschman-Herfindahl index of concentration. 11.Socialist: source: LaPorta, et al. (1999). 12.All other variables are from World Bank, World Development Indicators CD-ROM 2002. Investaver is the “gross fixed capital formation (as percent of GDP)” measure in the development indicators data. It is the sum of public and private investment, and includes land improvements (fences, ditches, drains, and so on); plant, machinery, and equipment purchases; and the construction of roads, railways, and the like,

29
including schools, offices, hospitals, private residential dwellings, and commercial and industrial buildings. Govconsump2000 and Govconsump1999 include all government current expenditures for purchases of goods and services (including compensation of employees); as well as most expenditures on national defense and security, but excludes government military expenditures that are part of government capital formation.
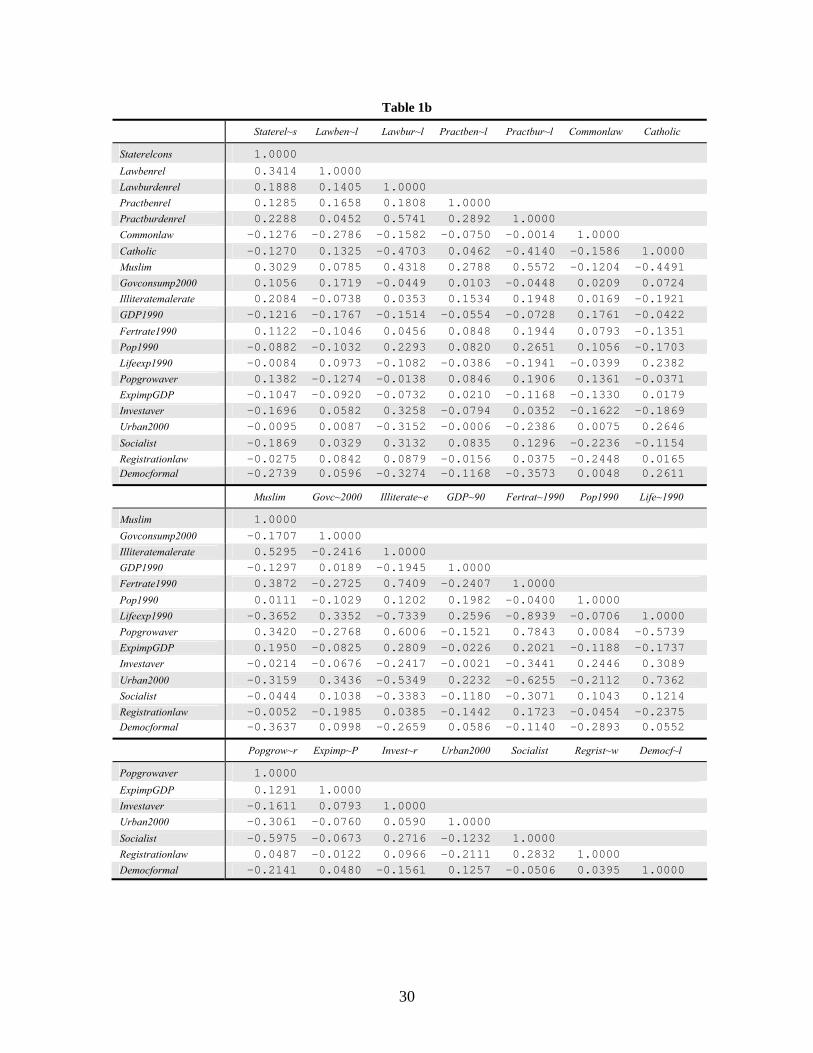
30
Table 1b
Staterel~s Lawben~l Lawbur~l Practben~l Practbur~l Commonlaw Catholic
Staterelcons 1.0000 Lawbenrel 0.3414 1.0000 Lawburdenrel 0.1888 0.1405 1.0000 Practbenrel 0.1285 0.1658 0.1808 1.0000 Practburdenrel 0.2288 0.0452 0.5741 0.2892 1.0000 Commonlaw -0.1276 -0.2786 -0.1582 -0.0750 -0.0014 1.0000 Catholic -0.1270 0.1325 -0.4703 0.0462 -0.4140 -0.1586 1.0000 Muslim 0.3029 0.0785 0.4318 0.2788 0.5572 -0.1204 -0.4491 Govconsump2000 0.1056 0.1719 -0.0449 0.0103 -0.0448 0.0209 0.0724 Illiteratemalerate 0.2084 -0.0738 0.0353 0.1534 0.1948 0.0169 -0.1921 GDP1990 -0.1216 -0.1767 -0.1514 -0.0554 -0.0728 0.1761 -0.0422 Fertrate1990 0.1122 -0.1046 0.0456 0.0848 0.1944 0.0793 -0.1351 Pop1990 -0.0882 -0.1032 0.2293 0.0820 0.2651 0.1056 -0.1703 Lifeexp1990 -0.0084 0.0973 -0.1082 -0.0386 -0.1941 -0.0399 0.2382 Popgrowaver 0.1382 -0.1274 -0.0138 0.0846 0.1906 0.1361 -0.0371 ExpimpGDP -0.1047 -0.0920 -0.0732 0.0210 -0.1168 -0.1330 0.0179 Investaver -0.1696 0.0582 0.3258 -0.0794 0.0352 -0.1622 -0.1869 Urban2000 -0.0095 0.0087 -0.3152 -0.0006 -0.2386 0.0075 0.2646 Socialist -0.1869 0.0329 0.3132 0.0835 0.1296 -0.2236 -0.1154 Registrationlaw -0.0275 0.0842 0.0879 -0.0156 0.0375 -0.2448 0.0165 Democformal -0.2739 0.0596 -0.3274 -0.1168 -0.3573 0.0048 0.2611
Muslim Govc~2000 Illiterate~e GDP~90 Fertrat~1990 Pop1990 Life~1990
Muslim 1.0000 Govconsump2000 -0.1707 1.0000 Illiteratemalerate 0.5295 -0.2416 1.0000 GDP1990 -0.1297 0.0189 -0.1945 1.0000 Fertrate1990 0.3872 -0.2725 0.7409 -0.2407 1.0000 Pop1990 0.0111 -0.1029 0.1202 0.1982 -0.0400 1.0000 Lifeexp1990 -0.3652 0.3352 -0.7339 0.2596 -0.8939 -0.0706 1.0000 Popgrowaver 0.3420 -0.2768 0.6006 -0.1521 0.7843 0.0084 -0.5739 ExpimpGDP 0.1950 -0.0825 0.2809 -0.0226 0.2021 -0.1188 -0.1737 Investaver -0.0214 -0.0676 -0.2417 -0.0021 -0.3441 0.2446 0.3089 Urban2000 -0.3159 0.3436 -0.5349 0.2232 -0.6255 -0.2112 0.7362 Socialist -0.0444 0.1038 -0.3383 -0.1180 -0.3071 0.1043 0.1214 Registrationlaw -0.0052 -0.1985 0.0385 -0.1442 0.1723 -0.0454 -0.2375 Democformal -0.3637 0.0998 -0.2659 0.0586 -0.1140 -0.2893 0.0552
Popgrow~r Expimp~P Invest~r Urban2000 Socialist Regrist~w Democf~l
Popgrowaver 1.0000 ExpimpGDP 0.1291 1.0000 Investaver -0.1611 0.0793 1.0000 Urban2000 -0.3061 -0.0760 0.0590 1.0000 Socialist -0.5975 -0.0673 0.2716 -0.1232 1.0000 Registrationlaw 0.0487 -0.0122 0.0966 -0.2111 0.2832 1.0000 Democformal -0.2141 0.0480 -0.1561 0.1257 -0.0506 0.0395 1.0000
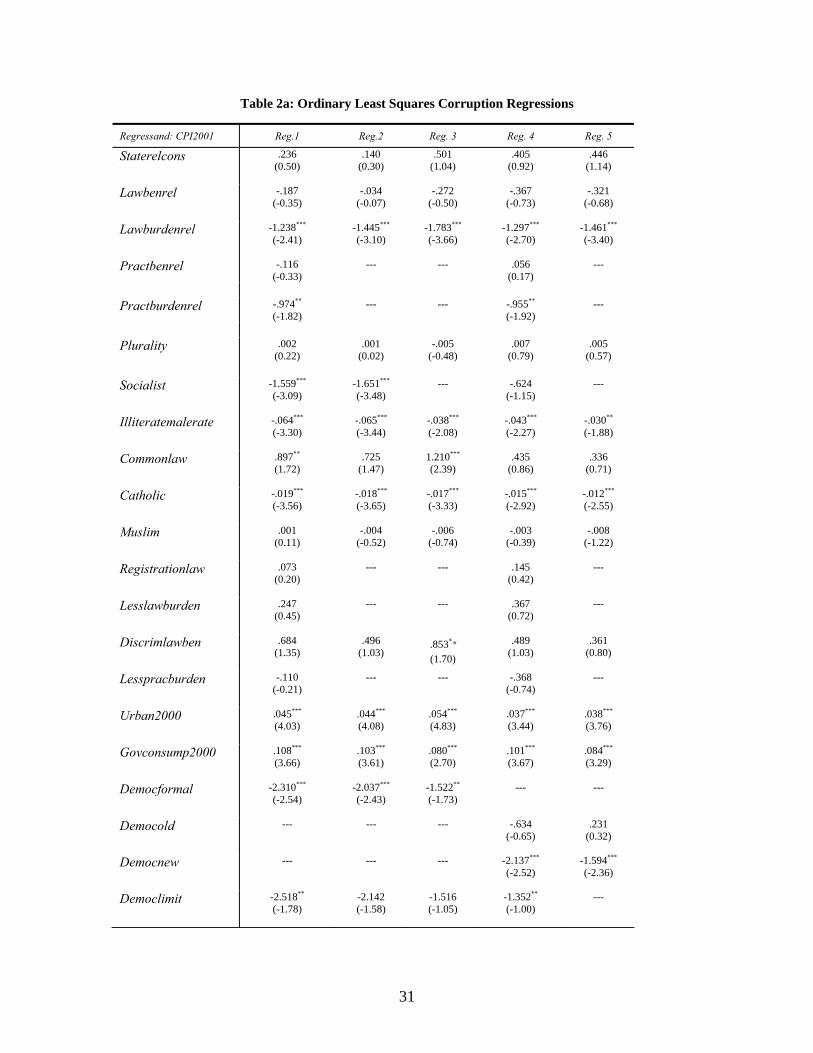
31
Table 2a: Ordinary Least Squares Corruption Regressions
Regressand: CPI2001 Reg.1 Reg.2 Reg. 3 Reg. 4 Reg. 5
Staterelcons .236 (0.50)
.140 (0.30)
.501 (1.04)
.405 (0.92)
.446 (1.14)
Lawbenrel -.187
(-0.35) -.034
(-0.07) -.272
(-0.50) -.367
(-0.73) -.321
(-0.68)
Lawburdenrel -1.238*** (-2.41)
-1.445*** (-3.10)
-1.783*** (-3.66)
-1.297***
(-2.70) -1.461*** (-3.40)
Practbenrel -.116
(-0.33) --- --- .056
(0.17) ---
Practburdenrel -.974** (-1.82)
--- --- -.955** (-1.92)
---
Plurality .002 (0.22)
.001 (0.02)
-.005 (-0.48)
.007 (0.79)
.005 (0.57)
Socialist -1.559*** (-3.09)
-1.651*** (-3.48)
--- -.624 (-1.15)
---
Illiteratemalerate -.064*** (-3.30)
-.065*** (-3.44)
-.038*** (-2.08)
-.043*** (-2.27)
-.030** (-1.88)
Commonlaw .897**
(1.72) .725
(1.47) 1.210*** (2.39)
.435 (0.86)
.336 (0.71)
Catholic -.019***
(-3.56) -.018*** (-3.65)
-.017*** (-3.33)
-.015*** (-2.92)
-.012*** (-2.55)
Muslim .001
(0.11) -.004
(-0.52) -.006
(-0.74) -.003
(-0.39) -.008
(-1.22)
Registrationlaw .073 (0.20)
--- --- .145 (0.42)
---
Lesslawburden .247 (0.45)
--- --- .367 (0.72)
---
Discrimlawben .684 (1.35)
.496 (1.03)
.853*× (1.70)
.489 (1.03)
.361 (0.80)
Lesspracburden -.110
(-0.21) --- --- -.368
(-0.74)
---
Urban2000 .045*** (4.03)
.044*** (4.08)
.054*** (4.83)
.037*** (3.44)
.038*** (3.76)
Govconsump2000 .108***
(3.66) .103*** (3.61)
.080*** (2.70)
.101*** (3.67)
.084*** (3.29)
Democformal -2.310***
(-2.54) -2.037*** (-2.43)
-1.522** (-1.73)
--- ---
Democold --- --- --- -.634 (-0.65)
.231 (0.32)
Democnew --- --- --- -2.137*** (-2.52)
-1.594*** (-2.36)
Democlimit -2.518** (-1.78)
-2.142 (-1.58)
-1.516 (-1.05)
-1.352** (-1.00)
---

32
Constant 4.240*** (3.42)
4.138*** (3.48)
2.843*** (2.36)
3.640*** (3.11)
2.958*** (2.84)
Adjusted R-squared 0.633 0.638 0.587 0.682 0.685
Prob > F 0.000 0.000 0.000 0.000 0.000
N observations 93 93 93 93 93
Notes to Table 2a: 1. *** for variables at 5% significance level, ** for those at 10% significance level. 2. Dependent variable: CPI2001 (Corruption Perception Index for 2001).

33
Table 2b: Instrumental Variables Corruption Regressions
Regressand: CPI2001 Reg. 1 Reg. 2 Reg. 3
Staterelcons
1.417*** (3.31)
1.899*** (2.99)
1.747*** (2.64)
Lawbenrel -2.515*** (-2.51)
-3.891***
(-2.43) -3.4*** (-2.09)
Lawburdenrel -2.510*** (-2.93)
-1.555 (-0.87)
-3.635*** (-3.50)
Practbenrel -0.303 (-0.62)
-.669 (-0.8)
-.723 (-0.79)
Practburdenrel -1.162*** (-1.78)
-2.495 (-1.63)
-1.12 (-1.13)
Democnew -1.72*** (-5.02)
Democold
1.591*** (4.07)
1.507*** (3.56)
Democlimit 0.848 (0.81)
.231 (0.2)
.585 (0.48)
Illiteratemalerate -.073*** (-6.23)
-.074*** (-4.85)
-.083*** (-4.94)
Commonlaw .241 (0.61)
.496 (0.87)
.095 (0.19)
Catholic -.013*** (-1.91)
-.01 (-1.13)
-.0179*** (-2.04)
Muslim .009 (1.31)
.016 (1.61)
.015 (1.28)
Discrimlawben 2.141*** (2.52)
3.068*** (2.41)
3.02*** (2.29)
Govconsump2000 .120*** (4.17)
.132*** (3.51)
.121*** (3.52)
Constant 6.387*** (7.35)
4.83*** (4.25)
5.509*** (4.46)
Centered R-squared Prob > F
0.6026 0.0000
0.4486 0.0000
0.4496 0.0000
N observations 92 92 92
Notes to Table 2b:
1. *** for variables at 5% significance level, ** for those at 10% significance level, T-statistics in parentheses.

34
2. Regression 1 treats Practbenrel, Practburdenrel, Lawbenrel and Lawburdenrel as endogenous. The instrument panel consists of: Plurality and various interactions: Catholic and Illiteracymalerate, Muslim and Illiteracymalerate, Pop90 and Plurality, Pop90 and Illiteracymalerate, Lifeexp90 and Plurality, Lifeexp90 and Catholic, Lifeexp90 and Muslim, Urban2000 and Catholic, Urban2000 and Muslim, Urban2000 and Plurality, Urban2000 and Pop90, Plurality and Illiteracymalerate, and triple interactions: Plurality and Illiteracymalerate and Pop90, Plurality and Illiteracymalerate and Urban2000, Urban2000 and Catholic and Pop90, Urban2000 and Muslim and Pop90, Catholic and Plurality and Illiteracymalerate, Muslim and Plurality and Illiteracymalerate, Catholic and Plurality and Pop90, Muslim and Plurality and Pop90.
3. Hansen J statistic (overidentification test of all instruments) for Reg. 1 = 18.701 (p-value = 0.346). 4. Regression 2 treats Practbenrel, Practburdenrel, Lawbenrel and Lawburdenrel as endogenous. The
instrument panel consists of: Plurality and various interactions: Catholic and Illiteracymalerate, Muslim and Illiteracymalerate, Pop90 and Plurality, Pop90 and Illiteracymalerate, Lifeexp90 and Plurality, Lifeexp90 and Catholic, Lifeexp90 and Muslim, Urban2000 and Catholic, Urban2000 and Muslim, Urban2000 and Plurality, Urban2000 and Pop90.
5. Hansen J statistic (overidentification test of all instruments) for Reg. 2 = 11.152 (p-value = 0.193). 6. Regression 3 treats Practbenrel, Practburdenrel, Lawbenrel and Lawburdenrel as endogenous. The
instrument panel consists of: Plurality and Urban2000 and various interactions: Catholic and Illiteracymalerate, Muslim and Illiteracymalerate, Pop90 and Plurality, Pop90 and Illiteracymalerate, Lifeexp90 and Plurality, Lifeexp90 and Catholic, Lifeexp90 and Muslim, Urban2000 and Catholic, Urban2000 and Muslim, Urban2000 and Plurality, Urban2000 and Pop90.
7. Hansen J statistic (overidentification test of all instruments) for Reg. 3 = 11.516 (p-value = 0.242). 8. Regression 4 treats Practbenrel, Practburdenrel, Lawbenrel and Lawburdenrel as endogenous. The
instrument panel consists of: Plurality and various interactions: Catholic and Illiteracymalerate, Muslim and Illiteracymalerate, Pop90 and Plurality, Pop90 and Illiteracymalerate, Lifeexp90 and Plurality, Lifeexp90 and Catholic, Lifeexp90 and Muslim, Urban2000 and Catholic, Urban2000 and Muslim, Urban2000 and Plurality, Urban2000 and Pop90.
9. Hansen J statistic (overidentification test of all instruments) for Reg. 4 = 10.536 (p-value = 0.229). 10. We also ran a regression with legal origin variables instead of the common law variable and obtained similar
results. 11. Democold and Newdemoc are highly correlated for this subsample (92 observations) and one of them is
automatically dropped by Stata. Results are unchanged if the corresponding variable is dropped manually.
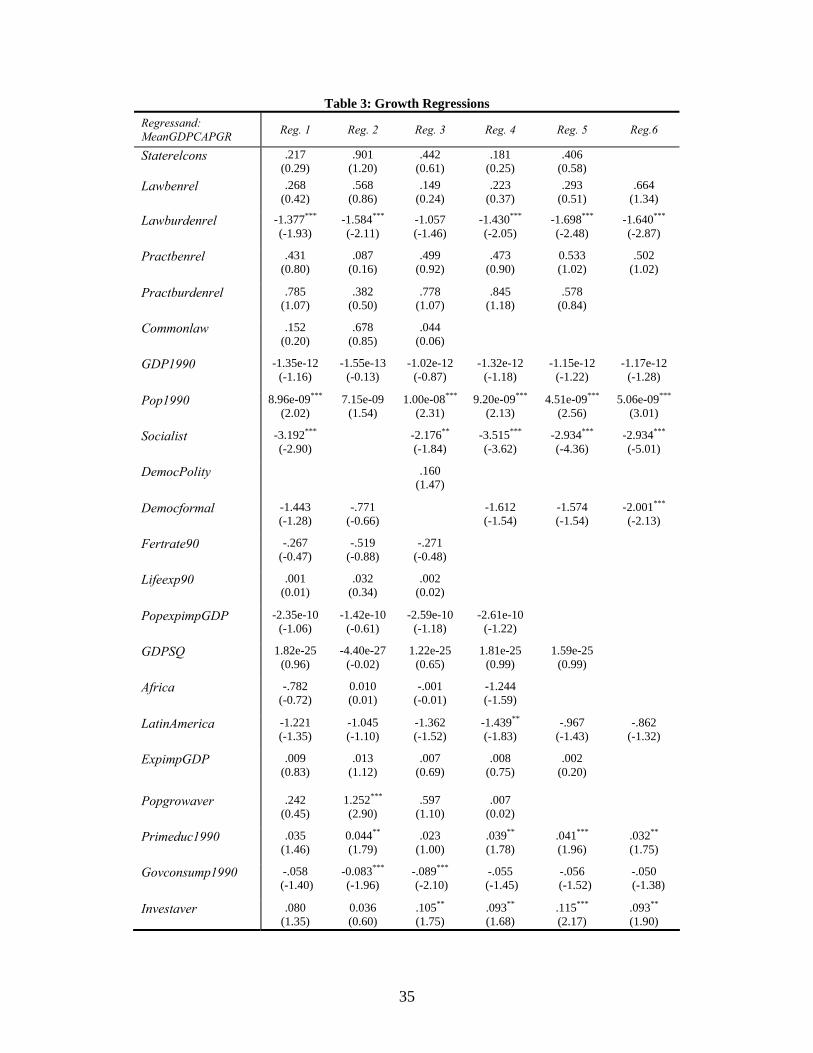
35
Table 3: Growth Regressions
Regressand: MeanGDPCAPGR Reg. 1 Reg. 2 Reg. 3 Reg. 4 Reg. 5 Reg.6
Staterelcons
.217 (0.29)
.901 (1.20)
.442 (0.61)
.181 (0.25)
.406 (0.58)
Lawbenrel .268 (0.42)
.568 (0.86)
.149 (0.24)
.223 (0.37)
.293 (0.51)
.664 (1.34)
Lawburdenrel -1.377*** (-1.93)
-1.584***
(-2.11) -1.057 (-1.46)
-1.430***
(-2.05) -1.698***
(-2.48) -1.640***
(-2.87)
Practbenrel .431 (0.80)
.087 (0.16)
.499 (0.92)
.473 (0.90)
0.533 (1.02)
.502 (1.02)
Practburdenrel .785 (1.07)
.382 (0.50)
.778 (1.07)
.845 (1.18)
.578 (0.84)
Commonlaw
.152 (0.20)
.678 (0.85)
.044 (0.06)
GDP1990 -1.35e-12 (-1.16)
-1.55e-13 (-0.13)
-1.02e-12 (-0.87)
-1.32e-12 (-1.18)
-1.15e-12 (-1.22)
-1.17e-12 (-1.28)
Pop1990
8.96e-09***
(2.02) 7.15e-09
(1.54) 1.00e-08***
(2.31) 9.20e-09***
(2.13) 4.51e-09***
(2.56) 5.06e-09***
(3.01)
Socialist -3.192***
(-2.90) -2.176**
(-1.84) -3.515***
(-3.62) -2.934***
(-4.36) -2.934***
(-5.01)
DemocPolity .160 (1.47)
Democformal -1.443 (-1.28)
-.771 (-0.66)
-1.612 (-1.54)
-1.574 (-1.54)
-2.001***
(-2.13)
Fertrate90 -.267 (-0.47)
-.519 (-0.88)
-.271 (-0.48)
Lifeexp90 .001 (0.01)
.032 (0.34)
.002 (0.02)
PopexpimpGDP -2.35e-10 (-1.06)
-1.42e-10 (-0.61)
-2.59e-10 (-1.18)
-2.61e-10 (-1.22)
GDPSQ 1.82e-25 (0.96)
-4.40e-27 (-0.02)
1.22e-25 (0.65)
1.81e-25 (0.99)
1.59e-25 (0.99)
Africa -.782 (-0.72)
0.010 (0.01)
-.001 (-0.01)
-1.244 (-1.59)
LatinAmerica
-1.221 (-1.35)
-1.045 (-1.10)
-1.362 (-1.52)
-1.439**
(-1.83) -.967
(-1.43) -.862
(-1.32)
ExpimpGDP .009 (0.83)
.013 (1.12)
.007 (0.69)
.008 (0.75)
.002 (0.20)
Popgrowaver .242 (0.45)
1.252***
(2.90) .597
(1.10) .007
(0.02)
Primeduc1990 .035 (1.46)
0.044** (1.79)
.023 (1.00)
.039** (1.78)
.041*** (1.96)
.032** (1.75)
Govconsump1990 -.058 (-1.40)
-0.083*** (-1.96)
-.089*** (-2.10)
-.055 (-1.45)
-.056 (-1.52)
-.050 (-1.38)
Investaver .080 (1.35)
0.036 (0.60)
.105**
(1.75) .093**
(1.68) .115***
(2.17) .093**
(1.90)
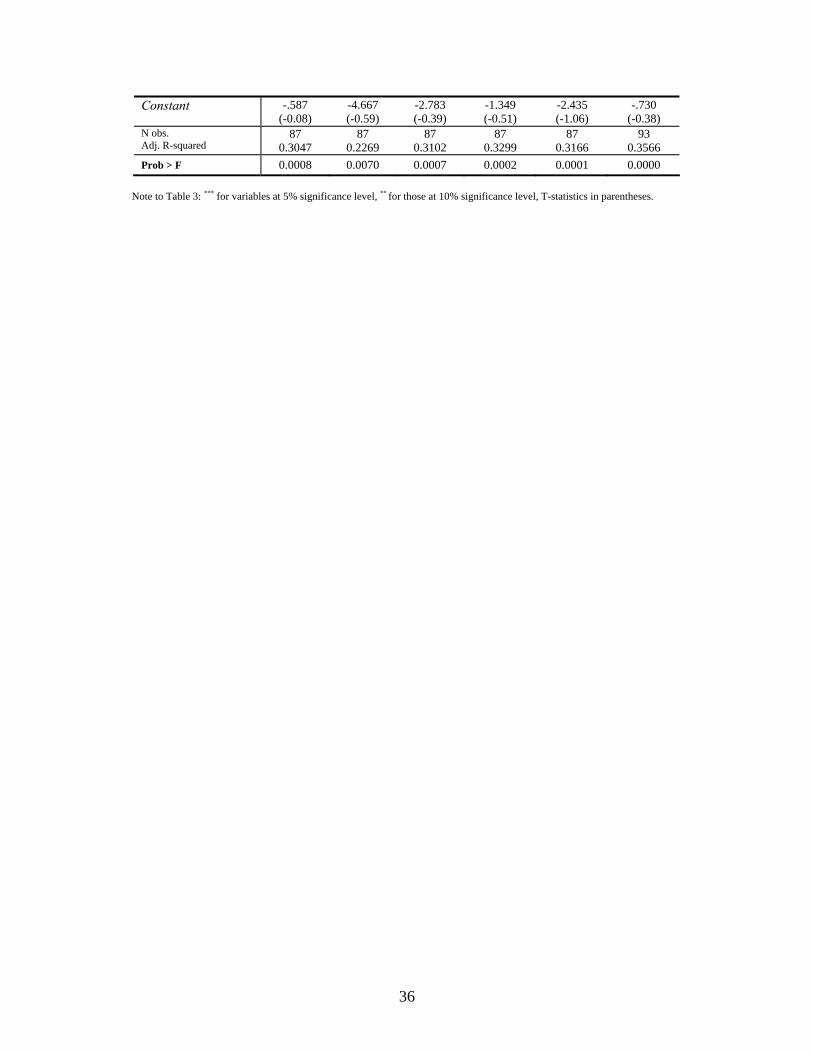
36
Note to Table 3: *** for variables at 5% significance level, ** for those at 10% significance level, T-statistics in parentheses.
Constant -.587 (-0.08)
-4.667 (-0.59)
-2.783 (-0.39)
-1.349 (-0.51)
-2.435 (-1.06)
-.730 (-0.38)
N obs. Adj. R-squared
87 0.3047
87 0.2269
87 0.3102
87 0.3299
87 0.3166
93 0.3566
Prob > F 0.0008 0.0070 0.0007 0.0002 0.0001 0.0000

37
Table 4: Inequality Regressions Regressand: Gini Reg. 1 Reg. 2 Reg. 3 Reg. 4 Reg. 5 Reg. 6 Staterelcons -.742
(-0.32) -0.845 (-0.39)
-1.419 (-0.62)
-.875 (-0.38)
-1.460 (-0.65)
Lawbenrel 1.073 (0.54)
1.033 (0.53)
1.451 (0.74)
.612 (0.33)
.483 (0.27)
Lawburdenrel 3.921**
(1.76) 3.936**
(1.78) 3.427 (1.53)
3.768**
(1.71) 3.556**
(1.74) 2.804**
(1.64)
Practbenrel -2.316 (1.42)
-2.272 (-1.43)
-2.378 (-1.44)
-2.245 (-1.38)
-1.871 (-1.24)
-1.938 (-1.37)
Practburdenrel -.026 (-0.01)
0.041 (0.02)
-.079 (-0.04)
.062 (0.03)
-.130 (-0.06)
Commonlaw 1.908 (0.71)
1.844 (0.71)
2.714 (1.03)
-.875 (-0.38)
GDP1990 4.84e-12 (1.37)
4.66e-12 (1.43)
4.37e-12 (1.23)
4.42e-12 (1.28)
1.02e-12 (1.19)
Pop1990 2.62e-08***
(1.97) 2.64e-08***
(2.03) 2.29e-08**
(1.76) 2.70e-08***
(2.05) 2.10e-08**
(1.78) 1.98e-08**
(1.79)
Socialist .446 (0.13)
-.967 (-0.27)
.026 (0.01)
-.288 (-0.10)
DemocPolity -.155 (-0.42)
Democformal 4.217 (1.10)
4.108 (1.10)
4.864 (1.31)
4.337 (1.23)
5.324***
(1.64)
Fertrate90 -.965 (-0.50)
-0.921 (-0.49)
-1.181 (-0.62)
-.612 (-0.33)
-.625 (-0.35)
-.525 (-0.31)
Lifeexp90 -.606***
(-2.17) -.611***
(-2.22) -.675***
(-2.43) -.558***
(-2.07) -.499***
(-2.02) -.439**
(-1.89)
PopexpimpGDP -1.64e-09***
(-2.48) -1.65e-09***
(-2.54) -1.59e-09***
(-2.39) -1.62e-09***
(-2.47) -1.22e-09***
(-2.15) -1.03e-09***
(-2.01)
GDPSQ -6.17e-25 (-1.08)
-5.90e-25 (-1.10)
-5.31e-25 (-0.93)
-5.48e-25 (-0.98)
Africa
1.677 (0.49)
1.577 (0.48)
.362 (0.10)
1.402 (0.42)
1.607 (0.49)
1.910 (0.63)
LatinAmerica 14.763***
(5.14) 14.746***
(5.18) 15.218***
(5.29) 13.945***
(5.32) 13.736***
(5.43) 13.470***
(5.49)
ExpimpGDP .032 (0.97)
.032 (0.97)
.037 (1.09)
.025 (0.79)
Popgrowaver 3.857***
(2.10) 3.701***
(2.62) 3.318**
(1.77) 3.778***
(2.07) 3.620***
(2.15) 3.592***
(2.72)
Primeduc1990 .248***
(3.26) .247***
(3.29) .266***
(3.54) .243***
(3.22) .235***
(3.32) .234***
(3.54)
Govconsump1990 -.001 (-0.01)
.003 (0.03)
.039 (0.29)
.004 (0.03)
Investaver
.116 (0.64)
.122 (0.71)
.086 (0.45)
.106 (0.59)

38
Note to Table 4: *** for variables at 5% significance level, ** for those at 10% significance level, T-statistics in parentheses.
Constant
41.823**
(1.73) 42.371**
(1.79) 51.374***
(2.27) 38.674 (1.63)
40.109**
(1.78) 35.175**
(1.65)
N obs. Adj. R-squared
77 0.6672
77 0.6731
77 0.6610
77 0.6702
77 0.6801
77 0.6951
Prob > F 0.0000 0.0000 0.0000 0.0000 0.0000 0.0000

39
Appendix A: Definitions
Definitions of Church-State Intervention Variables Staterelcons: State Religion(s) in the Constitution Definition
• The constitution specifies that there is an official state religion. Examples
• The constitution in Argentina specifies the Roman Catholic Church as the official state church.
• Zambia’s constitution identifies that it is a Christian nation. Lawbenrel: Laws Benefiting Religion Definition
• The laws of the country provide benefits to a religion (or religions) not provided to secular organizations; OR
• Some or all of the laws of the country are based on particular religious doctrine; OR
• Religious organizations or traditions are given specifically enumerated benefits in the constitution and other laws of the nation.
Examples
• In Austria the law provides subsides to recognized religions and supports church funded schools.
• The law in Bangladesh allows that several Islamic, Hindu, Buddhist, and Christian holy days are national holidays.
• Belarus has tax exemptions for religions by law. • The law requires or supports religious education in public schools in several
countries including Bolivia, Croatia, and Jordan. • Islamic doctrine is the basis of many areas of law in Egypt. • The Roman Catholic Church is given special legal status in the laws and
constitution of Guatemala. • In Morocco the government provides land grants to religious groups by law. • Norway has a constitutional requirement that the King and half of the parliament
be Lutheran. Lawburdenrel: Laws Burdening Religion Definition
• The laws specifically ban all or some religious groups. • The discriminatory application of registration laws effectively bans certain
religious groups. Examples

40
• Uzbekistan has registration laws that require religious groups to have a legal address in order to register however; the government refuses to give certain groups legal addresses and denies their applications on this basis.
• In Singapore the law bans the Jehovah’s Witnesses because their doctrine opposes military service.
• Pakistan has laws prohibiting many aspects of the Ahmadi faith for example although Ahmadis see themselves as an offshoot of the Muslim faith, they can be criminally prosecuted for referring to themselves as such.
Practbenrel: Practices Benefiting Religion Definition
• National and municipal government officials treat religious groups better than comparable secular groups in ways not prescribed by law; OR
• Membership in a particular religion imparts benefits not available to the general population.
Examples
• In Belarus the government shows a preference for religious groups in dispersing government funds.
• Chinese officials grant preferential meeting places for certain religious groups. • In Cote D’Ivoire almost all of the higher ranking government officials are
Catholic and there is a tradition of giving governmental gifts to Catholic clergy and leadership.
• The state television channel in Croatia shows a substantial amount of Catholic programming.
• Catholic officials in Nicaragua have substantial political power. • In Senegal the government provides funds and other assistance to citizens making
a religious pilgrimage to Jerusalem or Mecca. Practburdenrel: Practices Burdening Religion Definition
• The government discriminates against or harasses at least one religious group or supports discrimination and harassment by others. The country was not coded as practburdenrel if the group discriminated against was directly linked to acts of terrorism or other group-wide illegal activity.
Examples
• In Turkey there is widespread discrimination in many areas of government employment against members of groups thought to be fundamentalist.
• Converting to any other religion from Islam can result in detention and questioning in Morocco and there is governmental discrimination against most non-traditional Muslim groups.
• In Kazakhstan there are many reports of discrimination and harassment against non-registered faiths.
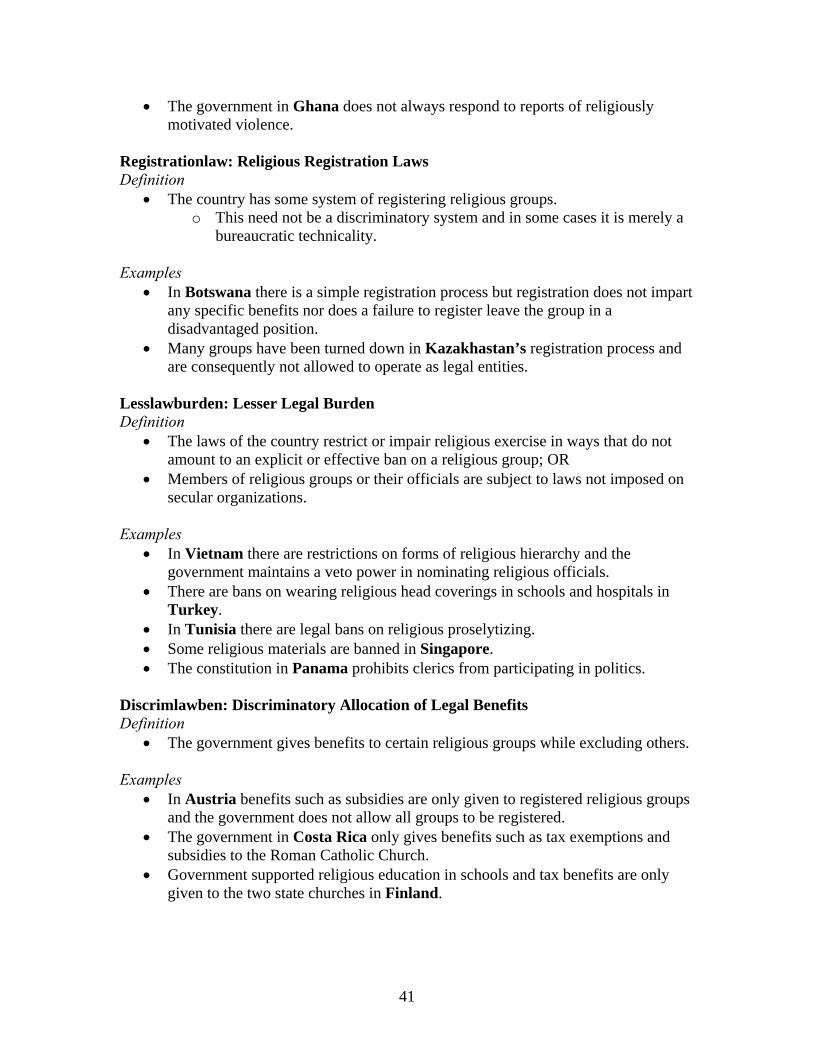
41
• The government in Ghana does not always respond to reports of religiously motivated violence.
Registrationlaw: Religious Registration Laws Definition
• The country has some system of registering religious groups. o This need not be a discriminatory system and in some cases it is merely a
bureaucratic technicality. Examples
• In Botswana there is a simple registration process but registration does not impart any specific benefits nor does a failure to register leave the group in a disadvantaged position.
• Many groups have been turned down in Kazakhastan’s registration process and are consequently not allowed to operate as legal entities.
Lesslawburden: Lesser Legal Burden Definition
• The laws of the country restrict or impair religious exercise in ways that do not amount to an explicit or effective ban on a religious group; OR
• Members of religious groups or their officials are subject to laws not imposed on secular organizations.
Examples
• In Vietnam there are restrictions on forms of religious hierarchy and the government maintains a veto power in nominating religious officials.
• There are bans on wearing religious head coverings in schools and hospitals in Turkey.
• In Tunisia there are legal bans on religious proselytizing. • Some religious materials are banned in Singapore. • The constitution in Panama prohibits clerics from participating in politics.
Discrimlawben: Discriminatory Allocation of Legal Benefits Definition
• The government gives benefits to certain religious groups while excluding others. Examples
• In Austria benefits such as subsidies are only given to registered religious groups and the government does not allow all groups to be registered.
• The government in Costa Rica only gives benefits such as tax exemptions and subsidies to the Roman Catholic Church.
• Government supported religious education in schools and tax benefits are only given to the two state churches in Finland.

42
Lesspracburden: Lesser Practical Burden Definition
• The government imposes burdens on religious groups in ways not prescribed by law and which fall short of explicit harassment.
• There are long and cumbersome registration processes. Examples
• The Ministry for Social Security and Generations in Austria issued an edition of a controversial brochure that described numerous non-recognized religious groups in negative terms
• In Bangladesh missionaries are allowed to get visas but face large delays and are often refused.
• The registration process in Estonia requires that leaders of religious organizations be citizens with at least 5 years' residence in the country and requires submission of the minutes of the constitutive meeting, a copy of statutes, and a notarized copy of three founders' signatures as supporting documents for the registration application.
• In Norway Islamic groups have faced many bureaucratic obstacles trying to get permits to build mosques.

43
Appendix B: Data
Staterelcons Lawbenrel Lawburdenrel Practbenrel Practburdenrel Regis-
trationlaw Lesslaw-burden
Discrim-lawben
Lessprac- burden
Argentina 1 1 0 1 0 1 0 0 0
Australia 0 0 0 0 0 0 0 0 0
Austria 0 1 1 0 0 1 0 1 1
Azerbaijan 0 0 1 0 1 1 1 0 0
Bangladesh 1 1 0 1 0 1 0 0 1
Belarus 0 1 1 1 1 1 0 1 0
Belgium 0 0 0 0 0 0 0 0 0
Bolivia 1 1 1 1 1 1 0 1 0
Botswana 0 0 0 0 0 1 0 0 0
Brazil 0 0 0 0 0 0 0 0 0
Bulgaria 1 1 1 1 1 1 1 1 0
Camaroon 0 0 0 0 0 1 0 0 1
Canada 0 0 0 1 0 0 0 0 0
Chile 0 1 0 1 0 1 0 0 0
China 0 0 1 1 1 1 1 0 0
Columbia 0 1 0 1 1 1 1 1 0
Costa Rica 1 1 0 1 0 0 0 1 0
Cote d’Ivoire 0 0 0 1 1 1 0 0 0
Croatia 0 1 0 1 0 0 0 1 0
Czech Rep. 0 0 0 1 0 1 0 0 0
Denmark 1 1 0 0 0 0 0 0 0
Dominican Rep. 0 1 0 0 0 1 0 1 0
Ecuador 0 0 0 0 0 1 0 0 0
Egypt 1 1 1 1 1 0 1 1 0
El Salvador 1 1 0 0 0 1 0 0 0
Estonia 0 1 0 0 0 1 0 0 1
Finland 1 1 0 0 0 1 0 1 0
France 0 1 0 1 0 1 0 1 1
Germany 0 1 0 1 1 0 0 1 0
Ghana 0 0 0 0 1 1 0 0 0
Greece 1 1 1 0 1 0 1 1 0
Guatemala 0 1 0 0 0 1 0 1 1
Honduras 0 0 0 1 0 0 0 0 0
Hong Kong 0 0 0 0 0 1 0 0 0
Hungary 0 1 0 0 0 1 0 1 0

44
Iceland 1 1 0 0 0 1 0 1 0
India 0 1 1 0 1 0 1 1 0
Indonesia 0 1 1 1 1 1 1 1 0
Ireland 0 0 0 1 0 0 0 0 0
Israel 0 1 0 1 1 0 0 1 0
Italy 0 1 0 0 0 0 0 1 0
Jamaica 0 0 1 0 0 0 0 0 0
Japan 0 0 0 0 0 1 0 0 0
Jordan 1 1 1 1 1 1 1 1 0
Kazakhstan 0 0 1 1 1 1 0 0 0
Kenya 0 1 1 1 1 1 0 0 0
Korea, Rep. of 0 1 0 0 0 0 0 1 0
Latvia 0 1 1 0 0 1 0 1 0
Lithuania 0 1 0 0 0 1 0 1 1
Luxembourg 0 1 0 0 0 0 0 1 0
Malawi 0 1 0 0 0 1 0 0 0
Malaysia 1 1 1 0 1 1 1 1 0
Mauritius 0 1 0 0 0 1 0 1 0
Mexico 0 0 0 0 0 1 1 0 0
Moldova 0 1 1 0 0 1 0 1 0
Morocco 1 1 1 0 1 0 1 1 0
Namibia 0 0 0 0 0 0 0 0 0
Netherlands 0 0 0 1 0 0 0 0 0
New Zealand 0 0 0 0 0 0 0 0 0
Nicaragua 0 1 0 1 0 1 0 1 0
Nigeria 0 1 1 1 1 1 1 1 0
Norway 1 1 0 0 0 1 0 1 1
Pakistan 1 1 1 1 1 0 1 1 0
Panama 0 1 0 0 0 0 1 1 0
Paraguay 0 0 0 0 0 1 0 0 0
Peru 0 1 0 0 0 0 0 1 0
Philippines 0 1 0 0 0 1 0 1 0
Poland 0 1 0 1 0 1 0 0 0
Portugal 0 1 0 1 0 0 0 1 0
Romania 0 1 1 1 0 1 1 1 1
Russian Fed. 0 0 1 0 1 1 0 0 0
Senegal 0 0 0 1 0 1 0 0 0
Singapore 0 1 1 0 0 1 1 1 0
Slovak Rep. 0 1 1 1 0 1 0 1 0
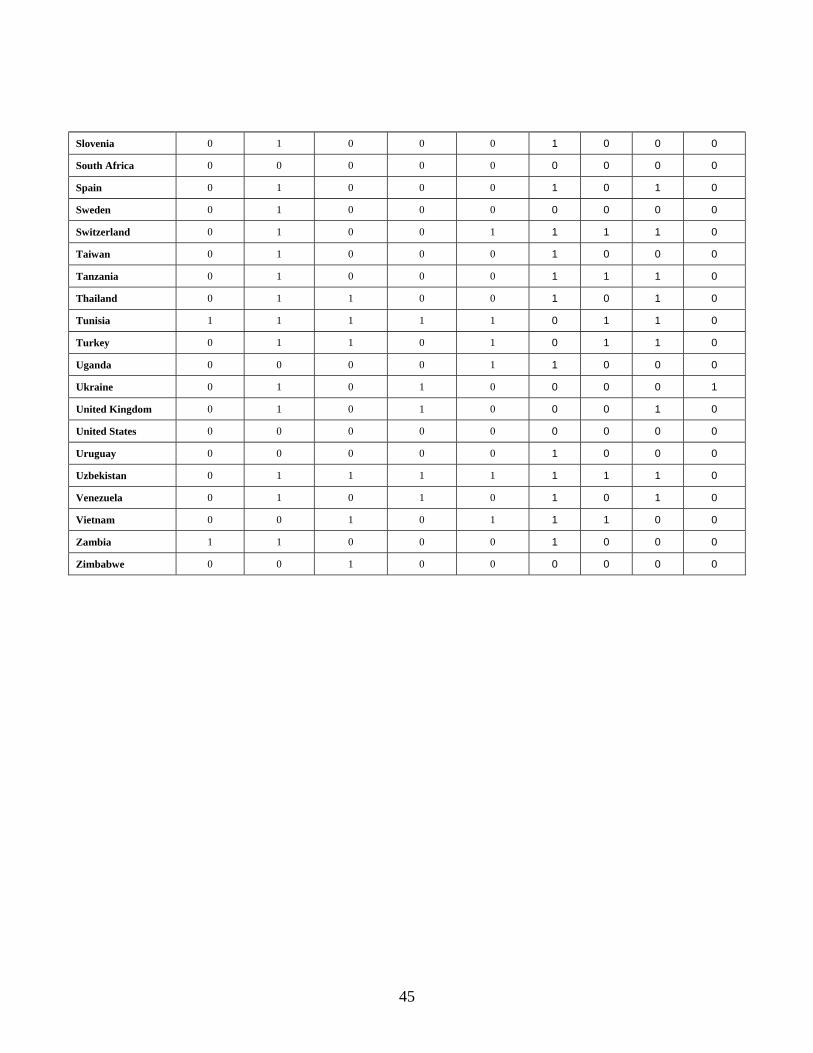
45
Slovenia 0 1 0 0 0 1 0 0 0
South Africa 0 0 0 0 0 0 0 0 0
Spain 0 1 0 0 0 1 0 1 0
Sweden 0 1 0 0 0 0 0 0 0
Switzerland 0 1 0 0 1 1 1 1 0
Taiwan 0 1 0 0 0 1 0 0 0
Tanzania 0 1 0 0 0 1 1 1 0
Thailand 0 1 1 0 0 1 0 1 0
Tunisia 1 1 1 1 1 0 1 1 0
Turkey 0 1 1 0 1 0 1 1 0
Uganda 0 0 0 0 1 1 0 0 0
Ukraine 0 1 0 1 0 0 0 0 1
United Kingdom 0 1 0 1 0 0 0 1 0
United States 0 0 0 0 0 0 0 0 0
Uruguay 0 0 0 0 0 1 0 0 0
Uzbekistan 0 1 1 1 1 1 1 1 0
Venezuela 0 1 0 1 0 1 0 1 0
Vietnam 0 0 1 0 1 1 1 0 0
Zambia 1 1 0 0 0 1 0 0 0
Zimbabwe 0 0 1 0 0 0 0 0 0
46
References Azzi, Corry and Ronald G. Ehrenberg, Household Allocation of Time and Church Attendance, 83 J. Pol. Econ., 27-56 (1975). David B. Barrett, George T. Kurian, and Todd M. Johson, Volume 1, World Christian Encyclopedia, 2d ed., Oxford University Press, 2001. Barro, Robert J. Economic Growth in a Cross Section of Countries, 106 Q. J. Econ., 407-443 (1991). Barro, Robert J. and Rachel M. McCleary, Religion and Political Economy in an International Panel, Working Paper No. 8931, National Bureau of Economic Research, May 2002, http://www.nber.org/papers/w8931. Barro, R. and R. McCleary, (2003), “Religion and Economic Growth Across Countries,” American Journal of Sociology, 68, 760-781. Barro, Robert J. and Rachel M. McCleary, Which Countries Have State Religions?, 120 Q. J. Econ., 1331-1370 (November 2005). Berman, Eli, Hamas, Taliban and the Jewish Underground: An Economist’s View of Radical Religious Militias, Working Paper No. 10004, National Bureau of Economic Research, September 2003, http://www.nber.org/papers/w10004. Blasi, Vincent, School Vouchers and Religious Liberty: Seven Questions from Madison’s Memorial and Remonstrance, Cornell Law Review, vol.87, 783-819 (2002). Ekelund, Robert B.,Jr., Robert F. Hebert, and Robert D. Tollison, An Economic Analysis of the Protestant Reformation, 110 J. Pol. Econ., 646-671 (2002). Epstein, Richard A. The Social Consequences of Common Law Rules, 95 Harvard Law Review, 1717-1751 (1982). Fischer, Stanley, Globalization and Its Challenges, 93:2 American Economic Review, 1- 30 (May 2003). Friedman, Milton, Capitalism and Freedom (Chicago: University of Chicago Press, 1962). Glaeser, Edward L., Rafeal La Porta, Flrorencio Lopes-de-Silanes, Andrei Shleifer, Do Institutions Cause Growth? Working Paper No. 10568, National Bureau of Economic Research, June 2004, http://www.nber.org/papers/w10568.

47
Guiso, Luigi, Paolo Sapienza, and Luigi Zingales, People’s Opium? Religion and Economic Attitudes, Working Paper No. 9237, National Bureau of Economic Research, October 2002, http://www.nber.org/papers/w9237. Hayek, Friedrich A., The Constitution of Liberty, University of Chicago Press, 1960. Hirschman, Albert O. 1970. Exit, Voice, and Loyalty: Responses to Decline in Firms, Organizations, and States. Cambridge, MA: Harvard University Press. Iannocone, Lawrence R. The Consequences of Religious Market Structure: Adam Smith and the Economics of Religion, 3 Rationality and Society, 156-177 (1991). Iannocone, Lawrence R. Sacrifice and Stigma: Reducing Free-Riding in Cults, Communes, and other Collectives, 100 J. Pol. Econ., 271-91 (1992). Iannocone, Lawrence R. Introduction to the Economics of Religion, 36 J. Econ. Lit., 1465-1494 (1998) Keefer, Philip, Democratization and Clientelism: Why are Young Democracies Governed Badly, World Bank Policy Research Working Paper 3594, Development Research Group, May 2005, available at http://econ.worldbank.org. Kuznets, Simon. Economic Growth and Inequality, 45 American Economic Review 1-28 (1955). LaPorta, Rafeal, Florencio Lopez-de-Silanes, Andrei Shleifer, and Robert Vishny, The Quality of Government, 15 (1) Journal of Law, Economics, and Organization, 222-79 (1999). Lipset, Seymour Martin and Gabriel Salman Lenz, Corruption, Culture, and Markets, in Culture Matters: How Values Shape Human Progress, 112-124, Lawrence E. Harrison and Samuel P. Huntington, eds., New York: Basic Books, 2000. The Writings of Thomas Jefferson, 281, 282 (Andrew A. Lipscomb & Albert E. Bergh eds., libr. ed. 1903). Mahoney, Paul G., The Common Law and Economic Growth: Hayek Might Be Right, 30 Journal of Legal Studies, 503–25 (2001). Mauro, Paulo, “Corruption and Growth” 110 Quarterly Journal of Economics, 681-713, (1995). McConnell, Michael W. and Richard A. Posner, An Economic Approach to Issues of Religious Freedom, 56 U. Chic. L. Rev., 1-60 (1989).

48
Mocan, Naci, What Determines Corruption? International Evidence from Micro Data, National Bureau of Economic Research, Working Paper 10460, Cambridge, MA, available at http://www.nber.org/papers/w10460, April 2004. Padover, Saul K. The Complete Madison: His Basic Writings, 1953. Putnam, Robert, Making Democracy Work: Civic Traditions in Modern Italy, Princeton: Princeton University Press, 1993. Seidler, John, Priest Resignations in a Lazy Monopoly, 44 American Sociological Review, 763-783, No. 5. (Oct., 1979). Smith, Adam, The Wealth of Nations (Glasgow edition). Adam Smith, Lectures on Jurisprudence: The Glasgow Edition (R.L. Meet et al. eds., Oxford University Press, 1978) (1762-65). Wilson, David Sloan, Darwin’s Cathedral: Evolution, Religion, and the Nature of Society (Chicago: U of Chicago Press, 2002).