cibc global asset management inc. compensation for ...compensation for currency risk, is the first...
TRANSCRIPT
1Compensation For Currency Risk |
C I B C G L O B a L A S S E T M a N a G E M E N T
Institutional advisory Research
A P R I L 2 0 1 3
Executive SummaryWhen purchasing an asset denominated in a foreign currency, an investor adds currency exposure to a portfolio. We believe that many institutional investors and their associated investment committees do not give adequate consideration to the risk and potential return opportunities inherent in exposure to a foreign currency. We encourage investors to make more conscious decisions about how to manage this extra component of their portfolio. The empirical track record of the asset class is such that active currency management has consistently added value. Moreover we believe it is a sensible investment objective to pursue a value-maximizing approach to currency, even though we recognize the challenges inherent in achieving that ideal positioning. at a minimum, institutional investors ought to be mindful of the major currency-related relationships and embedded risk-return profiles in their portfolio.
There are three main variables an investor should consider when determining how much foreign exposure to hedge, how much exposure to leave in place, and how often this ratio should be rebalanced.
Risk Return Correlation
Most challenging to the value-maximizing objective of currency management is the reality that these variables are dynamic, and change under different market conditions. Using a ‘rearview mirror’ strategy, we tested the effectiveness of extrapolating historical risk, return and correlation information to determine future hedging policy. Not surprisingly, we found that strict reliance on historical patterns must be avoided when making decisions about currency exposure. Fundamental judgment about current market regimes and their evolutionary trends is imperative. With these main points in mind, we hope that when an investor decides to maintain or add exposure to foreign currencies in a portfolio, they receive adequate Compensation For Currency Risk.
CIBC Global Asset Management Inc.Compensation For Currency Risk
2Compensation For Currency Risk |
C I B C G L O B a L A S S E T M a N a G E M E N T
Institutional advisory Research
A P R I L 2 0 1 3
CIBC Global asset Management Inc. (CGaM) is publishing a series of papers outlining our research and recommendations for managing currency exposures. This research paper, Compensation For Currency Risk, is the first in the 2013 Currency Management Series to be published by our Currency Team in conjunction with the Institutional advisory Group. Its focus is fundamental. It speaks to the basic factors one must contend with to ensure that portfolio currency exposures are adequately understood and well-managed: risk, return, and correlation, under different market conditions.
Most institutional investors in Canada have meaningful exposure to international assets – and therefore to foreign currencies - yet they often carry these exposures without giving adequate consideration to the risks and returns inherent in these assets. When investing internationally, the impact of currency on an international asset portfolio can be large; especially in times of crisis. The risk depends to a large degree on the correlation between the foreign currency exposure as a result of owning the international asset and the international asset portfolio itself. Said another way, the level of added risk as a result of foreign currency exposure varies based on whether the asset and the currency move in the same or the opposite direction under various market conditions, and the magnitude of this movement.
Looking at risk alone can mask important return drivers and inter-asset class correlation features. Return, risk and correlation therefore comprise an integrated framework to analyze currency exposure and the likelihood of being adequately compensated for risk taken. These three characteristics are dynamic over time, making the analysis and management of currencies more complex. There is evidence that adding an active currency management element to international securities holdings can be effective and value-adding.
In our subsequent 2013 Currency Management Series research papers, we will delve further into:
1. Drivers of currency market returns: Tracking and managing the right factors in practical ways.
2. Currency safe havens: active management of key currency relationships in a shifting landscape.
Institutional Advisory Group: 2013 Currency Management SeriesCompensation For Currency Risk
author: Michael Lewis, CFA1 Vice-President, Currency and Asset Allocation, CIBC Global Asset Management Inc.
Contributors: Kerry Stirton, Managing Director, Institutional Advisory Group and Client Relationships; Sarah Aves, CFA, Director, Investment Communications
1Also providing valuable input and research: Luc de la Durantaye, CFA, First Vice-President, Currency and Asset Allocation and Martin Thurgeon, CFA, Assistant Vice-President, Currency and Asset Allocation
3Compensation For Currency Risk |
The Impact of adding Currency Exposureat CGaM, we typically incorporate discussion of a hedge ratio based only on risk, but we go on to consider both the returns and correlations of currency exposures. Ten years ago, liquidity or cost issues could have precluded hedging in certain emerging markets but, more recently, liquidity has increased and costs have decreased to the point where the vast majority of foreign exposure can be hedged. There are still indirect costs (and benefits) to hedging as we discuss below, but we start with the assumption that an investor is consciously considering adding currency risk.
an investor purchases a risky international asset (for example: the MSCI all Country World Index, an international equity index) with the knowledge that there is a risk that the asset will decline in value. an investor is willing to take that risk because they believe they will be adequately compensated with returns over time. If that asset is denominated in a foreign currency (the MSCI all Country World Index gives an investor exposure to 32 different currencies), they must also decide how much foreign currency exposure to keep:
Total Return = Currency-Hedged Asset Return + w_Currency * Currency Return
w_Currency = Proportion of currency exposure left unhedged
If an investor is only interested in total return, their currency strategy would be based on a forecast of the currency return over the time period the international asset will be held. Currency forecasting is difficult, especially over long time periods, and usually outside the scope of a strategic decision maker. additionally, risk must be considered alongside return.
Using the MSCI all Country World Index, exposure to an international equity index, as a specific example, the risk equation has three moving parts: the equity risk (for which an investor believes they are adequately compensated); the currency risk (which is sometimes viewed as uncompensated risk); and the correlation between the currency hedged equity returns and the currency. In simplified terms:
Total Risk increases with Equity Risk
Total Risk increases with Currency Risk
Total Risk increases with high or positive correlation between the international equity index and the currency but decreases if there is low or negative correlation
In simplified terms:
Total Risk2 = Currency Hedged Asset Risk + w_Currency * Currency Risk + w_Currency * Correlation(Currency Hedged Asset Return, Currency Return)
More accurately, the last term is a function of covariance, which is the correlation, or the direction and magnitude of movement of the currency relative to the hedged asset, before adjusting for the risk levels. We are ignoring the exponents in the full equation, which is shown in the footnote.
Based on these relationships, there are three basic questions that provide a framework for consciously managing currency exposure:
1. Do I have a view on the direction of the foreign currency (or currencies) of the asset?
2. Is the risk of the asset higher or lower than the currency risk?
3. What is the correlation between foreign currency and the local return of the asset?
In general, an investor will prefer foreign currency exposure that is likely to generate positive returns, is less risky than the hedged international asset exposure and is negatively correlated with the hedged international asset exposure. In practice, the answers to these questions do not always point us in the same direction. For example, consider an investment in emerging market equities. First, since these economies have higher rates of economic growth and (setting aside the cases of damagingly high inflation) higher interest rates, the direction of currency return would be expected to be positive, suggesting keeping the currency exposure. Second, currency risk is very high, suggesting hedging the currency exposure. Finally, emerging market currencies tend to be positively correlated with emerging market equities, also suggesting hedging the currency exposure. It is this last point, the role of correlation, which we will focus on next.
2 The full equation is: , where the subscript E refers to a hedged foreign asset
(e.g. MSCI All Country World Index) and FX to the foreign currency exposure
4Compensation For Currency Risk |
Home Countryof Investor
Volatility ofFully Hedged
Equity Index
Volatility ofCurrencyReturns
Correlation(FX Returns,
Equity)
Volatility ofUn-hedged
Equity Index
RiskMinimizingHedge Ratio
Canada 14.15% 7.73% -0.542 11.97% 0.007
Europe (within the euro) 14.07% 7.32% -0.374 13.32% 0.281
United States 14.16% 4.47% 0.499 16.79% 1.000
Table 1 – 2003 to 2012 Volatility of Equity Index and Currency Returns, from various currency perspectives3
Source: Thomson Reuters Datastream, CIBC Global Asset Management Inc.
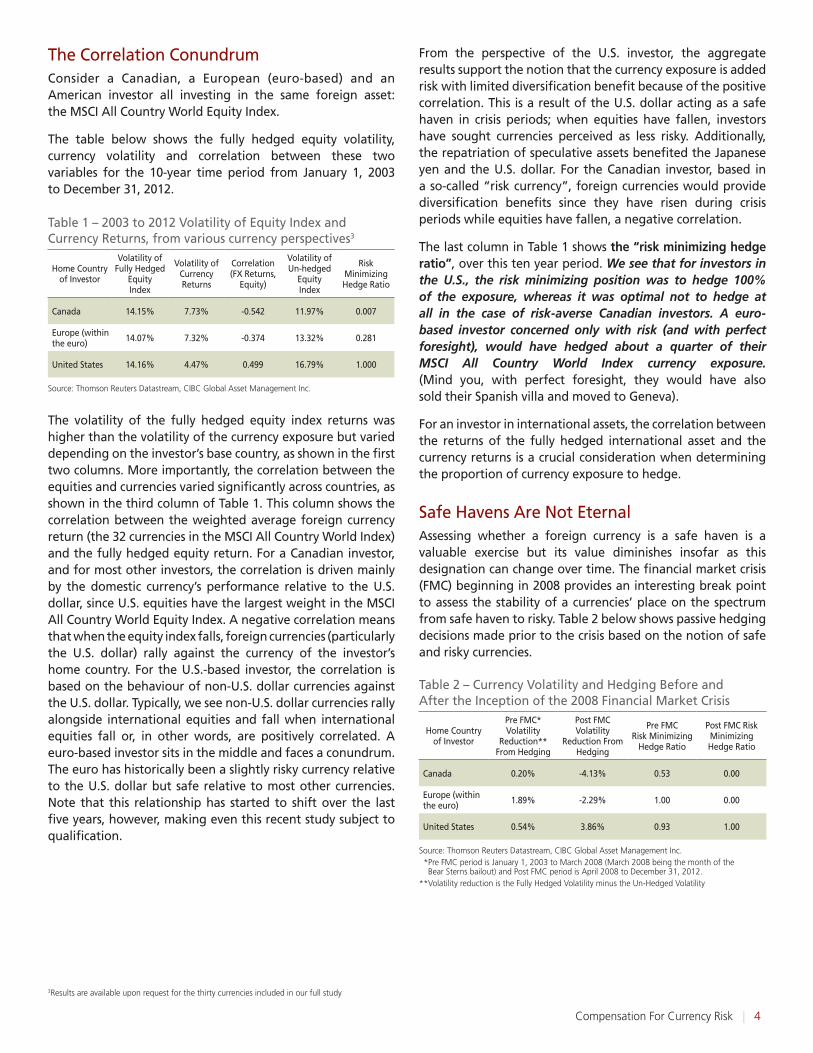
The Correlation ConundrumConsider a Canadian, a European (euro-based) and an american investor all investing in the same foreign asset: the MSCI all Country World Equity Index.
The table below shows the fully hedged equity volatility, currency volatility and correlation between these two variables for the 10-year time period from January 1, 2003 to December 31, 2012.
The volatility of the fully hedged equity index returns was higher than the volatility of the currency exposure but varied depending on the investor’s base country, as shown in the first two columns. More importantly, the correlation between the equities and currencies varied significantly across countries, as shown in the third column of Table 1. This column shows the correlation between the weighted average foreign currency return (the 32 currencies in the MSCI all Country World Index) and the fully hedged equity return. For a Canadian investor, and for most other investors, the correlation is driven mainly by the domestic currency’s performance relative to the U.S. dollar, since U.S. equities have the largest weight in the MSCI all Country World Equity Index. a negative correlation means that when the equity index falls, foreign currencies (particularly the U.S. dollar) rally against the currency of the investor’s home country. For the U.S.-based investor, the correlation is based on the behaviour of non-U.S. dollar currencies against the U.S. dollar. Typically, we see non-U.S. dollar currencies rally alongside international equities and fall when international equities fall or, in other words, are positively correlated. a euro-based investor sits in the middle and faces a conundrum. The euro has historically been a slightly risky currency relative to the U.S. dollar but safe relative to most other currencies. Note that this relationship has started to shift over the last five years, however, making even this recent study subject to qualification.
From the perspective of the U.S. investor, the aggregate results support the notion that the currency exposure is added risk with limited diversification benefit because of the positive correlation. This is a result of the U.S. dollar acting as a safe haven in crisis periods; when equities have fallen, investors have sought currencies perceived as less risky. additionally, the repatriation of speculative assets benefited the Japanese yen and the U.S. dollar. For the Canadian investor, based in a so-called “risk currency”, foreign currencies would provide diversification benefits since they have risen during crisis periods while equities have fallen, a negative correlation.
The last column in Table 1 shows the “risk minimizing hedge ratio”, over this ten year period. We see that for investors in the U.S., the risk minimizing position was to hedge 100% of the exposure, whereas it was optimal not to hedge at all in the case of risk-averse Canadian investors. A euro-based investor concerned only with risk (and with perfect foresight), would have hedged about a quarter of their MSCI All Country World Index currency exposure. (Mind you, with perfect foresight, they would have also sold their Spanish villa and moved to Geneva).
For an investor in international assets, the correlation between the returns of the fully hedged international asset and the currency returns is a crucial consideration when determining the proportion of currency exposure to hedge.
Safe Havens are Not Eternalassessing whether a foreign currency is a safe haven is a valuable exercise but its value diminishes insofar as this designation can change over time. The financial market crisis (FMC) beginning in 2008 provides an interesting break point to assess the stability of a currencies’ place on the spectrum from safe haven to risky. Table 2 below shows passive hedging decisions made prior to the crisis based on the notion of safe and risky currencies.
3Results are available upon request for the thirty currencies included in our full study
Home Countryof Investor
Pre FMC* Volatility
Reduction** From Hedging
Post FMC Volatility
Reduction From Hedging
Pre FMC Risk Minimizing
Hedge Ratio
Post FMC Risk Minimizing Hedge Ratio
Canada 0.20% -4.13% 0.53 0.00
Europe (within the euro) 1.89% -2.29% 1.00 0.00
United States 0.54% 3.86% 0.93 1.00
Table 2 – Currency Volatility and Hedging Before and after the Inception of the 2008 Financial Market Crisis
Source: Thomson Reuters Datastream, CIBC Global Asset Management Inc.** Pre FMC period is January 1, 2003 to March 2008 (March 2008 being the month of the
Bear Sterns bailout) and Post FMC period is April 2008 to December 31, 2012. **Volatility reduction is the Fully Hedged Volatility minus the Un-Hedged Volatility
5Compensation For Currency Risk |
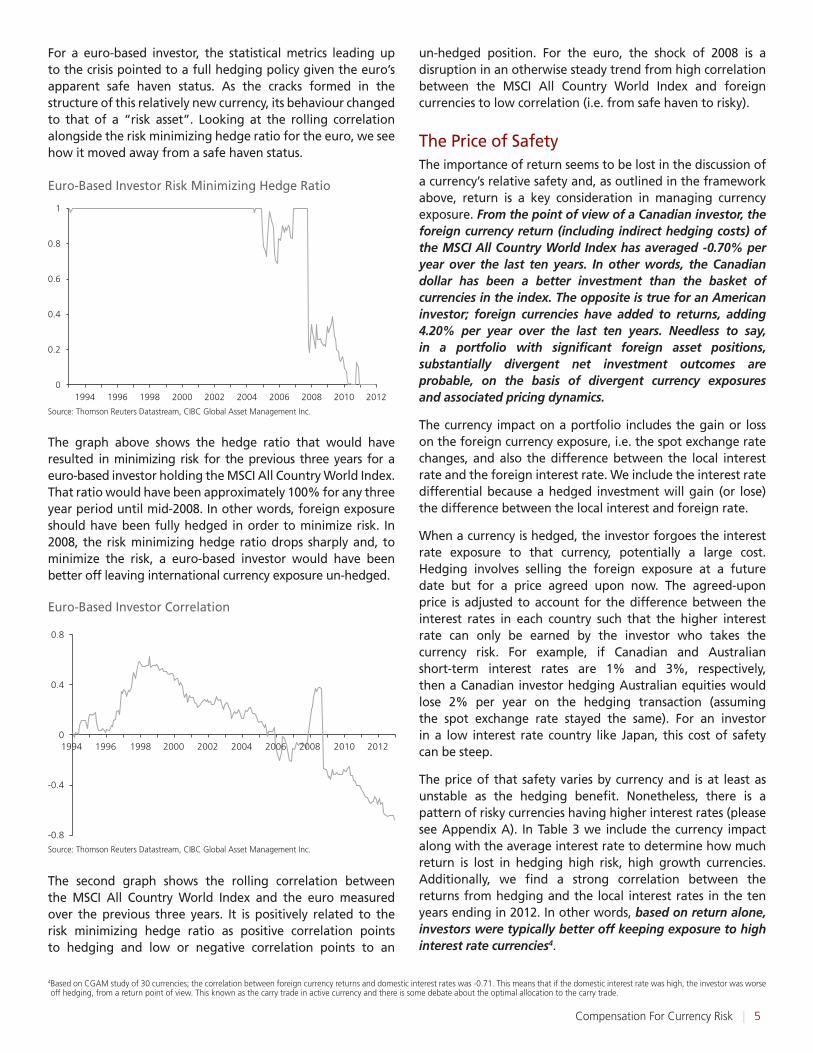
For a euro-based investor, the statistical metrics leading up to the crisis pointed to a full hedging policy given the euro’s apparent safe haven status. as the cracks formed in the structure of this relatively new currency, its behaviour changed to that of a “risk asset”. Looking at the rolling correlation alongside the risk minimizing hedge ratio for the euro, we see how it moved away from a safe haven status.
The graph above shows the hedge ratio that would have resulted in minimizing risk for the previous three years for a euro-based investor holding the MSCI all Country World Index. That ratio would have been approximately 100% for any three year period until mid-2008. In other words, foreign exposure should have been fully hedged in order to minimize risk. In 2008, the risk minimizing hedge ratio drops sharply and, to minimize the risk, a euro-based investor would have been better off leaving international currency exposure un-hedged.
The second graph shows the rolling correlation between the MSCI all Country World Index and the euro measured over the previous three years. It is positively related to the risk minimizing hedge ratio as positive correlation points to hedging and low or negative correlation points to an
un-hedged position. For the euro, the shock of 2008 is a disruption in an otherwise steady trend from high correlation between the MSCI all Country World Index and foreign currencies to low correlation (i.e. from safe haven to risky).
The Price of SafetyThe importance of return seems to be lost in the discussion of a currency’s relative safety and, as outlined in the framework above, return is a key consideration in managing currency exposure. From the point of view of a Canadian investor, the foreign currency return (including indirect hedging costs) of the MSCI All Country World Index has averaged -0.70% per year over the last ten years. In other words, the Canadian dollar has been a better investment than the basket of currencies in the index. The opposite is true for an American investor; foreign currencies have added to returns, adding 4.20% per year over the last ten years. Needless to say, in a portfolio with significant foreign asset positions, substantially divergent net investment outcomes are probable, on the basis of divergent currency exposures and associated pricing dynamics.
The currency impact on a portfolio includes the gain or loss on the foreign currency exposure, i.e. the spot exchange rate changes, and also the difference between the local interest rate and the foreign interest rate. We include the interest rate differential because a hedged investment will gain (or lose) the difference between the local interest and foreign rate.
When a currency is hedged, the investor forgoes the interest rate exposure to that currency, potentially a large cost. Hedging involves selling the foreign exposure at a future date but for a price agreed upon now. The agreed-upon price is adjusted to account for the difference between the interest rates in each country such that the higher interest rate can only be earned by the investor who takes the currency risk. For example, if Canadian and australian short-term interest rates are 1% and 3%, respectively, then a Canadian investor hedging australian equities would lose 2% per year on the hedging transaction (assuming the spot exchange rate stayed the same). For an investor in a low interest rate country like Japan, this cost of safety can be steep.
The price of that safety varies by currency and is at least as unstable as the hedging benefit. Nonetheless, there is a pattern of risky currencies having higher interest rates (please see appendix a). In Table 3 we include the currency impact along with the average interest rate to determine how much return is lost in hedging high risk, high growth currencies. additionally, we find a strong correlation between the returns from hedging and the local interest rates in the ten years ending in 2012. In other words, based on return alone, investors were typically better off keeping exposure to high interest rate currencies4.
Risk Minimizing Hedge Ratio
0
0.2
0.4
0.6
0.8
1
1994 1996 1998 2000 2002 2004 2006 2008 2010 2012
Euro-Based Investor Risk Minimizing Hedge Ratio
Source: Thomson Reuters Datastream, CIBC Global Asset Management Inc.
Correlation
-0.8
-0.4
0
0.4
0.8
1994 1996 1998 2000 2002 2004 2006 2008 2010 2012
Euro-Based Investor Correlation
Source: Thomson Reuters Datastream, CIBC Global Asset Management Inc.
4 Based on CGAM study of 30 currencies; the correlation between foreign currency returns and domestic interest rates was -0.71. This means that if the domestic interest rate was high, the investor was worse off hedging, from a return point of view. This known as the carry trade in active currency and there is some debate about the optimal allocation to the carry trade.
6Compensation For Currency Risk |
Home Countryof Investor
average Domestic Interest
Rate
average FX Return of Foreign
Currencies
Risk Minimizing
Hedge Ratio
Maximum Information Ratio Hedge
Ratio*
Canada 2.109% -0.70% 0.007 1.000
Europe (within the euro) 2.232% 1.47% 0.281 0.000
United States 1.639% 4.20% 1.000 0.000
Table 3 – Impact of Currency Returns and Interest Rates on the Hedge Ratio
Source: Thomson Reuters Datastream, CIBC Global Asset Management Inc.Calculations are from January 1, 2003 to December 31, 2012* The Maximum Information Ratio Hedge Ratio is calculated to result in the highest return per unit
of risk, over the full 10 year period. See Appendix B for the specific formula.
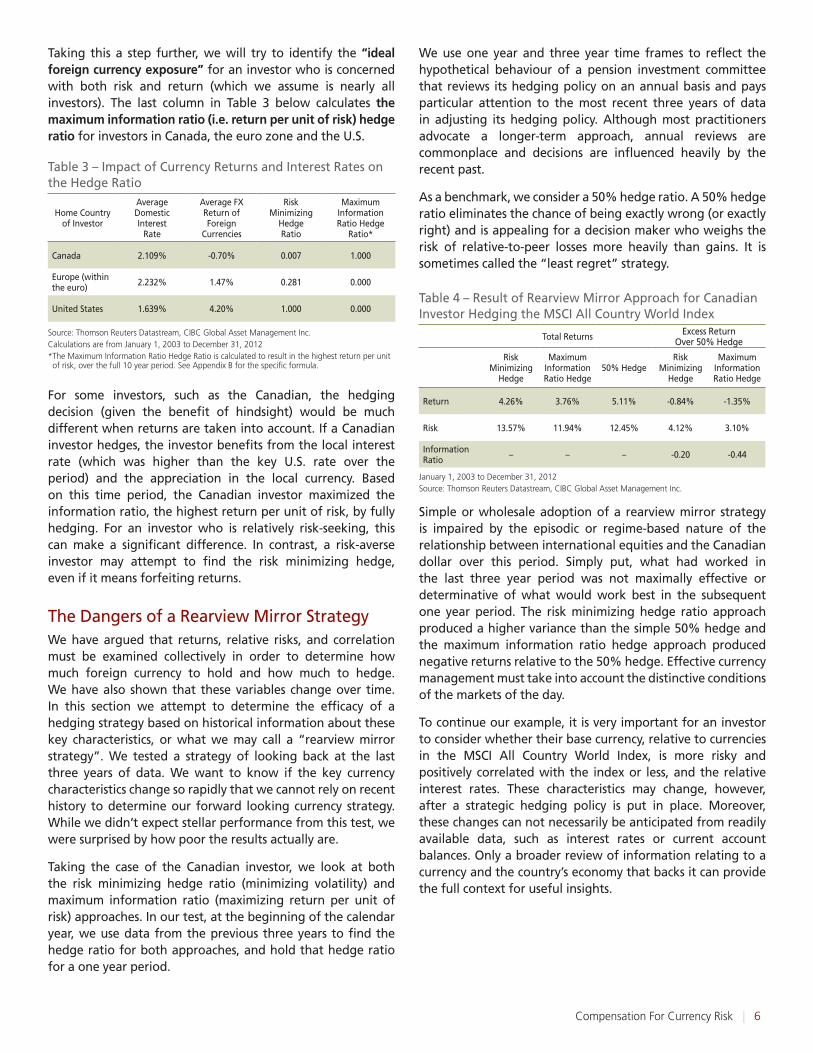
Taking this a step further, we will try to identify the “ideal foreign currency exposure” for an investor who is concerned with both risk and return (which we assume is nearly all investors). The last column in Table 3 below calculates the maximum information ratio (i.e. return per unit of risk) hedge ratio for investors in Canada, the euro zone and the U.S.
For some investors, such as the Canadian, the hedging decision (given the benefit of hindsight) would be much different when returns are taken into account. If a Canadian investor hedges, the investor benefits from the local interest rate (which was higher than the key U.S. rate over the period) and the appreciation in the local currency. Based on this time period, the Canadian investor maximized the information ratio, the highest return per unit of risk, by fully hedging. For an investor who is relatively risk-seeking, this can make a significant difference. In contrast, a risk-averse investor may attempt to find the risk minimizing hedge, even if it means forfeiting returns.
The Dangers of a Rearview Mirror StrategyWe have argued that returns, relative risks, and correlation must be examined collectively in order to determine how much foreign currency to hold and how much to hedge. We have also shown that these variables change over time. In this section we attempt to determine the efficacy of a hedging strategy based on historical information about these key characteristics, or what we may call a “rearview mirror strategy”. We tested a strategy of looking back at the last three years of data. We want to know if the key currency characteristics change so rapidly that we cannot rely on recent history to determine our forward looking currency strategy. While we didn’t expect stellar performance from this test, we were surprised by how poor the results actually are.
Taking the case of the Canadian investor, we look at both the risk minimizing hedge ratio (minimizing volatility) and maximum information ratio (maximizing return per unit of risk) approaches. In our test, at the beginning of the calendar year, we use data from the previous three years to find the hedge ratio for both approaches, and hold that hedge ratio for a one year period.
We use one year and three year time frames to reflect the hypothetical behaviour of a pension investment committee that reviews its hedging policy on an annual basis and pays particular attention to the most recent three years of data in adjusting its hedging policy. although most practitioners advocate a longer-term approach, annual reviews are commonplace and decisions are influenced heavily by the recent past.
as a benchmark, we consider a 50% hedge ratio. a 50% hedge ratio eliminates the chance of being exactly wrong (or exactly right) and is appealing for a decision maker who weighs the risk of relative-to-peer losses more heavily than gains. It is sometimes called the “least regret” strategy.
Simple or wholesale adoption of a rearview mirror strategy is impaired by the episodic or regime-based nature of the relationship between international equities and the Canadian dollar over this period. Simply put, what had worked in the last three year period was not maximally effective or determinative of what would work best in the subsequent one year period. The risk minimizing hedge ratio approach produced a higher variance than the simple 50% hedge and the maximum information ratio hedge approach produced negative returns relative to the 50% hedge. Effective currency management must take into account the distinctive conditions of the markets of the day.
To continue our example, it is very important for an investor to consider whether their base currency, relative to currencies in the MSCI all Country World Index, is more risky and positively correlated with the index or less, and the relative interest rates. These characteristics may change, however, after a strategic hedging policy is put in place. Moreover, these changes can not necessarily be anticipated from readily available data, such as interest rates or current account balances. Only a broader review of information relating to a currency and the country’s economy that backs it can provide the full context for useful insights.
Total Returns Excess Return Over 50% Hedge
Risk Minimizing
Hedge
Maximum Information Ratio Hedge
50% Hedge Risk
Minimizing Hedge
Maximum Information Ratio Hedge
Return 4.26% 3.76% 5.11% -0.84% -1.35%
Risk 13.57% 11.94% 12.45% 4.12% 3.10%
Information Ratio – – – -0.20 -0.44
Table 4 – Result of Rearview Mirror approach for Canadian Investor Hedging the MSCI all Country World Index
January 1, 2003 to December 31, 2012Source: Thomson Reuters Datastream, CIBC Global Asset Management Inc.
7Compensation For Currency Risk |
additional active approaches to Currency ManagementSo far we have discussed the return, relative risk and correlation characteristics in our currency management framework, and we have touched on interest rates and the behaviour of currencies in a crisis. We have also proven that the factors we have discussed are neither static nor exhaustive. Our framework provides a base for a currency management approach depending on an investor’s basket of international holdings and base currency. But a more active approach, over and above a hedge ratio adjusted on an annual basis, is necessary to navigate the unknown road ahead.
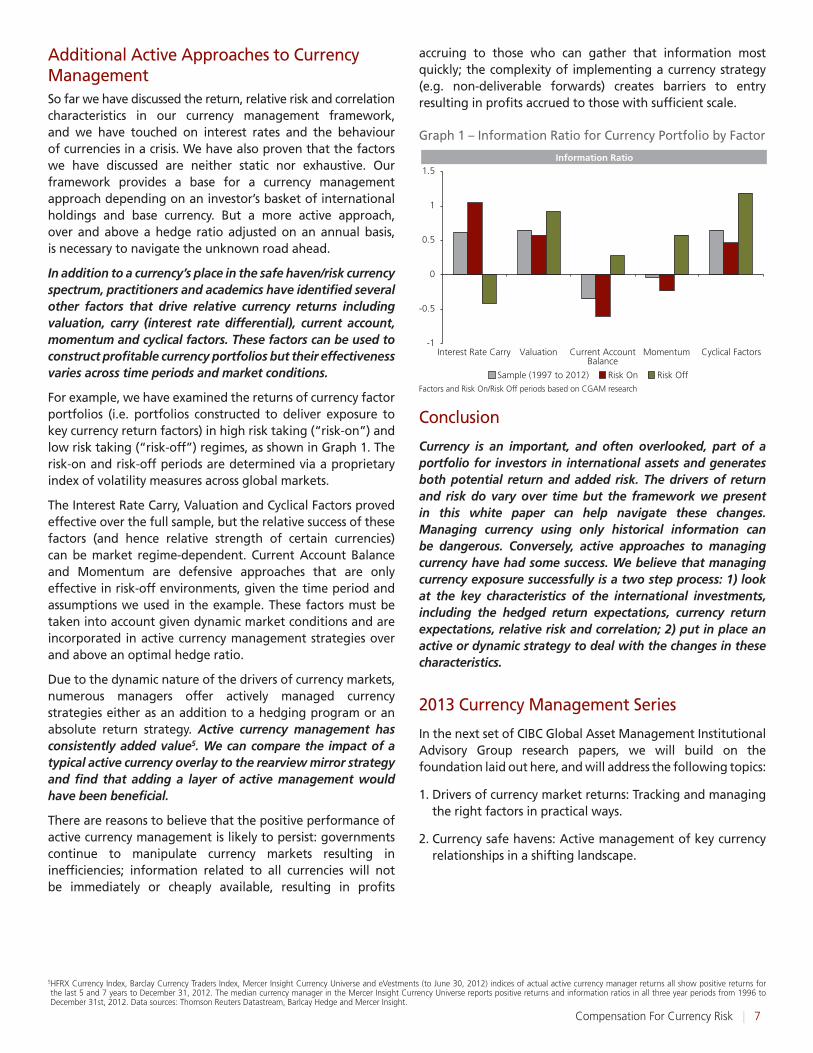
In addition to a currency’s place in the safe haven/risk currency spectrum, practitioners and academics have identified several other factors that drive relative currency returns including valuation, carry (interest rate differential), current account, momentum and cyclical factors. These factors can be used to construct profitable currency portfolios but their effectiveness varies across time periods and market conditions.
For example, we have examined the returns of currency factor portfolios (i.e. portfolios constructed to deliver exposure to key currency return factors) in high risk taking (“risk-on”) and low risk taking (“risk-off”) regimes, as shown in Graph 1. The risk-on and risk-off periods are determined via a proprietary index of volatility measures across global markets.
The Interest Rate Carry, Valuation and Cyclical Factors proved effective over the full sample, but the relative success of these factors (and hence relative strength of certain currencies) can be market regime-dependent. Current account Balance and Momentum are defensive approaches that are only effective in risk-off environments, given the time period and assumptions we used in the example. These factors must be taken into account given dynamic market conditions and are incorporated in active currency management strategies over and above an optimal hedge ratio.
Due to the dynamic nature of the drivers of currency markets, numerous managers offer actively managed currency strategies either as an addition to a hedging program or an absolute return strategy. Active currency management has consistently added value5. We can compare the impact of a typical active currency overlay to the rearview mirror strategy and find that adding a layer of active management would have been beneficial.
There are reasons to believe that the positive performance of active currency management is likely to persist: governments continue to manipulate currency markets resulting in inefficiencies; information related to all currencies will not be immediately or cheaply available, resulting in profits
accruing to those who can gather that information most quickly; the complexity of implementing a currency strategy (e.g. non-deliverable forwards) creates barriers to entry resulting in profits accrued to those with sufficient scale.
Conclusion
Currency is an important, and often overlooked, part of a portfolio for investors in international assets and generates both potential return and added risk. The drivers of return and risk do vary over time but the framework we present in this white paper can help navigate these changes. Managing currency using only historical information can be dangerous. Conversely, active approaches to managing currency have had some success. We believe that managing currency exposure successfully is a two step process: 1) look at the key characteristics of the international investments, including the hedged return expectations, currency return expectations, relative risk and correlation; 2) put in place an active or dynamic strategy to deal with the changes in these characteristics.
2013 Currency Management Series
In the next set of CIBC Global asset Management Institutional advisory Group research papers, we will build on the foundation laid out here, and will address the following topics:
1. Drivers of currency market returns: Tracking and managing the right factors in practical ways.
2. Currency safe havens: active management of key currency relationships in a shifting landscape.
5 HFRX Currency Index, Barclay Currency Traders Index, Mercer Insight Currency Universe and eVestments (to June 30, 2012) indices of actual active currency manager returns all show positive returns for the last 5 and 7 years to December 31, 2012. The median currency manager in the Mercer Insight Currency Universe reports positive returns and information ratios in all three year periods from 1996 to December 31st, 2012. Data sources: Thomson Reuters Datastream, Barlcay Hedge and Mercer Insight.
-1
-0.5
0
0.5
1
1.5
Interest Rate Carry Valuation Current AccountBalance
Momentum Cyclical Factors
Sample (1997 to 2012) Risk On Risk Off
Information Ratio
Graph 1 – Information Ratio for Currency Portfolio by Factor
Factors and Risk On/Risk Off periods based on CGAM research
8Compensation For Currency Risk |
appendix a
Relationship Between Interest Rates and Correlation to Equity Markets
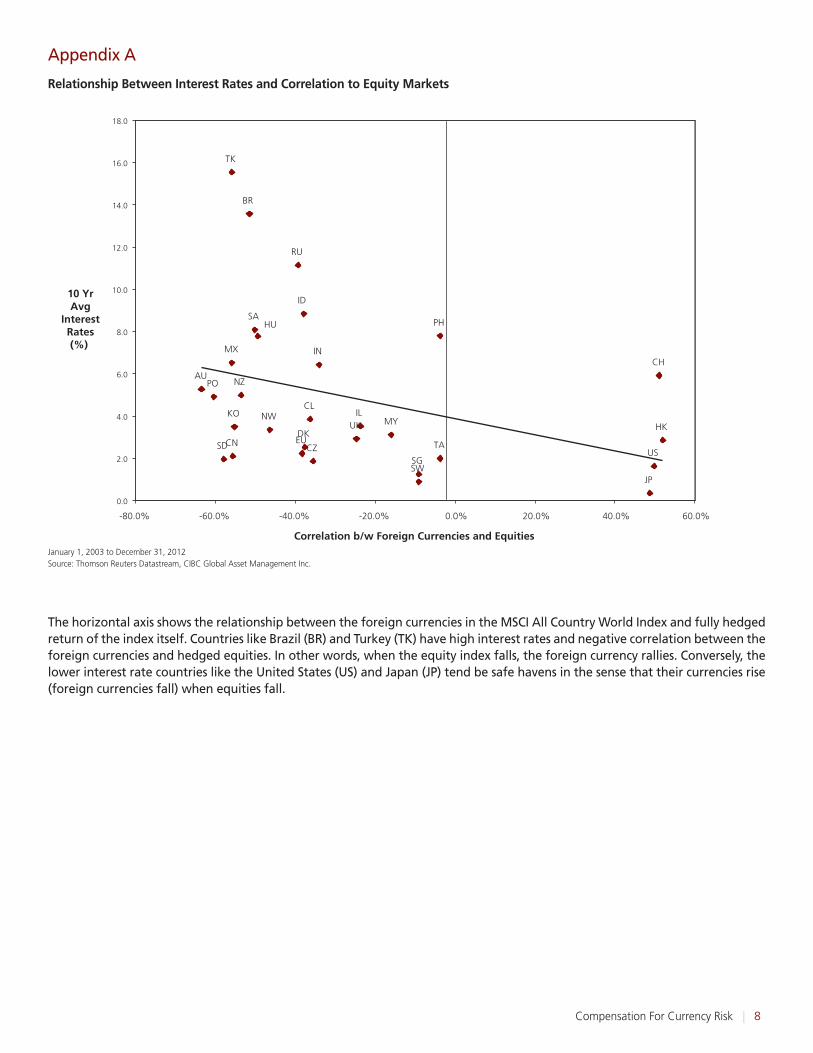
The horizontal axis shows the relationship between the foreign currencies in the MSCI all Country World Index and fully hedged return of the index itself. Countries like Brazil (BR) and Turkey (TK) have high interest rates and negative correlation between the foreign currencies and hedged equities. In other words, when the equity index falls, the foreign currency rallies. Conversely, the lower interest rate countries like the United States (US) and Japan (JP) tend be safe havens in the sense that their currencies rise (foreign currencies fall) when equities fall.
TK
TA
SA
RU
PO
PH
MYKO
IN
IL
ID
HU
HKDK
CZ
CL
CH
BR
US
UK
SWSG
SD
NZ
NW
MX
JP
EUCN
AU
0.0
2.0
4.0
6.0
8.0
10.0
12.0
14.0
16.0
18.0
-80.0% -60.0% -40.0% -20.0% 0.0% 20.0% 40.0% 60.0%
10 YrAvg
InterestRates(%)
Correlation b/w Foreign Currencies and EquitiesJanuary 1, 2003 to December 31, 2012Source: Thomson Reuters Datastream, CIBC Global Asset Management Inc.
9Compensation For Currency Risk |
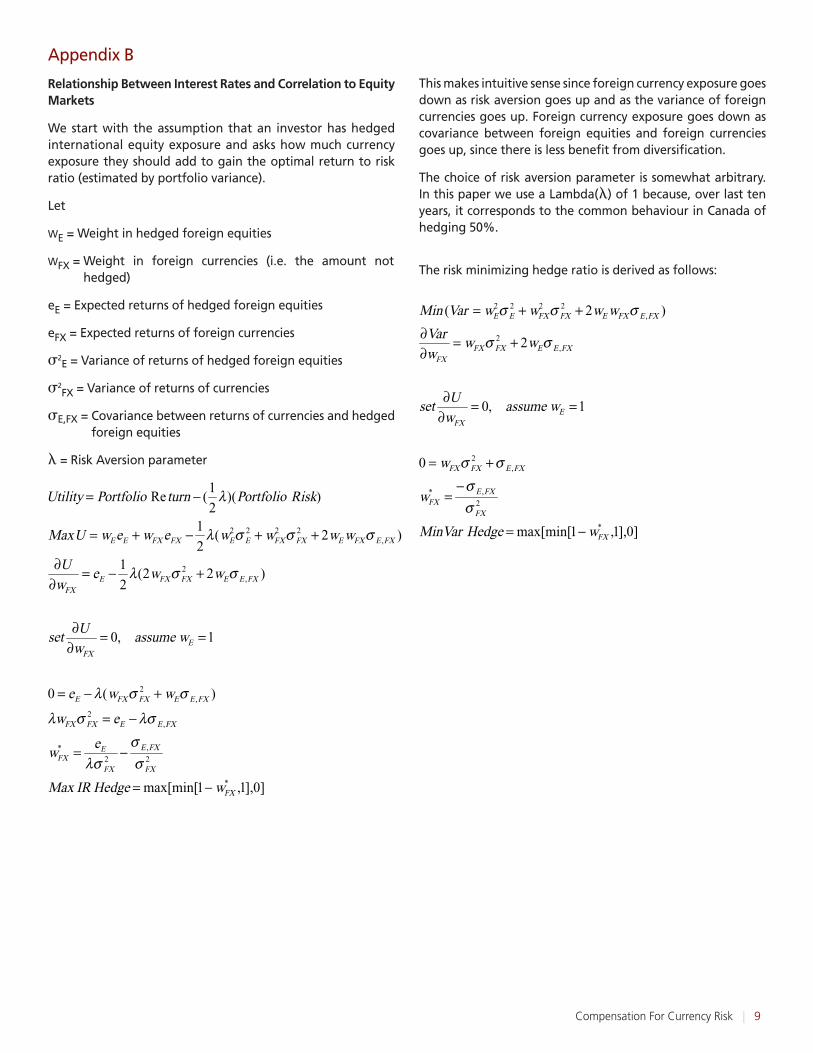
appendix B
Relationship Between Interest Rates and Correlation to Equity Markets
We start with the assumption that an investor has hedged international equity exposure and asks how much currency exposure they should add to gain the optimal return to risk ratio (estimated by portfolio variance).
Let
WE = Weight in hedged foreign equities
WFX = Weight in foreign currencies (i.e. the amount not hedged)
eE = Expected returns of hedged foreign equities
eFX = Expected returns of foreign currencies
s2E = Variance of returns of hedged foreign equities
s2FX = Variance of returns of currencies
sE,FX = Covariance between returns of currencies and hedged foreign equities
l = Risk aversion parameter
The risk minimizing hedge ratio is derived as follows:
This makes intuitive sense since foreign currency exposure goes down as risk aversion goes up and as the variance of foreign currencies goes up. Foreign currency exposure goes down as covariance between foreign equities and foreign currencies goes up, since there is less benefit from diversification.
The choice of risk aversion parameter is somewhat arbitrary. In this paper we use a Lambda(l) of 1 because, over last ten years, it corresponds to the common behaviour in Canada of hedging 50%.
This document has been prepared for the general information of our clients and does not constitute an offer or solicitation to buy or sell any securities, products or services and should not be construed as specific investment advice. The information contained in this document has been obtained from sources believed to be reliable, but we do not represent that it is accurate or complete and it should not be relied upon as such. All opinions and estimates expressed in this document are as of the time of its publication and are subject to change.
CIBC Global Asset Management Inc. uses multiple investment styles for its various investment platforms. The views expressed in this publication are the views of the Global Asset Allocation team and may differ from the views of other teams within CIBC’s integrated investment platform.
The content of this presentation is proprietary and should not be further distributed without prior consent of CIBC Global Asset Management Inc.
C I B C G l o b a l A s s e t M a n a g e m e n t