cic-14 report collection c73,’-4
TRANSCRIPT

LA-5544-PRProgress Report
CIC-14 REPORT COLLECTION
C73,’-4 REFV?ODUCTIONCOPY
Performance of Muhiple HEPA Fikers
Against Plutonium Aerosols
July 1 through December 31, 1973
)cdamosscientific laboratory
of the university of Californiaf. .
LOS ALAMOS, NEW MEXICO 87544
UNITED STATES
ATOMIC ENERGY COMMISSION
CONTRACT W-7405 -ENG, 36

This report presents the status of the Performance of Multiple HEPA
Filters Against Plutonium Aerosols at LASL. The previous quarterlies in
this series, unclassified, are:
LA-5012-PR LA-5349-P R
LA-5170-PR
In the interest of prompt distribution, this progress report was not
edited by the Technical Information staff.
Printed in the United States of America. Available from
National Technical Information Service
U. S. Department of Commerce
5285 Port Royal Road
Springfield, Virginia 22151Price: Printed Copy $4.oo Microfiche $1.45

4
d 10
)
(LA-5544-PR
Progress Report
UC-41Issued: March 1974
Iamosscientific laboratory
of the University of California
LOS ALAMOS, NEW MEXICO 87544
.
Performance of Multiple HEPA Filters
Against Plutonium AerosolsJuly 1 through December 31,1973
mi’”t. .
by
Harry J. Ettinger, Project Manager
John C. Elder
Manuel Gonzales
— -.,
*
I.
.<

PERFORMANCE OF MULTIPLE HEPA FILTERS
AGAINST PLUTONIUM AEROSOLS
by
Harry J. Ettinger, Project Manager, John C. Elder, and Manuel Gonzales
ABSTRACT
A multiple HEPA filter system has been evaluatedusing laboratory produced plutonium aerosols with sizecharacteristics substantially smaller than the 0.7–pmactivity median aerodynamic diameter (amad) attainedduring the previous reporting period.
‘mW:E;u~r:;:lpreparation by centrifugal ball milling ofsubsequent nebulization of water suspensions has pro-duced challenge aerosols with amad’s in the range 0.3 to0.5 pm, and in concentrations high enough for testingthree HEPA filters in series. These aerosols contain 10%to 30% of total activity in the aerodynamic size rangebelow 0.22 pm, allowing efficiency measurement of thefirst two HEPA filters in series for this size interval.Efficiencies of HEPA #l and HEPA #2 have exceeded 99.98%for all sizes of plutonium aerosol, including the inter-vals 0.12 to 0.22 pm and <0.12 pm. Efficiency of HEPA#3 was 99.75% expressed as the average of eight runs.Tests now in progress are expected to show that severalof the lowest HEPA #3 efficiencies (99.5%) were arti-facts caused by low level counting problems, and that theactual HEPA #3 efficiency will exceed 99.75%.
Limited field sampling at Location 00 is continuingwith spectrum analysis of impactor samples
2Yioviding
separate particle size characteristics of Pu and 239PU
mixed in the process ventilation system. In conjunctionwith this field sampling, several coating materials arebeing applied to impactor plates to further evaluateparticle rebound effects.
Calculated exposures to alpha radiation due to Puparticles collected in the HEPA filter media are comparableto exposures causing observable effects in glass containers.Poseible loss of efficiency in existing HEPA filters ex-posed to 238PU02 particles for 8 to 10 months will beinvestigated experimentally.
I. suMMARY
Major progress in evaluating the per- with these aerosols to define efficiency for
formance of three HEPA filters in series particles as small as 0.12 to 0.22 ~m. Cen-
against plutonium aerosols consisted of re- trifugal ball milling and subsequent nebuli-
ducing the Pu aerosol particle size below238zation of a PU02 water suspension have
the 0.7-Bm activity median aerodynamic diam- yielded aerosols with amad’sprimarily inthe
eter (amad) attained during the previous range 0.3 to 0.5 ~m, and in concentrations
reporting period, and testing HEPA filters high enough for testing three HEPA filters
1
in series. These aerosols contain 10 to 30%
of the total activity in the size range
under 0.22 pm, which is sufficient to test
two HEPA filters in series for this size
fraction. The milling procedures appear to
be more efficient but much of the gain in
size reduction is lost due to re-agglomera-
tion which occurs either by direct contact
of the particles while in solution, or by
the nebulizers trapping several small parti-
cles in one water droplet, and maintaining
this agglomerate during subsequent drying
of the droplet.
HEPA filter efficiencies against plu-
tonium particles in these size ranges have
been in excess of 99.98% for the first two
HEPA filters. Extremely low count rates
(=0.01 cps) downstream of the third HEPA,
resulting in poor overall counting statis-
tics at this sampling point, make efficiency
measurements for the third HEPA filter dif-
ficult to precisely define. Some recent
runs with higher aerosol concentrations
which improve statistical measurements have
resulted in efficiencies for HEPA #3 of
99.9% or better, but the average of eight
tests indicates an efficiency of 99.75%.
Efficiencies of the first two HEPA filters
against all Pu aerosol size ranges, includ-
ing 0.12 to 0.22 prn and ~0.12 pm, have been
above 99.99%.
Spectrum analysis of impactor samples
taken from process ventilation ducts at
Location 001
is providing particle size238
characteristics of Pu and 239Pu aerosols
produced by separate processes but mixed in
the ventilation system. In conjunction with
this field sampling, several coating materi-
als have been applied to ixnpactorplates to
further evaluate particle rebound effects.
Definite results in both areas are expected
in the next report period.
Investigation of alpha radiation
effects on glass indicates estimated expo-
sure in the HEPA filter media are comparable
to exposures causing observable effects in
glass containers. Efficiency testing of ex-238
isting HEPA filters exposed to PU02
particles for 8 to 10 months is scheduled.
II. EXPERIMENTAL TEST PROGRAM
Prior to this reporting period, 238PU02
test aerosols were generated by suspending
dry ball-milled powder in water, adding an
anionic surfactant, ultrasonically agitating
the suspension, and aerosolizing with a modi-
fied Retec nebulizer. Minimum aerosol
activity median aerodynamic diameter (amad)
attained by this method was approximately
0.7 pm, significantly larger than the O.1-Bm
amad measured at Location 111 in the field
sampling program. Several avenues of parti-
cle size reduction using essentially the same
experimental system and techniques for sam-
pling and generation were evaluated in order
to define the performance of HEPA filters for
particles as small as 0.1 pm. This part of
the progress report details those techniques
used to generate these smaller test aerosols,
modifications to the experimental system to
characterize these smaller particle sizes,
and the performance of HEPA filters under
these test conditions.
A. Aerosol Size Reduction
A new Geoscience centrifugal ball mill
was used to mill various batches of238PU02
for varying time intervals. To attain simi-
lar particle size reductions with this mill,
shorter milling times were anticipated be-
cause of higher rate of energy input. Mill-
ing was carried out using a carrier liquid
which was expected to reduce agglomeration.
Early wet milling procedures utilized
ethanol, but high pressures generated within
the mill enclosure necessitated a change to
water as the carrier liquid. Additional
problems were encountered as a result of
alpha activity breaking down the water to
‘2 ‘ 02, and H202, again creating high pres-
sures and explosive mixtures within the mill
jar. A continuously vented mill enclosure
was developed and pressure problems were
eliminated. The new milling procedures have
yielded aerosol amad’s ranging from 0.31 Urn
to 0.66 pm for milling times ranging from
2
44 to 119 hours. Though not reaching the de-
sired O.1-pm amad, these size distributions
do yield 16 to 30% of the material in the
size range of interest, i.e., <0.22 pm.
An aliquot of the same starting materi-
al was also heat treated at 1525°C for 11
hours and held at llOO°Cfor 6 hours to re-
store the crystalline structure of the238
PU02 which undergoes self-radiation
damage when stored for long periods. This
heat treatment was attempted to improve the
fracturability of the material by ball mill-
ing. Particle sizes attained by this method
were comparable to those previously des-
cribed but did not provide any significant
size reduction.
Chemical precipitation often used in
plutonium conversion processes was considered
a promising source of fine plutonium parti-
cles. Precipitation of the 238Pu(OH)4 yields
extremely small particles which upon
leaves 238PU02 in cake form free of
salts. This material was milled for
and generated by the Retec nebulizer
0.015” jet and again with 0.021” jet
heating
nert
17 hours
with a
The
resultant particle sizes, 0.35-Pm amad and
0.43-~m amad,respectively, did not show an
overall improvement in size reduction com-
pared to the original material.
Several reasons for below optimum
generation from the Retec nebulizer were
considered. These included: (1) the nebuli-
zers were generating droplets large enough
to contain several particles which joined
into a single agglomerate as the droplet
dried and (2) high particle concentration
in the suspensions allowed extensive agglo-
meration which could not be offset by ultra-
sonic agitation prior to generation. The
latter problem was examined early in the
program without significant improvement in
particle size at concentrations useful in
testing three HEPA stages.
Various experiments
the former concern. One
smaller jet sizes at the
to increase the velocity
ized suspension contacts
were devised to test
test involved using
same air pressure
at which the atom-
the impaction ball,
thus breaking up the water droplets into
smaller droplets. This same effect was also
tested by generating with an unmodified
generator at higher generating air pressure.
Although a slight decrease in the overall
particle size distribution was noted when
the smaller jet diameter was used, the reduc-
tion was not significant enough to warrant
routine use. Aerosol concentration was re-
duced by a factor of three by both of the
above procedures, an effect that could not
be tolerated if three HEPA filters in series
are to be tested.
In further attempts to reduce the water
droplet size produced by the Retec nebulizer,
a baffle plate was installed at the outlet
to the nebulizer to remove the larger drop-
lets by impaction and allow the smaller ones
to pass. Although some improvement was
noted, the water collected at these baffle
plates had no clear runoff area, and this
water was re-entrained in the aerosol stream,
resulting in significant quantities of water
being ejected into the main duct and running
down to HEPA filter #1. Aerosol concentra-
tion was also markedly reduced. At the con-
clusion of these tests, it was decided to
omit any baffles and to revert to the jet
diameter provided by the unmodified Retec
nebulizer. The result was a finer aerosol
at a slightly lower concentration.
The possibility that grinding actually
produces smaller individual particles, but
agglomeration immediately prior to or during
aerosol generation increased the apparent
particle size was investigated. Airborne
samples from a very dilute generator solu-
tion collected and transferred to EM grids2
indicated the presence of discrete particles
which are very small (about 0.1 - 0.2 Urn
aerodynamic diameter) with few doublets.
Airborne samples were collected from two sub-
sequent efficiency test runs (0.48-um amad)
and transferred to EM grids to check agglo-
meration of the aerosolized material. These
electron micrographs showed that even the
very small particles are made up of several
smaller individual particles (Figure 1) .
3
This points to our inability to break up the
agglomerates prior to nebulization, or to
the limitation imposed by trapping more than
one discrete PU particle within a single
aerosolized droplet.
B. Aerosol Sampling and Analysis Techniques
The sampling system ahead of each HEPA
stage has been modified to allow impactor
sampling at 1.42 x 10‘3 m3/s (3.0 cfm). As
suggested by HU3 and previously utilized
in the field sampling program,4 operation
of these impactors at higher flow rates
shifts the effective range of particle size
classification downward to include the lower
limit of the range of interest (0.1 pm).
Effective cutoff diameters for 1.42 x 10⁻³
m3/s (3.0 cfm) were calculated and compared
with Hu’s experimental results (Table I).
TABLE I
EFFEcTIvE CUTOFF DIMETERS (AEROD~WIC)OF ANDERSEN IMPACTOR OPERATED
AT 1.42 x 10⁻³ m3/s (3.0 cfm)
Staqe No.
o
1
2
3
4
5
6
7
Calculated
5.4 pm
3.4
2.3
1.5
0.96
0.44
0.22
0.12
Experimental3
2.4 ~m
1.5
0.9
0.4
0.17
As stated in the previous report,4
good
agreement exists between calculated and ex-
perimental effective cutoff diameter (ECD),
and the calculated ECD’S provide adequate
estimates of the actual ECD’S for stages 0,
1, and 7 where experimental data are lack-
ing. System modifications consisted of (1)
larger sampling probes to maintain isokine-
tic conditions, (2) individual high capacity
pumps, and (3) larger backup membrane filter
(~) holders. Sampling procedure remained
essentially the same as reported earlier
except for extension of sampling time to
120 minutes to improve the count statistics
for samples obtained downstream of HEPA
filter #3.
c. Overall HEPA Filter Efficiencies
Several runs have been made using these
smaller aerosols and operating the Andersen
impactor at a flow rate of 1.5 x 10⁻³ m3/s
(3.2 cfm) to characterize aerosol fractions
as small as 0.12 to 0.22 Urn,and cO.12 Bm.
Eight of 11 runs have been analyzed and
these data are detailed in Table II and sum-
marized in Table III. Three other runs are
undergoing analysis or being held for Rn-Th
decay.
Overall HEPA filter efficiencies for
the first and second stages were all well
within minimum criteria guidelines, with the
minimum measured efficiency for each of the
first two filters in series of >99.98%. HEPA
filter #3 in the series shows an average
efficiency of 99.75%, with a minimum effi-
ciency of 99.5o%, significantly lower than
HEPA $1 or #2. However, we believe these
lower efficiencies are an artifact, and can
be attributed to poor count statistics at
sampler #4 downstream of HEPA #3. Several
of the more recent tests employed higher
initial aerosol concentrations to increase
the challenge aerosol to HEPA filter #3.
Efficiencies for these tests are higher,
and well within minimum criteria guidelines.
Tests are also in progress using HEPA fil-
ters with quality control test data indicat-
ing efficiencies close to but not less
than 99.97%. We expect these will also
improve count statistics for the sampler
downstream of HEPA #3.
Table II also shows that aerosol size
distributions do not change significantly
with subsequent filter stages, an observa-
tion noted with larger aerosols used in1previous runs. The ag is decreased some-
what, indicating an aerosol with a narrower
size range downstream of successive HEPA
filters. However, these minor aerosol size
variations suggest that the aerosol chal-
lenging the third HEPA filter is comparable
to that for the second HEPA, and filter
performance for these filters should be the
same.
4

TABLE II
HEPA FILTER EFFICIENCY
Run
P4-1
P4-2
P4-3
P4-4
P4-5
P4-6
P4-7
P4-8
HEPAFilter~
o1*
2*
3
0
1**
2
3
0
1
2
3
0
1
2
3
0
1
2
3
0
1
2
3
0
1
2
3
0
1
2
3
Plutonium Aerosolamad(um) o
0.31
0.31
0.40
0.37
0.34
0.38
0.37
0.36
0.34
0.36
0.34
0.66
0.38
0.39
0.48
0.44
0.42
0.48
0.47
0.42
0.47
0.48
0.41
2.87
2.01
1.69
2.46
1.65
2.51
1.76
1.68
3.00
1.99
1.89
3.28
2.10
2.09
3.76
1.69
1.66
2.98
1.96
1.68
3.26
1.70
1.69
ActivityConcentra ions
alps/m5
8.0605 X 10⁸
3.7865 X 10³
6.1917 X 10°
3.6742 X 10⁻⁴
1.4234 X 10⁹
4.9045 x 10³
0.0985 X 10°
4.3328 X 10⁻⁴
3.2595 X 10⁹
2.9023 X 10³
6.8608 x 10⁻²
2.9780 X 10⁻⁴
4.0618 X 10⁹
2.7817 X 10⁴
1.4659 X 10⁻¹
9.2308 X 10⁻⁵
5.2160 X 10⁹
6.5195 X 10³
9.9495 x 10⁻²
3.3035 x 10⁻⁴
9.1352 X 10⁹
2.2060 X 10³
5.0072 X 10⁻¹
1.8115 X 10⁻⁴
4.7413 x 10⁹
2.6012 X 10⁴
2.0763 X 10⁻¹
1.9477 x 10⁻⁴
6.2885 X 10⁹
2.1143 X 10⁴
1.8053 X 10⁻¹
6.2272 X 10⁻⁵
HEPAFilter
Efficiency (%)
99.99+
99.98+
99.94
99.99+
99.99+
99.50
99.99+
99.99+
99.55
99.99+
99.99+
99.92
99.99+
99.99+
99.63
99.99+
99.99+
99.60
99.99+
99.99+
99.89
99.99+
99.99+
99.96
* Broken backup filter
** Broken backup filter - no aCtiVity
5

TABLE III
SUMMARY OF HEPA FILTER EFFICIENCY
HEPA Pu Aerosol HEPA FilterFilter amad Range Efficiency (%)
E!2?YZ2 (pm) Minimum ~s
1 0.31-0.66 99.99+ 99.99+ 99.99+
2 0.31-0.48 99.98+ 99.99+ 99.99+
3 0.34-0.42 99.50 99.75 99.96
Efficiency of the first and second HEPA
filters in series as a function of size was
also well within minimum requirements. A
computer print-out for Run P4-7 (typical of
Runs P4-1 through P4-8) is reproduced as
Table IV. This shows the HEPA filter effi-
ciency as function of particle size; the
combined protection factor (HEPA’S #1 and
#2) as a function
first
gross
two HEPA’s:
MF-1 filter
of particle size for the
filter efficiency based on
samplers upstream and
downstream of each HEPA; and the overall pro-
tection factors for two or three HEPA’s in
series. Protection factors for two HEPA’s in
series ranged from 1.3 x 10⁹ to 1.7 x 10¹¹
against aerosols 0.31-0.66 pm amad, while
for three HEPA’s the protection factor ranged
from 2.1 x 10¹² to 4.7 x 10’3. Table IV
shows these protection factors to be
1.97 x 101013
and 2.35 x 10 . Overall effi-
ciencies based on total Andersen impactor
activity agreed quite closely with the over-
all efficiencies as given by the gross MF-1
filter samplers. Aerosol concentrations for
these runs have ranged from 3.3 x 10⁹ dps/m3
up to approximately 1.7 x 10¹⁰ dps/m3. The
closer the initial aerosol concentration is
to 1.7 x 10¹⁰ dps/m3, the fewer are the low
level counting problems associated with the
sampler downstream of HEPA #3.
TABLE IV
FUJLTIPLE HEPA FILTER EFFICIENCY RUN NUMBER P6*7
RATIO CONCENTRATION ANDERSEN TO CONCENTRATION MF1SAMPLE LOCATION ONE T@ fHREE
RATIO 1.2662 1.2038 1.0907
INDIVIDUAL FILTER EFFICIENCIES PROTECTION FACTOR
RY cASCADE IMpACloR STAGES FILTER ONE AND TWO
lkcl-i FILTER 1 FILTER 2 FILTER 102S;ONE 99.999954 10U*OOOOOO .20397E*135*4O 99.999950 Iob_o*oooo ●18518E*133.39 99.999951 lolt*oooooo ●1Y019E*132.3o 99.999886 99.999903 ●45b43E+121.54 99.999674 99*999915 ●16997k+12●96 99.999070 99.998994 ●10935E+11●44 99.999264 99*999188 c16697E*11●?? 99.99964!5 99*998973 ●28075E+11●I? 99*999748 99*998957 939029E+11
SUM 99.999470 990999170 100*O6OOOO
TOTAL FILTER EFFICIENCY As GIVEN BY MFI FILTERS AND FINAL STAGE FILTERSFILTER 1 FILTER 2 FILTER 3
990999451 99.99~056 99.891)966
lJROTECTION FACTORS AS GIVEN By FILmR CoLLECTIONS
FILTER 1+2= .19681E+11 FILTER 1+2+3= .23456E+14
6
,
t
*
1

III. FIELD SAMPLING
A. Spectrum Analysis of Impactor Samples
Field sampling in process ventilation
exhaust ducts at Location 001was recently
resumed to obtain plutonium particle size
data for the two major isotopes by spectrum
analysis of impactor samples. Separation of
the 238Pu and 23’Pu size distribution in the
mixture arriving at the final filters is
obtained by comparing the alpha peaks of
each isotope and applying relative fractions
to the gross alpha activity on each impactor
stage. Size distribution by isotope can
then be expressed as mean percent activity
within a size interval or by log probability
representation (activity median aerodynamic
diameter and geometric standard deviation)
as in earlier reports. Separation of the
isotopic content permits (1) better identi-
fication of sources, since the isotopes are
not normally handled in the same building,
and (2) conversion of the amad to either
mass median or count median diameter by the
Hatch and Choate equations.5
A spectrum analysis system containing a
multichannel analyzer and silicon surface
barrier detector has been calibrated and its
alpha energy resolution optimized for the238
peaks of PU (5.5 Mev) and 239Pu (5.1 MeV).
FU1l width half maximum (FWHM) resolution at
60 to 65 keV was somewhat poorer than the 28
keV value provided by the manufacturer, but
separation of the peaks has been adequate to
allow determination of isotopic fractions.
Some degradation of alpha peaks has been
noted, probably due to greater self-absorp-
tion in larger particles and absorption in
inert material collected on the sample. In
cases where degradation of the peaks prohib-
its integrating to obtain the area under
each peak, the isotopic fraction was based
on peak height. Though a less reliable
technique, use of peak height was based on
the assumptions (1) that the presence of an
absorbing agent degraded both peaks equally
and (2) the spectrum analyzer acquires alpha
pulses of both isotopes with equal resolution.
These assumptions are believed valid due to
the close proximity of the two alpha ener-
gies and general appearance of the peaks
observed to date.
A typical set of alpha spectra is
shown in Figure 2, where the effective cut-
off diameter (ECD) for each impactor stage
is also noted. The peak on the left is239PU
. At stage O, where particles are
large, the239
Pu peak is rather seriously
degraded (probably by self-absorption),238
while very little Pu is present.
Progressing downward in cutoff diameter in
the impactor, the relative amount of238PU
increases until it dominates the total ac-
tivity present on Stage 5 (1.1 - 2.1 pm),
then diminishes somewhat on the last three
stages. In the example shown in Figure 2,
the amad and u of the mixture was 1.62 pm9
and 1.47,239
respectively; for Pu alone,
1.80 ~m and 1.63; and for 238Pu alone,
1.55 pm and 1.37. Neither component departs
significantly from the characteristics of
the mixture in this instance, but more data
will be necessary to develop a clear pic-
ture of predominant particle size intervals
of individual isotopes. Wide variations in
isotopic ratios have been observed, necessi-
tating additional samples and analysis.
B. Particle Rebound Effects on Several
Impactor Plate Coatings
In conjunction with the field sampling
for isotopic particle size distributions
described above, an identical arrangement of
two Andersen impactors provided a means for
evaluating particle rebound from several im-
paction surfaces: bare stainless steel,
glass fiber filters, vinyl membrane filters,
or the Millipore AA membrane filter utilized
in the laboratory experiment. In the ab-
sence of a known aerosol size distribution,
these rebound effects must be measured rela-
tive to a reference surface such as the glass
fiber filter. Glass fiber filter media has
been noted as an effective anti-rebound
agent. As reported earlier,4 vinyl membrane
filters showed no evidence of rebound at
normal flow (1.0 cfm) and very little at
7
elevated flow (3.0 cfm). However, more pre-
cise data are desired for the Millipore AA
membrane filter. The data are gathered by
sampling with two matched impactor systems
from the same location at the same time,but
with one impactor coated with reference
media. Any difference in amad or percent
activity on a given stage could be atti-
buted to particle rebound from the test
media. The experiment is still in early
stages of system matching and has produced
no reportable data.
IV. EFFECT OF ALPHA RADIATION ON HEPA
FILTER MEDIA
Investigation into possible mechanisms
of HEPA filter efficiency loss has continued
in the area of radiation damage to glass
fiber media by alpha emitters. The postu-
lated efficiency loss is based on particles
of high specific activity causing repeated
fiber breakage, leading to reduced numbers
of fibers which airborne particles must
escape in traversing the filter mat.
Alpha radiation can damage glass under
certain conditions, particularly noted as
silica leached from Pyrex bottles contain-
ing acid solutions of alpha-emitting com-
pounds.6,7,8
Pyrex and the glass used in
some brands of HEPA filters are borosilicate
glass. Damage to Pyrex containers appeared
as very fine cracks7 after exposure to an
integrated alpha flux on the order of 1020
ci/m2. Leaching of silica has been observed
at exposures as low as 1018 a/m2. Specific
reference to glass fiber damage by alpha
radiation was not found.
Assuming the chief mode of failure of
glass fibers is by cracking as observed in
Pyrex glass surfaces and also assuming the
thickness of affected surface exceeds the
diameter of glass fibers, breakage depends
on the integrated alpha flux in the fiber
from a particle of high specific activity in
direct contact with the fiber. M estimate
of the integrated flux in a fiber (nominal
0.5-vm diameter) in contact with a 10-pm
diameter spherical particle of 238PU02 for
one vear was obtained as follows:.Model: A 10 pm spherical
238PU02 particle
rests in contact with a glass
fiber 0.5 Urnin diameter.
Data: Particle density 1.0 x 10⁴ Kg/m3
Alpha energy (E=)5.5 MeV
Specific activity (AS)3.42 x 10²⁰-1 m-3min
Alpha range: 11 pm in PU029
28.5 pm in glass7
Assumptions:
(1) All alpha particles emitted
inside the 10-vm sphere es-
cape the sphere.
(2) Alpha flux at the particle
surface is uniform.
(3) All alpha particles escaping
the sphere traverse the fiber
linearly transferring energy
to the fiber at about 105
eV/pm.7
Calculations :
(1) Particle Emission Rate A=
A = As x particle volum~
A: = 3.42 X 10²⁰ XP
: (1.0 x 10⁻⁵)3
A = 1.8 x 10⁵ min-1D
(2) Aipha Flux at Particle Surface
$ = A-/surface areaP
‘$=1.8 X 10⁵
n (1.0 x 10⁻⁵)2
$ = 5.7 X 10¹⁴ rein-l m-2
(3) Integrated Alpha Bombardment
Per Year
$1 = + x time
~1 = 5.7 X 1014 X 5.24 X 105-1min yr
$1 = 3.0 x 10²⁰ m-2 yr-l
The calculated value of 3 x 10²⁰ m-2-1
yr is in the range of observed effects
previously noted. Although this result sug-
gests the possibility of alpha damage as a
cause of HEPA efficiency loss, the idea of
one particle taking one year to break one
fiber must be expanded to many particles
breaking fibers before a significant effi-
ciency loss could be expected.
8
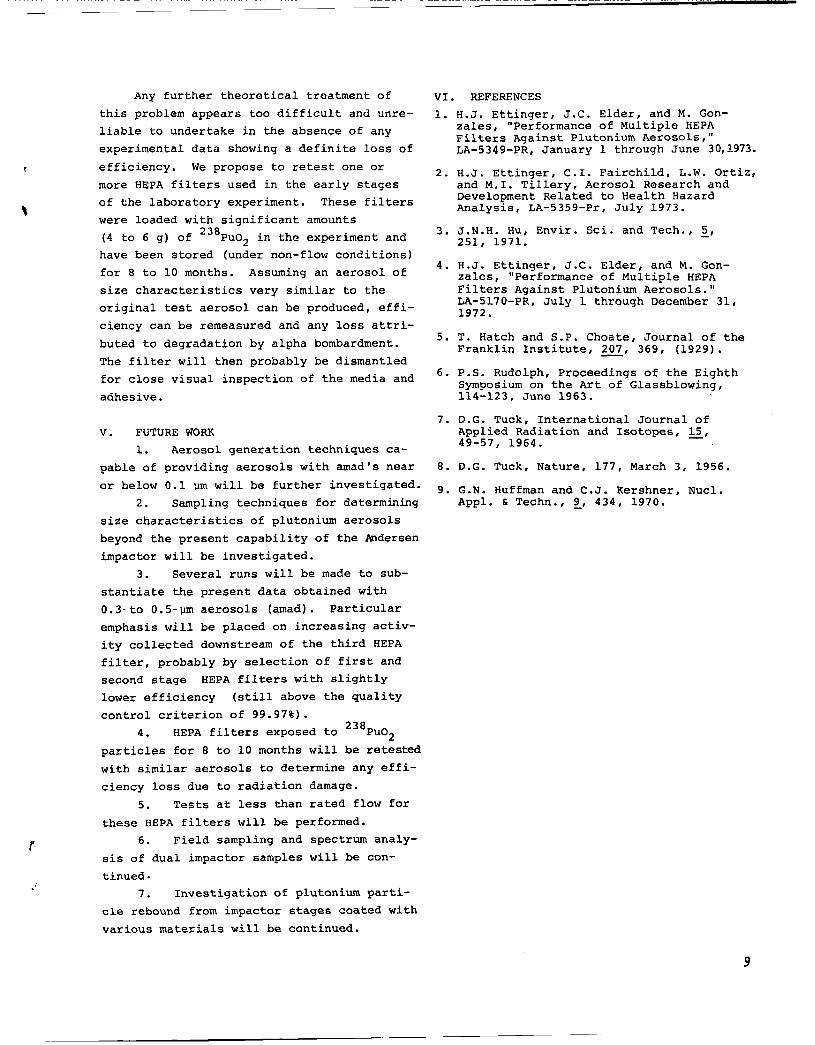
Any further theoretical treatment of
this problem appears too difficult and unre-
liable to undertake in the absence of any
experimental data showing a definite loss of
efficiency. We propose to retest one or
more HEPA filters used in the early stages
of the laboratory experiment. These filters
were loaded with significant amounts
(4 to 6 g) of 238PU02 in the experiment and
have been stored (under non-flow conditions)
for 8 to 10 months. Assuming an aerosol of
size characteristics very similar to the
original test aerosol can be produced, effi-
ciency can be remeasured and any loss attri-
buted to degradation by alpha bombardment.
The filter will then probably be dismantled
for close visual inspection of the media and
adhesive.
v. FUTURE WORK
1. Aerosol generation techniques ca-
pable of providing aerosols with amad’s near
or below 0.1 Urnwill be further investigated.
2. Sampling techniques for determining
size characteristics of plutonium aerosols
beyond the present capability of the Pndersen
impactor will be investigated.
3. Several runs will be made to sub-
stantiate the present data obtained with
0.3-to 0.5-pm aerosols (amad). Particular
emphasis will be placed on increasing activ-
ity collected downstream of the third HEPA
filter, probably by selection of first and
second stage HEPA filters with slightly
lower efficiency (still above the quality
control criterion of 99.97%).
4. HEPA filters exposed to 238PU02
particles for 8 to 10 months will be retested
with similar aerosols to determine any effi-
ciency loss due to radiation damage.
5. Tests at less than rated flow for
these HEPA filters will be performed.
6. Field sampling and spectrum analy-
sis of dual impactor samples will be con-
tinued.
7. Investigation of plutonium parti-
cle rebound from impactor stages coated with
various materials will be continued.
VI. REFERENCES
1.
2.
3.
4.
5.
6.
7.
8.
9.
H.J. Ettinger, J.C. Elder, and M. Gon-zales, “Performance of Multiple HEPAFilters Against Plutonium Aerosols,”LA-5349-PR, January 1 through June 30,1973.
H.J. Ettinger, C.I. Fairchild, L.W. Ortiz,and M.I. Tillery, Aerosol Research andDevelopment Related to Health HazardAnalysis, LA-5359-Pr, July 1973.
J.N.H. Hu, Envir. Sci. and Tech., ~,251, 1971.
H.J. Ettinger, J.C. Elder, and M. Gon-zales, “Performance of Multiple HEPAFilters Against Plutonium Aerosols.”LA-5170-PR, July 1 through December 31,1972.
T. Hatch and S.P. Choate, Journal of theFranklin Institute, 207, 369, (1929).
P.S. Rudolph, Proceedings of the EighthSymposium on the Art of Glassblowing,114-123, June 1963.
D.G. Tuck, International Journal ofApplied Radiation and Isotopes, ~,49-57, 1964.
D.G. Tuck, Nature, 177, March 3, 1956.
G.N. Huffman and C.J. Kershner, Nucl.Appl . & Techn., 9_,434, 1970.
9

—.
. . . . . . . .. .~-.. .- ..=. =.:d:..-.%----- .. .
~.>..
k-.
,.. —. . . . . . —-—
.:-. ..—.—. ...—. .. . T ...=. -~
--—.. = *. - ‘-’-~~ “-’” -. -q’ ”-m ““”” ‘-——---”Te . . ------
——— ——____.. —---- ——._—= , -u”:. .-.--=, .---. ..-— .,.--. = : -— -: -.. .—— --- —-.—.—. . . . .. —- . A. .-—.
—...-—
.
-=.:~-! * ..,%__.-+“.-:F&&++”$CZ”i . . ~......_ ....~
.. ..
PLLTONIUMOXIDEAEROSOL
Figure 1. Electronmicrograph ofPlutonium Oxide Aerosol.
10
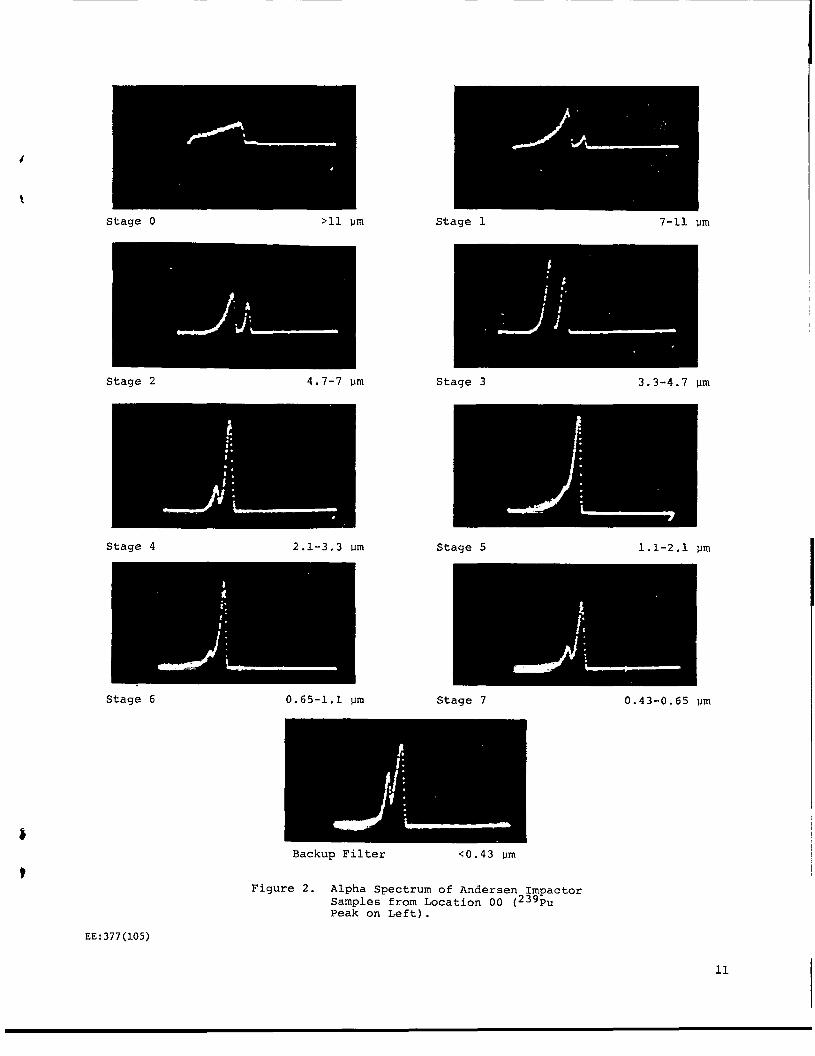
Stage O >11 pm Stage 1 7-11 urn
Stage 2 4.7-7 Mm Stage 3 3.3-4.7 pm
Stage 4 2.1-3.3 pm Stage 5 1.1-2.1 pm
Stage 6 0.65-1.1 pm Stage 7 0.43-0.65 urn
Backup Filter ~0.43 urn
Figure 2. Alpha Spectrum of Andersen ImpactorSamples from Location 00 (239PuPeak on Left).
EE:377(105)
11