cid ruzafa, j; merinopoulou, e; baggaley, rf; leighton, p...
TRANSCRIPT

Cid Ruzafa, J; Merinopoulou, E; Baggaley, RF; Leighton, P; Werther,W; Felici, D; Cox, A (2016) Patient population with multiple myelomaand transitions across different lines of therapy in the USA: an epi-demiologic model. Pharmacoepidemiology and drug safety, 25 (8).pp. 871-9. ISSN 1053-8569 DOI: https://doi.org/10.1002/pds.3927
Downloaded from: http://researchonline.lshtm.ac.uk/2703438/
DOI: 10.1002/pds.3927
Usage Guidelines
Please refer to usage guidelines at http://researchonline.lshtm.ac.uk/policies.html or alterna-tively contact [email protected].
Available under license: http://creativecommons.org/licenses/by-nc-nd/2.5/

For Review O
nly
Patient population with multiple myeloma and transitions
across different lines of therapy in the US: an epidemiologic model
Journal: Pharmacoepidemiology and Drug Safety
Manuscript ID PDS-15-0194.R1
Wiley - Manuscript type: Original Research Article
Date Submitted by the Author: n/a
Complete List of Authors: Cid Ruzafa, Javier; Evidera, Retrospective Observational Studies
Merinopoulou, Evie; Evidera, Retrospective Observational Studies Baggaley, Rebecca; London School of Hygiene & Tropical Medicine, Department of Infectious Disease Epidemiology Leighton, Pamela; Evidera, Retrospective Observational Studies Werther, Winifred; Onyx Pharmaceuticals, Inc., an Amgen subsidiary, Epidemiology Felici, Diana; Onyx Pharmaceuticals, Inc., an Amgen subsidiary, Epidemiology Cox, Andrew; Evidera, Retrospective Observational Studies
Keywords: Epidemiology, multiple myeloma, prevalence, model, treatment line
Abstract:
Multiple myeloma (MM) is a progressive, malignant neoplasia with a worldwide, age-standardized annual incidence of 1.5 per 100,000
individuals and 5-year prevalence around 230,000 patients. Main favorable prognostic factors are younger age, low-moderate cytogenetic risk, and undergoing stem cell transplantation. Our aim was to estimate the size of the patient population with MM eligible to receive a new MM therapy at different lines of therapy in the US. Methods: We constructed a compartmental, differential equation model representing the flow of MM patients from diagnosis to death, via two possible treatment pathways and distinguished in four groups based on prognostic factors. Parameters were obtained from published references, available statistics, and assumptions. The model was used to estimate number of diagnosed MM patients and number of patient transitions from one line of therapy to
the next over one-year. Model output included 95% credible intervals (CI) from probabilistic sensitivity analyses. Results: The base-case estimates were 80,219 patients living with MM, including 70,375 on treatment, 780 symptomatic untreated patients, and 9,064 asymptomatic untreated patients. Over a one-year period, the number of MM patients on treatment line 1 was estimated at 23,629 (CI 22,236-25,029), and the number of transitions from treatment line 1 to treatment line 2 estimated at 14,423. Conclusions:
http://mc.manuscriptcentral.com/pds
Pharmacoepidemiology and Drug Safety
For Review O
nly
The size of the patient population with MM on different lines of therapy and in-patient subgroups of interest estimated from this epidemiologic model can be used to assess the number of patients who could benefit from new MM therapies and their corresponding budgetary impact.
Page 1 of 50
http://mc.manuscriptcentral.com/pds
Pharmacoepidemiology and Drug Safety
123456789101112131415161718192021222324252627282930313233343536373839404142434445464748495051525354555657585960

For Review O
nly
1
Patient population with multiple myeloma and transitions across different lines of therapy in the US: an epidemiologic model
Running Head: Multiple myeloma lines of therapy: an epidemiologic model
Cid Ruzafa J1, Merinopoulou E1, Baggaley RF2, Leighton P1, Werther W3, Felici D3, Cox A1
1 Retrospective Observational Studies, Evidera, London, UK; 2 Department of Infectious Disease Epidemiology, London School of Hygiene & Tropical Medicine, London, UK; 3 Onyx
Pharmaceuticals, Inc., an Amgen subsidiary, South San Francisco, CA, USA
Keywords: Epidemiology, multiple myeloma, prevalence, model, treatment line
Key Points:
- The estimated number of patients with MM in the US provided by the epidemiology
model was consistent with the figure reported by SEER.
- The distribution of the patient population with MM on different lines of therapy and in
patient subgroups of interest can be estimated from the epidemiologic model.
- The size of the patient population with MM on different lines of therapy and in patient
subgroups can be used to assess the number of patients who could benefit from new
MM therapies, information required for budget impact analysis and to support the
planning of healthcare services.
Word Count: 2,751 (excluding abstract, references, tables, etc.)
Sponsors/Conflict of Interest:
This work was funded by Onyx Pharmaceuticals. Cid Ruzafa J, Merinopoulou E, Baggaley R, Leighton P, and Cox A were employed by Evidera and served as consultants to Onyx Pharmaceuticals. Werther W and Felici D were employed by and own stock in Onyx Pharmaceuticals.
Corresponding Author:
Javier Cid Evidera Metro Building, 6th Floor, 1 Butterwick London, UK W6 8DL [email protected] Tel +34 932 213 441 Fax + 44 (0) 208 576 5195
This research represents original work and has not been published elsewhere in full or in part, besides in abstract form. Javier Cid takes responsibility for the integrity of the work as a whole.
Page 2 of 50
http://mc.manuscriptcentral.com/pds
Pharmacoepidemiology and Drug Safety
123456789101112131415161718192021222324252627282930313233343536373839404142434445464748495051525354555657585960

For Review O
nly
2
ABSTRACT
Purpose:
Multiple myeloma (MM) is a progressive, malignant neoplasia with a worldwide, age-
standardized annual incidence of 1.5 per 100,000 individuals and 5-year prevalence around
230,000 patients. Main favorable prognostic factors are younger age, low-moderate
cytogenetic risk, and undergoing stem cell transplantation. Our aim was to estimate the size
of the patient population with MM eligible to receive a new MM therapy at different lines of
therapy in the US.
Methods:
We constructed a compartmental, differential equation model representing the flow of MM
patients from diagnosis to death, via two possible treatment pathways and distinguished in
four groups based on prognostic factors. Parameters were obtained from published
references, available statistics, and assumptions. The model was used to estimate number
of diagnosed MM patients and number of patient transitions from one line of therapy to the
next over one-year. Model output included 95% credible intervals (CI) from probabilistic
sensitivity analyses.
Results:
The base-case estimates were 80,219 patients living with MM, including 70,375 on
treatment, 780 symptomatic untreated patients, and 9,064 asymptomatic untreated patients.
Over a one-year period, the number of MM patients on treatment line 1 was estimated at
23,629 (CI 22,236-25,029), and the number of transitions from treatment line 1 to treatment
line 2 estimated at 14,423.
Conclusions:
The size of the patient population with MM on different lines of therapy and in-patient
subgroups of interest estimated from this epidemiologic model can be used to assess the
number of patients who could benefit from new MM therapies and their corresponding
budgetary impact.
Word count: 250
Page 3 of 50
http://mc.manuscriptcentral.com/pds
Pharmacoepidemiology and Drug Safety
123456789101112131415161718192021222324252627282930313233343536373839404142434445464748495051525354555657585960

For Review O
nly
3
INTRODUCTION
Multiple myeloma (MM) is a progressive, hematologic malignancy originating from plasma
cells and with the most negative long-term prognosis among lymphoid malignancies.1,2 MM
accounts for approximately 1% of all cancers and 10-12% of hematologic malignancies, with
a worldwide age-standardized annual incidence of 1.5 per 100,000 or estimates of around
115,000 new cases per year, a rather small number compared to other cancers and chronic
conditions.2-4 MM has an estimated worldwide 5-year prevalence of around 230,000
patients.4 Older age is associated with unfavorable outcomes,1,5 and there are no apparent
prognostic differences associated with gender.1 The presence of certain chromosomal
abnormalities is also a negative prognostic factor.5-8
MM treatment is intended to control the symptomatic disease and minimize organ damage;
however, relapse is likely. From high-dose therapy followed by autologous stem cell
transplantation for candidates in good condition,7,9 to allogeneic stem cell transplantation
(SCT) in young patients with high-risk disease,7,10 and to novel agents introduced in recent
years,2,7,11,12 all are associated with prolonged survival of patients with this incurable
disease.5,7,9,13-15 More than 10 drugs and a greater number of drug combinations offer
therapeutic options to patients who have relapsed or are refractory to previous treatments
and can result in patients receiving multiple lines of therapy.5,7 The prevalence of MM is
likely to increase as a result of ageing societies and improved survival of patients. Multiple
lines of therapy for an increasing number of patients with MM translate into increasing
resource requirements at subsequent lines of therapy16 and competition among MM
treatment alternatives on pharmacoeconomic grounds.17-19
Epidemiologic information including disease incidence, prevalence and mortality are inputs
for burden of disease and cost-effectiveness analyses that aim to inform policy-making,
planning and research prioritization in health care.20 Previous studies have used
mathematical modeling techniques to project the prevalence of chronic conditions such as
diabetes and chronic kidney disease into the near or distant future.21-23 In oncology, an
epidemiologic model was used to estimate disease prevalence and the absolute number of
patients at first-, second-, and third line of therapy for gastrointestinal stromal tumors,24
providing useful information for budget impact analysis and healthcare services planning.20
In the absence of current data on the number of patients with MM by line of therapy in the
US, the objectives of this study were to estimate the current number of patients with MM who
are potentially eligible to receive a new MM therapy at different lines of therapy in the US,
and to estimate the corresponding number of patient transitions from one line of therapy to
the next over a one-year period.
Page 4 of 50
http://mc.manuscriptcentral.com/pds
Pharmacoepidemiology and Drug Safety
123456789101112131415161718192021222324252627282930313233343536373839404142434445464748495051525354555657585960

For Review O
nly
4
METHODS
Model Overview
The size of the patient population with MM in the US across lines of therapy and the number
of patient transitions from one line of therapy to the next was estimated using a
compartmental model that represents the flow of patients with MM from disease occurrence
to death, via two possible treatment pathways (SCT eligible; SCT non-eligible) (Figure 1). To
account for the impact of different risk factors on disease progression,1,5-8 the model
distinguished four groups of patients based on age at diagnosis and cytogenetic risk: older
or younger than 65 years of age, and high or low/standard cytogenetic risk (Figure 1, as
depicted by dotted lines).
All newly diagnosed patients with MM enter the model as symptomatic or asymptomatic.
Asymptomatic patients are assumed to receive no treatment until symptom occurrence.
Symptomatic patients can transition through two treatment pathways depending on whether
they are eligible for an SCT or not. Patients in both pathways progress from one line of
therapy to the next as they relapse. For patients eligible for a SCT, the first line of therapy
represents induction, SCT and maintenance therapy post SCT. In each treatment line,
patients are allowed to die from background mortality or mortality related to their condition.
Eventually, all patients will die since the model assumes there is no cure for MM.
The model consists of a set of four differential equations which represent a mean
approximation of the expected number of asymptomatic, symptomatic untreated, individuals
who initiated on first line, and on subsequent treatment lines through time (Appendix A). The
model parameters include estimates of MM incidence, mortality, and time to next treatment
line (Table 1, Appendix A). The base case parameter values are shown in Table 1.
This model includes a number of assumptions necessary for its correct interpretation:
• Results for all lines beyond 17 are incorporated into the 17th line.
• Patients on the SCT pathway may have up to two SCTs along their line therapy trajectory.
• Asymptomatic MM (smoldering) is explicitly modeled, but no treatment is given.
• Patterns of co-morbidities (e.g., peripheral neuropathy) are not explicit.
• The model tracks time between starting one treatment line and starting the next. Treatment breaks and permanent discontinuations are not explicitly modelled.
• There is no stratification for academic versus community care (for settings where these different care types exist).
• Line of therapy is determined by disease progression, relapse, or drug toxicity resulting in a modification of the planned therapeutic approach.25
• Being in the high-risk cytogenetic group does not affect SCT eligibility.
Page 5 of 50
http://mc.manuscriptcentral.com/pds
Pharmacoepidemiology and Drug Safety
123456789101112131415161718192021222324252627282930313233343536373839404142434445464748495051525354555657585960

For Review O
nly
5
• Survival probabilities are characterized by an exponential function.
• The length of each treatment line is shorter than the previous one. Minimum length of a treatment line is approximately one week (1/50 year).
• Relative rate of patients transitioning from one line to another is constant across all lines.
• MM-related mortality while symptomatic before first line treatment initiation is slightly
higher (≈10%) than MM-related mortality while asymptomatic.
• MM attributable mortality declines in the first year because of plasma cell leukemia patient depletion from the cohort. It is relatively constant over the subsequent years
(≈10% increase) but then increases, especially from the 6th line of therapy and beyond
• Forecasts are at the population level and not at the individual level.
Data Sources
To estimate the overall number of patients with MM, we used the incidence of MM obtained
from Surveillance Epidemiology and End Results (SEER) Cancer Statistics26 applied to the
2013 US population estimate from the US Census Bureau.27 Mortality rates were obtained
from 2007 US National Vital Statistics.28 Other model parameters were obtained from
targeted literature searches (Table 1). For each of these parameters, one or more
references were identified from the literature. Internal validity of the parameter estimates
obtained from the literature (or the degree to which the referenced studies are free from
systematic error) is supported by the peer review process of such studies, consistency of
results, and for some parameters, information provided from interviews with MM experts and
market research surveys. External validity of the parameter estimates (or the degree to
which those estimates can be applied to the overall population) is also expected, since the
parameters’ base-case values were chosen around mid-range values and the study results
were consistent. Some references provided data in the format required by the model, while
others required transformation. For example, survival figures expressed as percentage of
surviving patients at a specific time after diagnosis or treatment initiation required
transformation into yearly rates before they could be included in the model. No ethical
committee approval was necessary for this study.
Sensitivity Analysis
Parametric uncertainty analyses were conducted through probabilistic sensitivity analysis
(PSA). The PSA was performed on key selected model parameters29 using Latin hypercube
sampling (LHS).30 This process involved two steps: first, parameters expected to influence
model output were selected for inclusion in the PSA, and partial rank correlation coefficients
(PRCCs) were then computed (Appendix B, Figure B-1) to illustrate the parameters that
were the greatest sources of heterogeneity in model output.31 Secondly, the PSA consisted
Page 6 of 50
http://mc.manuscriptcentral.com/pds
Pharmacoepidemiology and Drug Safety
123456789101112131415161718192021222324252627282930313233343536373839404142434445464748495051525354555657585960

For Review O
nly
6
of varying the parameter values by sampling 1000 times from distributions specified by the
mean value (deterministic model input) and standard errors (Appendix B, Table B2).
Standard errors were selected to describe parameter variability observed in the data sources
and expected in the broad population of patients with MM. Distributions were determined by
the characteristics of the parameter and experience (e.g. beta distributions are usually
considered for binomial data; gamma or log normal for right skew parameters; log normal for
hazard ratios.32)
Model Outcomes
Model outcomes include the size of the patient population with MM potentially eligible to
receive a MM therapy at different lines of therapy in the US, as well as the corresponding
number of patient transitions from one line of therapy to the next over a one-year period. The
model is designed to report outcomes at equilibrium, which is judged to have been achieved
when the model reaches a steady state, in that the number of patients in each line no longer
fluctuates and remains stable. All model outcomes are stratified by the eight subgroups of
interest resulting from the combination of SCT eligibility, age group, and cytogenetic risk
group. Model outcomes also include 95% credible intervals (analogous to a confidence
interval with estimates obtained from the sampling results) from the PSA for both the number
of patients and their transitions at different lines of therapy. Ninety five percent (95%)
credible intervals were defined by the upper and lower bounds of the distribution of model
outcomes from the PSA leaving 2.5% of the values below and above, respectively.
RESULTS
Prevalence of MM
Model results are presented in Table 2. An estimated 80,219 patients were living with
diagnosed MM in the US, of whom 70,375 patients were receiving treatment, 780 patients
were symptomatic untreated and 9,064 patients were asymptomatic who are untreated and
would be monitored for progression to symptomatic MM. Patient numbers stratified by SCT
eligibility, age group, and cytogenetic risk group are shown in Table 2. Additionally, the
model estimated that 19,330 patients with MM would die over a one-year period from
background mortality and mortality attributable to MM.
Patient Transitions from One Line of Therapy to the Next
Table 3 reports the number of patient transitions from one line of therapy to the next over a
one-year period, estimating that the total number of transitions experienced by the above
patient population would be 96,259. A total of 18,689 patients diagnosed with MM are
estimated to initiate first line therapy over a one-year period. Patients entering into treatment
Page 7 of 50
http://mc.manuscriptcentral.com/pds
Pharmacoepidemiology and Drug Safety
123456789101112131415161718192021222324252627282930313233343536373839404142434445464748495051525354555657585960

For Review O
nly
7
line 17 and beyond were estimated at 167. Results stratified by SCT eligibility, age group,
and cytogenetic risk group are also presented in Table 3.
PSA results
The results of the PSA are in Table 4, estimating 95% credible intervals (CI) for numbers of
MM patients and the numbers of patient transitions from one line of therapy to the next. The
results corresponding to the eight strata of interest defined by SCT eligibility, age group, and
cytogenetic risk group are shown in Appendix C. The PSA model runtime was around three
hours.
DISCUSSION
The current estimated number of patients with MM in the US is 80,219, with 70,375 on
different lines of therapy. Over a one-year period, 19,330 deaths from all causes would be
expected as well as 14,423 transitions from line 1 into line 2. The estimated number of
patients initiating line 1 of therapy over one year is 18,689. Beyond line 17 of treatment, as
anticipated, the patient prevalence was close to 0, although the number of transitions over a
one year period could be larger as a consequence of the short time spent in those lines of
therapy when the condition is so advanced.
The model estimates of the patient distribution across the different lines of therapy, from the
first to 17th line and beyond, at a snapshot in time, differed from the patient transition
breakdown over a one-year period. For early lines of therapy, lines 1 and 2, the number of
patient transitions over a one-year period was smaller than the number of patients at a point
in time, as a consequence of these patients spending long periods on treatment, or without
receiving treatment but free of disease progression and drug toxicity.25 At subsequent lines
of therapy, the number of patient transitions decreased more slowly than the number of
patients reflecting that the average patient spends shorter periods on successive treatment
lines and eventually can transition through several lines of therapy over a one-year period.
The estimated number of patients with MM in the US provided by the model, 80,219, was
consistent with the figure estimated by SEER for 2014 of 83,367 patients. Conversely, the
number of patients with MM who died of this disease over a one-year period was estimated
at 11,090 (SEER data from 2014),26 while the model estimate was 16,670. This difference is
larger than expected because one would anticipate that the number of deaths over a one-
year period is somehow lower than the number of new patients being diagnosed, as a result
of the range of novel therapeutic alternatives providing increased patient survival over time.
The expected small difference between incident cases and patient mortality would translate
into a continuous steady increase of the prevalence of MM. The observed large difference in
Page 8 of 50
http://mc.manuscriptcentral.com/pds
Pharmacoepidemiology and Drug Safety
123456789101112131415161718192021222324252627282930313233343536373839404142434445464748495051525354555657585960

For Review O
nly
8
the SEER data between incident cases and patient mortality would result in the prevalence
of patients with MM increasing greatly over a short period. We hypothesize that the large
difference between the mortality estimates of the model and those of SEER could be
attributable to SEER reporting only mortality attributed to MM and not all mortality
experienced by patients with MM, and also to a proportion of deaths caused by MM not
being correctly classified as such (resulting in apparently increased background mortality
among patients with MM).
We have not identified any other epidemiologic models reporting on patients with MM.
Nevertheless, there are several studies reporting on the use of epidemiologic models for
other oncologic conditions such as prostate cancer,33,34 breast cancer,35 Hodgkin’s
lymphoma,36,37 chronic myeloid leukemia,38 and gastrointestinal stromal tumors.24 The
rationale for developing such models is consistent with the objectives of the model presented
in this paper: while the epidemiology of these conditions is well documented, estimates of
patient numbers and their distribution across subgroups of interest are scarce in the
literature.24,33,35-37 Other research groups have developed similar models for such predictive
purposes.34,38
Estimates of numbers of patients in groups of interest produced by epidemiologic models
can inform budget impact analysis and support planning of healthcare services by limiting
the uncertainty associated with identifying patient numbers eligible for a given treatment.20,34
This contribution can be especially relevant for conditions that have low frequency, and
hence are difficult to study, but could qualify for orphan designation and the corresponding
support for research and treatment development.24,39
The model used has a complex structure and requires a large number of parameters. This is
the consequence of modelling a complex condition whose treatment is also complex. A
positive aspect is that the reported estimates provide a detailed picture of the patient
population with MM. On the other hand, complexity is a limitation when it comes to finding
supportive data for the parameters that inform the model. As a consequence, some
parameters are supported by only one or a few sources. This limitation is common to other
modeling studies.24 Some prognostic factors of the condition such as tumor staging or renal
function5 were not included separately in the model. One limitation of the model to estimate
the real difference between incident cases and patient mortality is that, by definition, in the
model at equilibrium the number of incident patients with MM is the same as the number of
patients dying from MM and background mortality combined. Using this dynamic model to
look at projections for how the MM patient population will change over time would be of
interest but it is not within the scope of this project.
Page 9 of 50
http://mc.manuscriptcentral.com/pds
Pharmacoepidemiology and Drug Safety
123456789101112131415161718192021222324252627282930313233343536373839404142434445464748495051525354555657585960

For Review O
nly
9
Further research on the epidemiology of patients with MM will support more robust
parameter estimates that can be used in this and other models. Other parameters may
become pertinent to modeling prevalence of lines of therapy in patients with MM, which may
warrant additional research and model development. Different stratification variables, such
as disease stage or new risk classification, may prove important in further research.
Additionally, future real world study results reporting on patient population and
subpopulations at different lines of therapy and transitioning across those lines will contribute
data to validate the model outcomes.
In summary, the reported epidemiologic model estimates the size and the distribution of the
patient population with MM stratified by subgroups of interest and the patients transitioning
from one line of therapy to the next, corresponding to multiple disease relapses or treatment
intolerances, and increasing burden as the condition progresses. This information can be
used to assess the number of patients who could benefit from new MM therapies and their
corresponding budgetary impact.
Page 10 of 50
http://mc.manuscriptcentral.com/pds
Pharmacoepidemiology and Drug Safety
123456789101112131415161718192021222324252627282930313233343536373839404142434445464748495051525354555657585960

For Review O
nly
10
References
1. Monnereau A, Troussard X, Belot A, et al. Unbiased estimates of long-term net
survival of hematological malignancy patients detailed by major subtypes in France.
International journal of cancer. Journal international du cancer. 2013;132(10):2378-
2387.
2. Palumbo A, Anderson K. Multiple myeloma. The New England journal of medicine.
2011;364(11):1046-1060.
3. Alexander DD, Mink PJ, Adami HO, et al. Multiple myeloma: a review of the
epidemiologic literature. International journal of cancer. Journal international du
cancer. 2007;120 Suppl 12:40-61.
4. GLOBOCAN. 2012 Incidence. 2012;
http://globocan.iarc.fr/Pages/fact_sheets_population.aspx. Accessed November 7,
2014.
5. Mikhael JR, Dingli D, Roy V, et al. Management of newly diagnosed symptomatic
multiple myeloma: updated Mayo Stratification of Myeloma and Risk-Adapted
Therapy (mSMART) consensus guidelines 2013. Mayo Clinic proceedings.
2013;88(4):360-376.
6. Avet-Loiseau H, Hulin C, Campion L, et al. Chromosomal abnormalities are major
prognostic factors in elderly patients with multiple myeloma: the intergroupe
francophone du myelome experience. Journal of clinical oncology : official journal of
the American Society of Clinical Oncology. 2013;31(22):2806-2809.
7. Engelhardt M, Terpos E, Kleber M, et al. European Myeloma Network
recommendations on the evaluation and treatment of newly diagnosed patients with
multiple myeloma. Haematologica. 2014;99(2):232-242.
8. Kapoor P, Fonseca R, Rajkumar SV, et al. Evidence for cytogenetic and
fluorescence in situ hybridization risk stratification of newly diagnosed multiple
myeloma in the era of novel therapie. Mayo Clinic proceedings. 2010;85(6):532-537.
9. Barlogie B, Attal M, Crowley J, et al. Long-term follow-up of autotransplantation trials
for multiple myeloma: update of protocols conducted by the intergroupe francophone
du myelome, southwest oncology group, and university of arkansas for medical
sciences. Journal of clinical oncology : official journal of the American Society of
Clinical Oncology. 2010;28(7):1209-1214.
10. Bashir Q, Khan H, Orlowski RZ, et al. Predictors of prolonged survival after
allogeneic hematopoietic stem cell transplantation for multiple myeloma. American
journal of hematology. 2012;87(3):272-276.
11. El Mahou S, Attal M, Jamard B, et al. Do new therapeutic approaches
(autotransplants, thalidomide, dexamethasone) improve the survival of patients with
multiple myeloma followed in a rheumatology department? Clinical rheumatology.
2006;25(2):175-182.
Page 11 of 50
http://mc.manuscriptcentral.com/pds
Pharmacoepidemiology and Drug Safety
123456789101112131415161718192021222324252627282930313233343536373839404142434445464748495051525354555657585960

For Review O
nly
11
12. Kumar S, Flinn I, Richardson PG, et al. Randomized, multicenter, phase 2 study
(EVOLUTION) of combinations of bortezomib, dexamethasone, cyclophosphamide,
and lenalidomide in previously untreated multiple myeloma. Blood.
2012;119(19):4375-4382.
13. Kaya H, Peressini B, Jawed I, et al. Impact of age, race and decade of treatment on
overall survival in a critical population analysis of 40,000 multiple myeloma patients.
International journal of hematology. 2012;95(1):64-70.
14. Lonial S, Anderson KC. Association of response endpoints with survival outcomes in
multiple myeloma. Leukemia. 2014;28(2):258-268.
15. Brenner H, Gondos A, Pulte D. Recent major improvement in long-term survival of
younger patients with multiple myeloma. Blood. 2008;111(5):2521-2526.
16. Gaultney JG, Franken MG, Tan SS, et al. Real-world health care costs of
relapsed/refractory multiple myeloma during the era of novel cancer agents. Journal
of clinical pharmacy and therapeutics. 2013;38(1):41-47.
17. Green C, Bryant J, Takeda A, et al. Bortezomib for the treatment of multiple myeloma
patients. Health technology assessment. 2009;13 Suppl 1:29-33.
18. Mehta J, Duff SB, Gupta S. Cost effectiveness of bortezomib in the treatment of
advanced multiple myeloma. Managed care interface. 2004;17(9):52-61.
19. Moller J, Nicklasson L, Murthy A. Cost-effectiveness of novel relapsed-refractory
multiple myeloma therapies in Norway: lenalidomide plus dexamethasone vs
bortezomib. Journal of medical economics. 2011;14(6):690-697.
20. Cid Ruzafa J, Cox A, Merinopoulou E, Baggaley RF, Leighton P, Desai K. An
epidemiologic modelling application to pharmacoeconomics for improved healthcare
planning. Value in Health. 2014;17(7):A587.
21. Boyle JP, Thompson TJ, Gregg EW, Barker LE, Williamson DF. Projection of the
year 2050 burden of diabetes in the US adult population: dynamic modeling of
incidence, mortality, and prediabetes prevalence. Population health metrics.
2010;8:29.
22. Brinks R, Tamayo T, Kowall B, Rathmann W. Prevalence of type 2 diabetes in
Germany in 2040: estimates from an epidemiological model. European journal of
epidemiology. 2012;27(10):791-797.
23. Levy AR, Perkins RM, Johnston KM, et al. An epidemiologic model to project the
impact of changes in glomerular filtration rate on quality of life and survival among
persons with chronic kidney disease. International journal of nephrology and
renovascular disease. 2014;7:271-280.
24. Starczewska Amelio JM, Cid Ruzafa J, Desai K, et al. Prevalence of gastrointestinal
stromal tumour (GIST) in the United Kingdom at different therapeutic lines: an
epidemiologic model. BMC cancer. 2014;14:364.
Page 12 of 50
http://mc.manuscriptcentral.com/pds
Pharmacoepidemiology and Drug Safety
123456789101112131415161718192021222324252627282930313233343536373839404142434445464748495051525354555657585960

For Review O
nly
12
25. Rajkumar SV, Harousseau JL, Durie B, et al. Consensus recommendations for the
uniform reporting of clinical trials: report of the International Myeloma Workshop
Consensus Panel 1. Blood. 2011;117(18):4691-4695.
26. National Cancer Institute (NCI). SEER Cancer Statistics Factsheets: Myeloma.
http://seer.cancer.gov/statfacts/html/mulmy.html. Accessed November 7, 2014.
27. U.S. Census Bureau Population Division. Annual Estimates of the Population for the
US, Regions, States, and Puerto Rico: April 1, 2010 to July 1, 2013 (NST-EST2013-
01). Release Date: December 2013.;
http://www.census.gov/popest/data/national/totals/2013/index.html Accessed
November 7, 2014.
28. CDC/NCHS. National Vital Statistics System, Mortality.
http://www.cdc.gov/nchs/data/dvs/MortFinal2007_Worktable23r.pdf. Accessed
November 7, 2014.
29. McKay MD, Beckman RJ, Conover WJ. A comparison of three methods for selecting
values of input variables in the analysis of output from a computer code.
Technometrics (JSTOR Abstract). Am Stat Assoc. 1979;21(2):239-245.
30. Blower SM, Dowlatabadi H. Sensitivity and uncertainty analysis of complex models of
disease transmission: an HIV model, as an example. Int Stat Rev. 1994;62:229-243.
31. Iman RL, Helton JC, Campbell JE. An approach to sensitivity analysis of computer
models: part I - introduction, input variable selection and preliminary assessment. J
Qual Technol. 1981;13(174-183).
32. Briggs AH, Weinstein MC, Fenwick EA, et al. Model parameter estimation and
uncertainty analysis: a report of the ISPOR-SMDM Modeling Good Research
Practices Task Force Working Group-6. Med Decis Making. 2012;32(5):722-732.
33. Cure S, Martin M, Bracco A, Brown J, Kearney M. An epidemiological model of
prostate cancer and progression to bone metastases in the United Kingdom. Value in
Health. 2011;14:PCN18.
34. Vitale V, Asano E, Pereira ML. Budget impact analysis of abiraterone acetate in
metastatic castration-resistant prostate cancer patients previously treated with
docetaxel from the perspective of the Brazilian private health care system. Value in
Health. 2013;16:A665.
35. Martin M, Kearney M, Bracco A, Brown J. An epidemiological model of breast cancer
and progression to bone metastases in the United Kingdom. Value in Health.
2011;14:PCN19.
36. Abbe A, Lee A, Hamed A, Neumann F, Olivares R, Engert A. Epidemiologic
modelling estimating the number of patients with relapsed Hodgkin lymphoma after
autologous stem cell transplant in 5 European countries. JNCCN. 2013;11(3):243-
244.
37. Lee A, Abbe A, Hamed A, Neumann F, Olivares R, Younes A. Epidemiologic model
estimating number of Hodgkin lymphoma patients who relapsed after autologous
Page 13 of 50
http://mc.manuscriptcentral.com/pds
Pharmacoepidemiology and Drug Safety
123456789101112131415161718192021222324252627282930313233343536373839404142434445464748495051525354555657585960

For Review O
nly
13
stecm cell transplant in the United States. Journal of clinical oncology : official journal
of the American Society of Clinical Oncology. 2013;31(15):e12554.
38. Fagnani F, Sartre J, Rota C, Bregman B, Gaudin AF. Projection of the patients’
population treated for chronic myeloid leukemia in chronic phase in France: an
epidemiological model at the horizon 2015. Value in Health. 2011:A233.
39. EMA. Human regulatory: orphan designation.
http://www.ema.europa.eu/ema/index.jsp?curl=pages/regulation/general/general_con
tent_000029.jsp&mid=WC0b01ac05800240ce. Accessed November 7, 2014.
40. Avet-Loiseau H, Attal M, Moreau P, et al. Genetic abnormalities and survival in
multiple myeloma: the experience of the Intergroupe Francophone du Myelome.
Blood. 2007;109(8):3489-3495.
41. Avet-Loiseau H, Soulier J, Fermand JP, et al. Impact of high-risk cytogenetics and
prior therapy on outcomes in patients with advanced relapsed or refractory multiple
myeloma treated with lenalidomide plus dexamethasone. Leukemia. 2010;24(3):623-
628.
42. Gonsalves WI, Rajkumar SV, Gupta V, et al. Quantification of clonal circulating
plasma cells in newly diagnosed multiple myeloma: implications for redefining high-
risk myeloma. Leukemia. 2014;28(10):2060-2065.
43. Kapoor P, Kumar S, Fonseca R, et al. Impact of risk stratification on outcome among
patients with multiple myeloma receiving initial therapy with lenalidomide and
dexamethasone. Blood. 2009;114(3):518-521.
44. Konigsberg R, Zojer N, Ackermann J, et al. Predictive role of interphase cytogenetics
for survival of patients with multiple myeloma. Journal of clinical oncology : official
journal of the American Society of Clinical Oncology. 2000;18(4):804-812.
45. Kumar SK, Lee JH, Lahuerta JJ, et al. Risk of progression and survival in multiple
myeloma relapsing after therapy with IMiDs and bortezomib: a multicenter
international myeloma working group study. Leukemia. 2012;26(1):149-157.
46. Sellner L, Heiss C, Benner A, et al. Autologous retransplantation for patients with
recurrent multiple myeloma: a single-center experience with 200 patients. Cancer.
2013;119(13):2438-2446.
47. Karlin L, Soulier J, Chandesris O, et al. Clinical and biological features of t(4;14)
multiple myeloma: a prospective study. Leukemia & lymphoma. 2011;52(2):238-246.
48. Kyle RA, Remstein ED, Therneau TM, et al. Clinical course and prognosis of
smoldering (asymptomatic) multiple myeloma. The New England journal of medicine.
2007;356(25):2582-2590.
49. Liwing J, Uttervall K, Lund J, et al. Improved survival in myeloma patients: starting to
close in on the gap between elderly patients and a matched normal population.
British journal of haematology. 2014;164(5):684-693.
Page 14 of 50
http://mc.manuscriptcentral.com/pds
Pharmacoepidemiology and Drug Safety
123456789101112131415161718192021222324252627282930313233343536373839404142434445464748495051525354555657585960

For Review O
nly
14
50. Mateos MV, Hernandez MT, Giraldo P, et al. Lenalidomide plus dexamethasone for
high-risk smoldering multiple myeloma. The New England journal of medicine.
2013;369(5):438-447.
51. Al-Hamadani M, Hashmi SK, Go RS. Use of autologous hematopoietic cell
transplantation as initial therapy in multiple myeloma and the impact of socio-geo-
demographic factors in the era of novel agents. American journal of hematology.
2014;89(8):825-830.
52. Ludwig H, Durie BG, Bolejack V, et al. Myeloma in patients younger than age 50
years presents with more favorable features and shows better survival: an analysis of
10 549 patients from the International Myeloma Working Group. Blood.
2008;111(8):4039-4047.
53. Armoiry X, Fagnani F, Benboubker L, et al. Management of relapsed or refractory
multiple myeloma in French hospitals and estimation of associated direct costs: a
multi-centre retrospective cohort study. Journal of clinical pharmacy and
therapeutics. 2011;36(1):19-26.
54. Wu W, Merriman K, Nabaah A, et al. The association of diabetes and anti-diabetic
medications with clinical outcomes in multiple myeloma. British journal of cancer.
2014;111(3):628-636.
55. Kristinsson SY, Landgren O, Dickman PW, Derolf AR, Bjorkholm M. Patterns of
survival in multiple myeloma: a population-based study of patients diagnosed in
Sweden from 1973 to 2003. Journal of clinical oncology : official journal of the
American Society of Clinical Oncology. 2007;25(15):1993-1999.
56. Turesson I, Velez R, Kristinsson SY, Landgren O. Patterns of improved survival in
patients with multiple myeloma in the twenty-first century: a population-based study.
Journal of clinical oncology : official journal of the American Society of Clinical
Oncology. 2010;28(5):830-834.
57. Bergsagel PL, Mateos MV, Gutierrez NC, Rajkumar SV, San Miguel JF. Improving
overall survival and overcoming adverse prognosis in the treatment of cytogenetically
high-risk multiple myeloma. Blood. 2013;121(6):884-892.
58. Hebraud B, Leleu X, Lauwers-Cances V, et al. Deletion of the 1p32 region is a major
independent prognostic factor in young patients with myeloma: the IFM experience
on 1195 patients. Leukemia. 2014;28(3):675-679.
59. Sasaki K, Lu G, Saliba RM, et al. Impact of t(11;14)(q13;q32) on the outcome of
autologous hematopoietic cell transplantation in multiple myeloma. Biology of blood
and marrow transplantation : journal of the American Society for Blood and Marrow
Transplantation. 2013;19(8):1227-1232.
60. Drake MB, Iacobelli S, van Biezen A, et al. Primary plasma cell leukemia and
autologous stem cell transplantation. Haematologica. 2010;95(5):804-809.
61. El-Cheikh J, Crocchiolo R, Furst S, et al. Long-term outcome after allogeneic stem-
cell transplantation with reduced-intensity conditioning in patients with multiple
myeloma. American journal of hematology. 2013;88(5):370-374.
Page 15 of 50
http://mc.manuscriptcentral.com/pds
Pharmacoepidemiology and Drug Safety
123456789101112131415161718192021222324252627282930313233343536373839404142434445464748495051525354555657585960

For Review O
nly
15
62. Kumar SK, Lacy MQ, Dispenzieri A, et al. Early versus delayed autologous
transplantation after immunomodulatory agents-based induction therapy in patients
with newly diagnosed multiple myeloma. Cancer. 2012;118(6):1585-1592.
63. Richardson PG, Barlogie B, Berenson J, et al. Clinical factors predictive of outcome
with bortezomib in patients with relapsed, refractory multiple myeloma. Blood.
2005;106(9):2977-2981.
64. Richardson PG, Sonneveld P, Schuster MW, et al. Safety and efficacy of bortezomib
in high-risk and elderly patients with relapsed multiple myeloma. British journal of
haematology. 2007;137(5):429-435.
65. San Miguel JF, Schlag R, Khuageva NK, et al. Persistent overall survival benefit and
no increased risk of second malignancies with bortezomib-melphalan-prednisone
versus melphalan-prednisone in patients with previously untreated multiple myeloma.
Journal of clinical oncology : official journal of the American Society of Clinical
Oncology. 2013;31(4):448-455.
66. San Miguel JF, Schlag R, Khuageva NK, et al. Bortezomib plus melphalan and
prednisone for initial treatment of multiple myeloma. The New England journal of
medicine. 2008;359(9):906-917.
Page 16 of 50
http://mc.manuscriptcentral.com/pds
Pharmacoepidemiology and Drug Safety
123456789101112131415161718192021222324252627282930313233343536373839404142434445464748495051525354555657585960

For Review O
nly
16
TABLES
Table 1. Model Base Case Parameter Values for the US
Parameter Base Case Units Reference
Population
Population size 316,128,839 persons 27
Background death rate of adults 40-64 years 0.008
proportion per year
28
Background death rate of adults ≥65 years 0.060
proportion per year
28
MM epidemiology
Incidence of MM 0.000061 proportion per year
5,26
Proportion patients <65 years at MM diagnosis
38.00% % 5,26
Proportion in high cytogenetic risk group at MM diagnosis
35.00% % 5,6,9,40-46
Proportion symptomatic at MM diagnosis 87.50% % 47-50
Median duration for progression from asymptomatic (smoldering) MM to symptomatic MM
58 months 47,48,50
MM-related death rate while asymptomatic (smoldering), <65 years, MM patients
0.0040 proportion per year
42,50
MM-related death rate while asymptomatic (smoldering), ≥65 years, MM patients
0.0400 proportion per year
42,50
MM-related death rate while symptomatic MM before treatment initiation, <65 years
0.0045 proportion per year
assumption
MM-related death rate while symptomatic MM before treatment initiation, ≥65 years
0.0450 proportion per year
assumption
Treatment initiation
Time from diagnosis of symptomatic MM to treatment initiation
0.500 months 42,45
Proportion <65 years initiating SCT pathway 30.00% % 51,52
Proportion ≥65 years initiating SCT pathway 10.00% % 51,52
MM-related death rates on treatment pathway
Patients <65 years, standard/low cytogenetic risk, non-SCT treatment pathway: treatment line 1
0.10 Proportion per year
11,53
MM-related death rate ratio: SCT compared to non-SCT
0.70 None (ratio) 9,54
MM-related death rate ratio: ≥65 year age group compared to <65 year age group
1.50 None (ratio) 9,49,52,55,56
MM-related death rate ratio: high cytogenetic risk group compared to standard/low cytogenetic risk group
2.25 None (ratio) 6,40,41,46,54,57-59
Page 17 of 50
http://mc.manuscriptcentral.com/pds
Pharmacoepidemiology and Drug Safety
123456789101112131415161718192021222324252627282930313233343536373839404142434445464748495051525354555657585960

For Review O
nly
17
Parameter Base Case Units Reference
MM-related death rate ratio: 2nd line compared to 1st line treatment
1.00 None (ratio) 1,15,60
MM-related death rate ratio: 3rd line compared to 2nd line treatment
1.10 None (ratio) 1,15,60
MM-related death rate ratio: 4th line compared to 3rd line treatment
1.15 None (ratio) 1,15,60
MM-related death rate ratio: 5th line compared to 4th line treatment
1.20 None (ratio) 1,15,60
MM-related death rate ratio: 6th line compared to 5th line treatment
1.25 None (ratio) 1,15,60
MM-related death rate ratio: 7th line compared to 6th line treatment
1.40 None (ratio) 1,15,60
MM-related death rate ratio: 8th line compared to 7th line treatment (applicable to subsequent lines, up to 17, compared to the previous line)
1.50 None (ratio) 1,15,60
Time to next line of treatment
Treatment duration on treatment line 1* (patients <65 years, standard/low cytogenetic risk, SCT pathway)
35.0 Months 5,40,42,46,49,58,59,61,62
Time to next line of treatment: n+1th line compared to nth line treatment
0.80 None (ratio) 41
Time to next line of treatment: ≥65 year age group compared to <65 year age group
0.75 None (ratio) 63,64
Time to next line of treatment: high cytogenetic risk group compared to standard/low cytogenetic risk group
0.45 None (ratio) 6,40,41,43,46,57,58
Treatment duration on treatment line 1* (patients <65 years, standard/low cytogenetic risk, non-SCT pathway)
27.0 Months 42,43,49,65,66
* Defined as time between initiating treatment line 1 and initiating treatment line 2.
Page 18 of 50
http://mc.manuscriptcentral.com/pds
Pharmacoepidemiology and Drug Safety
123456789101112131415161718192021222324252627282930313233343536373839404142434445464748495051525354555657585960

For Review O
nly
18
Table 2. Estimated Total Number of Prevalent MM Cases in the US by Line of Therapy and Patient Subgroups of Interest
Treatment Line Total SCT Eligibility SCT Non Eligibility
Low/Standard Cytogenetic
Risk
High Cytogenetic
Risk Low/Standard
Cytogenetic Risk
High Cytogenetic
Risk
<65 yrs
≥65 yrs
<65 yrs ≥65 yrs <65 yrs ≥65 yrs
<65 yrs
≥65 yrs
Line 1 23,629 3,375 1,196 825 306 6,000 8,351 1,465 2,111
Line 2 15,350 2,287 742 562 198 4,017 5,201 985 1,358
Line 3 10,249 1,584 477 390 132 2,746 3,346 676 898
Line 4 6,966 1,114 314 274 89 1,901 2,201 469 604
Line 5 4,786 790 210 193 61 1,325 1,469 328 410
Line 6 3,301 561 142 136 42 925 987 229 279
Line 7 2,252 394 95 95 28 637 657 158 188
Line 8 1,501 271 62 65 19 428 427 106 123
Line 9 971 181 40 43 12 279 269 69 78
Line 10 605 116 25 27 7 175 164 43 48
Line 11 363 72 15 17 4 106 95 26 28
Line 12 206 43 8 10 2 61 52 15 15
Line 13 111 24 5 5 1 33 27 8 8
Line 14 54 12 2 3 0 17 13 4 3
Line 15 23 6 1 1 0 8 5 1 1
Line 16 7 2 0 0 0 3 2 0 0
Line 17 and greater
2 1 0 0 0 1 0 0 0
Total patients on treatment
70,375 10,833 3,333 2,646 901 18,662 23,266 4,582 6,152
Page 19 of 50
http://mc.manuscriptcentral.com/pds
Pharmacoepidemiology and Drug Safety
123456789101112131415161718192021222324252627282930313233343536373839404142434445464748495051525354555657585960

For Review O
nly
19
Table 3. Number of MM Patient Transitions in the US by Line of Therapy and Patient Subgroups of Interest
New Treatment
SCT Eligibility SCT Non Eligibility
Low/standard cytogenetic
risk
High cytogenetic
risk Low/standard
cytogenetic risk High
cytogenetic risk
Regimens Total <65
yrs ≥65 yrs
<65 yrs
≥65 yrs
<65 yrs
≥65 yrs
<65 yrs
≥65 yrs
Line 1 18,689 1,418 742 763 399 3,309 6,680 1,781 3,597
Line 2 14,423 1,155 545 627 309 2,661 4,928 1,440 2,758
Line 3 11,677 979 422 533 250 2,227 3,837 1,210 2,219
Line 4 9,715 848 339 463 208 1,902 3,085 1,038 1,832
Line 5 8,225 746 278 406 176 1,646 2,535 900 1,538
Line 6 7,038 662 233 358 150 1,433 2,113 786 1,303
Line 7 6,047 589 196 316 129 1,250 1,773 686 1,108
Line 8 5,131 518 164 275 109 1,075 1,472 590 928
Line 9 4,241 444 134 234 90 900 1,192 493 754
Line 10 3,396 370 107 193 72 730 934 399 591
Line 11 2,616 298 82 153 55 571 704 310 443
Line 12 1,920 230 60 116 40 427 505 229 313
Line 13 1,334 169 42 84 28 303 342 160 206
Line 14 862 117 28 57 17 202 215 103 123
Line 15 511 76 17 35 10 125 124 60 64
Line 16 267 45 9 19 5 70 63 30 26
Line 17 and greater
167 40 5 12 1 52 37 14 6
Total transitions
96,259 8,704 3,403 4,644 2,048 18,883 30,539 10,229 17,809
Page 20 of 50
http://mc.manuscriptcentral.com/pds
Pharmacoepidemiology and Drug Safety
123456789101112131415161718192021222324252627282930313233343536373839404142434445464748495051525354555657585960

For Review O
nly
20
Table 4. Median and Credible Intervals of the Number of MM Patients and Number of Patient Transitions by Line of Therapy in the US
Treatment Lines
Number of MM Patients Number of Patient Therapy Line
Transitions
95% Credible Interval 95% Credible Interval
Median Lower Upper Median Lower Upper
Line 1 23,584 22,236 25,029 18,696 18,558 18,817
Line 2 15,346 13,845 16,760 14,415 13,489 15,176
Line 3 10,234 8,908 11,515 11,658 10,348 12,811
Line 4 6,955 5,847 8,053 9,699 8,223 11,085
Line 5 4,778 3,893 5,685 8,214 6,670 9,744
Line 6 3,298 2,609 4,038 7,028 5,483 8,630
Line 7 2,252 1,723 2,850 6,042 4,531 7,669
Line 8 1,502 1,106 1,975 5,131 3,695 6,766
Line 9 975 687 1,338 4,244 2,919 5,872
Line 10 612 409 886 3,403 2,223 4,964
Line 11 369 232 568 2,629 1,612 4,075
Line 12 213 125 353 1,937 1,107 3,273
Line 13 116 63 210 1,350 714 2,487
Line 14 59 30 119 878 428 1,788
Line 15 28 13 63 525 236 1,212
Line 16 12 5 32 279 120 719
Line 17 and greater
9 5 22 192 77 523
Page 21 of 50
http://mc.manuscriptcentral.com/pds
Pharmacoepidemiology and Drug Safety
123456789101112131415161718192021222324252627282930313233343536373839404142434445464748495051525354555657585960

For Review Only
21
Figure 1. Model to Assess Prevalence of Patients with MM at Different Treatment Lines
Page 22 of 50
http://mc.manuscriptcentral.com/pds
Pharmacoepidemiology and Drug Safety
123456789101112131415161718192021222324252627282930313233343536373839404142434445464748495051525354555657585960

For Review O
nly
22
Appendix A: Model Parameters and Equations
Table A - 1. Model Parameters
Description
��
Incidence of MM (all stages) for demographic group � (proportion/year)
� Proportion of MM patients that is symptomatic at diagnosis*
� Progression rate of asymptomatic MM to symptomatic*
� Progression rate of symptomatic MM to treatment* (per year)
��
Background death rate for demographic group† � (per year)
�
MM-related death rate for demographic group � as yet untreated, asymptomatic (per year)
�
MM-related death rate for demographic group � as yet untreated, symptomatic MM (per
year)
��� Proportion symptomatic initiating first line of treatment within demographic group �
who are assigned to each treatment pathway¹ �
��� MM-related death rate for demographic group � on treatment pathway � and line of
therapy � (per year)
�/���� Time to next line of treatment for patients in demographic group � on treatment pathway
� and line of therapy � (years)
MM = multiple myeloma
*Assumption that this parameter has the same value regardless of risk and age group.
†Demographic groups= <65 years and low/standard cytogenetic group; ≥65 years and low/standard cytogenetic group; <65 years and high cytogenetic group; ≥65 years and high cytogenetic group;
¹Treatment pathways= at least one SCT is performed; no SCT is performed
Model Equations
The model initiates upon diagnosis with MM. Individuals flow between states in the model.
Patients may be diagnosed with asymptomatic (��) or symptomatic (��) MM, where u is
demographic group (currently four groups according to age group and cytogenetic risk
group). Asymptomatics (��) receive new cases with proportion (� − �) of the total
incidence ��
. Individuals become symptomatic at rate�. Symptomatics (��) receive a
proportion � of the incident cases directly and initiate treatment at a rate � with proportions
��� in each of the two treatment pathways. Asymptomatics experience MM-related
mortality at rate�
whilst symptomatics experience MM-related mortality at rate �
.
Page 23 of 50
http://mc.manuscriptcentral.com/pds
Pharmacoepidemiology and Drug Safety
123456789101112131415161718192021222324252627282930313233343536373839404142434445464748495051525354555657585960

For Review O
nly
23
Each treatment state is represented by ����, where � is demographic group, � is
treatment pathway (currently: 1 = at least one SCT is performed; 2 = no SCT is performed),
and � is line of therapy).Treated cases progress through 17 lines of treatment (index � from
1 to 17) at rate ����
and experience MM-related mortality at rate ���. Asymptomatic,
symptomatic, and treated individuals are all subject to background death rate�� .
Line of therapy is understood as one or more cycles of a planned treatment program (single
agent, combination therapy, or sequence of treatments administered as planned). A new
line of therapy is assumed to start when a planned treatment program is modified to include
other drugs as a result of disease progression, relapse or toxicity, or when a planned period
off-treatment is interrupted because additional treatment for MM is required.25
For patients undergoing SCTs, first-line treatment usually represents the package of
treatments that are required for an SCT procedure (i.e., includes induction therapy as well as
SCT). A second SCT is recorded as second-line treatment. In some cases, a first SCT could
also take place at a line of therapy greater than line 1.
Asymptomatic MM:
���
��= ��
�� − �� − ���� + �� + �
�
Where � = 1...4
Symptomatic MM, untreated:
���
��= ��
� + ���− ���� + �� + �
�
Where � =1...4
MM treatment stages
First-line treatment:
�����
��= ������
− ������� + ��� + ����
�
Where � = 1...4; � = 1, 2; � = 1
Subsequent treatment lines (� > 1):
Page 24 of 50
http://mc.manuscriptcentral.com/pds
Pharmacoepidemiology and Drug Safety
123456789101112131415161718192021222324252627282930313233343536373839404142434445464748495051525354555657585960

For Review O
nly
24
�����
��= ������������
− ������� + ��� + ����
�
Where � = 1...4; � = 1,2; � = 2…20
The values of MM-related death rates and MM time to next treatment (TTNT) durations for
each MM treatment state are related to a baseline MM-related death rate and two baseline
time to next line of treatment values:
• The baseline MM-related death rate is for MM patients on the first line of treatment, on the non-SCT pathway, < 65 years of age and in the low/standard cytogenetic risk group.
• MM-related death rates for all other treated MM health states are derived from the baseline rate using the following death rate relative risks (RR):
- RR for patients ≥ 65 years compared to < 65 years
- RR for patients in the high cytogenetic risk group compared to the low/standard-risk group
- RR for patients on the SCT pathway compared to those on the non-SCT pathway
- RR for patients on the n+1th line of treatment compared to those on the nth line of treatment
• The baseline TTNT values are for MM patients on the first line of treatment, < 65 years of age and in the low cytogenetic risk group. There is one baseline value for patients on the SCT treatment pathway and another value for patients on the non-SCT pathway.
• TTNT values for all other treated MM health states are derived from the baseline values using the following TTNT RRs:
- RR for patients ≥ 65 years compared to < 65 years
- RR for patients in the high cytogenetic risk group compared to the low/standard-risk group
- RR for patients on the n+1th line of treatment compared to those on the nth line of treatment
Page 25 of 50
http://mc.manuscriptcentral.com/pds
Pharmacoepidemiology and Drug Safety
123456789101112131415161718192021222324252627282930313233343536373839404142434445464748495051525354555657585960
For Review O
nly
25
Appendix B: Probabilistic Sensitivity Analysis
Based on model influence diagram face validity discussions, the parameters expected to
influence model output selected for inclusion in the PSA were:
Population inputs:
1. Proportion patients < 65 years at MM diagnosis (prop_young in Figure B-1 below)
2. Proportion in low/standard cytogenetic risk group at MM diagnosis (prop_lowrisk)
3. Proportion symptomatic at MM diagnosis (prop_sympt)
Treatment inputs:
4. Proportion < 65 years initiating SCT pathway (prop_less65_SCT)
5. Baseline MM-related death rate; patients < 65 years, low/standard cytogenetic risk,
non-SCT treatment pathway: treatment line 1 (baseline MM death rate)
6. MM-related death rate ratio: ≥ 65 year age group compared to < 65 year age group
(RR_mort_oldage)
7. MM-related death rate ratio: high cytogenetic risk group compared to low/standard
cytogenetic risk group (RR_mort_highrisk)
We used the LHS method30. Running the model with model parameters for the baseline
country produced the PRCCs shown in Figure B-1. The magnitude of each PRCC quantifies
the importance of each parameter, with the sign of the PRCC value indicating the specific
qualitative relationship between the input and the output variable: positive values of PRCC
imply that increasing the value of the input variable will lead to an increase in the output
variable (number of forecasted patients with MM). As a general rule, parameters with the
largest influence are defined as those with a PRCC greater than 0.4 or less than −0.4.
Figure B-1 shows that the parameters with the greatest influence on the model outcomes for
the baseline country are all the MM-related death rates ratios [5-7 from list above], with the
relationship being negative. Additionally, the proportion of patients in low cytogenetic risk
group [2] and the proportion symptomatic [3] are shown to have a great positive influence on
model outcomes. The observed low PRCCs for the proportion of young patients [1] and the
proportion of young patients initiating SCT [4] imply that their influence on the model
outcomes is expected to be low.
Page 26 of 50
http://mc.manuscriptcentral.com/pds
Pharmacoepidemiology and Drug Safety
123456789101112131415161718192021222324252627282930313233343536373839404142434445464748495051525354555657585960

For Review O
nly
26
Figure B-2. Partial Rank Correlation Coefficients for Key Model Parameters
Table B - 2. Probabilistic Sensitivity Analysis Parameters
Parameter (unit) Base Case Standard
Error Distribution
Proportion patients <65 years at MM diagnosis 38.00% 1.80% Beta
Proportion in high cytogenetic risk group at MM diagnosis
35.00% 2.50% Beta
Proportion symptomatic at MM diagnosis 87.50% 1.50% Beta
Proportion <65 years initiating SCT pathway 85.00% 2.5% Beta
Proportion patients <65 years, standard/low cytogenetic risk, non-SCT treatment pathway: treatment line 1
0.100 0.010 Gamma
MM-related death rate ratio: ≥65 year age group compared to <65 year age group
1.50 0.15 Lognormal
MM-related death rate ratio: high cytogenetic risk group compared to standard/low cytogenetic risk group
2.25 0.25 Lognormal
Page 27 of 50
http://mc.manuscriptcentral.com/pds
Pharmacoepidemiology and Drug Safety
123456789101112131415161718192021222324252627282930313233343536373839404142434445464748495051525354555657585960

For Review O
nly
27
Appendix C: PSA Results for Subgroups of Interest
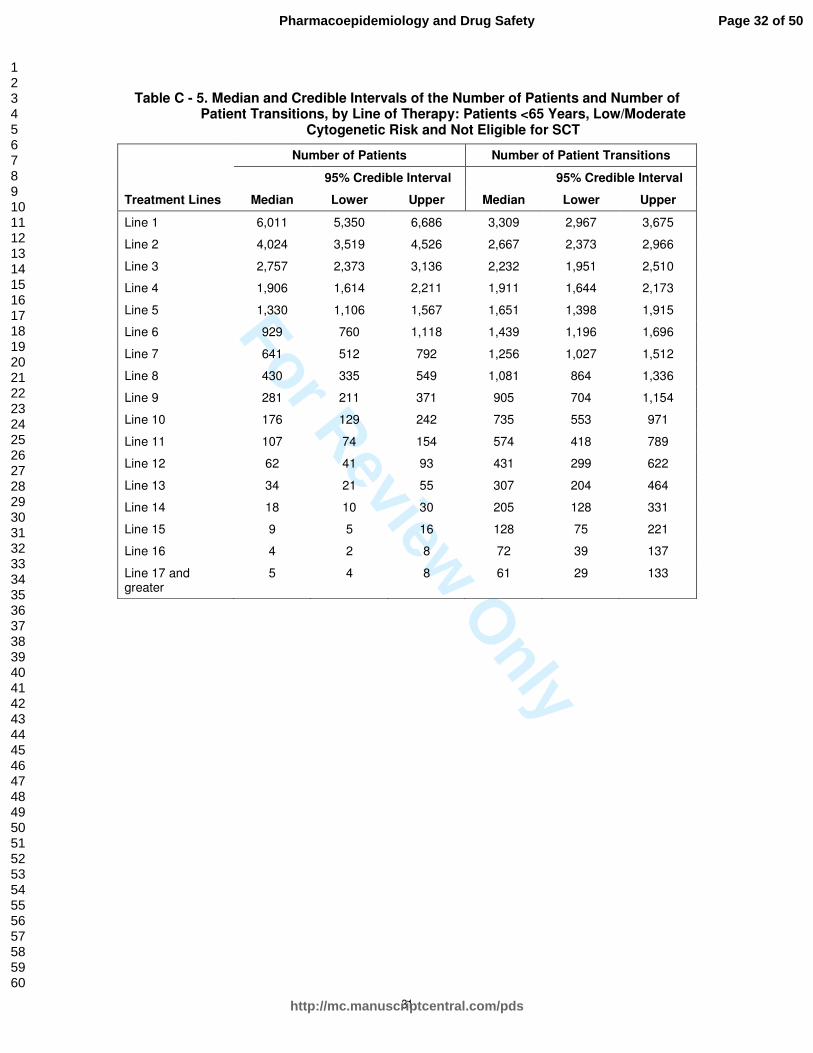
Table C - 1. Median and Credible Intervals of the Number of Patients and Number of Patient Transitions, by Line of Therapy: Patients <65 Years, Low/Moderate
Cytogenetic Risk and Eligible for SCT.
Treatment Lines
Number of Patients Number of Patient Transitions
95% Credible Interval 95% Credible Interval
Median Lower Upper Median Lower Upper
Line 1 3,357 2,792 4,030 1,414 1,177 1,693
Line 2 2,270 1,882 2,773 1,150 956 1,380
Line 3 1,570 1,284 1,929 972 806 1,187
Line 4 1,099 887 1,363 840 687 1,032
Line 5 774 618 976 734 593 911
Line 6 548 431 702 646 515 814
Line 7 384 297 503 570 449 732
Line 8 263 200 351 499 386 653
Line 9 175 129 240 425 324 568
Line 10 113 81 159 353 261 485
Line 11 70 49 102 283 204 398
Line 12 42 28 64 218 151 320
Line 13 24 15 39 160 107 247
Line 14 13 8 22 111 70 182
Line 15 7 4 12 72 43 128
Line 16 3 2 6 43 24 83
Line 17 and greater
5 4 7 43 21 95
Page 28 of 50
http://mc.manuscriptcentral.com/pds
Pharmacoepidemiology and Drug Safety
123456789101112131415161718192021222324252627282930313233343536373839404142434445464748495051525354555657585960

For Review O
nly
28
Table C - 2. Median and Credible Intervals of the Number of Patients and Number of Patient Transitions, by Line of Therapy: Patients ≥65 Years, Low/Moderate
Cytogenetic Risk and Eligible for SCT
Treatment Lines
Number of Patients Number of Patient Transitions
95% Credible Interval 95% Credible Interval
Median Lower Upper Median Lower Upper
Line 1 1,195 1,080 1,316 744 682 798
Line 2 740 643 846 545 492 600
Line 3 475 396 561 421 366 482
Line 4 314 248 383 338 282 400
Line 5 210 159 265 279 221 341
Line 6 142 102 186 233 176 294
Line 7 95 65 129 197 141 257
Line 8 63 40 90 165 112 223
Line 9 41 24 61 135 86 193
Line 10 25 14 41 108 63 163
Line 11 15 8 27 83 45 135
Line 12 9 4 17 62 30 108
Line 13 5 2 10 43 19 83
Line 14 3 1 6 29 11 61
Line 15 2 1 4 17 6 42
Line 16 1 1 2 10 3 26
Line 17 and greater
4 4 4 4 3 11
Page 29 of 50
http://mc.manuscriptcentral.com/pds
Pharmacoepidemiology and Drug Safety
123456789101112131415161718192021222324252627282930313233343536373839404142434445464748495051525354555657585960

For Review O
nly
29
Table C - 3. Median and Credible Intervals of the Number of Patients and Number of Patient Transitions, by Line of Therapy: Patients <65 Years, High
Cytogenetic Risk and Eligible for SCT
Treatment Lines
Number of Patients Number of Patient Transitions
95% Credible Interval 95% Credible Interval
Median Lower Upper Median Lower Upper
Line 1 822 631 1,033 759 608 940
Line 2 561 409 723 624 479 785
Line 3 388 265 528 532 389 687
Line 4 271 175 386 461 314 627
Line 5 192 116 282 402 260 572
Line 6 136 76 208 355 214 522
Line 7 95 49 153 315 176 480
Line 8 66 30 111 274 141 440
Line 9 44 18 79 235 108 398
Line 10 28 11 56 194 80 352
Line 11 18 6 38 154 57 306
Line 12 11 3 25 117 38 258
Line 13 6 2 17 85 23 209
Line 14 3 1 11 58 13 165
Line 15 2 1 6 37 7 123
Line 16 1 1 4 21 3 85
Line 17 and greater
4 4 5 8 3 42
Page 30 of 50
http://mc.manuscriptcentral.com/pds
Pharmacoepidemiology and Drug Safety
123456789101112131415161718192021222324252627282930313233343536373839404142434445464748495051525354555657585960

For Review O
nly
30
Table C - 4. Median and Credible Intervals of the Number of Patients and Number of Patient Transitions, by Line of Therapy: Patients ≥65 Years, High
Cytogenetic Risk and Eligible for SCT
Treatment Lines
Number of Patients Number of Patient Transitions
95% Credible Interval 95% Credible Interval
Median Lower Upper Median Lower Upper
Line 1 305 252 362 400 344 457
Line 2 199 148 247 308 254 366
Line 3 133 89 174 251 186 312
Line 4 90 55 124 209 140 274
Line 5 62 34 90 177 108 243
Line 6 43 22 66 151 84 220
Line 7 29 14 47 130 67 200
Line 8 20 8 34 110 51 179
Line 9 13 5 24 91 37 160
Line 10 8 3 17 73 26 140
Line 11 5 2 12 56 17 119
Line 12 3 1 8 41 10 98
Line 13 2 1 5 28 6 78
Line 14 1 1 3 18 3 59
Line 15 1 1 2 10 2 41
Line 16 1 1 2 5 1 26
Line 17 and greater
2 2 2 3 2 16
Page 31 of 50
http://mc.manuscriptcentral.com/pds
Pharmacoepidemiology and Drug Safety
123456789101112131415161718192021222324252627282930313233343536373839404142434445464748495051525354555657585960
For Review O
nly
31
Table C - 5. Median and Credible Intervals of the Number of Patients and Number of Patient Transitions, by Line of Therapy: Patients <65 Years, Low/Moderate
Cytogenetic Risk and Not Eligible for SCT
Treatment Lines
Number of Patients Number of Patient Transitions
95% Credible Interval 95% Credible Interval
Median Lower Upper Median Lower Upper
Line 1 6,011 5,350 6,686 3,309 2,967 3,675
Line 2 4,024 3,519 4,526 2,667 2,373 2,966
Line 3 2,757 2,373 3,136 2,232 1,951 2,510
Line 4 1,906 1,614 2,211 1,911 1,644 2,173
Line 5 1,330 1,106 1,567 1,651 1,398 1,915
Line 6 929 760 1,118 1,439 1,196 1,696
Line 7 641 512 792 1,256 1,027 1,512
Line 8 430 335 549 1,081 864 1,336
Line 9 281 211 371 905 704 1,154
Line 10 176 129 242 735 553 971
Line 11 107 74 154 574 418 789
Line 12 62 41 93 431 299 622
Line 13 34 21 55 307 204 464
Line 14 18 10 30 205 128 331
Line 15 9 5 16 128 75 221
Line 16 4 2 8 72 39 137
Line 17 and greater
5 4 8 61 29 133
Page 32 of 50
http://mc.manuscriptcentral.com/pds
Pharmacoepidemiology and Drug Safety
123456789101112131415161718192021222324252627282930313233343536373839404142434445464748495051525354555657585960

For Review O
nly
32
Table C - 6. Median and Credible Intervals of the Number of Patients and Number of Patient Transitions, by Line of Therapy: Patients ≥65 Years, Low/Moderate
Cytogenetic Risk and Not Eligible for SCT
Treatment Lines
Number of Patients Number of Patient Transitions
95% Credible Interval 95% Credible Interval
Median Lower Upper Median Lower Upper
Line 1 8,341 7,522 9,219 6,689 6,133 7,180
Line 2 5,182 4,464 5,969 4,919 4,435 5,436
Line 3 3,338 2,723 4,001 3,820 3,290 4,400
Line 4 2,202 1,702 2,735 3,074 2,508 3,684
Line 5 1,472 1,078 1,897 2,533 1,958 3,146
Line 6 989 687 1,324 2,114 1,549 2,726
Line 7 660 430 924 1,773 1,231 2,375
Line 8 432 259 636 1,475 962 2,065
Line 9 273 152 429 1,199 720 1,766
Line 10 167 84 282 941 522 1,478
Line 11 97 44 180 709 358 1,201
Line 12 54 22 111 508 229 940
Line 13 29 10 65 344 136 703
Line 14 14 4 37 216 74 495
Line 15 7 2 19 122 36 323
Line 16 3 1 9 61 15 188
Line 17 and greater
3 3 7 33 7 130
Page 33 of 50
http://mc.manuscriptcentral.com/pds
Pharmacoepidemiology and Drug Safety
123456789101112131415161718192021222324252627282930313233343536373839404142434445464748495051525354555657585960
For Review O
nly
33
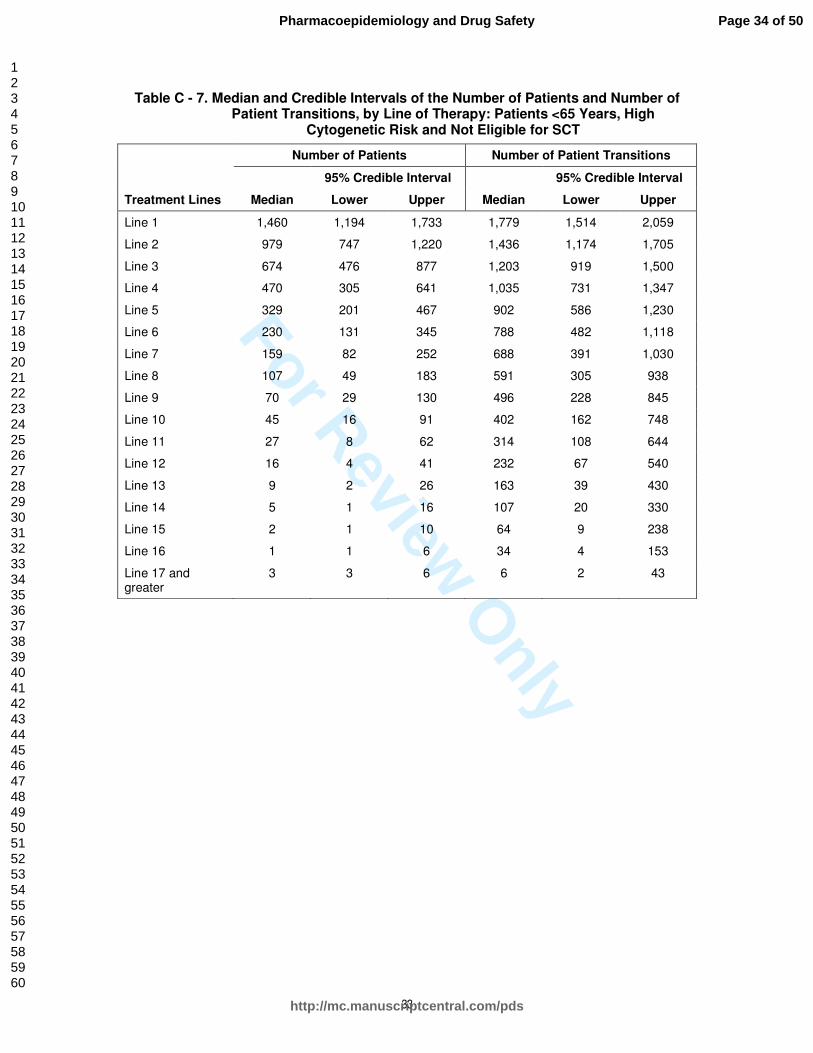
Table C - 7. Median and Credible Intervals of the Number of Patients and Number of Patient Transitions, by Line of Therapy: Patients <65 Years, High
Cytogenetic Risk and Not Eligible for SCT
Treatment Lines
Number of Patients Number of Patient Transitions
95% Credible Interval 95% Credible Interval
Median Lower Upper Median Lower Upper
Line 1 1,460 1,194 1,733 1,779 1,514 2,059
Line 2 979 747 1,220 1,436 1,174 1,705
Line 3 674 476 877 1,203 919 1,500
Line 4 470 305 641 1,035 731 1,347
Line 5 329 201 467 902 586 1,230
Line 6 230 131 345 788 482 1,118
Line 7 159 82 252 688 391 1,030
Line 8 107 49 183 591 305 938
Line 9 70 29 130 496 228 845
Line 10 45 16 91 402 162 748
Line 11 27 8 62 314 108 644
Line 12 16 4 41 232 67 540
Line 13 9 2 26 163 39 430
Line 14 5 1 16 107 20 330
Line 15 2 1 10 64 9 238
Line 16 1 1 6 34 4 153
Line 17 and greater
3 3 6 6 2 43
Page 34 of 50
http://mc.manuscriptcentral.com/pds
Pharmacoepidemiology and Drug Safety
123456789101112131415161718192021222324252627282930313233343536373839404142434445464748495051525354555657585960

For Review O
nly
34
Table C - 8. Median and Credible Intervals of the Number of Patients and Number of Patient Transitions, by Line of Therapy: Patients ≥65 Years, High
Cytogenetic Risk and Not Eligible for SCT
Treatment Lines
Number of Patients Number of Patient Transitions
95% Credible Interval 95% Credible Interval
Median Lower Upper Median Lower Upper
Line 1 2,106 1,718 2,512 3,597 3,090 4,111
Line 2 1,360 989 1,709 2,747 2,241 3,277
Line 3 902 580 1,205 2,217 1,612 2,787
Line 4 606 355 857 1,836 1,181 2,454
Line 5 413 219 619 1,540 903 2,177
Line 6 281 136 448 1,308 693 1,963
Line 7 189 82 324 1,109 537 1,770
Line 8 125 47 231 926 401 1,590
Line 9 80 26 163 754 284 1,397
Line 10 49 13 111 591 189 1,210
Line 11 29 7 75 442 117 1,005
Line 12 16 3 50 312 67 814
Line 13 9 2 32 204 34 629
Line 14 4 1 20 119 15 452
Line 15 2 1 12 60 6 292
Line 16 1 1 6 22 2 152
Line 17 and greater
1 1 2 4 1 39
Page 35 of 50
http://mc.manuscriptcentral.com/pds
Pharmacoepidemiology and Drug Safety
123456789101112131415161718192021222324252627282930313233343536373839404142434445464748495051525354555657585960

For Review Only
Diagnosis, symptomatic
1st
line
No SCT
SCT
2nd
line 3rd
line ………… ≥20th
line
μi+ν
ijk
μi+ν
ijk
progression to
symptomatic
Background mortality and MM-related mortality (μi+ν
ijk)
2nd
line 3rd
line ………… ≥20th
line 1st
line
Background mortality and MM-related mortality (μi+ν
ijk)
Dotted lines behind each blue compartment denote strata
(by age (<65, 65+ years) and high or low/standard cytogenetic risk group)
i.e. 4 compartments for each 1 shown here
incidence
Diagnosis, asymptomatic (smoldering)
μi+νijk – background and MM-related mortality. Subscripts denote differences in
mortality rates by treatment state. e.g., mortality varies by SCT eligibility to reflect the
higher frailty of SCT ineligible patients.
SCT (stem cell transplant): Induction therapy pre-SCT and maintenance post-SCT is modeled as one line of
therapy for the SCT treatment pathway.
Page 36 of 50
http://mc.manuscriptcentral.com/pds
Pharmacoepidemiology and Drug Safety
123456789101112131415161718192021222324252627282930313233343536373839404142434445464748495051525354555657585960

For Review Only
Page 37 of 50
http://mc.manuscriptcentral.com/pds
Pharmacoepidemiology and Drug Safety
123456789101112131415161718192021222324252627282930313233343536373839404142434445464748495051525354555657585960

For Review O
nly
October 2011
CONFLICT OF INTEREST DISCLOSURE
The Editors of Pharmacoepidemiology and Drug Safety recognize that most studies in
pharmacoepidemiology cost money and thus pose a potential conflict of interest. As a conflict of interest
may affect the assessment or judgment of an author, we ask that all authors (not just the Corresponding
Author) complete the following form.
For Co-authors: Please complete questions 4-10. Completed forms should be saved, and emailed as an
attachment to the Corresponding Author.
For Corresponding Authors: Please complete all questions. It is the responsibility of the Corresponding
Author to submit completed forms on behalf of all co-authors via Manuscript Central at the point of
manuscript submission.
Corresponding author only (Co-authors go to Question 4):
POTENTIAL STUDY INTERPRETATION CONFLICTS
1. Some or all of the data that were used in this study were provided by a company with a vested
interest in the product being studied. n/a
2. The sponsor of this project had the right of commenting but the authors retained the right to
accept or reject comments or suggestions. Yes
3. The sponsor of this project had the right of final editing and/or approval of the manuscript
submitted. No
Corresponding author and Co-authors:
POTENTIAL FINANCIAL CONFLICTS
4. I, my spouse, or one of my dependent children is an employee of a company whose product is
being studied. No
5. I, my spouse, or one of my dependent children has significant equity interest (>USD 10,000) in the
company that owns the product being studied. No
Page 38 of 50
http://mc.manuscriptcentral.com/pds
Pharmacoepidemiology and Drug Safety
123456789101112131415161718192021222324252627282930313233343536373839404142434445464748495051525354555657585960

For Review O
nly
October 2011
6. In the past three years I have:
• been paid as a consultant (or in a similar capacity) by a company with a vested interest in the
product being studied, on issues related to the product being studied; No
• been paid as a consultant (or in a similar capacity by a company with a vested interest in the
product being studies, on issues unrelated to the product being studied; No
• received research or educational support from a company with a vested interest in the product(s)
being studied. No
7. A company whose product is being studied has provided funding to support the work on this
project. No
If you have answered YES to any of the above questions, or if you have additional personal, commercial or
academic conflicts of interest, please draft a statement to publish with the article. e.g., AB has been
reimbursed by Safe Drug Ltd. for international conference attendance.
Representatives of Onyx Pharmaceuticals, an Amgen subsidiary, participated in this project
providing scientific advise, reviewing the model and commenting on the manuscript.
8. Manuscript title (first six words are sufficient)
Patient population with multiple myeloma and transitions across different lines of therapy in the US:
an epidemiologic model
9. Author’s full name (a separate form must be submitted for each author)
Javier CID RUZAFA
10. In checking this box, I confirm I have completed this form to the best of my knowledge.
This form is available online by clicking here
Page 39 of 50
http://mc.manuscriptcentral.com/pds
Pharmacoepidemiology and Drug Safety
123456789101112131415161718192021222324252627282930313233343536373839404142434445464748495051525354555657585960

For Review O
nly
October 2011
CONFLICT OF INTEREST DISCLOSURE
The Editors of Pharmacoepidemiology and Drug Safety recognize that most studies in
pharmacoepidemiology cost money and thus pose a potential conflict of interest. As a conflict of interest
may affect the assessment or judgment of an author, we ask that all authors (not just the Corresponding
Author) complete the following form.
For Co-authors: Please complete questions 4-10. Completed forms should be saved, and emailed as an
attachment to the Corresponding Author.
For Corresponding Authors: Please complete all questions. It is the responsibility of the Corresponding
Author to submit completed forms on behalf of all co-authors via Manuscript Central at the point of
manuscript submission.
Corresponding author only (Co-authors go to Question 4):
POTENTIAL STUDY INTERPRETATION CONFLICTS
1. Some or all of the data that were used in this study were provided by a company with a vested
interest in the product being studied. n/a
2. The sponsor of this project had the right of commenting but the authors retained the right to
accept or reject comments or suggestions. n/a
3. The sponsor of this project had the right of final editing and/or approval of the manuscript
submitted. n/a
Corresponding author and Co-authors:
POTENTIAL FINANCIAL CONFLICTS
4. I, my spouse, or one of my dependent children is an employee of a company whose product is
being studied. No
5. I, my spouse, or one of my dependent children has significant equity interest (>USD 10,000) in the
company that owns the product being studied. No
Page 40 of 50
http://mc.manuscriptcentral.com/pds
Pharmacoepidemiology and Drug Safety
123456789101112131415161718192021222324252627282930313233343536373839404142434445464748495051525354555657585960

For Review O
nly
October 2011
6. In the past three years I have:
• been paid as a consultant (or in a similar capacity) by a company with a vested interest in the
product being studied, on issues related to the product being studied; No
• been paid as a consultant (or in a similar capacity by a company with a vested interest in the
product being studies, on issues unrelated to the product being studied; No
• received research or educational support from a company with a vested interest in the product(s)
being studied. No
7. A company whose product is being studied has provided funding to support the work on this
project. No
If you have answered YES to any of the above questions, or if you have additional personal, commercial or
academic conflicts of interest, please draft a statement to publish with the article. e.g., AB has been
reimbursed by Safe Drug Ltd. for international conference attendance.
Evie Merinopoulou has been an employee of Evidera and served as paid consultant to Onyx
Pharmaceuticals for the work in this study.
8. Manuscript title (first six words are sufficient)
Patient population with multiple myeloma and transitions across different lines of therapy in the US:
an epidemiologic model
9. Author’s full name (a separate form must be submitted for each author)
Evie Merinopoulou
10. In checking this box, I confirm I have completed this form to the best of my knowledge.
This form is available online by clicking here
Page 41 of 50
http://mc.manuscriptcentral.com/pds
Pharmacoepidemiology and Drug Safety
123456789101112131415161718192021222324252627282930313233343536373839404142434445464748495051525354555657585960

For Review O
nly
October 2011
CONFLICT OF INTEREST DISCLOSURE
The Editors of Pharmacoepidemiology and Drug Safety recognize that most studies in
pharmacoepidemiology cost money and thus pose a potential conflict of interest. As a conflict of interest
may affect the assessment or judgment of an author, we ask that all authors (not just the Corresponding
Author) complete the following form.
For Co-authors: Please complete questions 4-10. Completed forms should be saved, and emailed as an
attachment to the Corresponding Author.
For Corresponding Authors: Please complete all questions. It is the responsibility of the Corresponding
Author to submit completed forms on behalf of all co-authors via Manuscript Central at the point of
manuscript submission.
Corresponding author only (Co-authors go to Question 4):
POTENTIAL STUDY INTERPRETATION CONFLICTS
1. Some or all of the data that were used in this study were provided by a company with a vested
interest in the product being studied. n/a
2. The sponsor of this project had the right of commenting but the authors retained the right to
accept or reject comments or suggestions. n/a
3. The sponsor of this project had the right of final editing and/or approval of the manuscript
submitted. n/a
Corresponding author and Co-authors:
POTENTIAL FINANCIAL CONFLICTS
4. I, my spouse, or one of my dependent children is an employee of a company whose product is
being studied. No
5. I, my spouse, or one of my dependent children has significant equity interest (>USD 10,000) in the
company that owns the product being studied. No
Page 42 of 50
http://mc.manuscriptcentral.com/pds
Pharmacoepidemiology and Drug Safety
123456789101112131415161718192021222324252627282930313233343536373839404142434445464748495051525354555657585960

For Review O
nly
October 2011
6. In the past three years I have:
• been paid as a consultant (or in a similar capacity) by a company with a vested interest in the
product being studied, on issues related to the product being studied; No
• been paid as a consultant (or in a similar capacity by a company with a vested interest in the
product being studies, on issues unrelated to the product being studied; No
• received research or educational support from a company with a vested interest in the product(s)
being studied. No
7. A company whose product is being studied has provided funding to support the work on this
project. No
If you have answered YES to any of the above questions, or if you have additional personal, commercial or
academic conflicts of interest, please draft a statement to publish with the article. e.g., AB has been
reimbursed by Safe Drug Ltd. for international conference attendance.
8. Manuscript title (first six words are sufficient)
Patient population with multiple myeloma and transitions across different lines of therapy in the US:
an epidemiologic model
9. Author’s full name (a separate form must be submitted for each author)
Rebecca F Baggaley
10. In checking this box, I confirm I have completed this form to the best of my knowledge.
This form is available online by clicking here
Page 43 of 50
http://mc.manuscriptcentral.com/pds
Pharmacoepidemiology and Drug Safety
123456789101112131415161718192021222324252627282930313233343536373839404142434445464748495051525354555657585960

For Review O
nly
October 2011
CONFLICT OF INTEREST DISCLOSURE
The Editors of Pharmacoepidemiology and Drug Safety recognize that most studies in
pharmacoepidemiology cost money and thus pose a potential conflict of interest. As a conflict of interest
may affect the assessment or judgment of an author, we ask that all authors (not just the Corresponding
Author) complete the following form.
For Co-authors: Please complete questions 4-10. Completed forms should be saved, and emailed as an
attachment to the Corresponding Author.
For Corresponding Authors: Please complete all questions. It is the responsibility of the Corresponding
Author to submit completed forms on behalf of all co-authors via Manuscript Central at the point of
manuscript submission.
Corresponding author only (Co-authors go to Question 4):
POTENTIAL STUDY INTERPRETATION CONFLICTS
1. Some or all of the data that were used in this study were provided by a company with a vested
interest in the product being studied. n/a
2. The sponsor of this project had the right of commenting but the authors retained the right to
accept or reject comments or suggestions. n/a
3. The sponsor of this project had the right of final editing and/or approval of the manuscript
submitted. n/a
Corresponding author and Co-authors:
POTENTIAL FINANCIAL CONFLICTS
4. I, my spouse, or one of my dependent children is an employee of a company whose product is
being studied. No
5. I, my spouse, or one of my dependent children has significant equity interest (>USD 10,000) in the
company that owns the product being studied. No
Page 44 of 50
http://mc.manuscriptcentral.com/pds
Pharmacoepidemiology and Drug Safety
123456789101112131415161718192021222324252627282930313233343536373839404142434445464748495051525354555657585960

For Review O
nly
October 2011
6. In the past three years I have:
• been paid as a consultant (or in a similar capacity) by a company with a vested interest in the
product being studied, on issues related to the product being studied; No
• been paid as a consultant (or in a similar capacity by a company with a vested interest in the
product being studies, on issues unrelated to the product being studied; No
• received research or educational support from a company with a vested interest in the product(s)
being studied. No
7. A company whose product is being studied has provided funding to support the work on this
project. No
If you have answered YES to any of the above questions, or if you have additional personal, commercial or
academic conflicts of interest, please draft a statement to publish with the article. e.g., AB has been
reimbursed by Safe Drug Ltd. for international conference attendance.
This work was funded by Onyx Pharmaceuticals. Leighton P was employed by Evidera and served as
consultant to Onyx Pharmaceuticals.
8. Manuscript title (first six words are sufficient)
Patient population with multiple myeloma and transitions across different lines of therapy in the US:
an epidemiologic model
9. Author’s full name (a separate form must be submitted for each author)
Pamela Leighton
10. In checking this box, I confirm I have completed this form to the best of my knowledge.
This form is available online by clicking here
Page 45 of 50
http://mc.manuscriptcentral.com/pds
Pharmacoepidemiology and Drug Safety
123456789101112131415161718192021222324252627282930313233343536373839404142434445464748495051525354555657585960

For Review O
nly
October 2011
CONFLICT OF INTEREST DISCLOSURE
The Editors of Pharmacoepidemiology and Drug Safety recognize that most studies in
pharmacoepidemiology cost money and thus pose a potential conflict of interest. As a conflict of interest
may affect the assessment or judgment of an author, we ask that all authors (not just the Corresponding
Author) complete the following form.
For Co-authors: Please complete questions 4-10. Completed forms should be saved, and emailed as an
attachment to the Corresponding Author.
For Corresponding Authors: Please complete all questions. It is the responsibility of the Corresponding
Author to submit completed forms on behalf of all co-authors via Manuscript Central at the point of
manuscript submission.
Corresponding author only (Co-authors go to Question 4):
POTENTIAL STUDY INTERPRETATION CONFLICTS
1. Some or all of the data that were used in this study were provided by a company with a vested
interest in the product being studied. n/a
2. The sponsor of this project had the right of commenting but the authors retained the right to
accept or reject comments or suggestions. n/a
3. The sponsor of this project had the right of final editing and/or approval of the manuscript
submitted. n/a
Corresponding author and Co-authors:
POTENTIAL FINANCIAL CONFLICTS
4. I, my spouse, or one of my dependent children is an employee of a company whose product is
being studied. Yes
5. I, my spouse, or one of my dependent children has significant equity interest (>USD 10,000) in the
company that owns the product being studied. Yes
Page 46 of 50
http://mc.manuscriptcentral.com/pds
Pharmacoepidemiology and Drug Safety
123456789101112131415161718192021222324252627282930313233343536373839404142434445464748495051525354555657585960

For Review O
nly
October 2011
6. In the past three years I have:
• been paid as a consultant (or in a similar capacity) by a company with a vested interest in the
product being studied, on issues related to the product being studied; No
• been paid as a consultant (or in a similar capacity by a company with a vested interest in the
product being studies, on issues unrelated to the product being studied; No
• received research or educational support from a company with a vested interest in the product(s)
being studied. No
7. A company whose product is being studied has provided funding to support the work on this
project. No
If you have answered YES to any of the above questions, or if you have additional personal, commercial or
academic conflicts of interest, please draft a statement to publish with the article. e.g., AB has been
reimbursed by Safe Drug Ltd. for international conference attendance.
I am an employee of Onyx Pharmaceuticals, an Amgen Subsidiary, who funded this research.
8. Manuscript title (first six words are sufficient)
Patient population with multiple myeloma and transitions across different lines of therapy in the US:
an epidemiologic model
9. Author’s full name (a separate form must be submitted for each author)
Winifred Werther
10. In checking this box, I confirm I have completed this form to the best of my knowledge.
This form is available online by clicking here
Page 47 of 50
http://mc.manuscriptcentral.com/pds
Pharmacoepidemiology and Drug Safety
123456789101112131415161718192021222324252627282930313233343536373839404142434445464748495051525354555657585960

For Review O
nly
October 2011
CONFLICT OF INTEREST DISCLOSURE
The Editors of Pharmacoepidemiology and Drug Safety recognize that most studies in
pharmacoepidemiology cost money and thus pose a potential conflict of interest. As a conflict of interest
may affect the assessment or judgment of an author, we ask that all authors (not just the Corresponding
Author) complete the following form.
For Co-authors: Please complete questions 4-10. Completed forms should be saved, and emailed as an
attachment to the Corresponding Author.
For Corresponding Authors: Please complete all questions. It is the responsibility of the Corresponding
Author to submit completed forms on behalf of all co-authors via Manuscript Central at the point of
manuscript submission.
Corresponding author only (Co-authors go to Question 4):
POTENTIAL STUDY INTERPRETATION CONFLICTS
1. Some or all of the data that were used in this study were provided by a company with a vested
interest in the product being studied. n/a
2. The sponsor of this project had the right of commenting but the authors retained the right to
accept or reject comments or suggestions. n/a
3. The sponsor of this project had the right of final editing and/or approval of the manuscript
submitted. n/a
Corresponding author and Co-authors:
POTENTIAL FINANCIAL CONFLICTS
4. I, my spouse, or one of my dependent children is an employee of a company whose product is
being studied. Yes
5. I, my spouse, or one of my dependent children has significant equity interest (>USD 10,000) in the
company that owns the product being studied. Yes
Page 48 of 50
http://mc.manuscriptcentral.com/pds
Pharmacoepidemiology and Drug Safety
123456789101112131415161718192021222324252627282930313233343536373839404142434445464748495051525354555657585960
For Review O
nly
October 2011
6. In the past three years I have:
• been paid as a consultant (or in a similar capacity) by a company with a vested interest in the
product being studied, on issues related to the product being studied; Yes
• been paid as a consultant (or in a similar capacity by a company with a vested interest in the
product being studies, on issues unrelated to the product being studied; Yes
• received research or educational support from a company with a vested interest in the product(s)
being studied. No
7. A company whose product is being studied has provided funding to support the work on this
project. No
If you have answered YES to any of the above questions, or if you have additional personal, commercial or
academic conflicts of interest, please draft a statement to publish with the article. e.g., AB has been
reimbursed by Safe Drug Ltd. for international conference attendance.
I have been paid as a consultant (or in a similar capacity) by Onyx, a subsidiary of Amgen, with a
vested interest in the product being studied.
8. Manuscript title (first six words are sufficient)
Patient population with multiple myeloma and transitions across different lines of therapy in the US:
an epidemiologic model
9. Author’s full name (a separate form must be submitted for each author)
Diana Felici
10. In checking this box, I confirm I have completed this form to the best of my knowledge.
This form is available online by clicking here
Page 49 of 50
http://mc.manuscriptcentral.com/pds
Pharmacoepidemiology and Drug Safety
123456789101112131415161718192021222324252627282930313233343536373839404142434445464748495051525354555657585960

For Review O
nly
October 2011
CONFLICT OF INTEREST DISCLOSURE
The Editors of Pharmacoepidemiology and Drug Safety recognize that most studies in
pharmacoepidemiology cost money and thus pose a potential conflict of interest. As a conflict of interest
may affect the assessment or judgment of an author, we ask that all authors (not just the Corresponding
Author) complete the following form.
For Co-authors: Please complete questions 4-10. Completed forms should be saved, and emailed as an
attachment to the Corresponding Author.
For Corresponding Authors: Please complete all questions. It is the responsibility of the Corresponding
Author to submit completed forms on behalf of all co-authors via Manuscript Central at the point of
manuscript submission.
Corresponding author only (Co-authors go to Question 4):
POTENTIAL STUDY INTERPRETATION CONFLICTS
1. Some or all of the data that were used in this study were provided by a company with a vested
interest in the product being studied. n/a
2. The sponsor of this project had the right of commenting but the authors retained the right to
accept or reject comments or suggestions. n/a
3. The sponsor of this project had the right of final editing and/or approval of the manuscript
submitted. n/a
Corresponding author and Co-authors:
POTENTIAL FINANCIAL CONFLICTS
4. I, my spouse, or one of my dependent children is an employee of a company whose product is
being studied. No
5. I, my spouse, or one of my dependent children has significant equity interest (>USD 10,000) in the
company that owns the product being studied. No
Page 50 of 50
http://mc.manuscriptcentral.com/pds
Pharmacoepidemiology and Drug Safety
123456789101112131415161718192021222324252627282930313233343536373839404142434445464748495051525354555657585960

For Review O
nly
October 2011
6. In the past three years I have:
• been paid as a consultant (or in a similar capacity) by a company with a vested interest in the
product being studied, on issues related to the product being studied; No
• been paid as a consultant (or in a similar capacity by a company with a vested interest in the
product being studies, on issues unrelated to the product being studied; No
• received research or educational support from a company with a vested interest in the product(s)
being studied. No
7. A company whose product is being studied has provided funding to support the work on this
project. No
If you have answered YES to any of the above questions, or if you have additional personal, commercial or
academic conflicts of interest, please draft a statement to publish with the article. e.g., AB has been
reimbursed by Safe Drug Ltd. for international conference attendance.
8. Manuscript title (first six words are sufficient)
Patient population with Multiple Myeloma and
9. Author’s full name (a separate form must be submitted for each author)
Andrew Paul Cox
10. In checking this box, I confirm I have completed this form to the best of my knowledge.
This form is available online by clicking here
Page 51 of 50
http://mc.manuscriptcentral.com/pds
Pharmacoepidemiology and Drug Safety
123456789101112131415161718192021222324252627282930313233343536373839404142434445464748495051525354555657585960