cif stock recommendation report (spring 2015) · cif stock recommendation report (spring 2015)...
TRANSCRIPT

1
Date:___04/12/2015_____
Analyst Name:_Connor Proff & Jake Courtright__
CIF Stock Recommendation Report (Spring 2015)
Company Name and Ticker:_ConocoPhillips (NYSE:COP)__
Section (A) Investment Summary
Recommendation Buy: Yes No Target Price:$76.51 Stop-Loss Price:$56.55
Sector:Energy Industry:Oil & Gas Exploration & Production
Market Cap (in Billions): $81,929.15
# of Shrs. O/S (in Millions): 1,231.46M
Current Price:66.53 52 WK Hi: 87.09
52 WK Low: 60.57
EBO Valuation: 47.24
Morningstar (MS) Fair Value Est.:
MS FV Uncertainty: High MS Consider Buying: 39 MS Consider Selling: 100.75
EPS (TTM):-28.43% EPS (FY1): .65 EPS (FY2): 2.73 MS Star Rating:3 star
Next Fiscal Yr. End ”Year”:2015 “Month”: December
Last Fiscal Qtr. End: Less Than 8 WK: Y N
If Less Than 8 WK, next Earnings Ann. Date: 4/30
Analyst Consensus Recommendation: 4.5
Forward P/E:24.37 Mean LT Growth: -3.15 PEG: -7.74 Beta:1.07
% Inst. Ownership: 70.01%
Inst. Ownership- Net Buy: Y N
Short Interest Ratio: 4.5 Short as % of Float: 2.6%
Ratio Analysis Company Industry Sector
P/E (TTM) 14.43 37.88 20.90
P/S (TTM) 1.56 1.44 1.71
P/B (MRQ) 1.58 0.55 1.72
P/CF (TTM) 5.8 5.25 9.42
Dividend Yield 4.39 1.68 3.16
Total Debt/Equity (MRQ) 43.47 60.34 50.14
Net Profit Margin (TTM) 11.07 1.87 .06
ROA (TTM) 4.95 0.85 5.49
ROE (TTM) 11.03 1.57 9.89
2
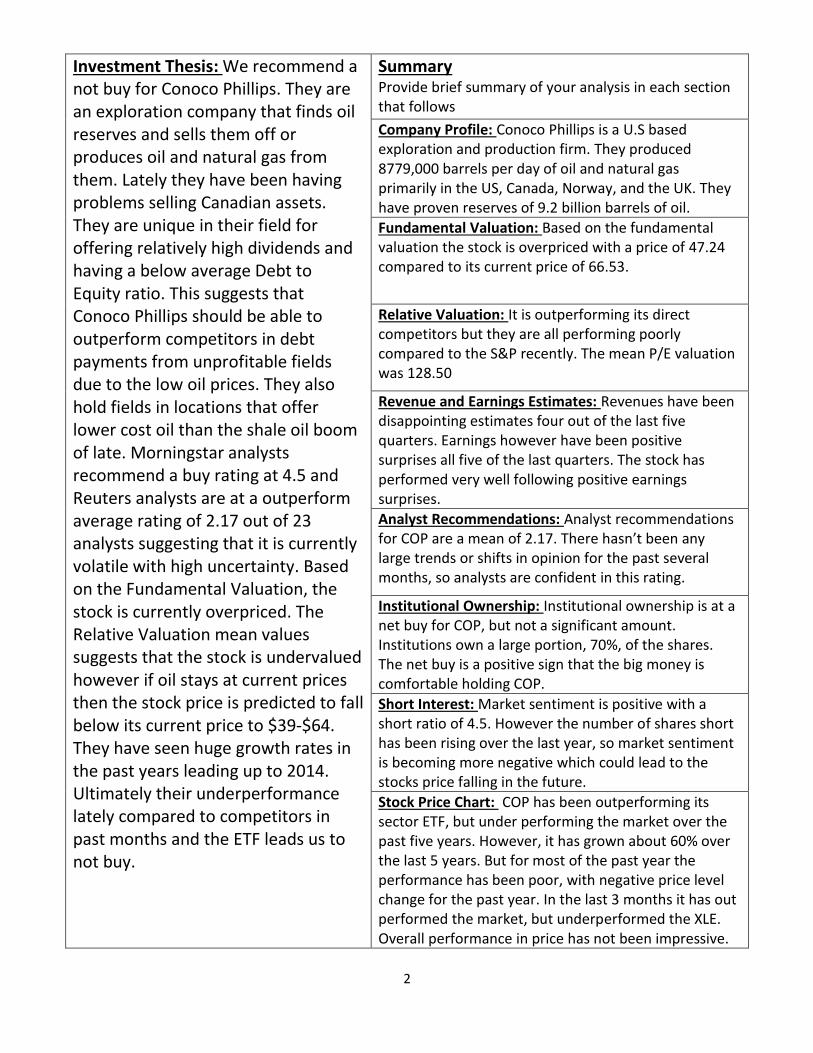
Investment Thesis: We recommend a not buy for Conoco Phillips. They are an exploration company that finds oil reserves and sells them off or produces oil and natural gas from them. Lately they have been having problems selling Canadian assets. They are unique in their field for offering relatively high dividends and having a below average Debt to Equity ratio. This suggests that Conoco Phillips should be able to outperform competitors in debt payments from unprofitable fields due to the low oil prices. They also hold fields in locations that offer lower cost oil than the shale oil boom of late. Morningstar analysts recommend a buy rating at 4.5 and Reuters analysts are at a outperform average rating of 2.17 out of 23 analysts suggesting that it is currently volatile with high uncertainty. Based on the Fundamental Valuation, the stock is currently overpriced. The Relative Valuation mean values suggests that the stock is undervalued however if oil stays at current prices then the stock price is predicted to fall below its current price to $39-$64. They have seen huge growth rates in the past years leading up to 2014. Ultimately their underperformance lately compared to competitors in past months and the ETF leads us to not buy.
Summary Provide brief summary of your analysis in each section that follows
Company Profile: Conoco Phillips is a U.S based exploration and production firm. They produced 8779,000 barrels per day of oil and natural gas primarily in the US, Canada, Norway, and the UK. They have proven reserves of 9.2 billion barrels of oil.
Fundamental Valuation: Based on the fundamental valuation the stock is overpriced with a price of 47.24 compared to its current price of 66.53.
Relative Valuation: It is outperforming its direct competitors but they are all performing poorly compared to the S&P recently. The mean P/E valuation was 128.50
Revenue and Earnings Estimates: Revenues have been disappointing estimates four out of the last five quarters. Earnings however have been positive surprises all five of the last quarters. The stock has performed very well following positive earnings surprises.
Analyst Recommendations: Analyst recommendations for COP are a mean of 2.17. There hasn’t been any large trends or shifts in opinion for the past several months, so analysts are confident in this rating.
Institutional Ownership: Institutional ownership is at a net buy for COP, but not a significant amount. Institutions own a large portion, 70%, of the shares. The net buy is a positive sign that the big money is comfortable holding COP.
Short Interest: Market sentiment is positive with a short ratio of 4.5. However the number of shares short has been rising over the last year, so market sentiment is becoming more negative which could lead to the stocks price falling in the future.
Stock Price Chart: COP has been outperforming its sector ETF, but under performing the market over the past five years. However, it has grown about 60% over the last 5 years. But for most of the past year the performance has been poor, with negative price level change for the past year. In the last 3 months it has out performed the market, but underperformed the XLE. Overall performance in price has not been impressive.

3
Section (B) Company Profile
(B-1) Profile
Include in this section, at the minimum:
Company Description; major business units and % breakdown of revenue/earnings; %
breakdown of domestic and international business; business model; management strategy;
competition and competitors of each major business unit; sensitivity to business cycle &
macro environment; life cycle; significant merger/acquisition or major restructure in recent
years; significant pending litigations, material patents or other intellectual properties-related
issues; major risk factors; other company or industry-specific development or issues deemed
material (e.g., labor disputes, trade tensions, regulatory or policy changes, technology &
product innovations, natural disasters, etc.)
Conoco Phillips runs a diversified portfolio and produces nearly twice as much as its closest
peer. With its size comes a low growth rate and more exposure to price risk. The target
matches up with its former integrated peers like Exxon Mobil and Chevron but falls short
compared to the smaller rivals that are more focused. The diversified portfolio in onshore,
offshore, LNG, sands, and more assets is viewed as less attractive that higher focused
companies. Their main fields are the Eagle Ford, Permian, and Bakken positions. They also see
growth in Southeast Asia in the North Sea and Australia. The current margin growths are
dependent on an oil price recovery in the coming year. They are committed to maintaining
dividends through 2017. The Industry is due to see many mergers and acquisitions as prices
stay low and companies that can’t stay afloat sell at a loss or steep discount.
(B-2) Revenue and Earnings History (Refer to the guidelines document for revenue and
earnings data to be included)

4
1) What are your observations on revenue? Was there a notable up- or down-trend, year-
over-year? Was there seasonable pattern?
They have seen a decline in revenue over the past 3 years. There is a down trend over the
past year from quarter to quarter.
2) Likewise, what are your observations on earnings?
The same trends exist for earnings droping in the last quarter by half to .58 from 1.2 the
quarter prior. This is highly related to the price of ail so they should see growth if prices
start to show signs of picking up.
(B-3) Most Recent Quarterly Earnings Release
1) When was the company’s most recent earning release?
1/29/2015
2) In that earnings report, was reported revenue a (1) beat, (2) match, or (3) miss from
consensus estimate?
It was reported a miss at 11,851.0 million compared to estimates of 13,045.20 million.
3) Likewise, was reported earnings a (1) beat, (2) match, or (3) miss from consensus
estimate?
It was a beat at 0.60 from an estimated 0.58 per share.
4) What did the management attribute the beat/miss to?

5
They attributed it to low oil prices and the decline in December
5) Did the management provide guidance about their current quarter and their outlook for
the year? What were the key points of the guidance?
They have cut back on Cap Ex to 11.5 billion from 13.5 announced previously. They expect
this to counter weak price outlooks with the flexibility within their balance sheets and don’t
expect to have to decrease dividends to maintain its price. They also expect a reduction in
reserve replacement to be 97% as they extract less.
6) How did the stock react to that earnings release?
It reacted positively as they managed a unexpected beat due to conditions at the time in
the industry. It rose from 62.98 to 67.74 in the days that followed.
7) Other observations worth noting?
Section (C) Fundamental Valuation (EBO)
Include the following here:
Copy/paste completed Fundamental Valuation (EBO) Spreadsheet
AGN
PARAMETERS FY1 FY2 Ltg
Long-te rm
Gowth
Pe riod
( Ye ars)
EPS Fore casts 0.65 2.73 -3.15% 5
Total Equity 51911.00
Pre fe rre d Stock 0.00
Book Value (e nd of last fye ) 51911.00 Fundamental Valuation (EBO)
Common Equity Shr. O/S 1231.35 Model 1: 9, 10, or 12-year forecasting horizon (T=9, 10 or 12).
Book value /share (last fye ) 42.158 with a 4, 5 or 7-year growth period.
30- Ye ar T-Bond Rate 2.58%
E(rm) 8.00%
Be ta 1.07
Discount Rate 8.38%
Divide nd Payout Ratio (POR) 4.39% Please download and save this template to your own storage device
Ne xt Fsc Ye ar e nd 2015 You only ne e d to input value s to ce lls highlighte d in "ye llow"
Curre nt Fsc Mth (1 to 12) 4 The re st o f the spre adshe e t is calculate d automatically
Targe t ROE (industry avg .) 11.03% Ple ase re ad "Guide line s_for_Fundame ntalValuation_ProfLe e _Spre adshe e t" file care fully
Ye ar 2015 2016 2017 2018 2019 2020 2021 2022 2023 2024 2025 2026
Long-term EPS Growth Rate (Ltg) -0.0315 -0.0315 -0.0315
Forecasted EPS 0.65 2.73 2.64 2.56 2.48
Beg. of year BV/Shr 42.158 42.779 45.389 47.917 50.366
Implied ROE 0.064 0.058 0.053 0.049
ROE (Beg. ROE, from EPS forecasts) 0.015 0.064 0.058 0.053 0.049 0.061 0.074 0.086 0.098 0.110
Abnormal ROE (ROE-k) -0.068 -0.020 -0.026 -0.030 -0.035 -0.022 -0.010 0.002 0.014 0.027
growth rate for B (1-POR)*(ROEt-1) 0.000 0.015 0.061 0.056 0.051 0.047 0.059 0.070 0.082 0.094
Compounded growth 1.000 1.015 1.077 1.137 1.195 1.251 1.324 1.418 1.534 1.678
growth*AROE -0.068 -0.020 -0.028 -0.035 -0.041 -0.028 -0.013 0.003 0.022 0.044
required rate (k) 0.084 0.084 0.084 0.084 0.084 0.084 0.084 0.084 0.084 0.084 0.084
Compound discount rate 1.084 1.175 1.273 1.380 1.495 1.621 1.756 1.904 2.063 2.236
div. payout rate (k) 0.044
Add to P/B PV(growth*AROE) -0.06 -0.02 -0.02 -0.03 -0.03 -0.02 -0.01 0.00 0.01 0.02
Cum P/B 0.94 0.92 0.90 0.87 0.85 0.83 0.82 0.82 0.83 0.85
Add: Perpetuity
beyond current yr (Assume this yr's AROE forever) -0.75 -0.21 -0.26 -0.30 -0.33 -0.21 -0.09 0.02 0.13 0.24
Total P/B (P/B if we stop est. this period) 0.18 0.71 0.64 0.57 0.52 0.62 0.73 0.84 0.96 1.09
Implie d price 7.97 30.93 27.75 24.90 22.36 26.97 31.61 36.43 41.58 47.24
Che ck:
Beg. BV/Shr 42.158 42.779 45.389 47.917 50.366 52.737 55.835 59.768 64.675 70.741
Implied EPS 0.650 2.730 2.644 2.561 2.480 3.241 4.113 5.133 6.344 7.803
Implied EPS growth 3.200 -0.031 -0.032 -0.032 0.307 0.269 0.248 0.236 0.230

6
Inputs (provide below input values used in your analysis)
EPS forecasts (FY1 & FY2): _.65% and 2.73%_______
Long-term growth rate: ___-3.15%____________
*** Indicate next to the number if you made an adjustment to the consensus LTG estimate.
Justify at the bottom of this panel how you derive the adjusted value, if any ***
Book value /share (along with book value and number of shares outstanding):
Book value: _____51,911.00M________
# of shares outstanding: ____1,231.46M__________
Book value / share: _____$42.16____________
Dividend payout ratio: ___4.39%_______________
Next fiscal year end: ___2015_______________
Current fiscal month: ____4_________________
Target ROE: ____11.03%____________
*** Indicate next to the number if you made an adjustment to the target ROE estimate.
Justify at the bottom of this panel how you derive the adjusted value, if any ***
Discount rate ______8.3798%_________
Input for discount rate:
Risk-free rate: ______2.58____________
Beta: ______1.07____________
Market risk premium: _______8%____________
Output
Above normal growth period chosen: ____5 yr_____________
*** Justify at the bottom of this panel your choice of abnormal growth period ***
EBO valuation (Implied price from the spreadsheet): ___47.24______________
1) Comment on the fundamental value obtained in relation to the stock’s current price and
its 52-week price range.
The stock is currently overpriced when comparing our valuation of 47.24 to its 52 week
range of 60.57-87.09 and current price of $66.53.
2) What might be “soft spots” of the inputs? And why?
A soft spot for the input would be its long term growth rate due to oil prices. If the price of
oil were to rise again after the current oversupply then we could see its growth rate become
positive and see a much higher valuation.
Sensitivity Analysis

7
1) Explain the input values used in sensitivity analysis. Compare the fundamental values
obtained here in relation to the value from the base case
For the sensitivity analysis, we changed the growth period to 4 years due to the
unpredictability of oil prices in the recent year and its long term impact. When using the
highest estimate for LTG of 7.5% we saw the valuation rise up to 50.35 implying that a price
increase is likely if oil prices turn around. If they stay depressed however and using the
lowest estimate of -10% growth we see the stock fall 3% to $45.55 valuation. When using
the company’s 5 yr avg for ROE we see the stock price rise to 58.81 from 47.24 which is the
closest to its 52 week low.
2) Other observations worth noting
If we change the discount rate to 7.31% and its ROE to its 5 yr average of 13.24% we get a
valuation of $73.28 which is above the current price and reflects that a sudden change in oil
prices could boost earnings drastically.
EBO valuation would be (you can include more than one scenario in each of the following):
___$49.18________ if changing above normal growth period to ____4 years_______
___$50.35_______ if changing growth rate from mean (consensus) to the highest estimate
__7.5%__
____$45.55_ if changing growth rate from mean (consensus) to the lowest estimate __-10%_
____$58.84_________ if changing discount rate to ____7.31%_________
____$58.81_______if changing target ROE to ____13.24 (5 yr avg.)______
Section (D) Relative Valuation
Copy/paste your completed relative valuation spreadsheet here

8
Note: Your discussions in this section should address all of the following valuation
metrics: forward P/E, PEG, P/B (MRQ), P/S (TTM), and P/CF (TTM). If you made a
decision excluding a competitor from calculation of median of a particular valuation
multiple, you must justify your decision (i.e., reasons why you feel strongly that
particular valuation multiple from a particular competitor is not a good indicator).
1) Discuss various valuation multiples of your stock and its peers. Comment if any of these
stocks have multiples far off from the others and explain whether it makes sense.
They all have a negative PEG ratio which makes sense given the steep declines in oil the past
year. The Forward P/E makes sense for and Andarko has a huge extreme due to their
extremely poor performance lately and high overvaluation. All the companies have a P/B
that is near 2.0 and ConocoPhillips falls in the middle of the pack for its ROE, P/S/ and P/CF.
2) Discuss the various implied prices of your stock derived from peers’ (“Comparables”)
multiples. Compare these implied prices to current price and 52-week high and low. How
different are the prices derived from the various valuation metrics? Note any valuation
metrics that seem to yield outlier prices and explain whether it makes sense.
The Mean prices fall between the 52 week ranges based on P/B, Value Ratio, P/S, and P/CF.
The highest valuation based on Forward P/E puts it at almost double its current price of
66.53 to $128.50.
3) Compare your findings with comments from analysts from Morningstar Direct and other
online resources.
AGN
Mean FY2
Earnings Estimate Forward Mean LT PEG P/B ROE Value P/S P/CF
Ticker Name Mkt Cap Current Price (next fiscal year) P/E Growth Rate (MRQ) 5 yr ave Ratio TTM TTM
1 XOM Exxon Mobil 358,897.69$ 85.56$ 5.31$ 16.11 -1.15% -14.01 2.06 23.16% 0.09 0.91 7.05
2 APC Andarko Petroleum Corp 46,444.52$ 90.10$ 0.87$ 103.56 -30.40% -3.41 2.31 -0.47% -4.91 2.51 15.55
3 EOG EOG Resources Inc. 74,300.00$ 96.59$ 1.86$ 51.93 -9.65% -5.38 2.99 10.60% 0.28 3.02 7.66
4 CVX Chevron Corp 201,041.91$ 106.91$ 6.41$ 16.68 -3.66% -4.56 1.30 17.74% 0.07 1.01 5.57
COP Conoco Phillips 81,929.15$ 66.53$ 2.73$ 24.37 -3.15% -7.74 1.58 13.24% 0.12 1.56 5.8
Implied Price based on: P/E (forward) PEG P/B Value P/S P/CF
1 XOM Exxon Mobil $43.99 $120.49 $86.74 $49.59 $38.81 $80.87
2 APC Andarko Petroleum Corp $282.73 $29.30 $97.27 -$2,740.08 $107.05 $178.37
3 EOG EOG Resources Inc. $141.77 $46.28 $125.90 $157.26 $128.80 $87.87
4 CVX Chevron Corp $45.53 $39.19 $54.74 $40.85 $43.07 $63.89
High $282.73 $120.49 $125.90 $157.26 $128.80 $178.37
Low $43.99 $29.30 $54.74 -$2,740.08 $38.81 $63.89
Mean $128.50 $58.81 $91.16 $82.57 $79.43 $102.75
*excludes Andarko
Cougar Investment Fund Relative Valuation Template
Please download and save this template to your own storage device
You only need to input values to ce lls highlighted in "ye llow"
The rest of the spreadsheet is calculated automatically
Please read "Stock Recommendation Report Guide lines" document carefully
9
The findings are higher than the morning star fair value estimates of $65 with a
recommended sell at $100.75. They feel that they have a low LTG and the lower P/CF
which could lead to cutbacks in CapEx less than those of competitors if it stays
depressed.
4) Other observations worth noting?
Section (E) Revenue and Earnings Estimates
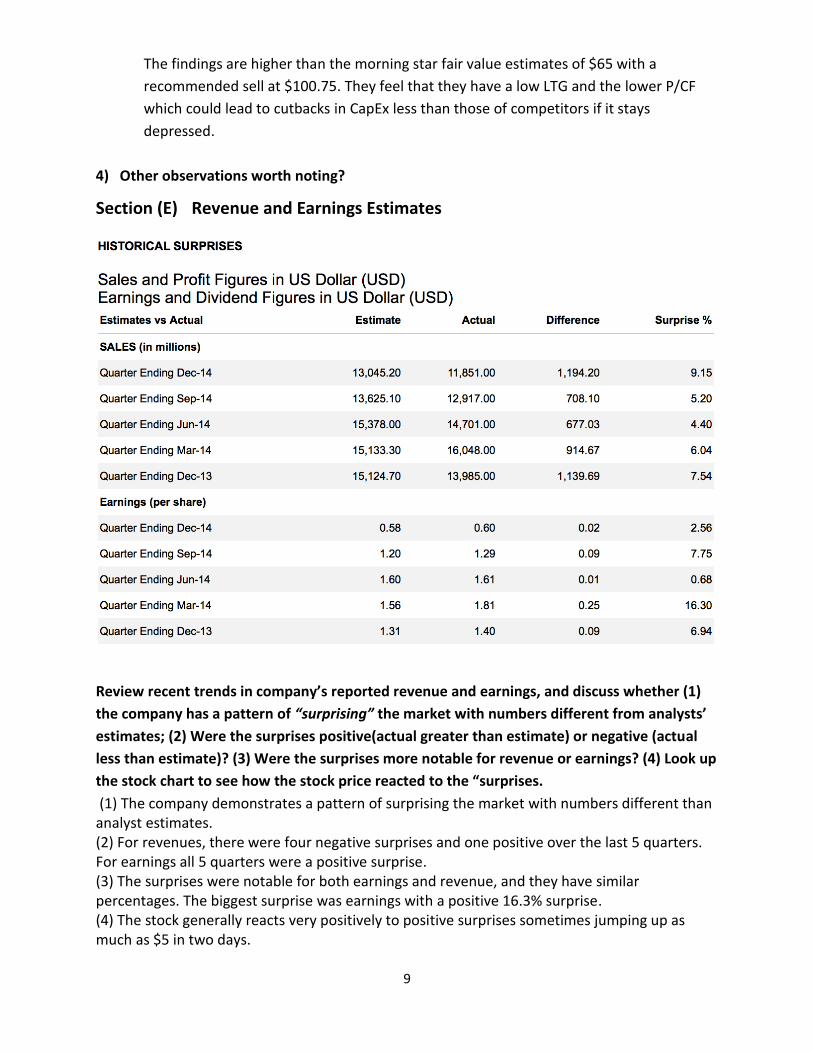
Review recent trends in company’s reported revenue and earnings, and discuss whether (1)
the company has a pattern of “surprising” the market with numbers different from analysts’
estimates; (2) Were the surprises positive(actual greater than estimate) or negative (actual
less than estimate)? (3) Were the surprises more notable for revenue or earnings? (4) Look up
the stock chart to see how the stock price reacted to the “surprises.
(1) The company demonstrates a pattern of surprising the market with numbers different than analyst estimates. (2) For revenues, there were four negative surprises and one positive over the last 5 quarters. For earnings all 5 quarters were a positive surprise. (3) The surprises were notable for both earnings and revenue, and they have similar percentages. The biggest surprise was earnings with a positive 16.3% surprise. (4) The stock generally reacts very positively to positive surprises sometimes jumping up as much as $5 in two days.

10
Overall the content of these tables are consistent with analyst reports and opinions on Morningstar and CNBC.
Review the range and the consensus of analysts’ estimates. (1) Calculate the % difference of
the “high” estimate from the consensus (mean); (2) Calculate the % (negative) difference of
the “low” estimate from the consensus; (3) Are the divergent more notable for the current or
out- quarter, FY1 or FY2, revenue or earnings? (4) Note the number of analysts providing LT
growth rate estimate. It that roughly the same as the number of analysts providing revenue
and earnings estimates?
(1) Sales: Jun-15 26%, Sep-15 31%, Dec-15 19%, Dec-16 14% Earnings: Jun-15 -4300%, Jun-15 235%, Dec-15 217%, Dec-16 86% (2) Sales: Jun-15 38.95%, Sep-15 53.49%, Dec-15 29.16%, Dec-16 16.35% Earnings: Jun-15 -4200%, Sep-15 195.65%, Dec-15 269.23%, Dec-16 60.22% (3) For both revenue and earnings, the divergent are much more significant in the current to more recent quarters. And for the most part FY1 is higher and more notable than FY2. (4) The number of analysts providing long-term growth rates is similar to the earnings estimates, but far less than the number of analysts providing revenue estimates. Overall the content of these tables are consistent with analyst reports and opinions on Morningstar and Yahoo Finance.

11
Review recent trend of analysts’ consensus (mean) estimates on revenue and earnings. (1)
Are the consensus estimates trending up, down, or stay the same? (2) Is the trend more
notable for the near- or out- quarter, FY1 or FY2, revenue or earnings?
(1) Consensus estimates for revenues are trending down, and earnings consensus estimates are trending down. (2) The trend is more notable for FY2 in both earnings and revenue consensus estimates. This table with its trends and predictions goes along with the Morningstar estimates and analyst opinions as well as the opinions we found on CNBC.
12
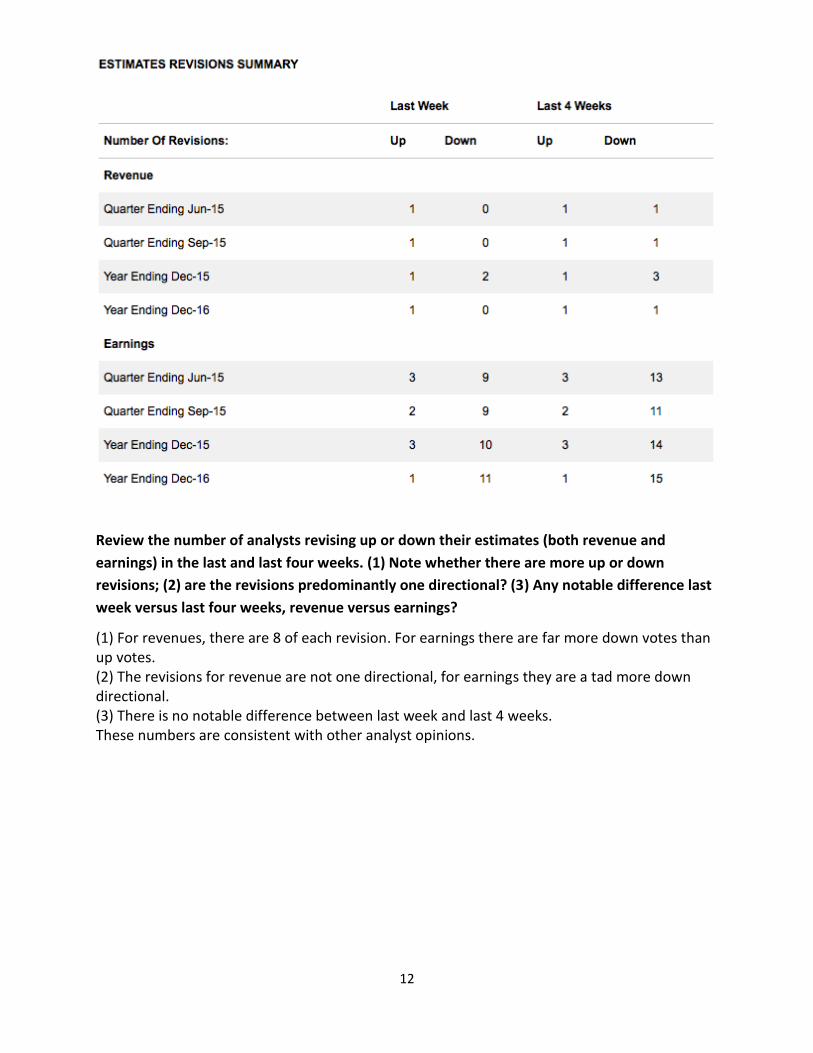
Review the number of analysts revising up or down their estimates (both revenue and
earnings) in the last and last four weeks. (1) Note whether there are more up or down
revisions; (2) are the revisions predominantly one directional? (3) Any notable difference last
week versus last four weeks, revenue versus earnings?
(1) For revenues, there are 8 of each revision. For earnings there are far more down votes than up votes. (2) The revisions for revenue are not one directional, for earnings they are a tad more down directional. (3) There is no notable difference between last week and last 4 weeks. These numbers are consistent with other analyst opinions.

13
(E-5) “Consensus Earnings Revisions” from CNBC
Go to http://www.cnbc.com/, “news”, “earnings”, “calendar”, “consensus revisions”. Look
for whether your stock had consensus earnings revision today. Copy/paste the information, if
any, to the following table. Go back one day, copy/paste the information if there was
consensus earnings revision. Repeat the process back one month. Add rows to the table if
needed.
Revision
Date
Revision
Type
Revision
Up/Down
Current
Previous
% Change
# of Analysts
Reporting
4/9/15 Down 4/12 $0.001 $0.019 -94.74% 22
4/7/15 Up 5/5 $0.019 $0.017 11.76% 22
4/6/15 Down 3/4 $0.017 $0.018 -5.56% 22
4/1/15 Down 4/3 $0.018 $0.021 -12.29% 22
3/31/15 Down 3/2 $0.021 $0.029 -21.59% 22
3/27/15 Up 2/1 $0.029 $0.028 3.57% 22
3/20/15 Down 3/1 $0.039 $0.040 -2.5% 22
3/13/15 Down 4/2 $0.040 $0.044 -9.09% 22
1) Make note of the company’s (1) last earnings reporting date, and (2) next earnings
reporting date. The last earnings report date was January 29, 2015 and the next date is
April 30, 2015.
2) Review revisions day by day, and comment on (1) whether they tend to be clustered, and
(2) if clustered, were they near earnings reporting date? The revision dates are fairly
spread out to every couple of days, but no big clustering.
3) Were there any greater than 10% consensus revisions? What is the maximum %
consensus revision? There are 4 revisions greater than 10%, with the maximum being the
most recent at 94.74%.
4) Observe stock price chart, how did the stock trade around dates of greater than 10%
consensus revisions? The stock generally traded up after dates of greater than 10%
revision, regardless of the direction of the revision
5) Other observations worth noting? I would note that there are a lot more down ward
revisions than up, and the last one is very drastic.

14
Section (F) Analysts’ Recommendations
(F-1) Reuters Most Recent Three Months Analysts Recommendations
1) Review the trend of analyst recommendations over the last three months. Is there a
notable change of analyst opinions, turning more bullish or bearish? There is no real trend
of change in analyst opinion; it sits at just over 2 for all periods.
2) How many different ratings out of the five possible ones did the company receive
currently, one, two, and three months ago? For current, 1 month, and 2 months ago COP
received 4 different ratings. At 3 months ago, COP only received 3 different ratings.
3) Is there a notable trend of opinion convergence or divergence? There aren’t any real
trends of convergence or divergence; the mean remains just over 2 with similar distribution.
4) Cross check (1) Morningstar analyst’s research report; and (2) media or other analysts’
comments from online financial sites. Is what you see here consistent to comments
elsewhere? Morningstar and CNBC analysts are mostly bullish as well, with several hold
ratings.
5) Other observations worth noting? There are quite a few holds and 1 under-perform so the
outlook isn’t overly positive.
15
(F-2) Most Recent One Month Analysts Upgrades/Downgrades from CNBC
Go to http://www.cnbc.com/, “news”, “earnings”, “calendar”, “upgrades” and
“downgrades”. Look for whether your stock was up- or down-graded by one or more analysts
today. Copy/paste the information, if any, to the following table. Go back one day, copy/paste
the information if there was (were) upgrades or downgrades. Repeat the process back one
month. Add rows to the table if needed.
Revision Date
Current Recommendation
Previous Recommendation
Firm Last Revision
n/a n/a n/a n/a n/a
1) Make note of the company’s (1) last earnings reporting date, and (2) next earnings
reporting date. n/a
2) Add up the number of upgrades on weekly basis. Do the same for downgrades. Were
there more up- or down-grades? Were there any consistent trend you observe in the
recent month? Were there any up- or down-grades of more than “one grade”? n/a
3) Were there clustering of up- or down-grades? If so, were they clustered around earnings
report date? n/a
4) Observe stock price chart, how did the stock trade around dates of up- or down-grades?
n/a
5) Other observations worth noting? n/a

16
Section (G) Institutional Ownership (Guidelines Have Been Updated)
Combine information provided in all three sections to discuss:
1) Whether institutions, on net basis, have been increasing or decreasing ownership and
whether the change can be considered as substantial. Institutions have been increasing
their ownership, however it is not a very substantial increase as the net buyers is only 10 in
the last 3 months.
2) Whether the stock has sizable institution interests/support. The stock does in fact have
sizable interests/support from institutions, with roughly 846 million share shares going to
institutions at 70.01% total ownership.

17
3) The extent of the (> 4%) owners by adding up all >4% ownership, and make an effort to
identify those that are mutual funds. There are two >4% owners, and they add up to
10.32% and one of them, Vanguard, offers mutual funds.
4) Other observations worth noting? There has been very low institutional ownership activity
lately.
18
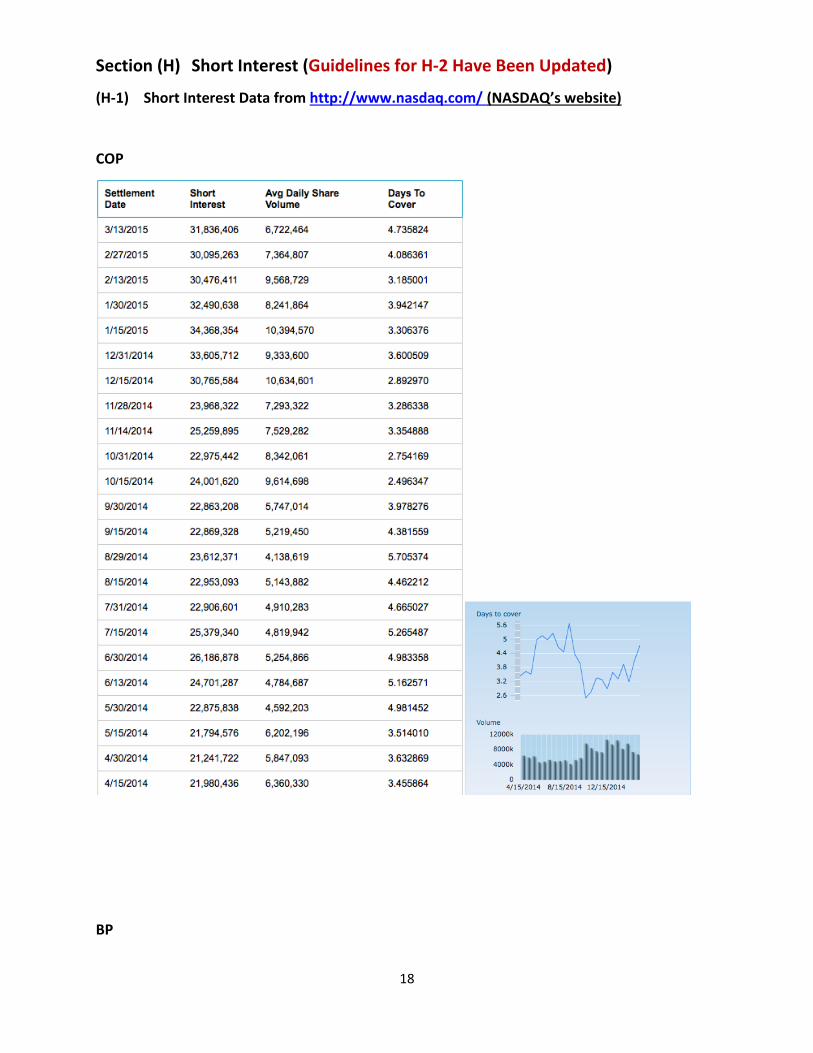
Section (H) Short Interest (Guidelines for H-2 Have Been Updated)
(H-1) Short Interest Data from http://www.nasdaq.com/ (NASDAQ’s website)
COP
BP

19
XOM

20
(H-2) Short Interest Data From http://finance.yahoo.com/
Copy/paste required data from the “share statistics” table to the following table for (1) your
stock, and (2) two competitors (in separate tables).

21
COP
Avg Vol Avg Vol Shares Float (3 month) (10 day) Outstanding
8,015,320
8,251,310
1.23B
1.23B
Shares Short Short Ratio Short % of Float Shares Short
(Include as of date) (Include as of date) (Include as of date) (Prior Month)
31.84M 3/13/15
4.50 3/13/15
2.60% 3/13/15
30.10M
BP
Avg Vol Avg Vol Shares Float (3 month) (10 day) Outstanding
7,389,750
8,280,470
3.03B
2.93B
Shares Short Short Ratio Short % of Float Shares Short
(Include as of date) (Include as of date) (Include as of date) (Prior Month)
11.93M 3/13/15
2.00 3/13/15
n/a 3/13/15
10.87M
XOM
Avg Vol Avg Vol Shares Float (3 month) (10 day) Outstanding
15,085,100
12,978,700
4.19B
4.18B
Shares Short Short Ratio Short % of Float Shares Short
(Include as of date) (Include as of date) (Include as of date) (Prior Month)
44.40M 3/13/15
3.2 3/13/15
1.00% 3/13/15
42.34M
1) Make note of the company’s (1) last earnings reporting date, and (2) next earnings
reporting date. The last earnings report date was January 29, 2015 and the next report date
is April 30, 2015.
2) Discuss market sentiment on the stock based on the short interest statistics, recent trend
reported in in (H-1) and (H-2)? Has the sentiment turned more bullish or bearish over the
last year? How about in more recent month and why? The market sentiment on the stock
is currently bullish, with its short ratio coming in at 4.5 which is under the bull/bear level of
5. Over the last year the market has turned slightly more bearish, with short shares rising
22
from around 22 million to about 32 million over the past year. Even in the last month we
have seen the shares short rise by almost 2 million. A big reason for the shift in sentiment to
the bearish side would be the decline in oil prices.
3) From (H-1), observe “short interest” and “# of days to cover” values for two reporting
dates immediately before and one reporting date immediately after earnings report. (1)
Were there notable increase or decrease in the values, right before or right after earnings
report? (2) Observe stock price chart and comment on how stock traded around those
dates. For the days leading up to the earnings date, there was a notable increase in shares
short and then there was a sharp decrease in short shares immediately following the
earnings beat. The stock traded down leading up to earnings and then gapped up twice
following the earnings date.
4) Other observations worth noting? COP has notably worse short stats than its competitors.
23
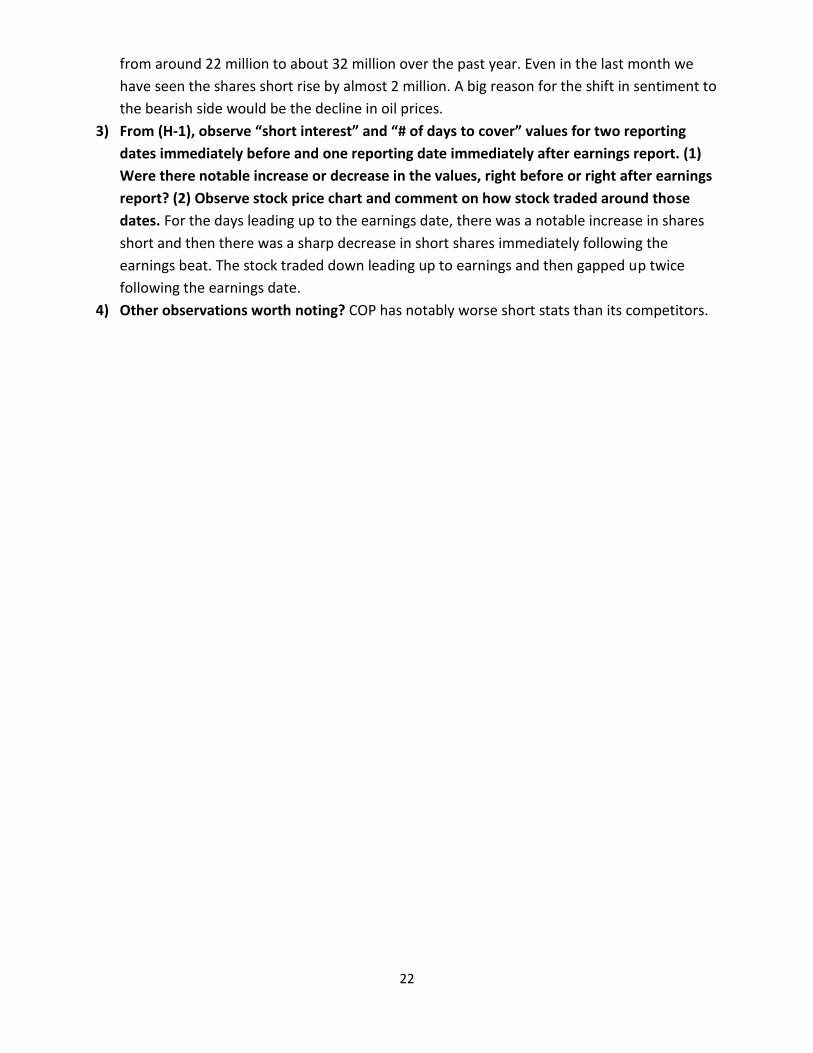
Section (I) Stock Charts (Guidelines for I-4 Have Been Updated)
For (I-1) – (I-3), the stock price charts should include (1) your stock, (2) 1 competitor, (3)
sector ETF, and (4) SP500
(I-1) A three months price chart
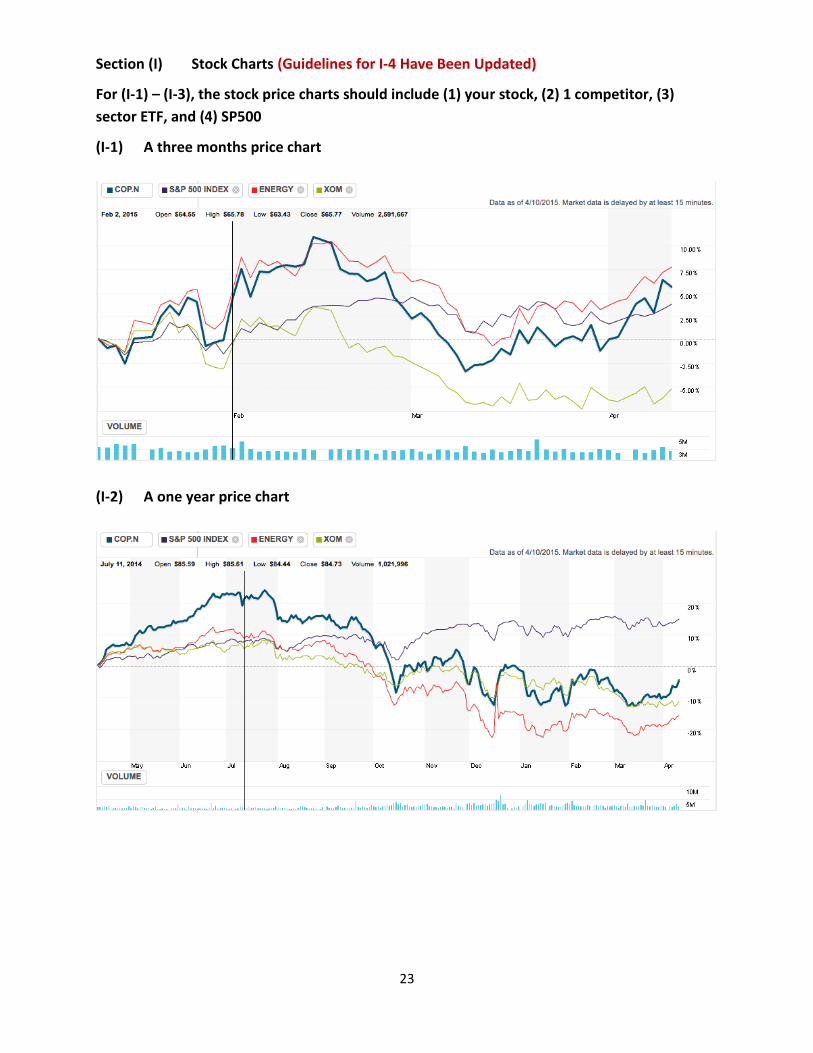
(I-2) A one year price chart

24
(I-3) A five year price chart
1) (I-1) – (I-3) Discuss what you observe from the above stock price charts. This should include comparing your stock to competitors, sector, and SP500 over the three different time horizons. COP has been outperforming its sector etf, but under performing the market over the past five years. However, it has grown about 60% over the last 5 years. But for most of the past year the performance has been poor, with negative price level change for the past year. In the last 3 months it has out performed the market, but underperformed the XLE. Overall performance in price has not been impressive from COP.
(I-4) Technical Indicators (“Moving Average” and “Relative Strength Index” from
https://www.google.com/finance?tab=we
Short-term moving average and relative strength index indicators

25
Long-term moving average and relative strength index indicators
1) Discuss your findings from these sets of technical indicators. Compare your findings here
to findings from fundamental analysis. Are findings from technical analysis supportive of your other findings? From the technical indicators we can see than short term, from the one year chart, that we are currently in a death cross cycle from back in early March. Long term there is a death cross in early 2013 followed by a golden cross not to far along in late 2013, which can be a very positive sign so we might see some long term upwards momentum. This analysis supports our fundamental analysis and other analysis, especially the short interest. We’ve seen a negative shift in market sentiment with the growing number of short shares over the last year, and that corresponds nicely with this death cross signaling some downward momentum.
References
https://www.google.com/finance
https://www.trademonster.com/ACMNGR/launchTradingApp.jsp

26
http://finance.yahoo.com
http://www.reuters.com/finance/stocks
http://www.nasdaq.com/symbol/wmb/short-interest
http://www.msn.com/en-us/money/stockdetails
http://analysisreport.morningstar.com/stock
http://data.cnbc.com/quotes/KMI/tab/5