cimb group holdings berhad full year 2010 ......cimb group holdings berhad full year 2010 results 2...
TRANSCRIPT
Analyst Presentation
25 February 2011
CIMB GROUP HOLDINGS BERHADFULL YEAR 2010 RESULTS
2
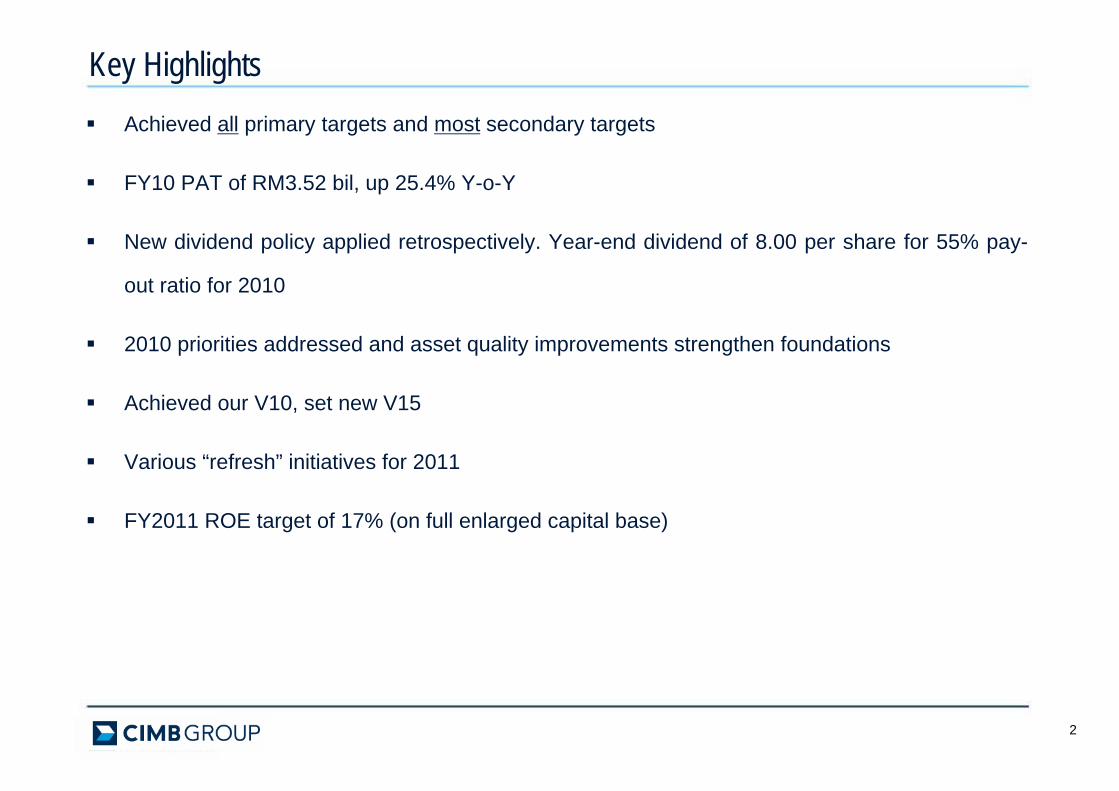
Achieved all primary targets and most secondary targets
FY10 PAT of RM3.52 bil, up 25.4% Y-o-Y
New dividend policy applied retrospectively. Year-end dividend of 8.00 per share for 55% pay-
out ratio for 2010
2010 priorities addressed and asset quality improvements strengthen foundations
Achieved our V10, set new V15
Various “refresh” initiatives for 2011
FY2011 ROE target of 17% (on full enlarged capital base)
Key Highlights

CIMB GROUP CEO’S REVIEWKEY ACHIEVEMENTS
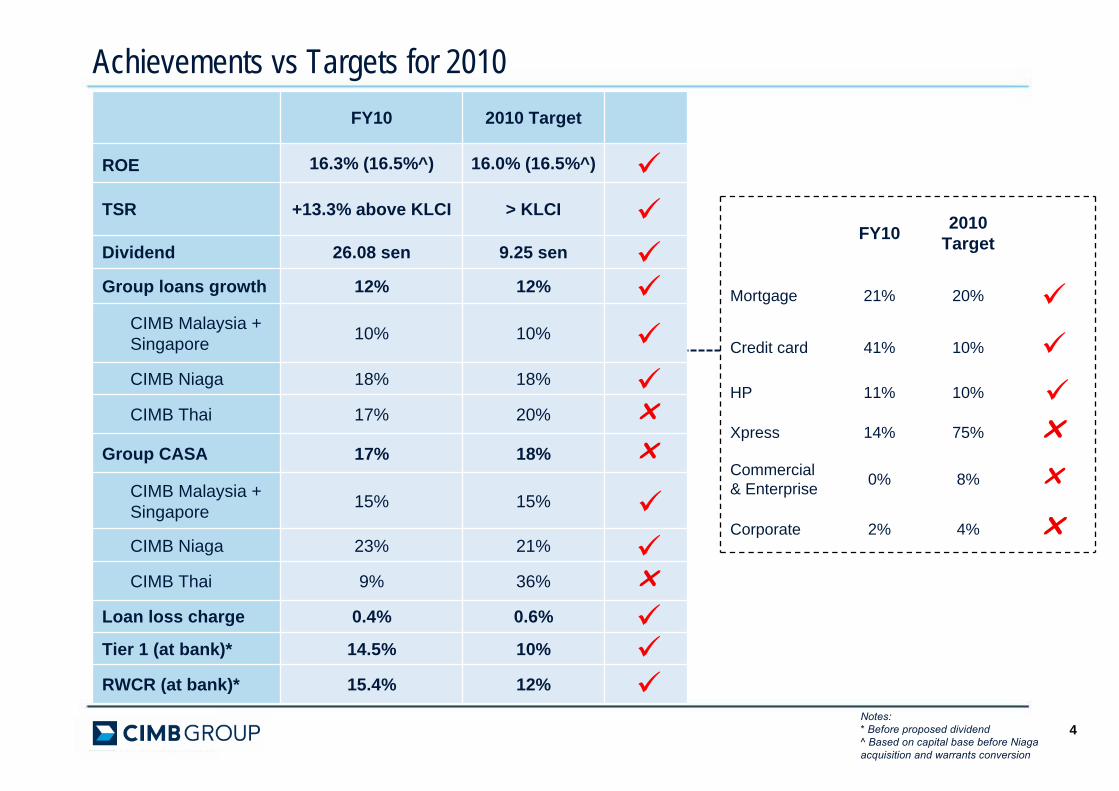
Achievements vs Targets for 2010FY10 2010 Target
ROE 16.3% (16.5%^) 16.0% (16.5%^)
TSR +13.3% above KLCI > KLCI
Dividend 26.08 sen 9.25 sen
Group loans growth 12% 12%
CIMB Malaysia + Singapore 10% 10%
CIMB Niaga 18% 18%
CIMB Thai 17% 20% r
Group CASA 17% 18% r
CIMB Malaysia + Singapore 15% 15%
CIMB Niaga 23% 21%
CIMB Thai 9% 36% r
Loan loss charge 0.4% 0.6%
Tier 1 (at bank)* 14.5% 10%
RWCR (at bank)* 15.4% 12%
FY10 2010 Target
Mortgage 21% 20%
Credit card 41% 10%
HP 11% 10%
Xpress 14% 75% rCommercial& Enterprise 0% 8% r
Corporate 2% 4% r
4Notes: * Before proposed dividend^ Based on capital base before Niagaacquisition and warrants conversion
5
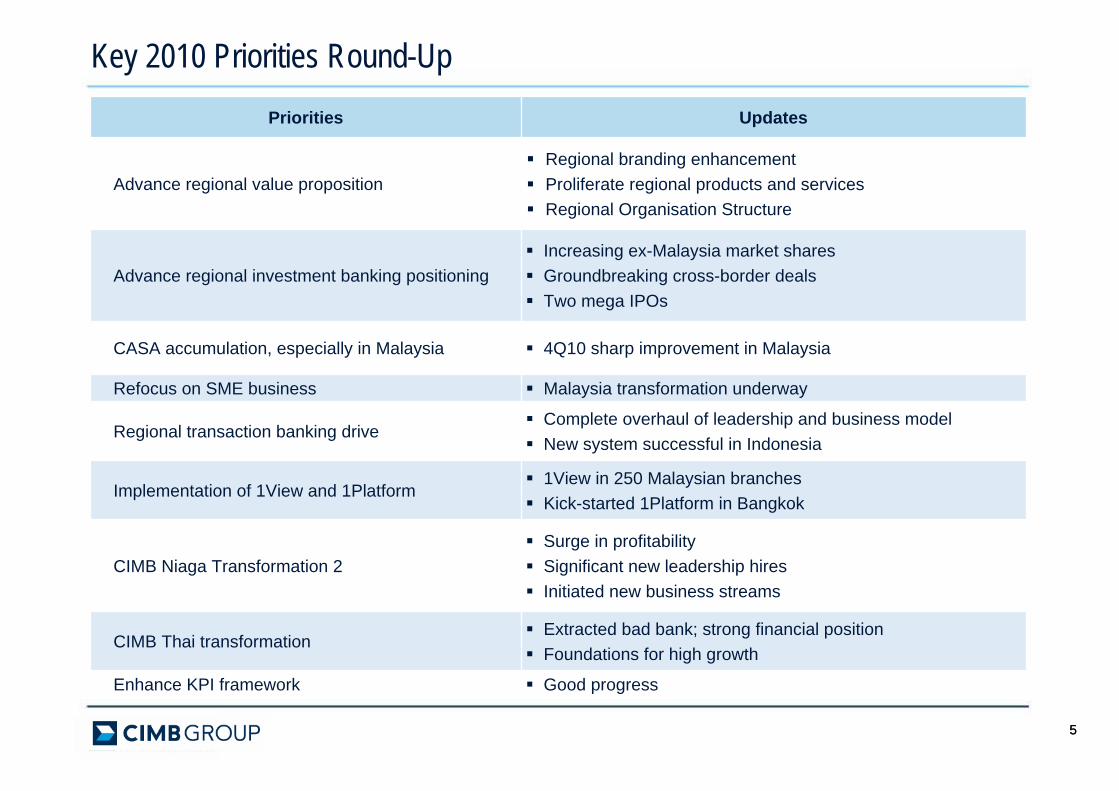
Key 2010 Priorities Round-Up
5
Priorities Updates
Advance regional value propositionRegional branding enhancementProliferate regional products and servicesRegional Organisation Structure
Advance regional investment banking positioningIncreasing ex-Malaysia market sharesGroundbreaking cross-border dealsTwo mega IPOs
CASA accumulation, especially in Malaysia 4Q10 sharp improvement in Malaysia
Refocus on SME business Malaysia transformation underway
Regional transaction banking driveComplete overhaul of leadership and business modelNew system successful in Indonesia
Implementation of 1View and 1Platform1View in 250 Malaysian branchesKick-started 1Platform in Bangkok
CIMB Niaga Transformation 2Surge in profitabilitySignificant new leadership hiresInitiated new business streams
CIMB Thai transformationExtracted bad bank; strong financial positionFoundations for high growth
Enhance KPI framework Good progress
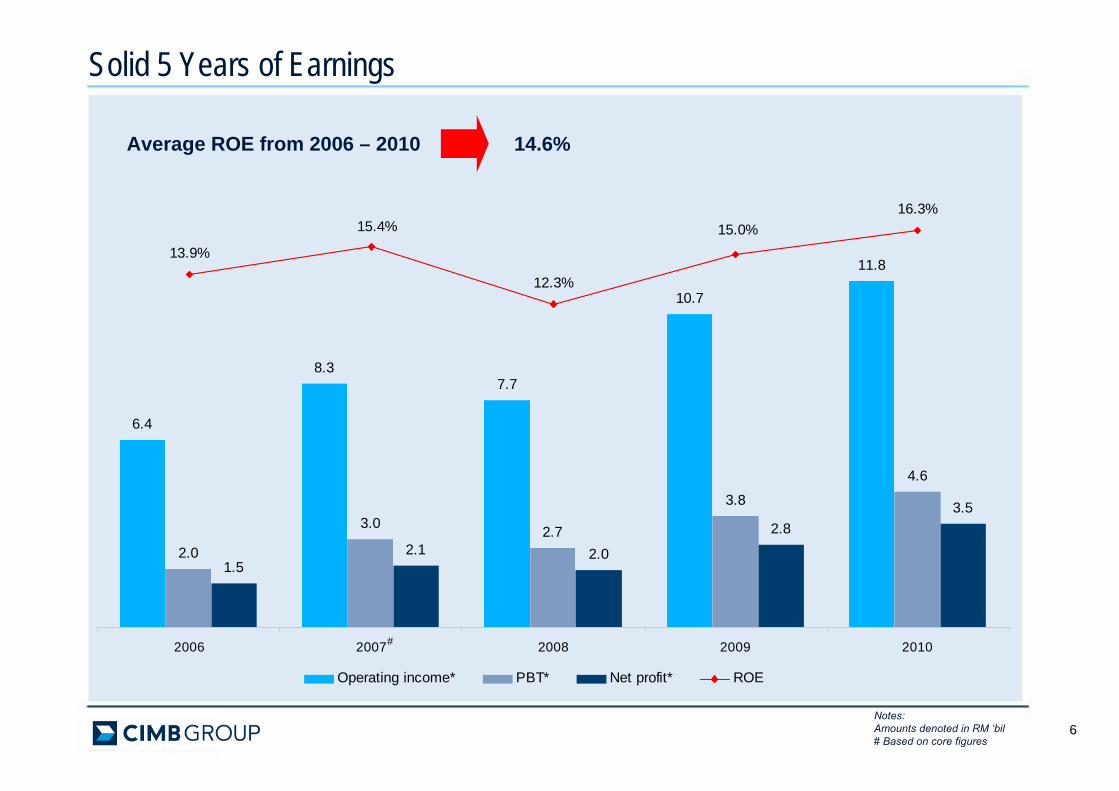
Average ROE from 2006 – 2010 14.6%
6
Solid 5 Years of Earnings
Notes:Amounts denoted in RM ‘bil# Based on core figures
6.4
8.37.7
10.7
11.8
2.0
3.0 2.7
3.8
4.6
1.52.1 2.0
2.83.5
13.9%
12.3%
15.0%16.3%
15.4%
2006 2007 2008 2009 2010
Operating income* PBT* Net profit* ROE
#
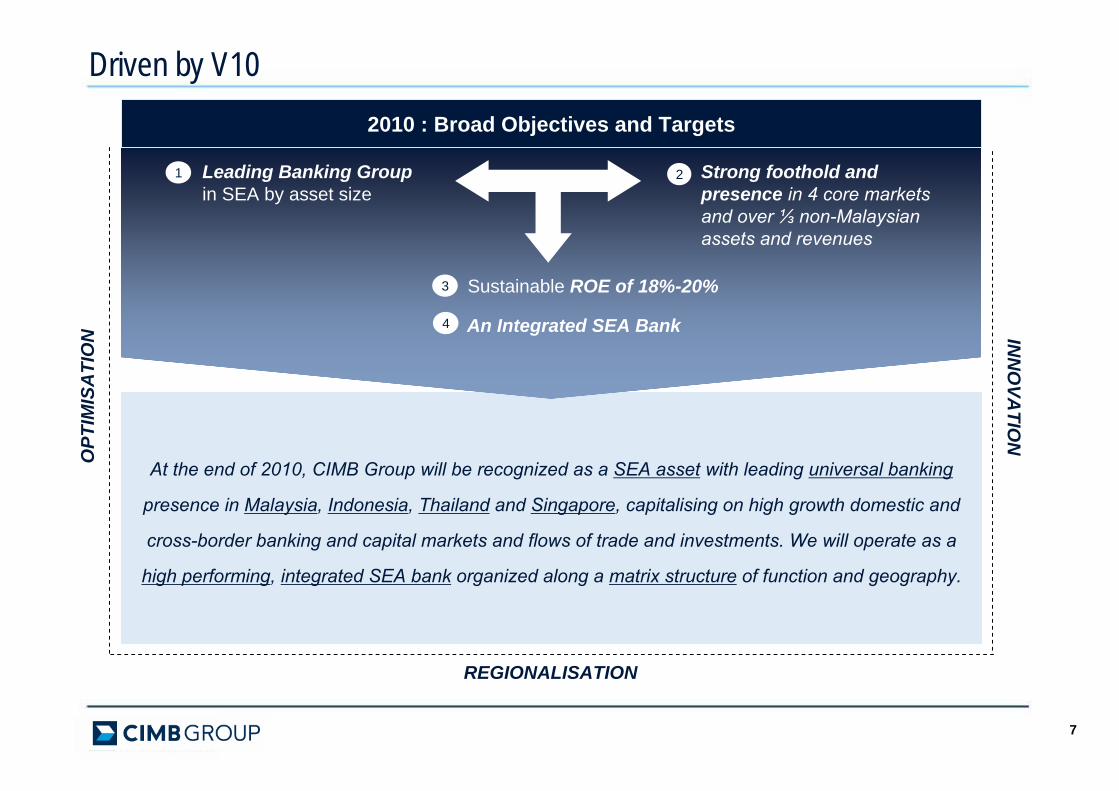
At the end of 2010, CIMB Group will be recognized as a SEA asset with leading universal banking
presence in Malaysia, Indonesia, Thailand and Singapore, capitalising on high growth domestic and
cross-border banking and capital markets and flows of trade and investments. We will operate as a
high performing, integrated SEA bank organized along a matrix structure of function and geography.
Driven by V10
Leading Banking Groupin SEA by asset size
1 Strong foothold and presence in 4 core markets and over ⅓ non-Malaysian assets and revenues
2
3 Sustainable ROE of 18%-20%
An Integrated SEA Bank4
OPT
IMIS
ATI
ON IN
NO
VATIO
N
REGIONALISATION
2010 : Broad Objectives and Targets
7
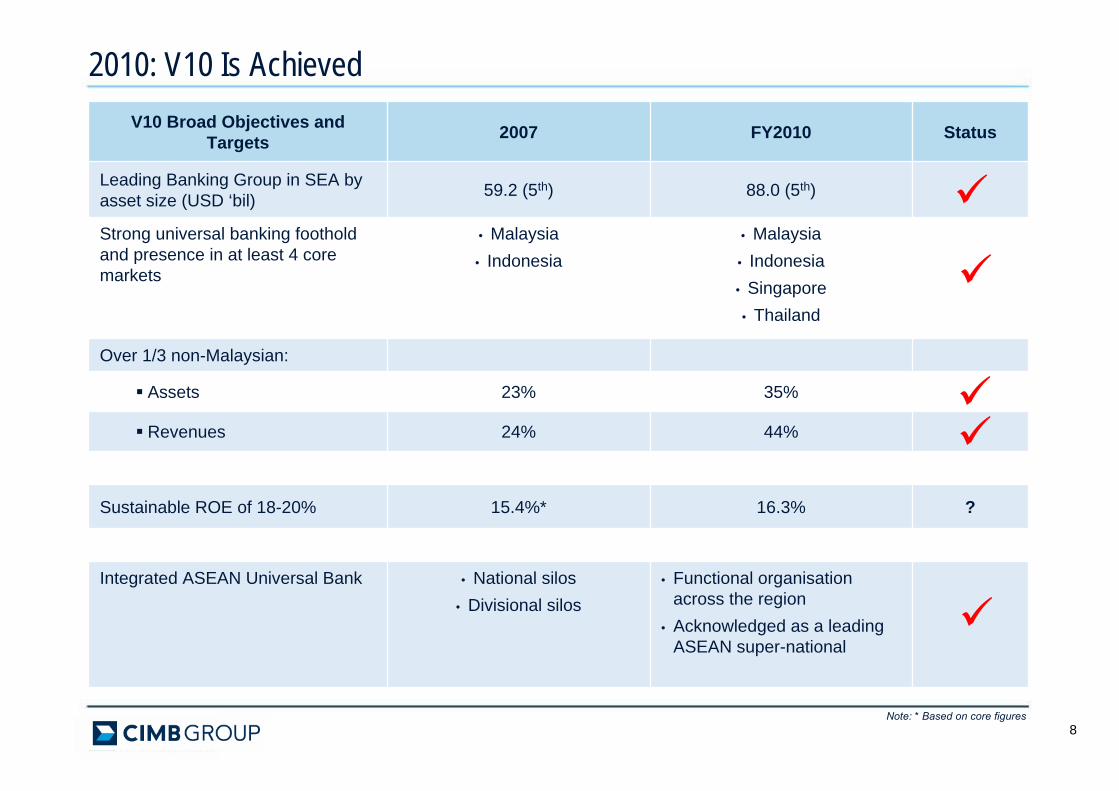
2010: V10 Is Achieved
8Note: * Based on core figures
V10 Broad Objectives and Targets 2007 FY2010 Status
Leading Banking Group in SEA by asset size (USD ‘bil) 59.2 (5th) 88.0 (5th)
Strong universal banking foothold and presence in at least 4 core markets
• Malaysia• Indonesia
• Malaysia• Indonesia• Singapore • Thailand
Over 1/3 non-Malaysian:
Assets 23% 35%
Revenues 24% 44%
Sustainable ROE of 18-20% 15.4%* 16.3% ?
Integrated ASEAN Universal Bank • National silos• Divisional silos
• Functional organisation across the region
• Acknowledged as a leading ASEAN super-national
99
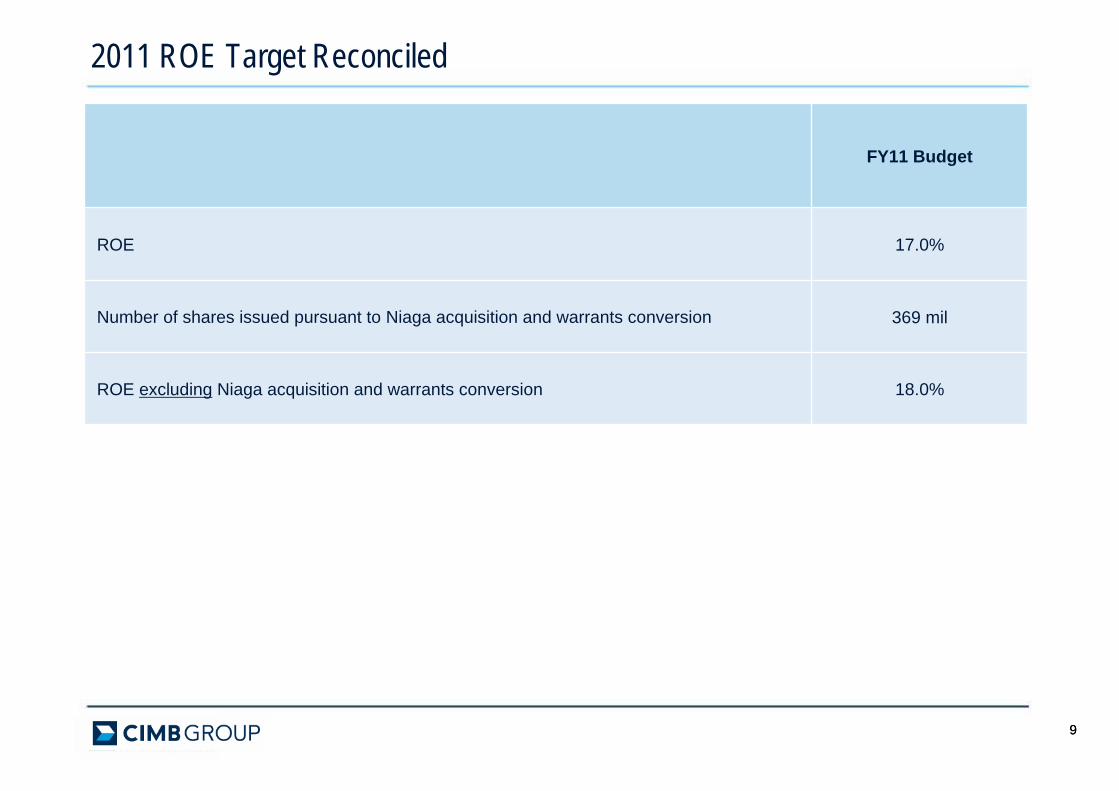
2011 ROE Target Reconciled
17.0%ROE
369 milNumber of shares issued pursuant to Niaga acquisition and warrants conversion
FY11 Budget
ROE excluding Niaga acquisition and warrants conversion 18.0%
CIMB GROUP: FY10 RESULTSCIMB GROUP FY10 FINANCIALS
111111
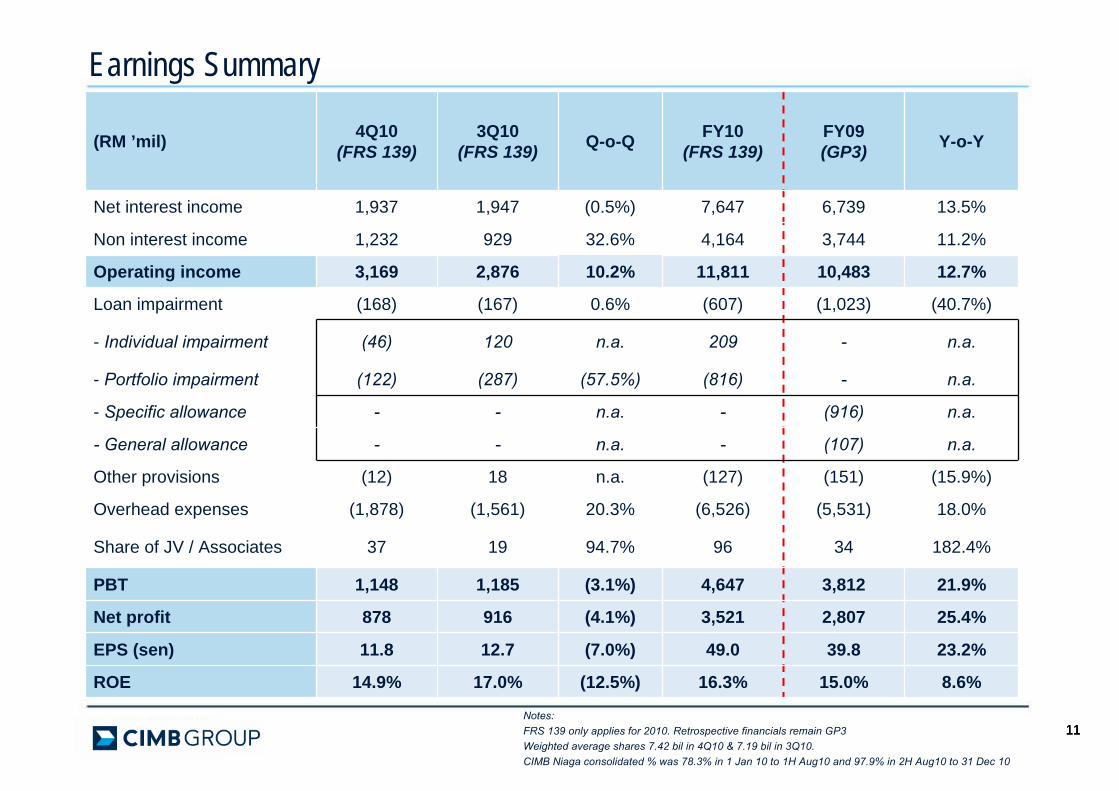
(RM ’mil) 4Q10(FRS 139)
3Q10(FRS 139) Q-o-Q FY10
(FRS 139)FY09(GP3) Y-o-Y
Net interest income 1,937 1,947 (0.5%) 7,647 6,739 13.5%
Non interest income 1,232 929 32.6% 4,164 3,744 11.2%
Operating income 3,169 2,876 10.2% 11,811 10,483 12.7%
Loan impairment (168) (167) 0.6% (607) (1,023) (40.7%)
- Individual impairment (46) 120 n.a. 209 - n.a.
- Portfolio impairment (122) (287) (57.5%) (816) - n.a.
- Specific allowance - - n.a. - (916) n.a.
- General allowance - - n.a. - (107) n.a.
Other provisions (12) 18 n.a. (127) (151) (15.9%)
Overhead expenses (1,878) (1,561) 20.3% (6,526) (5,531) 18.0%
Share of JV / Associates 37 19 94.7% 96 34 182.4%
PBT 1,148 1,185 (3.1%) 4,647 3,812 21.9%
Net profit 878 916 (4.1%) 3,521 2,807 25.4%
EPS (sen) 11.8 12.7 (7.0%) 49.0 39.8 23.2%
ROE 14.9% 17.0% (12.5%) 16.3% 15.0% 8.6%
Earnings Summary
Notes: FRS 139 only applies for 2010. Retrospective financials remain GP3 Weighted average shares 7.42 bil in 4Q10 & 7.19 bil in 3Q10.CIMB Niaga consolidated % was 78.3% in 1 Jan 10 to 1H Aug10 and 97.9% in 2H Aug10 to 31 Dec 10
1212
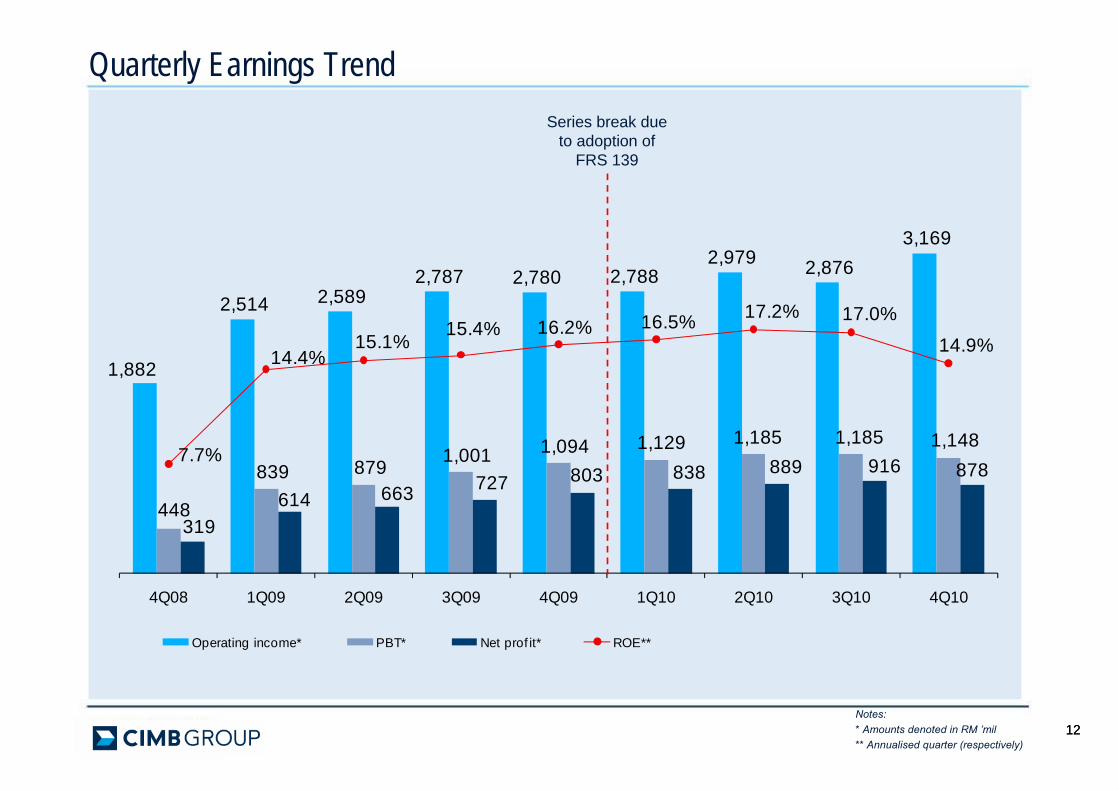
Quarterly Earnings Trend
Notes:* Amounts denoted in RM ’mil** Annualised quarter (respectively)
1,882
2,514 2,589 2,787 2,780 2,788
2,979 2,876 3,169
448
839 879 1,001 1,094 1,129 1,185 1,185 1,148
319 614 663 727 803 838 889 916 878
7.7%
14.4%15.1%
15.4% 16.2% 16.5% 17.2% 17.0%14.9%
4Q08 1Q09 2Q09 3Q09 4Q09 1Q10 2Q10 3Q10 4Q10
Operating income* PBT* Net prof it* ROE**
Series break due to adoption of
FRS 139
1313
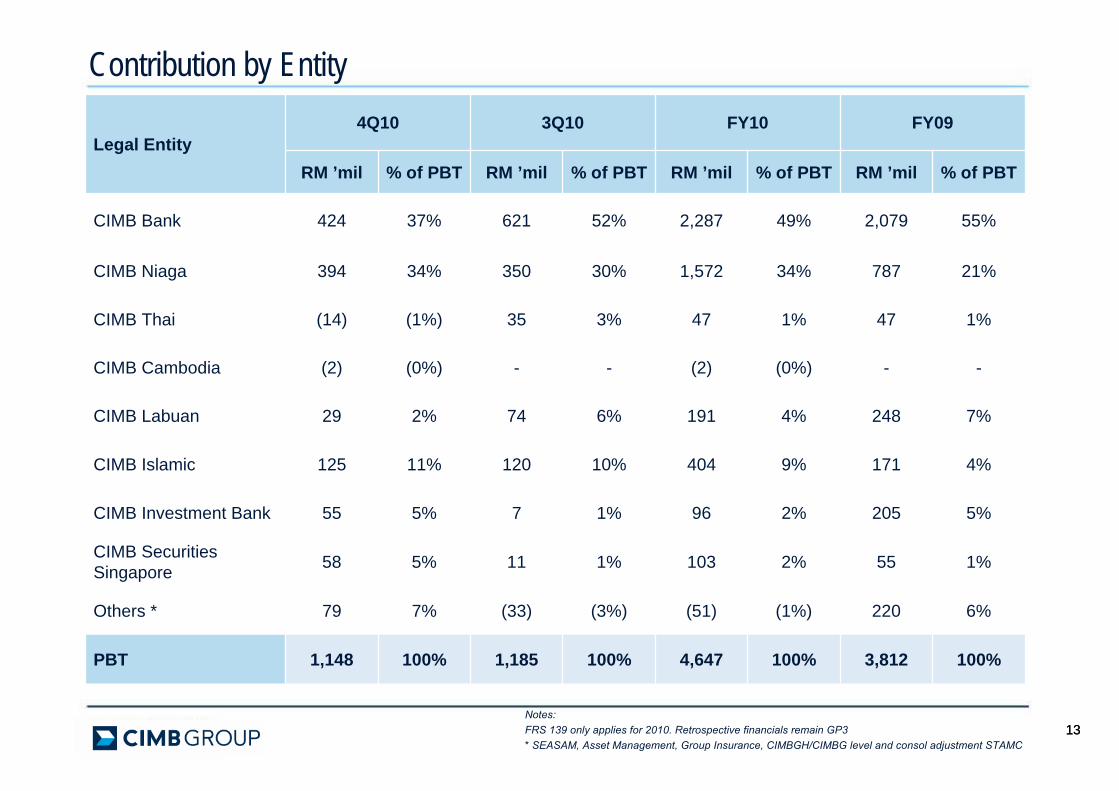
Legal Entity4Q10 3Q10 FY10 FY09
RM ’mil % of PBT RM ’mil % of PBT RM ’mil % of PBT RM ’mil % of PBT
CIMB Bank 424 37% 621 52% 2,287 49% 2,079 55%
CIMB Niaga 394 34% 350 30% 1,572 34% 787 21%
CIMB Thai (14) (1%) 35 3% 47 1% 47 1%
CIMB Cambodia (2) (0%) - - (2) (0%) - -
CIMB Labuan 29 2% 74 6% 191 4% 248 7%
CIMB Islamic 125 11% 120 10% 404 9% 171 4%
CIMB Investment Bank 55 5% 7 1% 96 2% 205 5%
CIMB Securities Singapore 58 5% 11 1% 103 2% 55 1%
Others * 79 7% (33) (3%) (51) (1%) 220 6%
PBT 1,148 100% 1,185 100% 4,647 100% 3,812 100%
Contribution by Entity
Notes:FRS 139 only applies for 2010. Retrospective financials remain GP3* SEASAM, Asset Management, Group Insurance, CIMBGH/CIMBG level and consol adjustment STAMC
141414
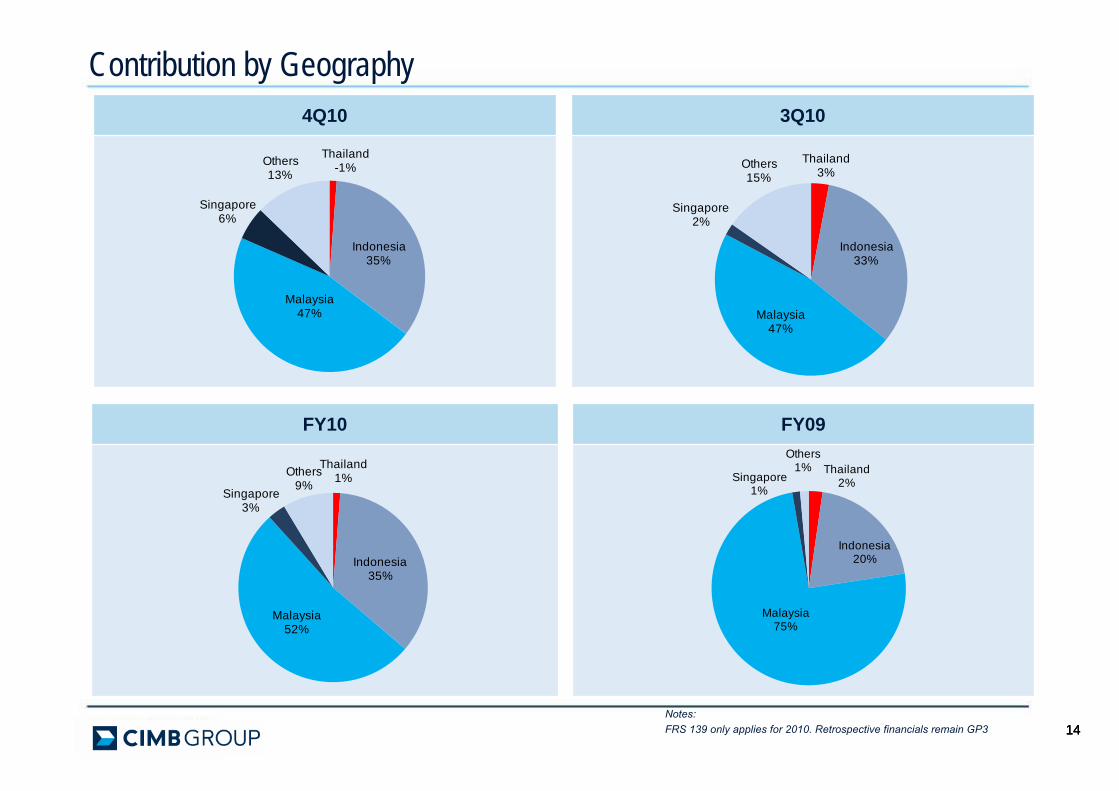
3Q10
Contribution by Geography
FY10 FY09
Notes: FRS 139 only applies for 2010. Retrospective financials remain GP3
4Q10
Thailand3%
Indonesia33%
Malaysia47%
Singapore2%
Others15%
Thailand2%
Indonesia20%
Malaysia75%
Singapore1%
Others1%
Thailand-1%
Indonesia35%
Cambodia0%
Malaysia 47%
Singapore6%
Others13%
Thailand1%
Indonesia35%
Cambodia0%
Malaysia52%
Singapore3%
Others9%
151515
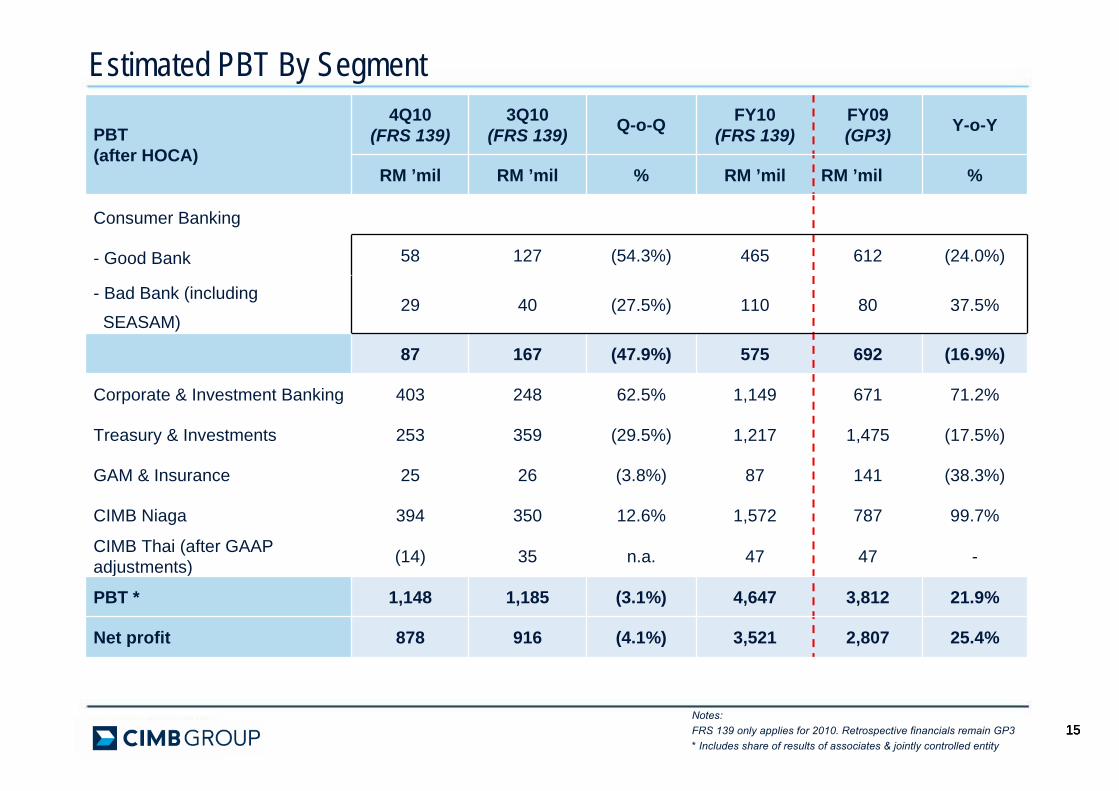
Estimated PBT By Segment
Notes:FRS 139 only applies for 2010. Retrospective financials remain GP3* Includes share of results of associates & jointly controlled entity
PBT (after HOCA)
4Q10(FRS 139)
3Q10(FRS 139) Q-o-Q FY10
(FRS 139)FY09(GP3) Y-o-Y
RM ’mil RM ’mil % RM ’mil RM ’mil %
Consumer Banking
- Good Bank 58 127 (54.3%) 465 612 (24.0%)
- Bad Bank (including
SEASAM)29 40 (27.5%) 110 80 37.5%
87 167 (47.9%) 575 692 (16.9%)
Corporate & Investment Banking 403 248 62.5% 1,149 671 71.2%
Treasury & Investments 253 359 (29.5%) 1,217 1,475 (17.5%)
GAM & Insurance 25 26 (3.8%) 87 141 (38.3%)
CIMB Niaga 394 350 12.6% 1,572 787 99.7%
CIMB Thai (after GAAP adjustments) (14) 35 n.a. 47 47 -
PBT * 1,148 1,185 (3.1%) 4,647 3,812 21.9%
Net profit 878 916 (4.1%) 3,521 2,807 25.4%
161616
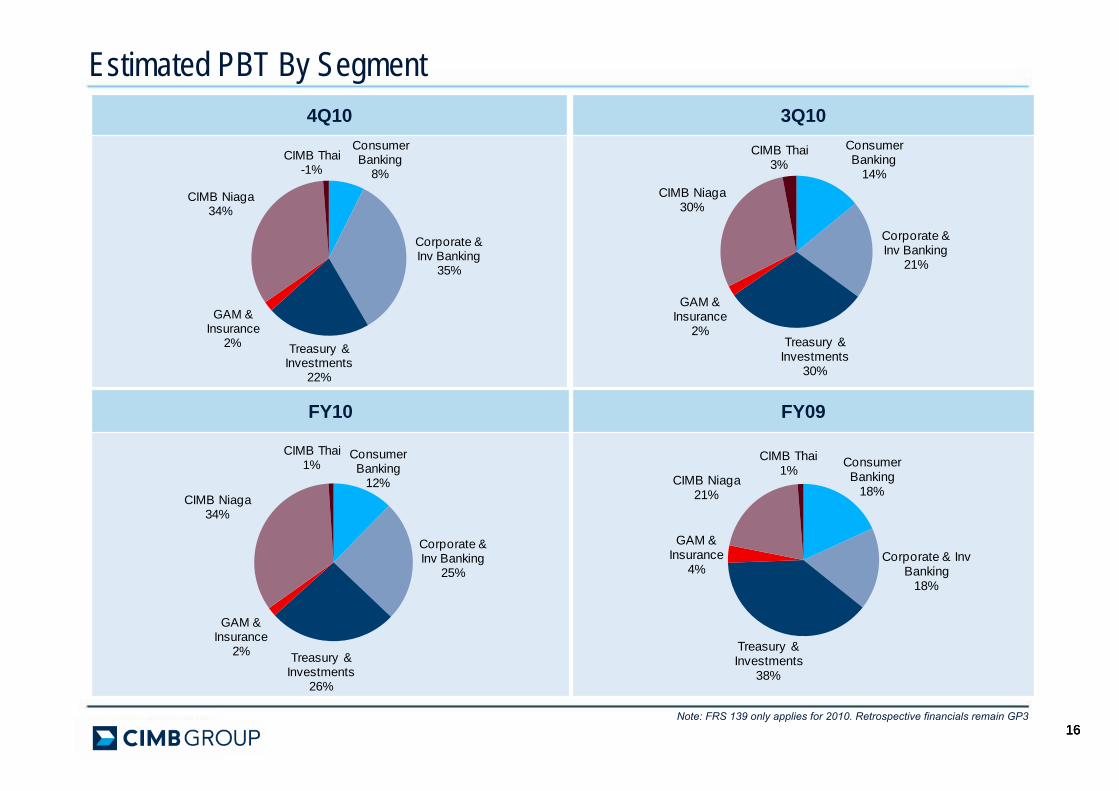
Estimated PBT By Segment3Q10
FY10 FY09
Note: FRS 139 only applies for 2010. Retrospective financials remain GP3
4Q10Consumer Banking
8%
Corporate & Inv Banking
35%
Treasury & Investments
22%
GAM & Insurance
2%
CIMB Niaga34%
CIMB Thai-1%
Consumer Banking
14%
Corporate & Inv Banking
21%
Treasury & Investments
30%
GAM & Insurance
2%
CIMB Niaga30%
CIMB Thai3%
Consumer Banking
12%
Corporate & Inv Banking
25%
Treasury & Investments
26%
GAM & Insurance
2%
CIMB Niaga34%
CIMB Thai1% Consumer
Banking 18%
Corporate & Inv Banking
18%
Treasury & Investments
38%
GAM & Insurance
4%
CIMB Niaga21%
CIMB Thai1%
171717
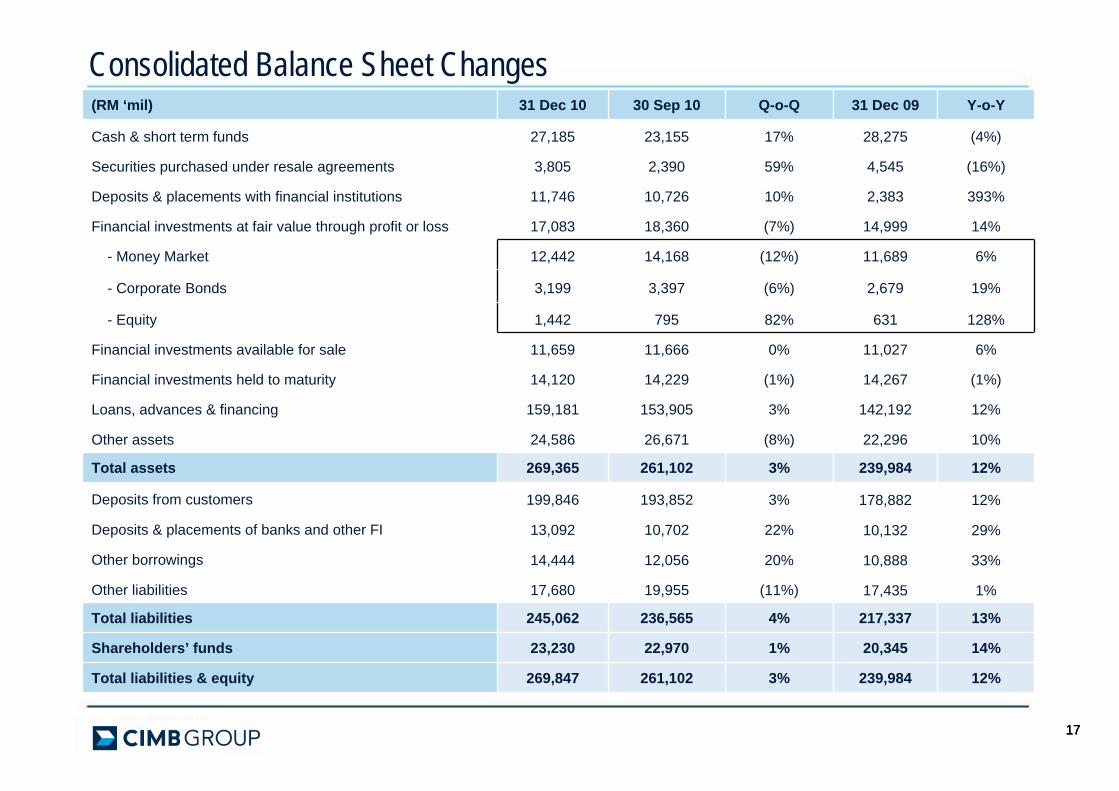
Consolidated Balance Sheet Changes(RM ‘mil) 31 Dec 10 30 Sep 10 Q-o-Q 31 Dec 09 Y-o-Y
Cash & short term funds 27,185 23,155 17% 28,275 (4%)
Securities purchased under resale agreements 3,805 2,390 59% 4,545 (16%)
Deposits & placements with financial institutions 11,746 10,726 10% 2,383 393%
Financial investments at fair value through profit or loss 17,083 18,360 (7%) 14,999 14%
- Money Market 12,442 14,168 (12%) 11,689 6%
- Corporate Bonds 3,199 3,397 (6%) 2,679 19%
- Equity 1,442 795 82% 631 128%
Financial investments available for sale 11,659 11,666 0% 11,027 6%
Financial investments held to maturity 14,120 14,229 (1%) 14,267 (1%)
Loans, advances & financing 159,181 153,905 3% 142,192 12%
Other assets 24,586 26,671 (8%) 22,296 10%
Total assets 269,365 261,102 3% 239,984 12%
Deposits from customers 199,846 193,852 3% 178,882 12%
Deposits & placements of banks and other FI 13,092 10,702 22% 10,132 29%
Other borrowings 14,444 12,056 20% 10,888 33%
Other liabilities 17,680 19,955 (11%) 17,435 1%
Total liabilities 245,062 236,565 4% 217,337 13%
Shareholders’ funds 23,230 22,970 1% 20,345 14%
Total liabilities & equity 269,847 261,102 3% 239,984 12%
18181818
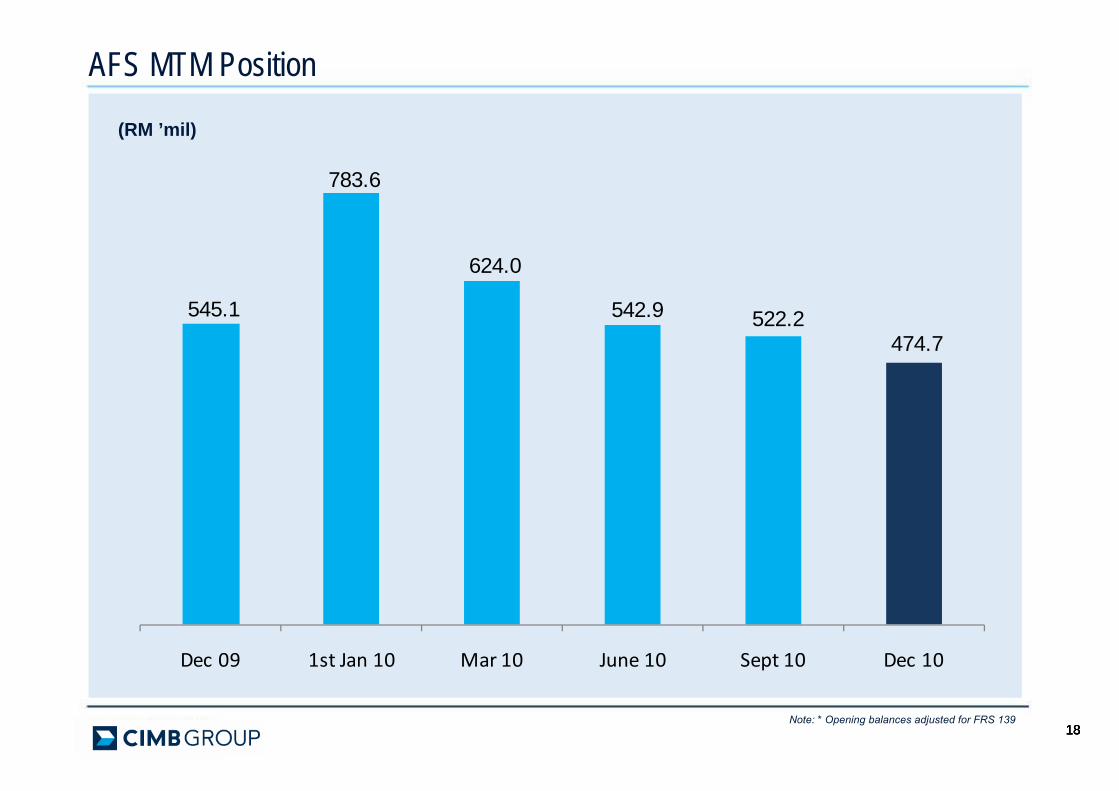
AFS MTM Position
(RM ’mil)
Note: * Opening balances adjusted for FRS 139
545.1
783.6
624.0
542.9 522.2 474.7
Dec 09 1st Jan 10 Mar 10 June 10 Sept 10 Dec 10
191919
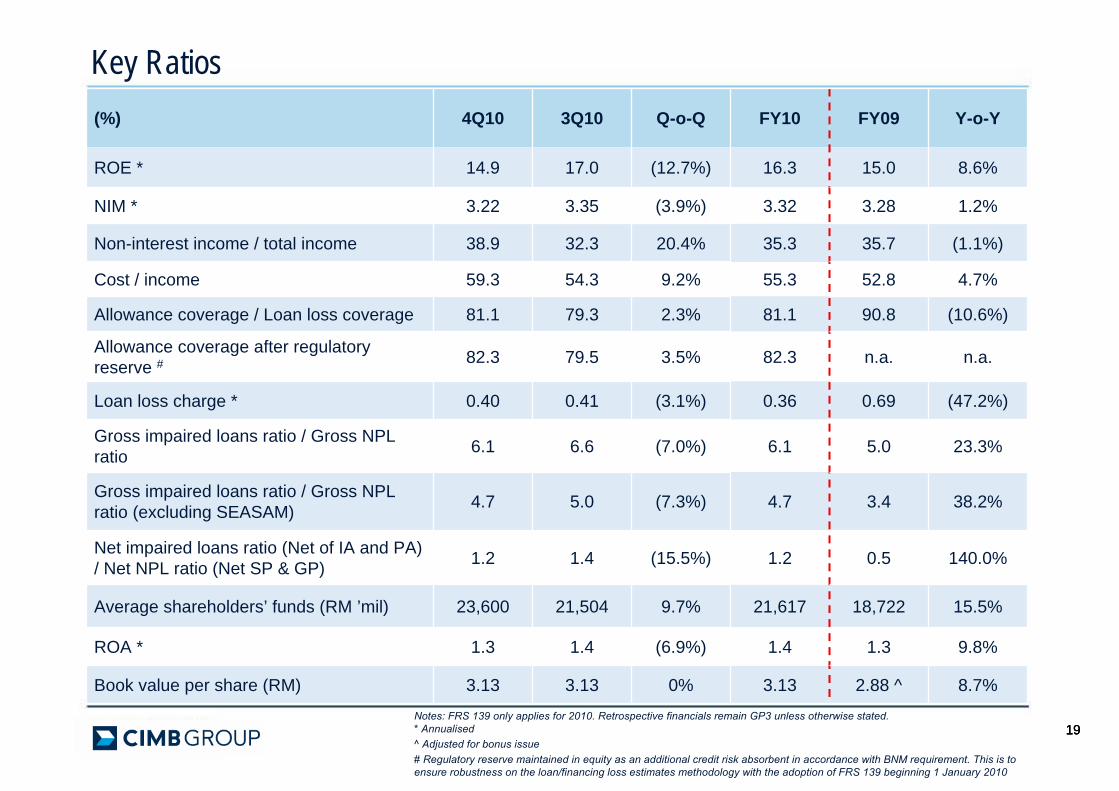
Key Ratios(%) 4Q10 3Q10 Q-o-Q FY10 FY09 Y-o-Y
ROE * 14.9 17.0 (12.7%) 16.3 15.0 8.6%
NIM * 3.22 3.35 (3.9%) 3.32 3.28 1.2%
Non-interest income / total income 38.9 32.3 20.4% 35.3 35.7 (1.1%)
Cost / income 59.3 54.3 9.2% 55.3 52.8 4.7%
Allowance coverage / Loan loss coverage 81.1 79.3 2.3% 81.1 90.8 (10.6%)
Allowance coverage after regulatory reserve # 82.3 79.5 3.5% 82.3 n.a. n.a.
Loan loss charge * 0.40 0.41 (3.1%) 0.36 0.69 (47.2%)
Gross impaired loans ratio / Gross NPL ratio 6.1 6.6 (7.0%) 6.1 5.0 23.3%
Gross impaired loans ratio / Gross NPL ratio (excluding SEASAM) 4.7 5.0 (7.3%) 4.7 3.4 38.2%
Net impaired loans ratio (Net of IA and PA) / Net NPL ratio (Net SP & GP) 1.2 1.4 (15.5%) 1.2 0.5 140.0%
Average shareholders’ funds (RM ’mil) 23,600 21,504 9.7% 21,617 18,722 15.5%
ROA * 1.3 1.4 (6.9%) 1.4 1.3 9.8%
Book value per share (RM) 3.13 3.13 0% 3.13 2.88 ^ 8.7%Notes: FRS 139 only applies for 2010. Retrospective financials remain GP3 unless otherwise stated.* Annualised^ Adjusted for bonus issue# Regulatory reserve maintained in equity as an additional credit risk absorbent in accordance with BNM requirement. This is to ensure robustness on the loan/financing loss estimates methodology with the adoption of FRS 139 beginning 1 January 2010
202020
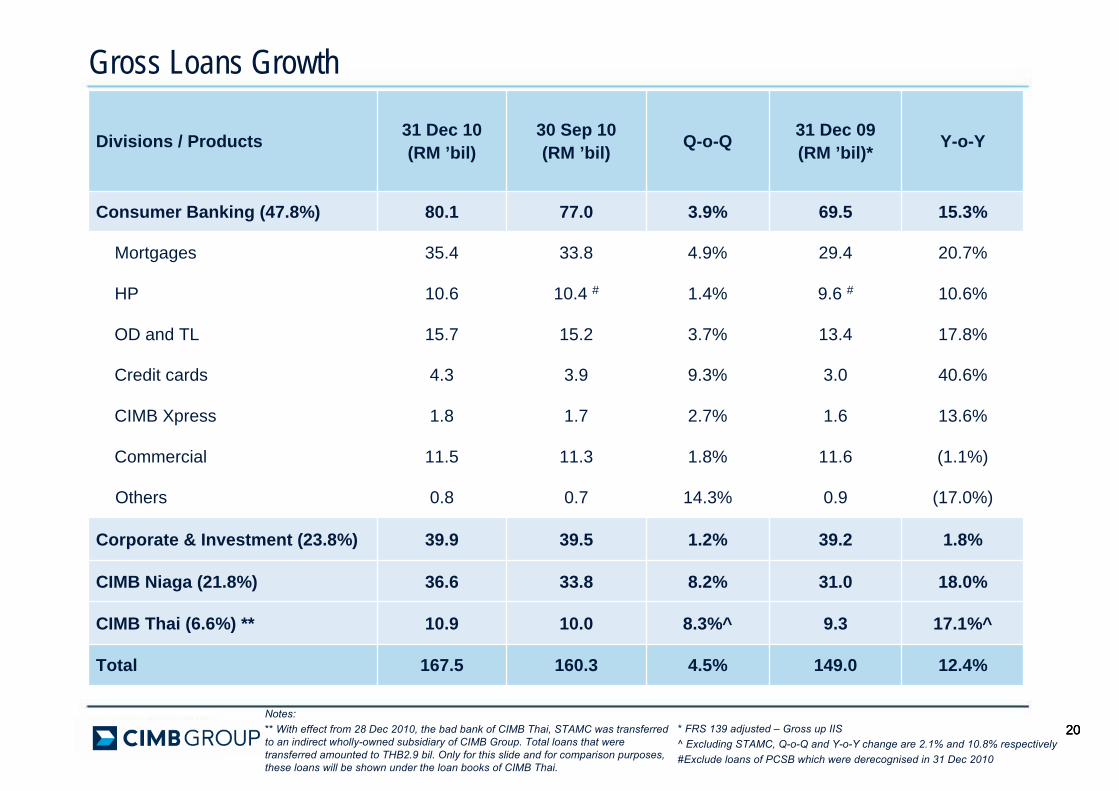
Divisions / Products 31 Dec 10(RM ’bil)
30 Sep 10(RM ’bil) Q-o-Q 31 Dec 09
(RM ’bil)* Y-o-Y
Consumer Banking (47.8%) 80.1 77.0 3.9% 69.5 15.3%
Mortgages 35.4 33.8 4.9% 29.4 20.7%
HP 10.6 10.4 # 1.4% 9.6 # 10.6%
OD and TL 15.7 15.2 3.7% 13.4 17.8%
Credit cards 4.3 3.9 9.3% 3.0 40.6%
CIMB Xpress 1.8 1.7 2.7% 1.6 13.6%
Commercial 11.5 11.3 1.8% 11.6 (1.1%)
Others 0.8 0.7 14.3% 0.9 (17.0%)
Corporate & Investment (23.8%) 39.9 39.5 1.2% 39.2 1.8%
CIMB Niaga (21.8%) 36.6 33.8 8.2% 31.0 18.0%
CIMB Thai (6.6%) ** 10.9 10.0 8.3%^ 9.3 17.1%^
Total 167.5 160.3 4.5% 149.0 12.4%
Gross Loans Growth
* FRS 139 adjusted – Gross up IIS^ Excluding STAMC, Q-o-Q and Y-o-Y change are 2.1% and 10.8% respectively#Exclude loans of PCSB which were derecognised in 31 Dec 2010
Notes: ** With effect from 28 Dec 2010, the bad bank of CIMB Thai, STAMC was transferred to an indirect wholly-owned subsidiary of CIMB Group. Total loans that were transferred amounted to THB2.9 bil. Only for this slide and for comparison purposes, these loans will be shown under the loan books of CIMB Thai.
2121
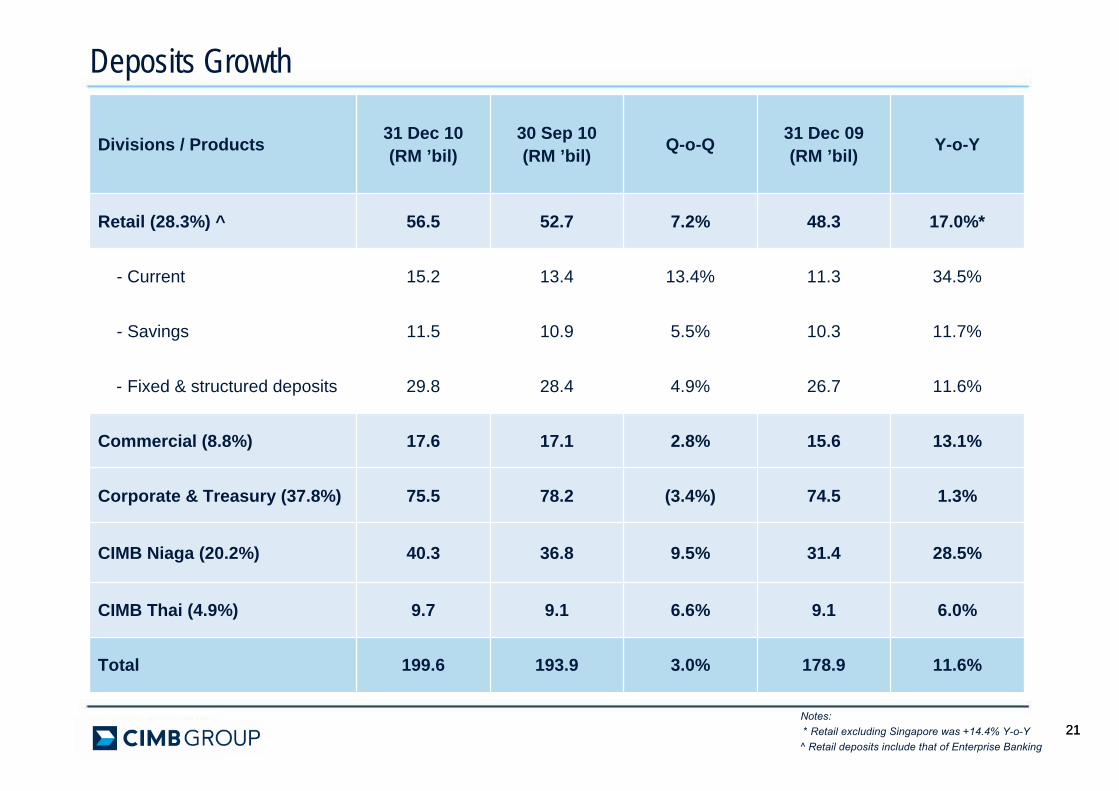
Deposits Growth
Divisions / Products 31 Dec 10(RM ’bil)
30 Sep 10(RM ’bil) Q-o-Q 31 Dec 09
(RM ’bil) Y-o-Y
Retail (28.3%) ^ 56.5 52.7 7.2% 48.3 17.0%*
- Current 15.2 13.4 13.4% 11.3 34.5%
- Savings 11.5 10.9 5.5% 10.3 11.7%
- Fixed & structured deposits 29.8 28.4 4.9% 26.7 11.6%
Commercial (8.8%) 17.6 17.1 2.8% 15.6 13.1%
Corporate & Treasury (37.8%) 75.5 78.2 (3.4%) 74.5 1.3%
CIMB Niaga (20.2%) 40.3 36.8 9.5% 31.4 28.5%
CIMB Thai (4.9%) 9.7 9.1 6.6% 9.1 6.0%
Total 199.6 193.9 3.0% 178.9 11.6%
Notes:* Retail excluding Singapore was +14.4% Y-o-Y
^ Retail deposits include that of Enterprise Banking
222222
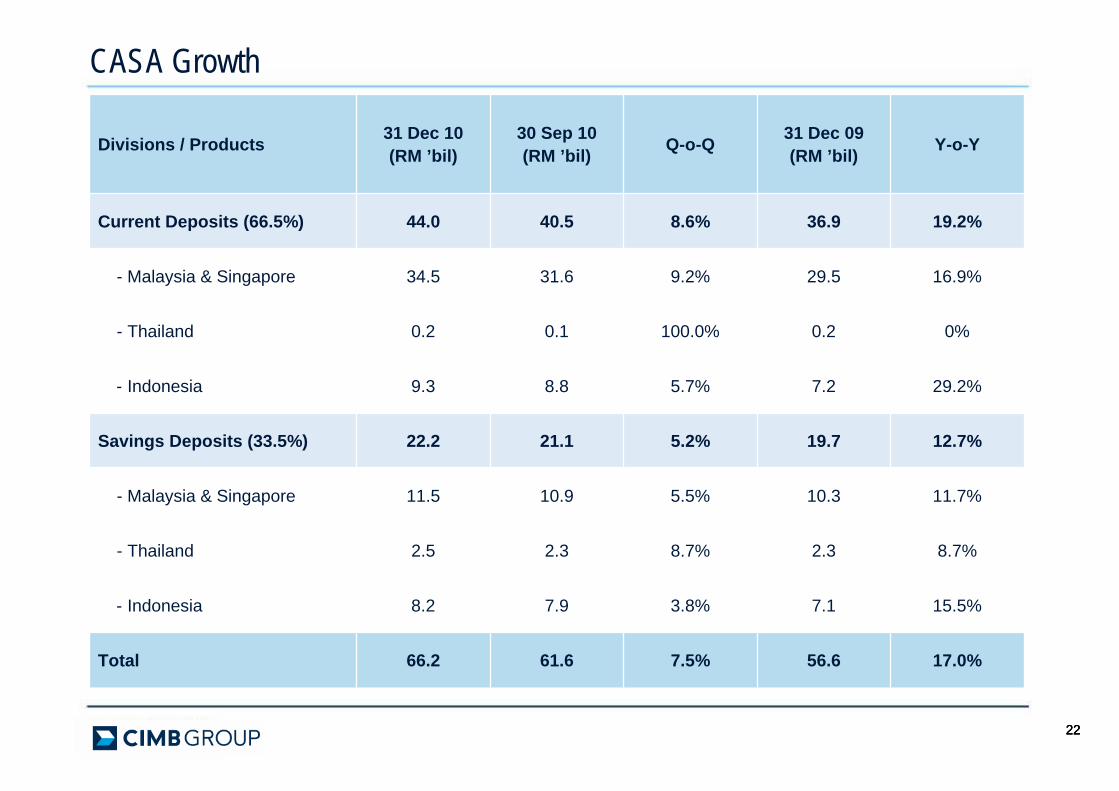
CASA Growth
Divisions / Products 31 Dec 10(RM ’bil)
30 Sep 10(RM ’bil) Q-o-Q 31 Dec 09
(RM ’bil) Y-o-Y
Current Deposits (66.5%) 44.0 40.5 8.6% 36.9 19.2%
- Malaysia & Singapore 34.5 31.6 9.2% 29.5 16.9%
- Thailand 0.2 0.1 100.0% 0.2 0%
- Indonesia 9.3 8.8 5.7% 7.2 29.2%
Savings Deposits (33.5%) 22.2 21.1 5.2% 19.7 12.7%
- Malaysia & Singapore 11.5 10.9 5.5% 10.3 11.7%
- Thailand 2.5 2.3 8.7% 2.3 8.7%
- Indonesia 8.2 7.9 3.8% 7.1 15.5%
Total 66.2 61.6 7.5% 56.6 17.0%
2323
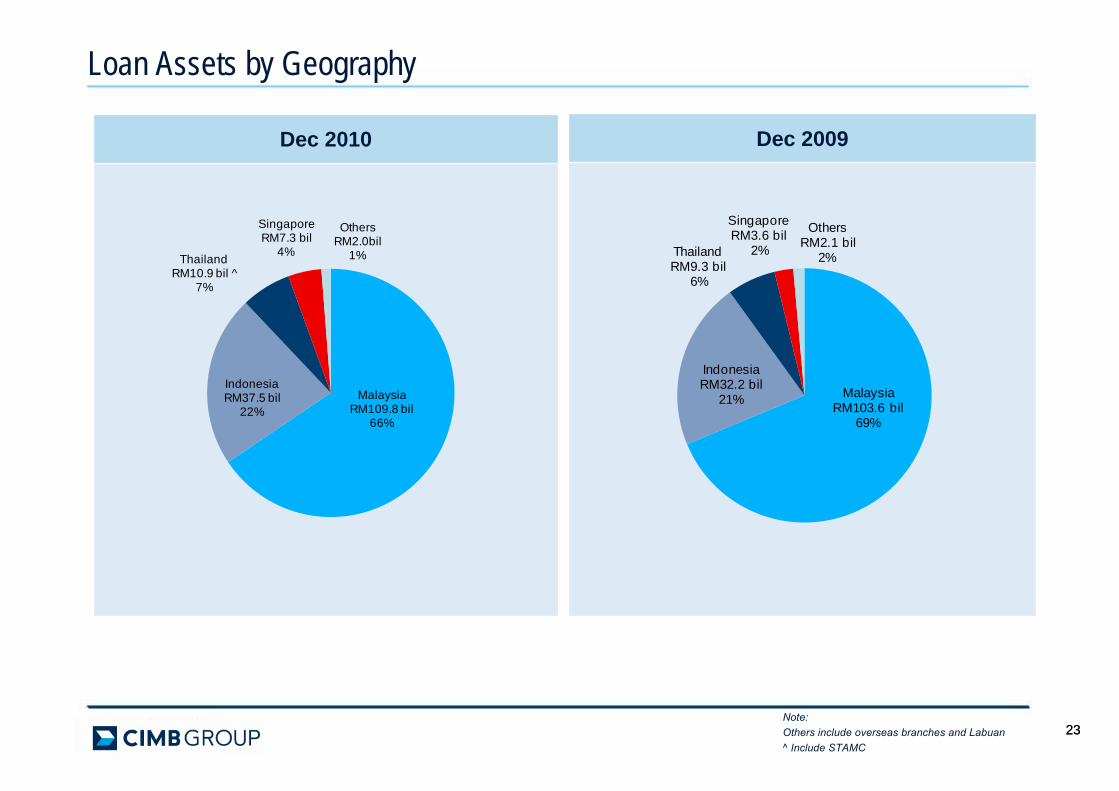
Loan Assets by Geography
Note: Others include overseas branches and Labuan^ Include STAMC
Dec 2009Dec 2010
Malaysia RM109.8 bil
66%
IndonesiaRM37.5 bil
22%
ThailandRM10.9 bil ^
7%
Singapore RM7.3 bil
4%
Others RM2.0bil
1%
Malaysia RM103.6 bil
69%
IndonesiaRM32.2 bil
21%
ThailandRM9.3 bil
6%
Singapore RM3.6 bil
2%
OthersRM2.1 bil
2%
24242424
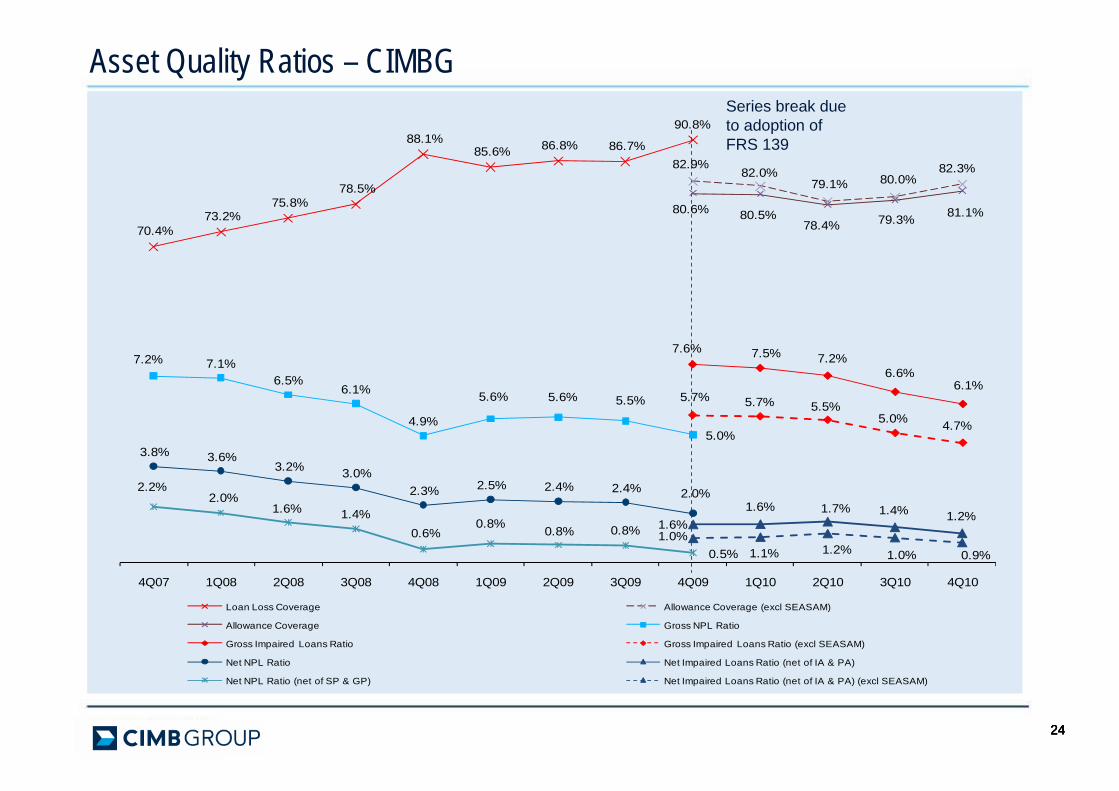
Asset Quality Ratios – CIMBGSeries break due to adoption of FRS 139
70.4%73.2%
75.8%78.5%
88.1%85.6% 86.8% 86.7%
90.8%
82.9%82.0%
79.1% 80.0%82.3%
80.6% 80.5%78.4% 79.3% 81.1%
7.2% 7.1%6.5%
6.1%
4.9%
5.6% 5.6% 5.5%
5.0%
7.6% 7.5% 7.2%6.6%
6.1%5.7% 5.7% 5.5%
5.0% 4.7%
3.8% 3.6%3.2% 3.0%
2.3% 2.5% 2.4% 2.4% 2.0%
1.6%1.6% 1.7% 1.4% 1.2%
2.2%2.0%
1.6% 1.4%0.6%
0.8% 0.8% 0.8%
0.5%1.0%
1.1% 1.2% 1.0% 0.9%
4Q07 1Q08 2Q08 3Q08 4Q08 1Q09 2Q09 3Q09 4Q09 1Q10 2Q10 3Q10 4Q10
Loan Loss Coverage Allowance Coverage (excl SEASAM)
Allowance Coverage Gross NPL Ratio
Gross Impaired Loans Ratio Gross Impaired Loans Ratio (excl SEASAM)
Net NPL Ratio Net Impaired Loans Ratio (net of IA & PA)
Net NPL Ratio (net of SP & GP) Net Impaired Loans Ratio (net of IA & PA) (excl SEASAM)
25252525
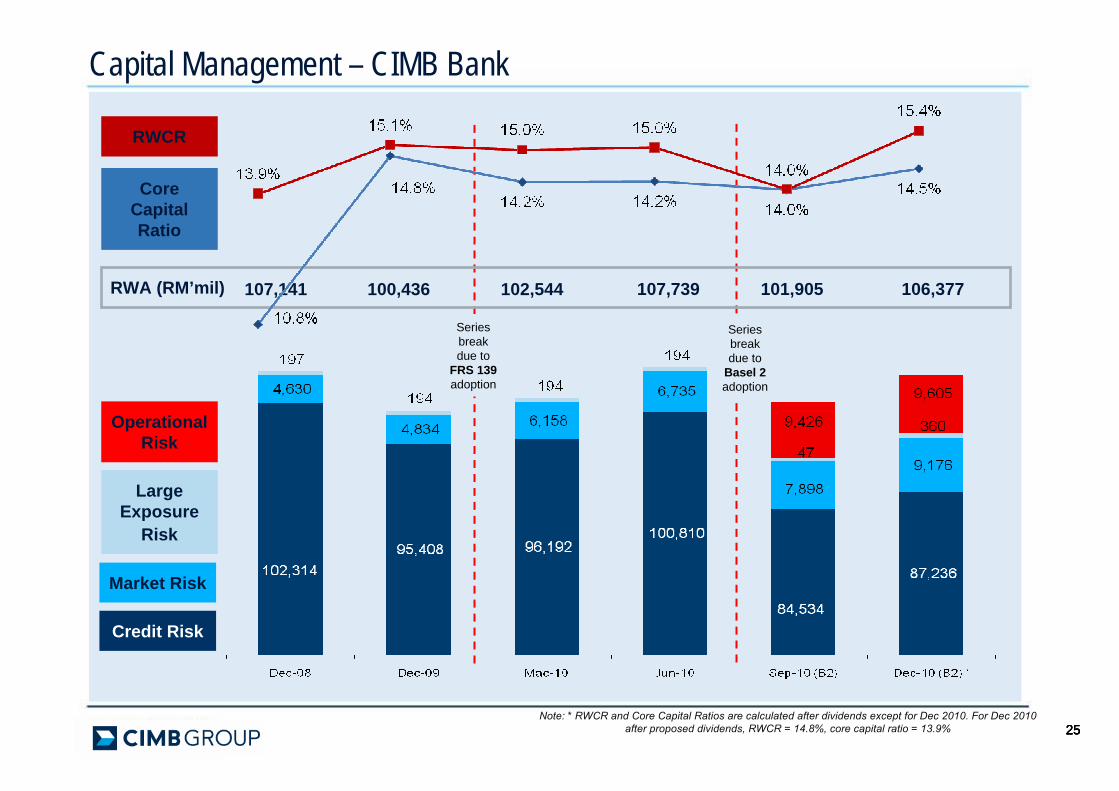
Capital Management – CIMB Bank
Note: * RWCR and Core Capital Ratios are calculated after dividends except for Dec 2010. For Dec 2010 after proposed dividends, RWCR = 14.8%, core capital ratio = 13.9%
Credit Risk
Market Risk
Large Exposure
Risk
Operational Risk
RWCR
Core Capital Ratio
Series break due to
FRS 139 adoption
Series break due to
Basel 2 adoption
RWA (RM’mil) 106,377101,905107,739102,544100,436107,141
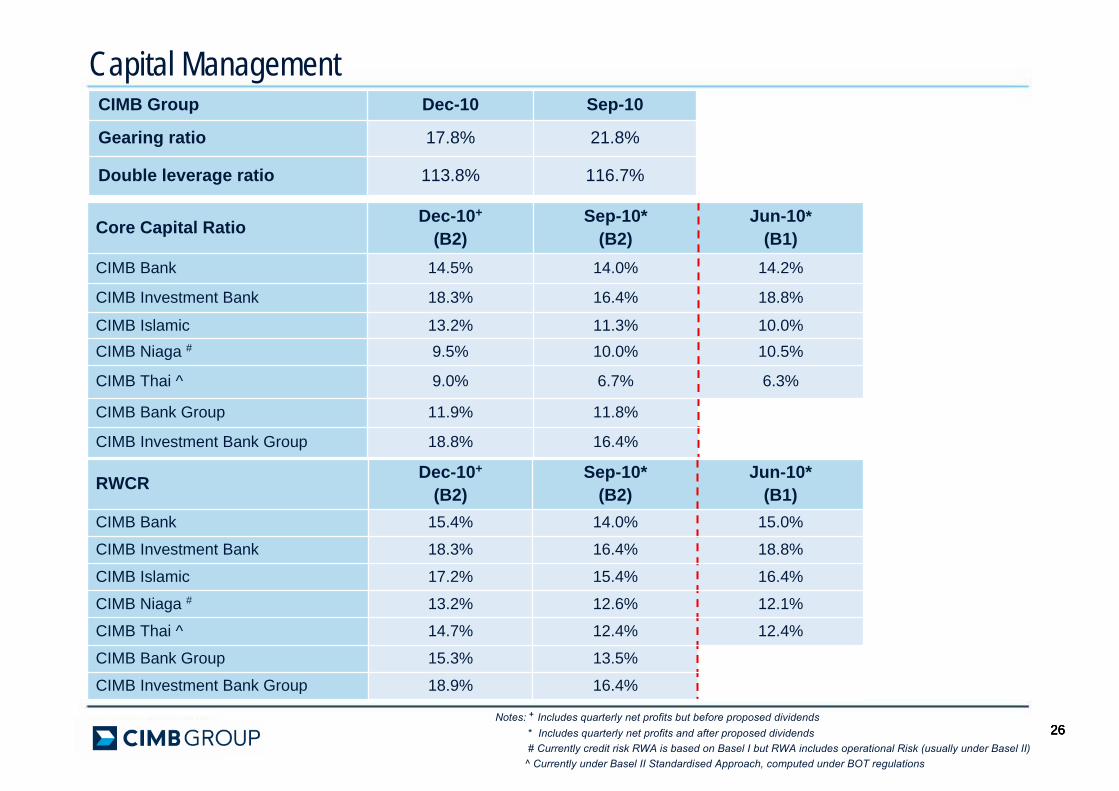
26262626
Capital Management CIMB Group Dec-10 Sep-10
Gearing ratio 17.8% 21.8%
Double leverage ratio 113.8% 116.7%
RWCR Dec-10+
(B2)Sep-10*
(B2)Jun-10*
(B1)CIMB Bank 15.4% 14.0% 15.0%
CIMB Investment Bank 18.3% 16.4% 18.8%
CIMB Islamic 17.2% 15.4% 16.4%
CIMB Niaga # 13.2% 12.6% 12.1%
CIMB Thai ^ 14.7% 12.4% 12.4%
CIMB Bank Group 15.3% 13.5%
CIMB Investment Bank Group 18.9% 16.4%
Core Capital Ratio Dec-10+
(B2)Sep-10*
(B2)Jun-10*
(B1)CIMB Bank 14.5% 14.0% 14.2%
CIMB Investment Bank 18.3% 16.4% 18.8%
CIMB Islamic 13.2% 11.3% 10.0%CIMB Niaga # 9.5% 10.0% 10.5%
CIMB Thai ^ 9.0% 6.7% 6.3%
CIMB Bank Group 11.9% 11.8%
CIMB Investment Bank Group 18.8% 16.4%
Notes: + Includes quarterly net profits but before proposed dividends* Includes quarterly net profits and after proposed dividends# Currently credit risk RWA is based on Basel I but RWA includes operational Risk (usually under Basel II)
^ Currently under Basel II Standardised Approach, computed under BOT regulations
272727
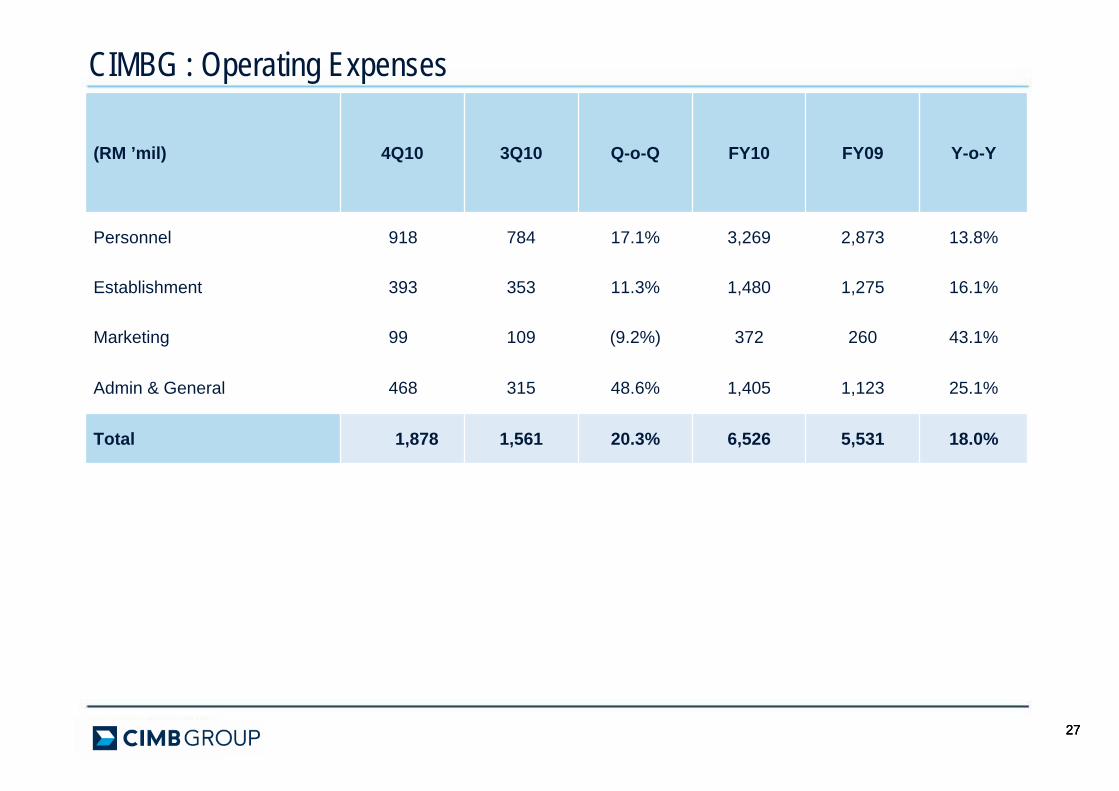
CIMBG : Operating Expenses
(RM ’mil) 4Q10 3Q10 Q-o-Q FY10 FY09 Y-o-Y
Personnel 918 784 17.1% 3,269 2,873 13.8%
Establishment 393 353 11.3% 1,480 1,275 16.1%
Marketing 99 109 (9.2%) 372 260 43.1%
Admin & General 468 315 48.6% 1,405 1,123 25.1%
Total 1,878 1,561 20.3% 6,526 5,531 18.0%

CIMB GROUP: FY10 RESULTSCONSUMER BANK
292929
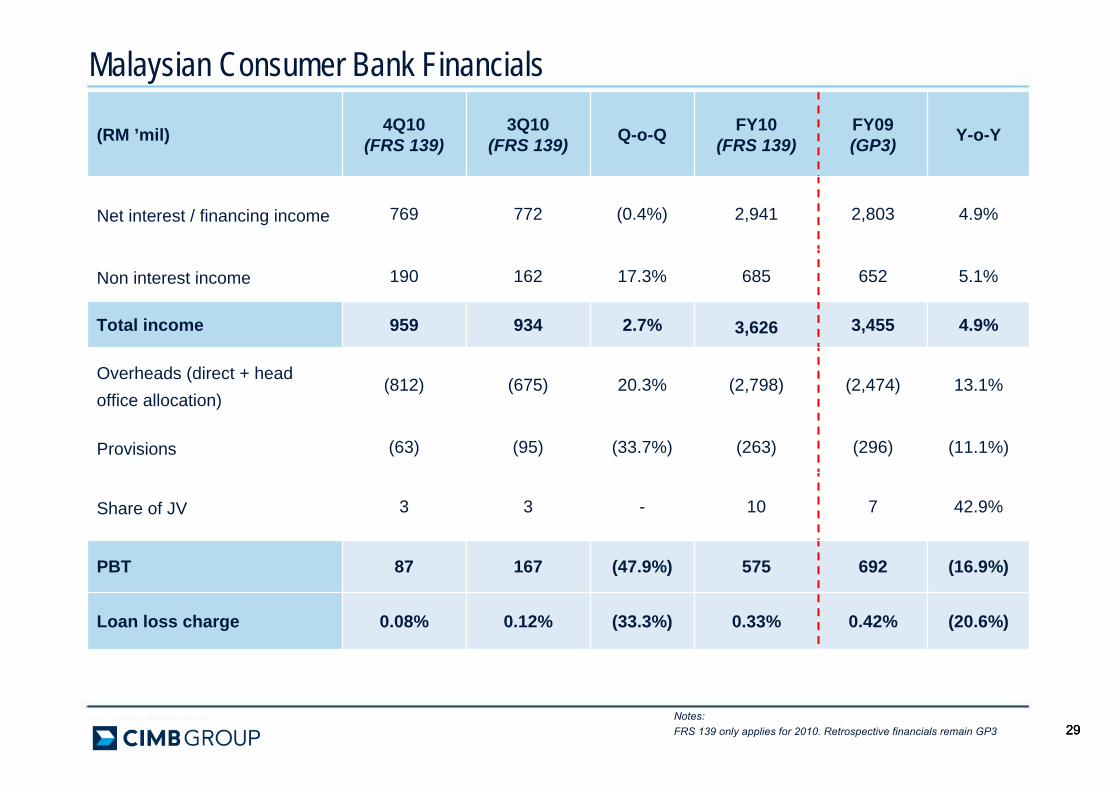
Malaysian Consumer Bank Financials
Notes: FRS 139 only applies for 2010. Retrospective financials remain GP3
(RM ’mil) 4Q10(FRS 139)
3Q10(FRS 139) Q-o-Q FY10
(FRS 139)FY09(GP3) Y-o-Y
Net interest / financing income 769 772 (0.4%) 2,941 2,803 4.9%
Non interest income 190 162 17.3% 685 652 5.1%
Total income 959 934 2.7% 3,626 3,455 4.9%
Overheads (direct + head office allocation)
(812) (675) 20.3% (2,798) (2,474) 13.1%
Provisions (63) (95) (33.7%) (263) (296) (11.1%)
Share of JV 3 3 - 10 7 42.9%
PBT 87 167 (47.9%) 575 692 (16.9%)
Loan loss charge 0.08% 0.12% (33.3%) 0.33% 0.42% (20.6%)
303030
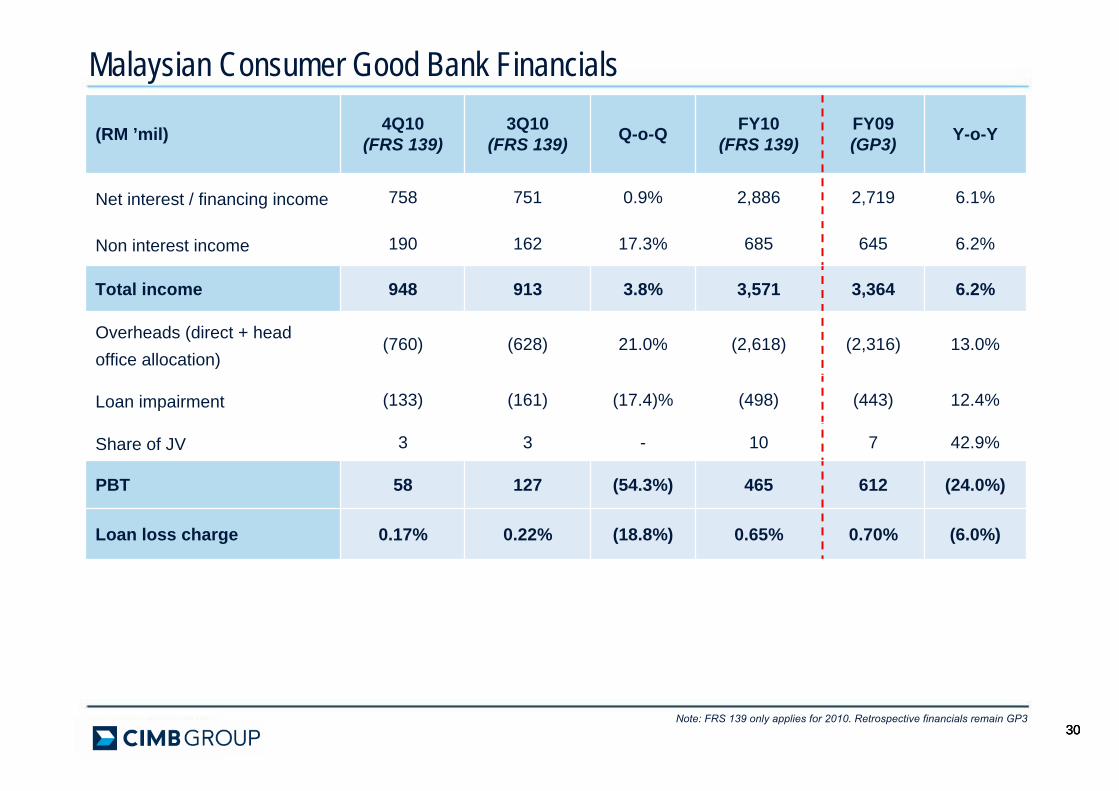
Malaysian Consumer Good Bank Financials
Note: FRS 139 only applies for 2010. Retrospective financials remain GP3
(RM ’mil) 4Q10(FRS 139)
3Q10(FRS 139) Q-o-Q FY10
(FRS 139)FY09(GP3) Y-o-Y
Net interest / financing income 758 751 0.9% 2,886 2,719 6.1%
Non interest income 190 162 17.3% 685 645 6.2%
Total income 948 913 3.8% 3,571 3,364 6.2%
Overheads (direct + head office allocation)
(760) (628) 21.0% (2,618) (2,316) 13.0%
Loan impairment (133) (161) (17.4)% (498) (443) 12.4%
Share of JV 3 3 - 10 7 42.9%
PBT 58 127 (54.3%) 465 612 (24.0%)
Loan loss charge 0.17% 0.22% (18.8%) 0.65% 0.70% (6.0%)
31
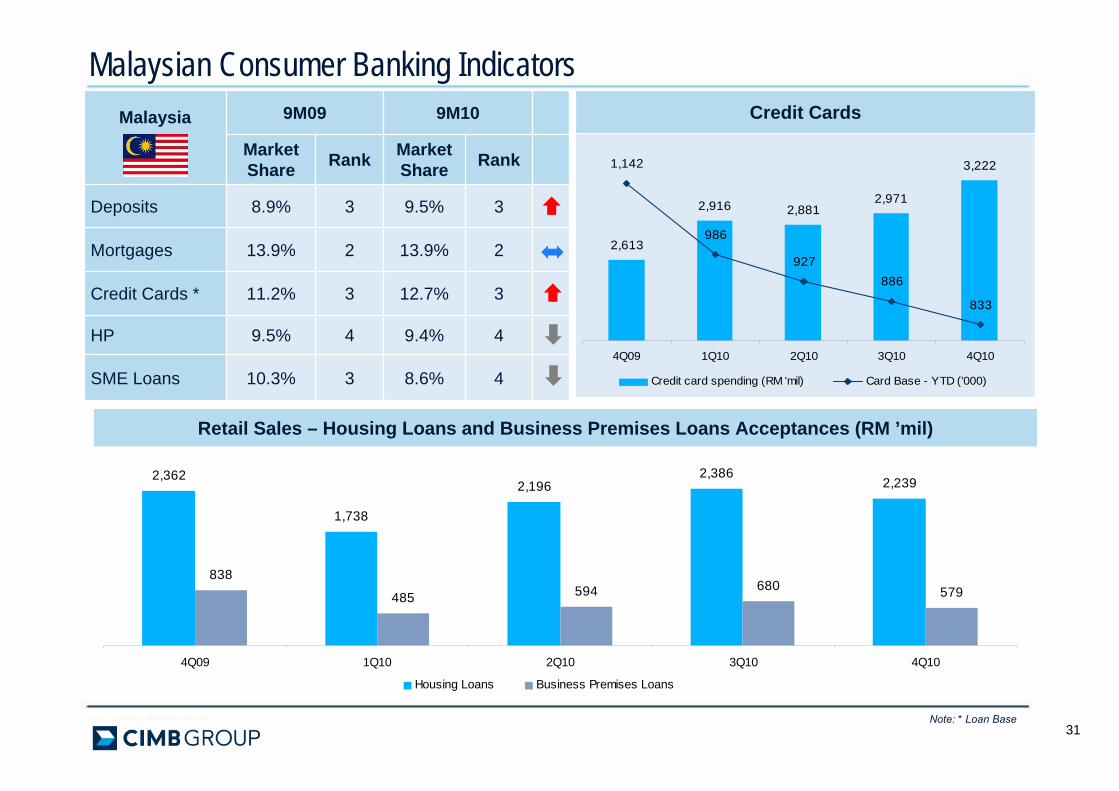
Malaysian Consumer Banking Indicators
Retail Sales – Housing Loans and Business Premises Loans Acceptances (RM ’mil)
2,362
1,738
2,1962,386
2,239
838
485 594 680 579
4Q09 1Q10 2Q10 3Q10 4Q10
Housing Loans Business Premises Loans
Malaysia 9M09 9M10
Market Share Rank Market
Share Rank
Deposits 8.9% 3 9.5% 3
Mortgages 13.9% 2 13.9% 2
Credit Cards * 11.2% 3 12.7% 3
HP 9.5% 4 9.4% 4
SME Loans 10.3% 3 8.6% 4
Credit Cards
2,613
2,916 2,8812,971
3,2221,142
986
927
833
886
4Q09 1Q10 2Q10 3Q10 4Q10
Credit card spending (RM 'mil) Card Base - YTD ('000)
Note: * Loan Base
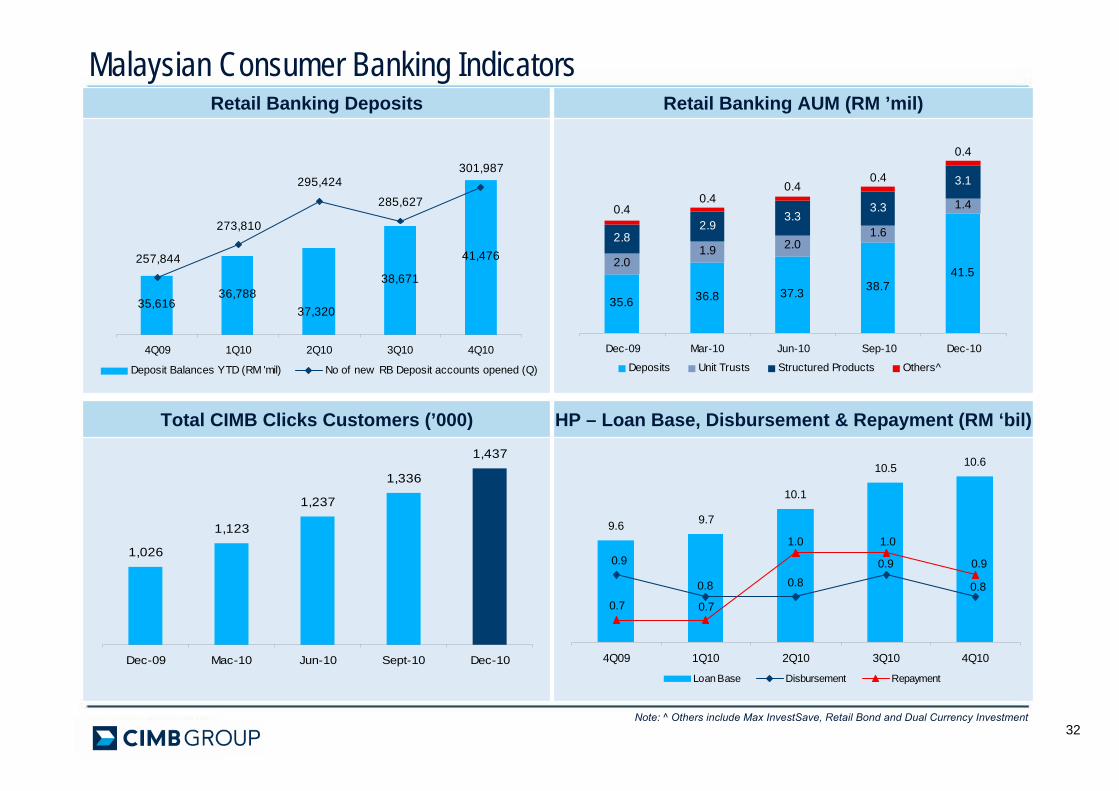
32
Retail Banking Deposits Retail Banking AUM (RM ’mil)
Total CIMB Clicks Customers (’000) HP – Loan Base, Disbursement & Repayment (RM ‘bil)
Note: ^ Others include Max InvestSave, Retail Bond and Dual Currency Investment
Malaysian Consumer Banking Indicators
1,026
1,123
1,237
1,336
1,437
Dec-09 Mac-10 Jun-10 Sept-10 Dec-10
35,61636,788
38,671
41,476
37,320
257,844
273,810
295,424301,987
285,627
4Q09 1Q10 2Q10 3Q10 4Q10
Deposit Balances YTD (RM 'mil) No of new RB Deposit accounts opened (Q)
35.6 36.8 37.3 38.741.5
2.01.9 2.0
1.62.82.9
3.33.3
3.1
1.4
0.4
0.40.4
0.40.4
Dec-09 Mar-10 Jun-10 Sep-10 Dec-10
Deposits Unit Trusts Structured Products Others^
9.6 9.7
10.1
10.5 10.6
0.8
0.90.80.8
0.9 0.9
1.01.0
0.70.7
4Q09 1Q10 2Q10 3Q10 4Q10
Loan Base Disbursement Repayment
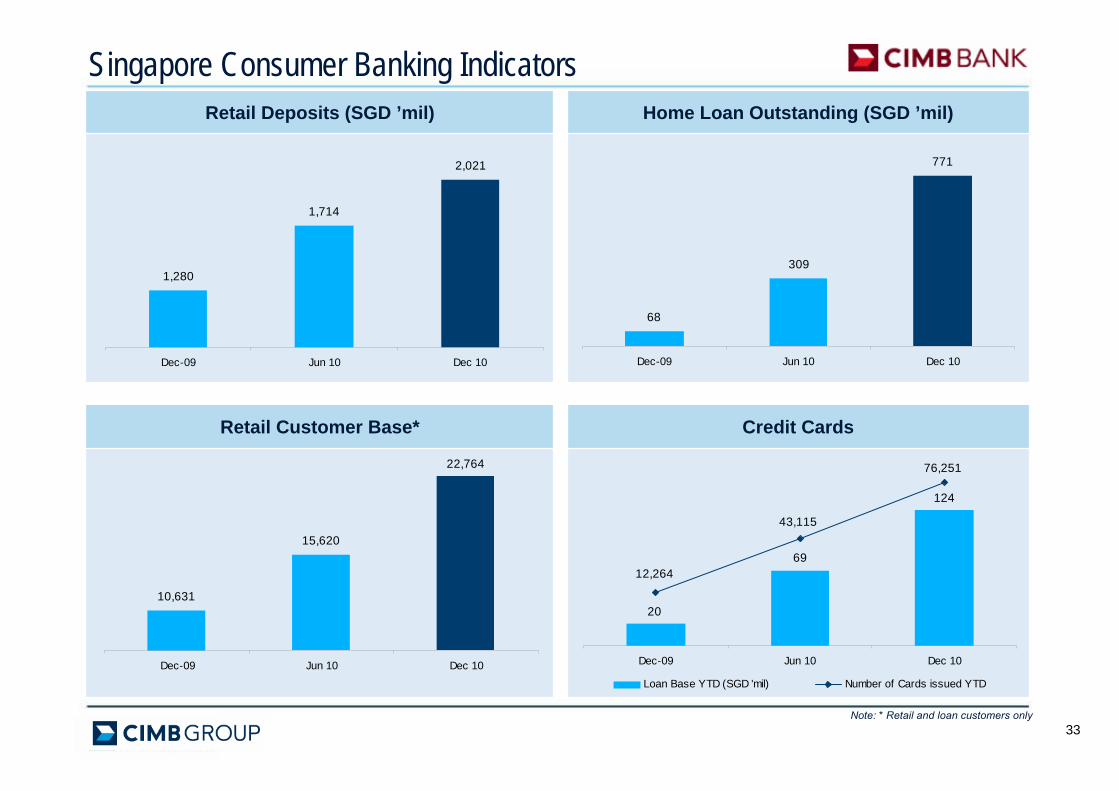
Retail Deposits (SGD ’mil) Home Loan Outstanding (SGD ’mil)
Retail Customer Base* Credit Cards
Singapore Consumer Banking Indicators
Note: * Retail and loan customers only33
1,280
1,714
2,021
Dec-09 Jun 10 Dec 10
68
309
771
Dec-09 Jun 10 Dec 10
10,631
15,620
22,764
Dec-09 Jun 10 Dec 10
20
69
124
12,264
43,115
76,251
Dec-09 Jun 10 Dec 10
Loan Base YTD (SGD 'mil) Number of Cards issued YTD

CIMB GROUP: FY10 RESULTSTREASURY & INVESTMENT BANKING
3535
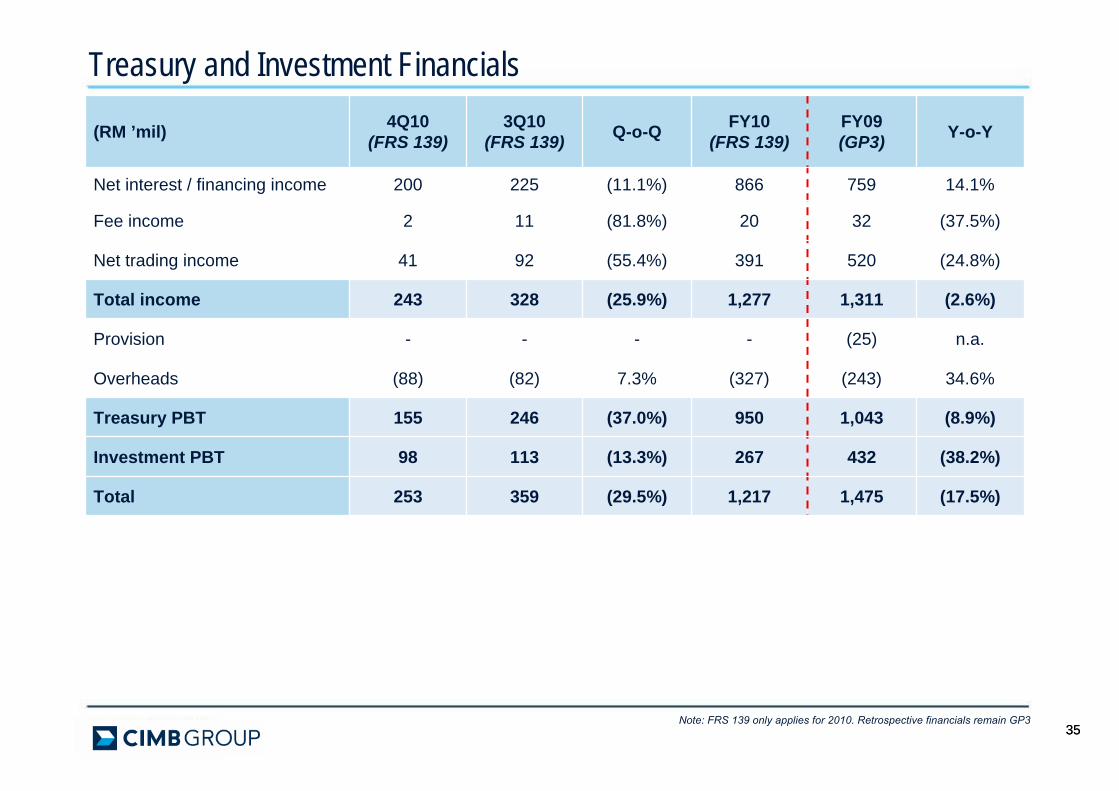
Treasury and Investment Financials
Note: FRS 139 only applies for 2010. Retrospective financials remain GP3
(RM ’mil) 4Q10(FRS 139)
3Q10(FRS 139) Q-o-Q FY10
(FRS 139)FY09(GP3) Y-o-Y
Net interest / financing income 200 225 (11.1%) 866 759 14.1%
Fee income 2 11 (81.8%) 20 32 (37.5%)
Net trading income 41 92 (55.4%) 391 520 (24.8%)
Total income 243 328 (25.9%) 1,277 1,311 (2.6%)
Provision - - - - (25) n.a.
Overheads (88) (82) 7.3% (327) (243) 34.6%
Treasury PBT 155 246 (37.0%) 950 1,043 (8.9%)
Investment PBT 98 113 (13.3%) 267 432 (38.2%)
Total 253 359 (29.5%) 1,217 1,475 (17.5%)
3636
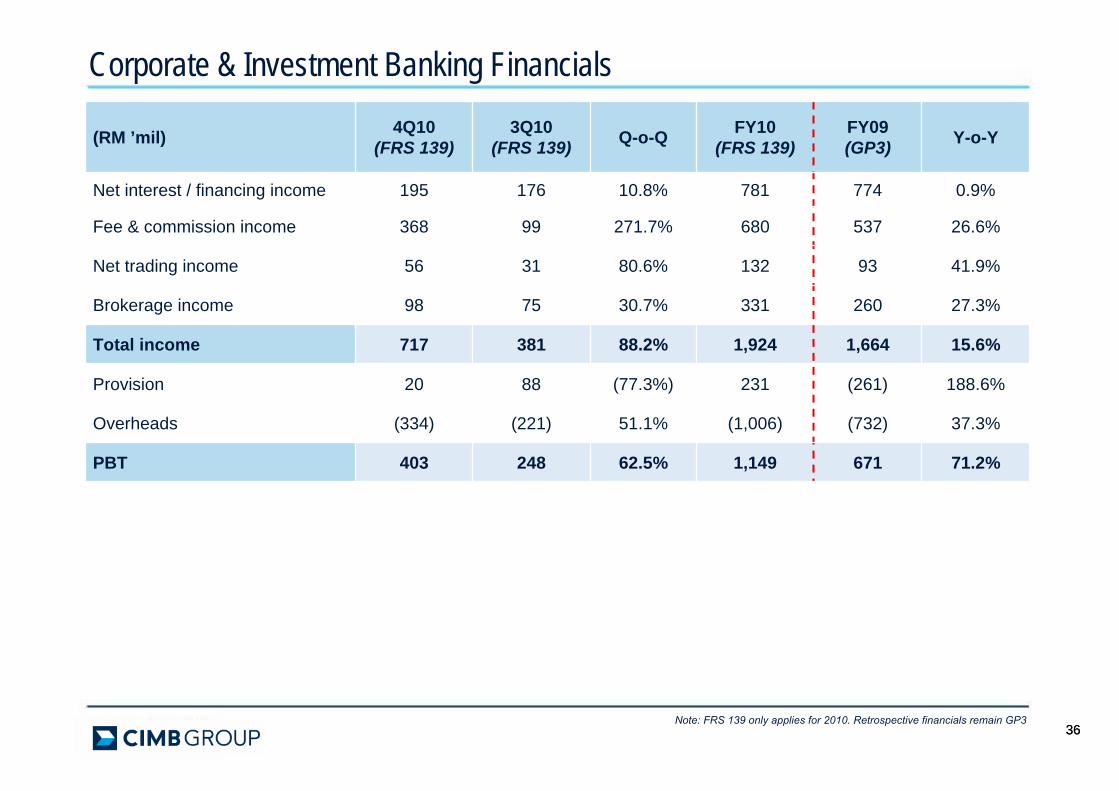
Corporate & Investment Banking Financials
Note: FRS 139 only applies for 2010. Retrospective financials remain GP3
(RM ’mil) 4Q10(FRS 139)
3Q10(FRS 139) Q-o-Q FY10
(FRS 139)FY09(GP3) Y-o-Y
Net interest / financing income 195 176 10.8% 781 774 0.9%
Fee & commission income 368 99 271.7% 680 537 26.6%
Net trading income 56 31 80.6% 132 93 41.9%
Brokerage income 98 75 30.7% 331 260 27.3%
Total income 717 381 88.2% 1,924 1,664 15.6%
Provision 20 88 (77.3%) 231 (261) 188.6%
Overheads (334) (221) 51.1% (1,006) (732) 37.3%
PBT 403 248 62.5% 1,149 671 71.2%
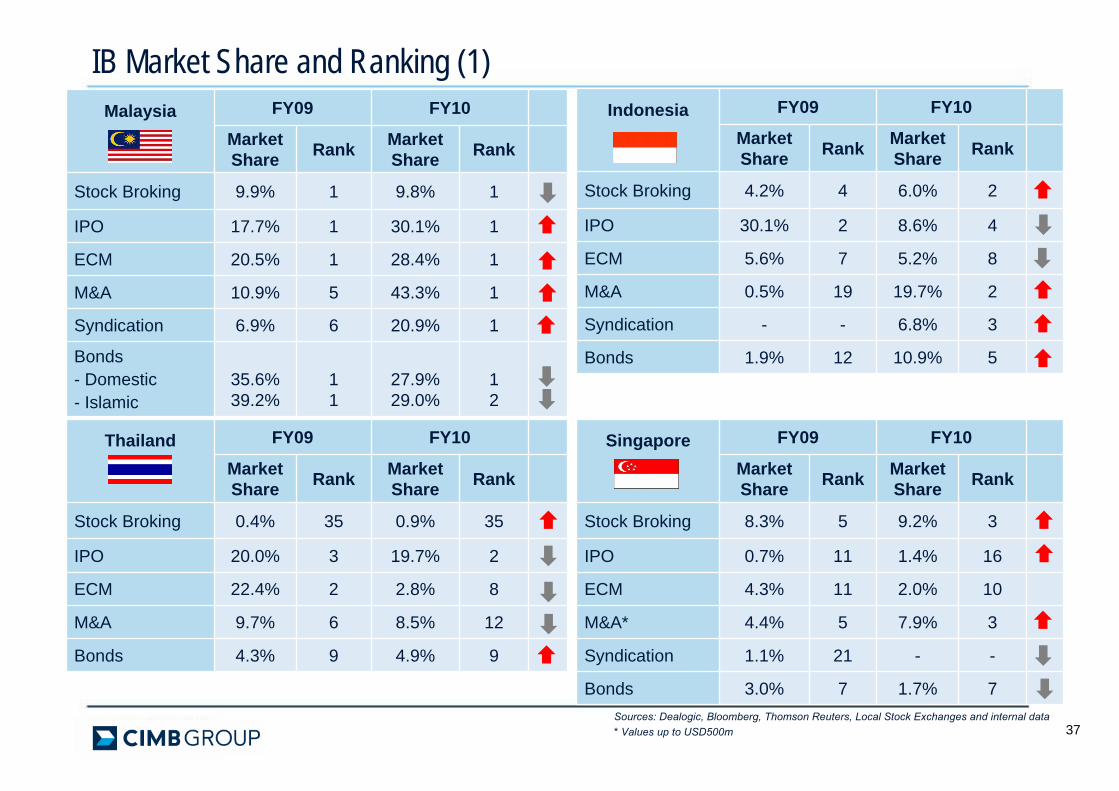
Sources: Dealogic, Bloomberg, Thomson Reuters, Local Stock Exchanges and internal data* Values up to USD500m
IB Market Share and Ranking (1)Malaysia FY09 FY10
Market Share Rank Market
Share Rank
Stock Broking 9.9% 1 9.8% 1
IPO 17.7% 1 30.1% 1
ECM 20.5% 1 28.4% 1
M&A 10.9% 5 43.3% 1
Syndication 6.9% 6 20.9% 1
Bonds- Domestic- Islamic
35.6%39.2%
11
27.9%29.0%
12
Thailand FY09 FY10
Market Share Rank Market
Share Rank
Stock Broking 0.4% 35 0.9% 35
IPO 20.0% 3 19.7% 2
ECM 22.4% 2 2.8% 8
M&A 9.7% 6 8.5% 12
Bonds 4.3% 9 4.9% 9
Indonesia FY09 FY10
Market Share Rank Market
Share Rank
Stock Broking 4.2% 4 6.0% 2
IPO 30.1% 2 8.6% 4
ECM 5.6% 7 5.2% 8
M&A 0.5% 19 19.7% 2
Syndication - - 6.8% 3
Bonds 1.9% 12 10.9% 5
Singapore FY09 FY10
Market Share Rank Market
Share Rank
Stock Broking 8.3% 5 9.2% 3
IPO 0.7% 11 1.4% 16
ECM 4.3% 11 2.0% 10
M&A* 4.4% 5 7.9% 3
Syndication 1.1% 21 - -
Bonds 3.0% 7 1.7% 7
37
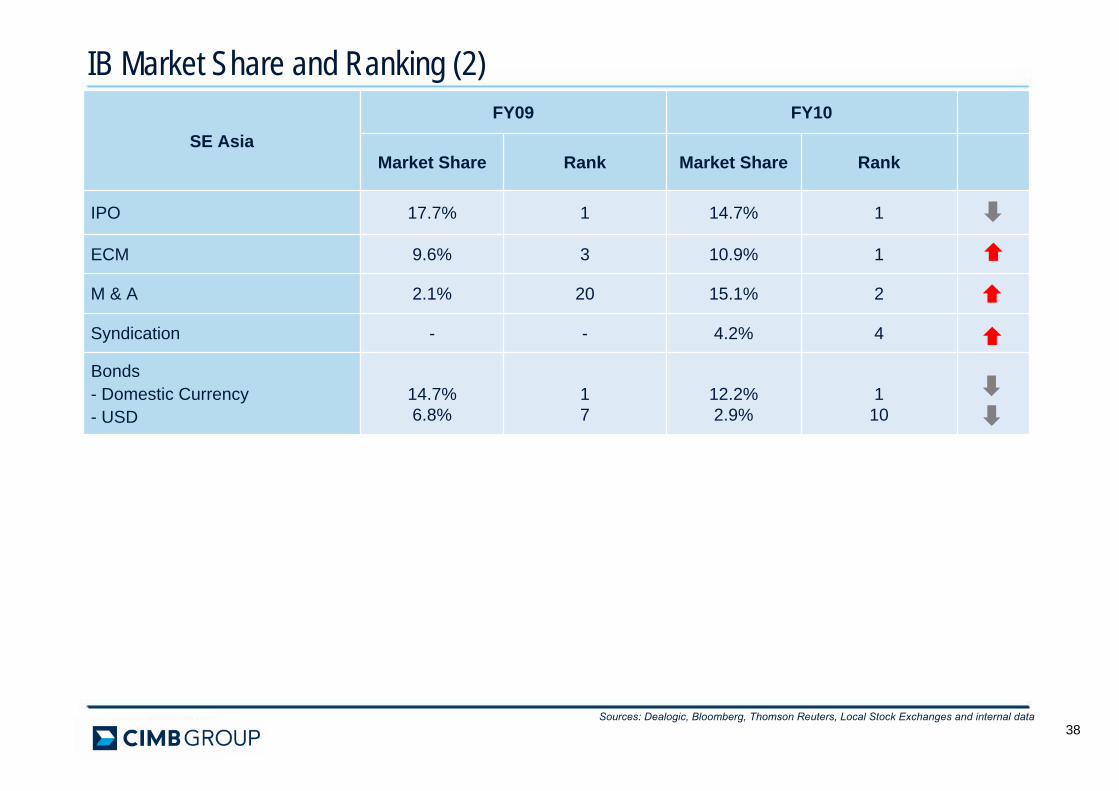
IB Market Share and Ranking (2)
38
SE AsiaFY09 FY10
Market Share Rank Market Share Rank
IPO 17.7% 1 14.7% 1
ECM 9.6% 3 10.9% 1
M & A 2.1% 20 15.1% 2
Syndication - - 4.2% 4
Bonds- Domestic Currency- USD
14.7%6.8%
17
12.2%2.9%
110
Sources: Dealogic, Bloomberg, Thomson Reuters, Local Stock Exchanges and internal data
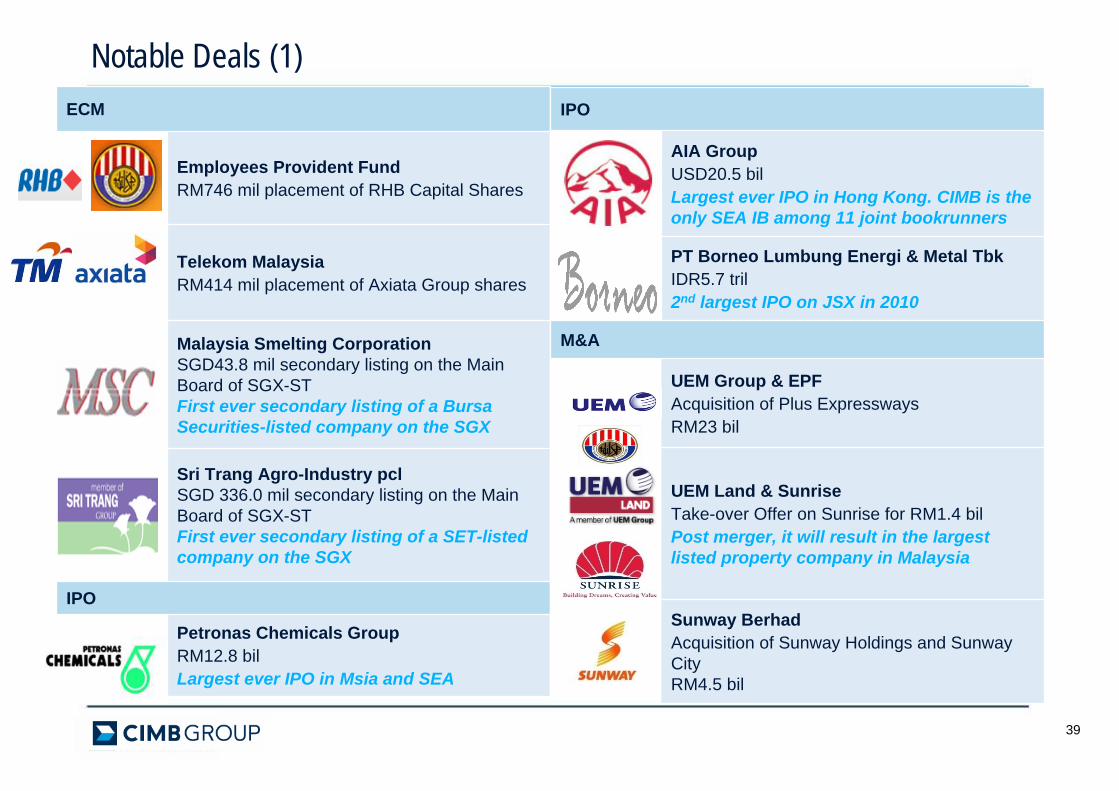
Notable Deals (1)ECM
Employees Provident FundRM746 mil placement of RHB Capital Shares
Telekom MalaysiaRM414 mil placement of Axiata Group shares
Malaysia Smelting CorporationSGD43.8 mil secondary listing on the Main Board of SGX-STFirst ever secondary listing of a Bursa Securities-listed company on the SGX
Sri Trang Agro-Industry pclSGD 336.0 mil secondary listing on the Main Board of SGX-STFirst ever secondary listing of a SET-listed company on the SGX
IPO
Petronas Chemicals GroupRM12.8 bilLargest ever IPO in Msia and SEA
39
IPO
AIA GroupUSD20.5 bilLargest ever IPO in Hong Kong. CIMB is the only SEA IB among 11 joint bookrunners
PT Borneo Lumbung Energi & Metal TbkIDR5.7 tril2nd largest IPO on JSX in 2010
M&A
UEM Group & EPFAcquisition of Plus ExpresswaysRM23 bil
UEM Land & SunriseTake-over Offer on Sunrise for RM1.4 bilPost merger, it will result in the largest listed property company in Malaysia
Sunway BerhadAcquisition of Sunway Holdings and Sunway CityRM4.5 bil
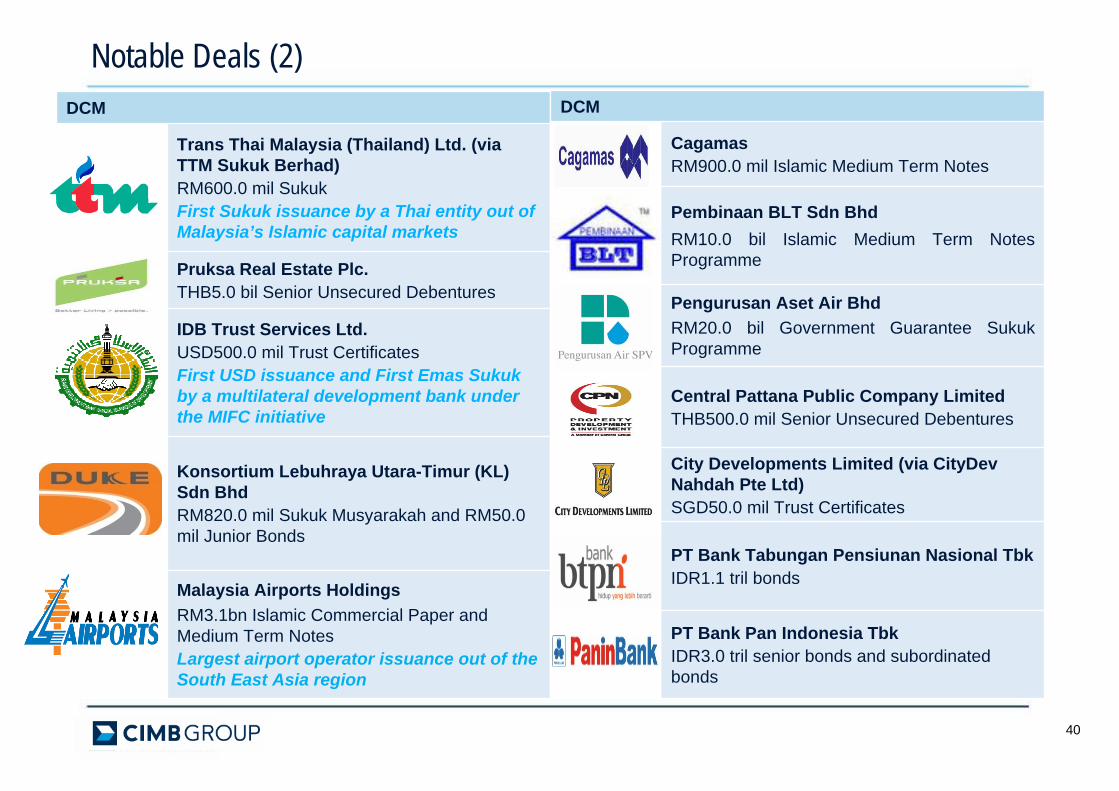
Notable Deals (2)DCM
Trans Thai Malaysia (Thailand) Ltd. (via TTM Sukuk Berhad)RM600.0 mil SukukFirst Sukuk issuance by a Thai entity out of Malaysia’s Islamic capital markets
Pruksa Real Estate Plc.THB5.0 bil Senior Unsecured Debentures
IDB Trust Services Ltd.USD500.0 mil Trust CertificatesFirst USD issuance and First Emas Sukukby a multilateral development bank under the MIFC initiative
Konsortium Lebuhraya Utara-Timur (KL) Sdn BhdRM820.0 mil Sukuk Musyarakah and RM50.0 mil Junior Bonds
Malaysia Airports HoldingsRM3.1bn Islamic Commercial Paper and Medium Term NotesLargest airport operator issuance out of the South East Asia region
40
DCM
CagamasRM900.0 mil Islamic Medium Term Notes
Pembinaan BLT Sdn BhdRM10.0 bil Islamic Medium Term Notes Programme
Pengurusan Aset Air BhdRM20.0 bil Government Guarantee SukukProgramme
Central Pattana Public Company Limited THB500.0 mil Senior Unsecured Debentures
City Developments Limited (via CityDevNahdah Pte Ltd)SGD50.0 mil Trust Certificates
PT Bank Tabungan Pensiunan Nasional Tbk IDR1.1 tril bonds
PT Bank Pan Indonesia TbkIDR3.0 tril senior bonds and subordinated bonds

CIMB GROUP: FY10 RESULTSASSET MANAGEMENT & INSURANCE
4242424242
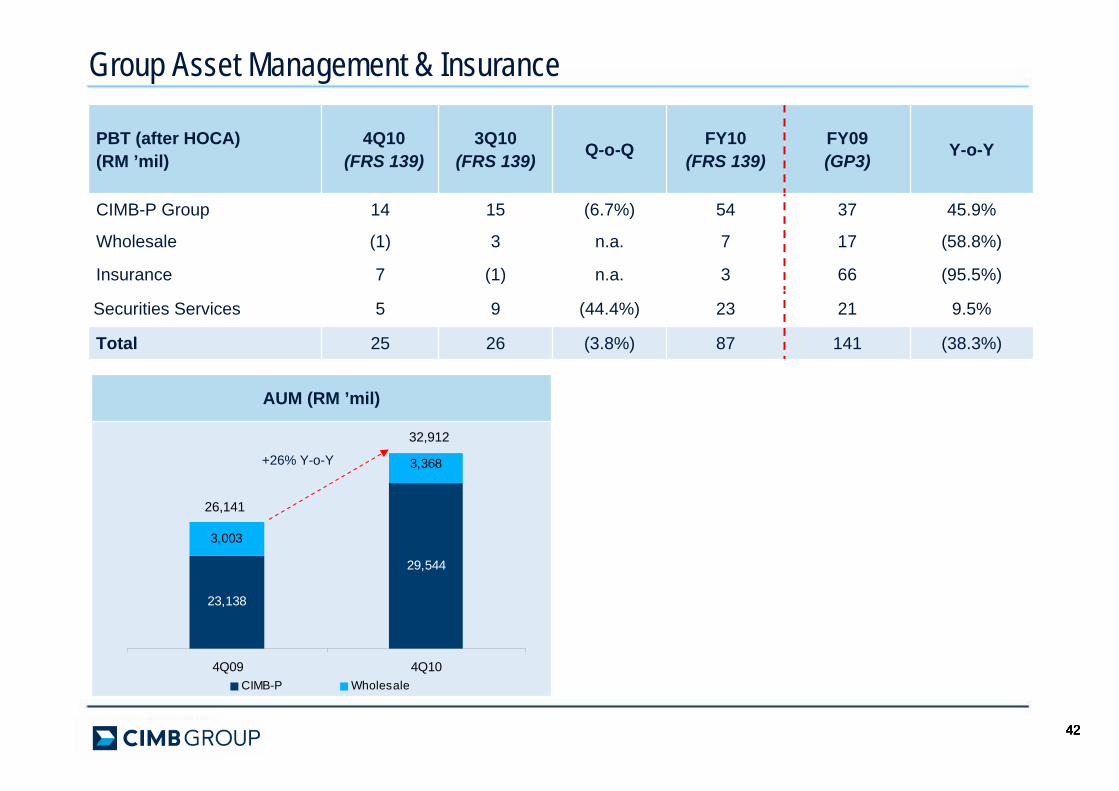
Group Asset Management & Insurance
AUM (RM ’mil)
PBT (after HOCA)(RM ’mil)
4Q10(FRS 139)
3Q10(FRS 139) Q-o-Q FY10
(FRS 139)FY09(GP3) Y-o-Y
CIMB-P Group 14 15 (6.7%) 54 37 45.9%
Wholesale (1) 3 n.a. 7 17 (58.8%)
Insurance 7 (1) n.a. 3 66 (95.5%)
Securities Services 5 9 (44.4%) 23 21 9.5%
Total 25 26 (3.8%) 87 141 (38.3%)
26,141
32,912
23,138
29,544
3,003
3,368
4Q09 4Q10CIMB-P Wholesale
+26% Y-o-Y
CIMB GROUP: FY10 RESULTSCIMB NIAGA
444444
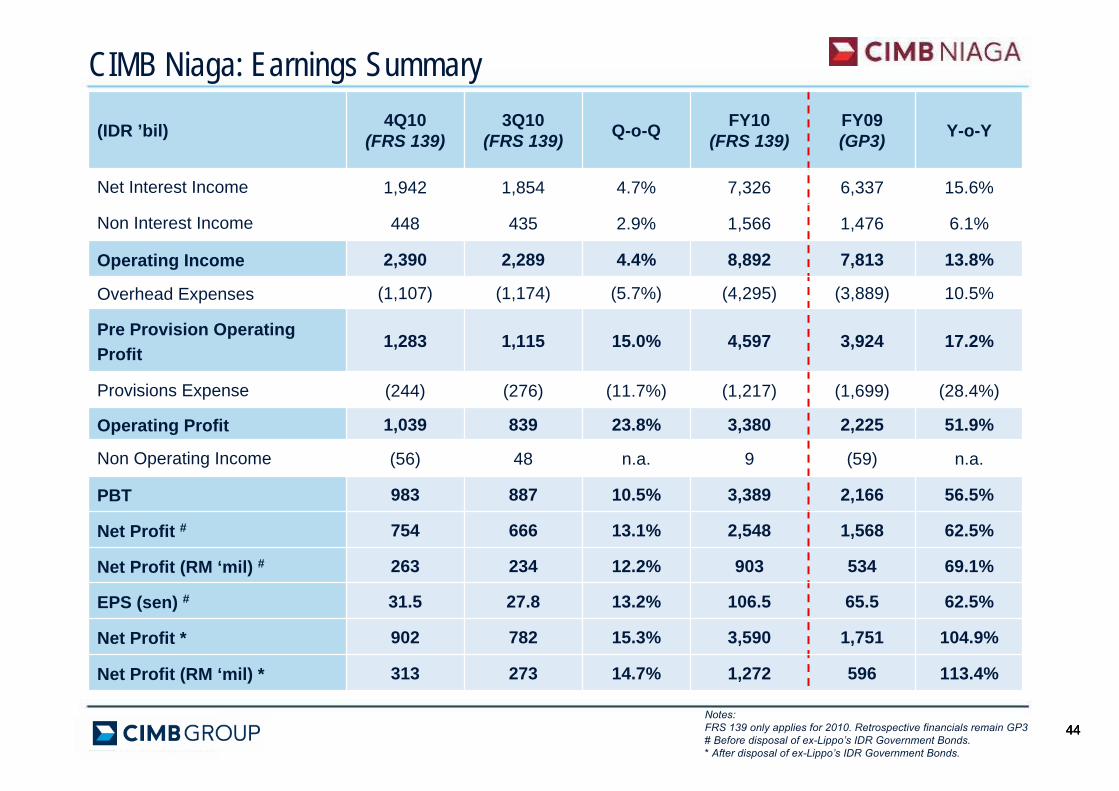
CIMB Niaga: Earnings Summary
(IDR ’bil) 4Q10(FRS 139)
3Q10(FRS 139) Q-o-Q FY10
(FRS 139)FY09(GP3) Y-o-Y
Net Interest Income 1,942 1,854 4.7% 7,326 6,337 15.6%
Non Interest Income 448 435 2.9% 1,566 1,476 6.1%
Operating Income 2,390 2,289 4.4% 8,892 7,813 13.8%
Overhead Expenses (1,107) (1,174) (5.7%) (4,295) (3,889) 10.5%
Pre Provision Operating Profit
1,283 1,115 15.0% 4,597 3,924 17.2%
Provisions Expense (244) (276) (11.7%) (1,217) (1,699) (28.4%)
Operating Profit 1,039 839 23.8% 3,380 2,225 51.9%
Non Operating Income (56) 48 n.a. 9 (59) n.a.
PBT 983 887 10.5% 3,389 2,166 56.5%
Net Profit # 754 666 13.1% 2,548 1,568 62.5%
Net Profit (RM ‘mil) # 263 234 12.2% 903 534 69.1%
EPS (sen) # 31.5 27.8 13.2% 106.5 65.5 62.5%
Net Profit * 902 782 15.3% 3,590 1,751 104.9%
Net Profit (RM ‘mil) * 313 273 14.7% 1,272 596 113.4%
Notes: FRS 139 only applies for 2010. Retrospective financials remain GP3# Before disposal of ex-Lippo’s IDR Government Bonds.* After disposal of ex-Lippo’s IDR Government Bonds.
454545
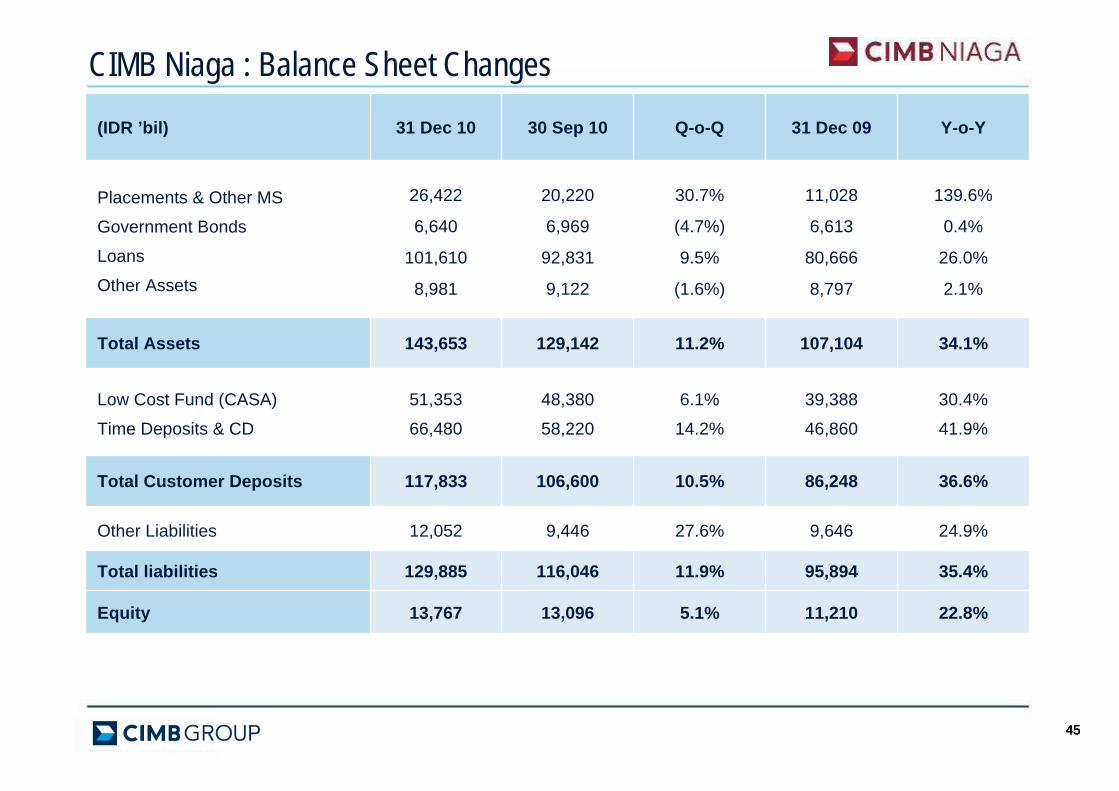
CIMB Niaga : Balance Sheet Changes(IDR ’bil) 31 Dec 10 30 Sep 10 Q-o-Q 31 Dec 09 Y-o-Y
Placements & Other MS
Government Bonds
Loans
Other Assets
26,422
6,640
101,610
8,981
20,220
6,969
92,831
9,122
30.7%
(4.7%)
9.5%
(1.6%)
11,028
6,613
80,666
8,797
139.6%
0.4%
26.0%
2.1%
Total Assets 143,653 129,142 11.2% 107,104 34.1%
Low Cost Fund (CASA)
Time Deposits & CD
51,353
66,480
48,380
58,220
6.1%
14.2%
39,388
46,860
30.4%
41.9%
Total Customer Deposits 117,833 106,600 10.5% 86,248 36.6%
Other Liabilities 12,052 9,446 27.6% 9,646 24.9%
Total liabilities 129,885 116,046 11.9% 95,894 35.4%
Equity 13,767 13,096 5.1% 11,210 22.8%
46464646
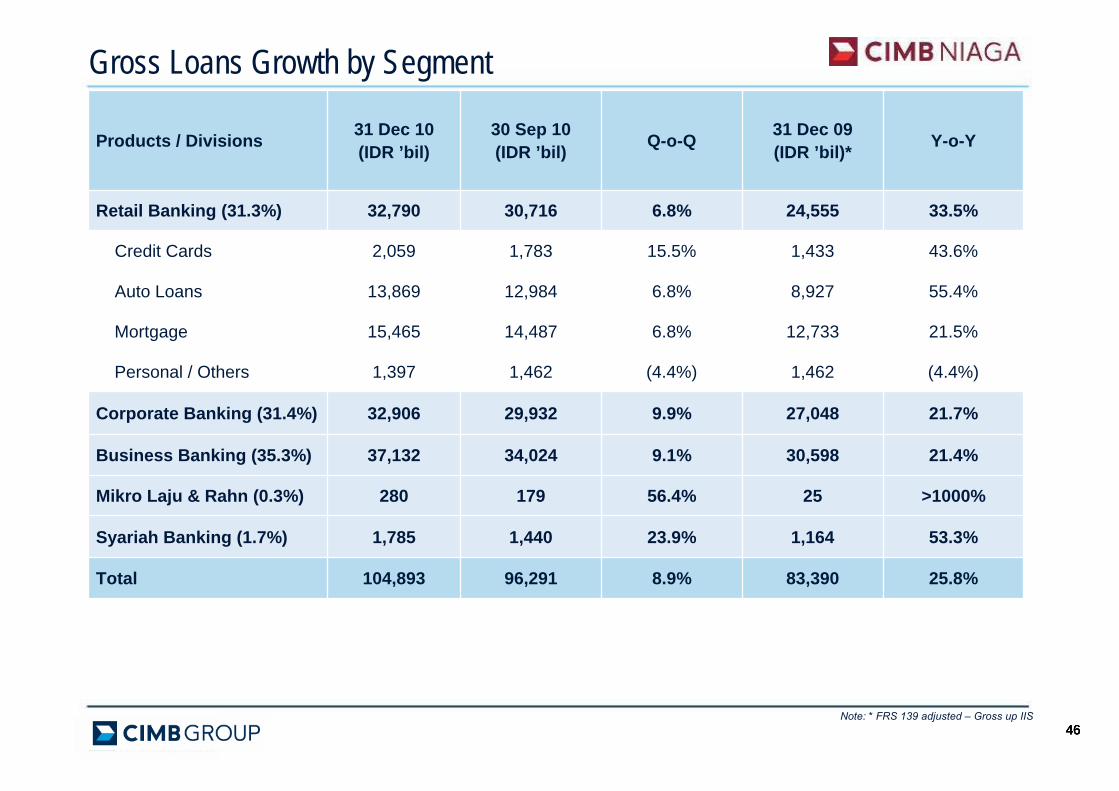
Products / Divisions 31 Dec 10(IDR ’bil)
30 Sep 10(IDR ’bil) Q-o-Q 31 Dec 09
(IDR ’bil)* Y-o-Y
Retail Banking (31.3%) 32,790 30,716 6.8% 24,555 33.5%
Credit Cards 2,059 1,783 15.5% 1,433 43.6%
Auto Loans 13,869 12,984 6.8% 8,927 55.4%
Mortgage 15,465 14,487 6.8% 12,733 21.5%
Personal / Others 1,397 1,462 (4.4%) 1,462 (4.4%)
Corporate Banking (31.4%) 32,906 29,932 9.9% 27,048 21.7%
Business Banking (35.3%) 37,132 34,024 9.1% 30,598 21.4%
Mikro Laju & Rahn (0.3%) 280 179 56.4% 25 >1000%
Syariah Banking (1.7%) 1,785 1,440 23.9% 1,164 53.3%
Total 104,893 96,291 8.9% 83,390 25.8%
Gross Loans Growth by Segment
Note: * FRS 139 adjusted – Gross up IIS
4747
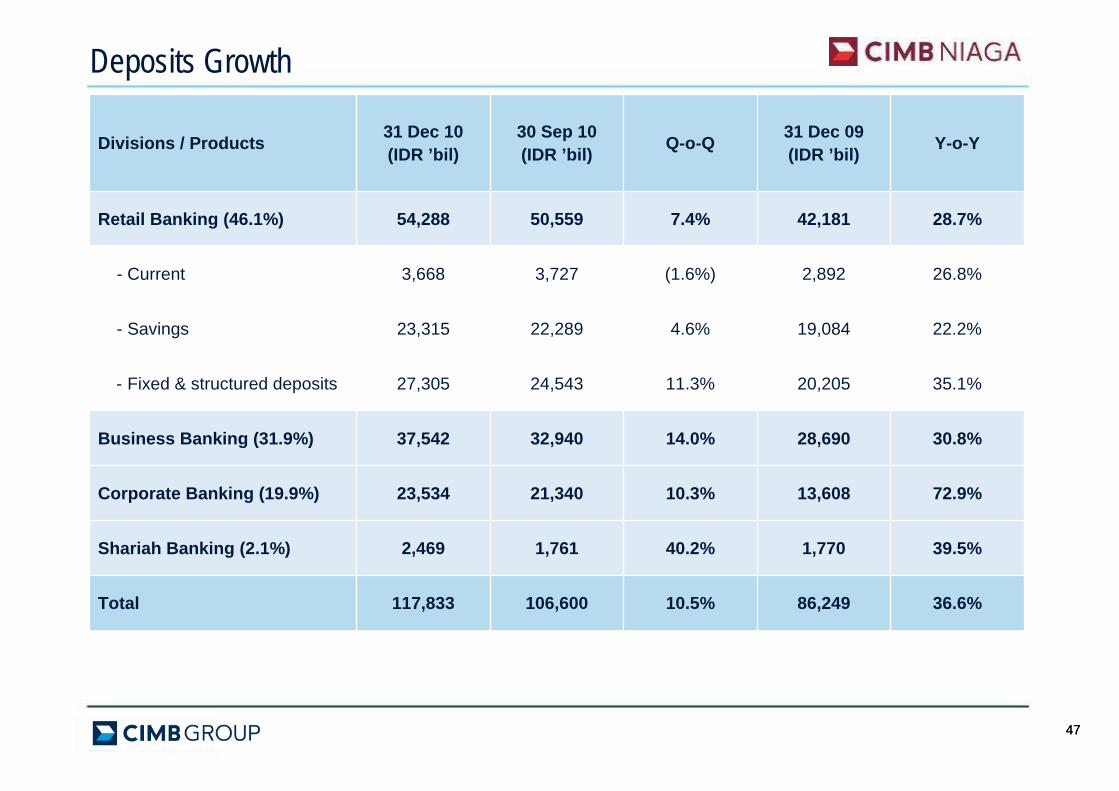
Deposits Growth
Divisions / Products 31 Dec 10(IDR ’bil)
30 Sep 10(IDR ’bil) Q-o-Q 31 Dec 09
(IDR ’bil) Y-o-Y
Retail Banking (46.1%) 54,288 50,559 7.4% 42,181 28.7%
- Current 3,668 3,727 (1.6%) 2,892 26.8%
- Savings 23,315 22,289 4.6% 19,084 22.2%
- Fixed & structured deposits 27,305 24,543 11.3% 20,205 35.1%
Business Banking (31.9%) 37,542 32,940 14.0% 28,690 30.8%
Corporate Banking (19.9%) 23,534 21,340 10.3% 13,608 72.9%
Shariah Banking (2.1%) 2,469 1,761 40.2% 1,770 39.5%
Total 117,833 106,600 10.5% 86,249 36.6%
48484848
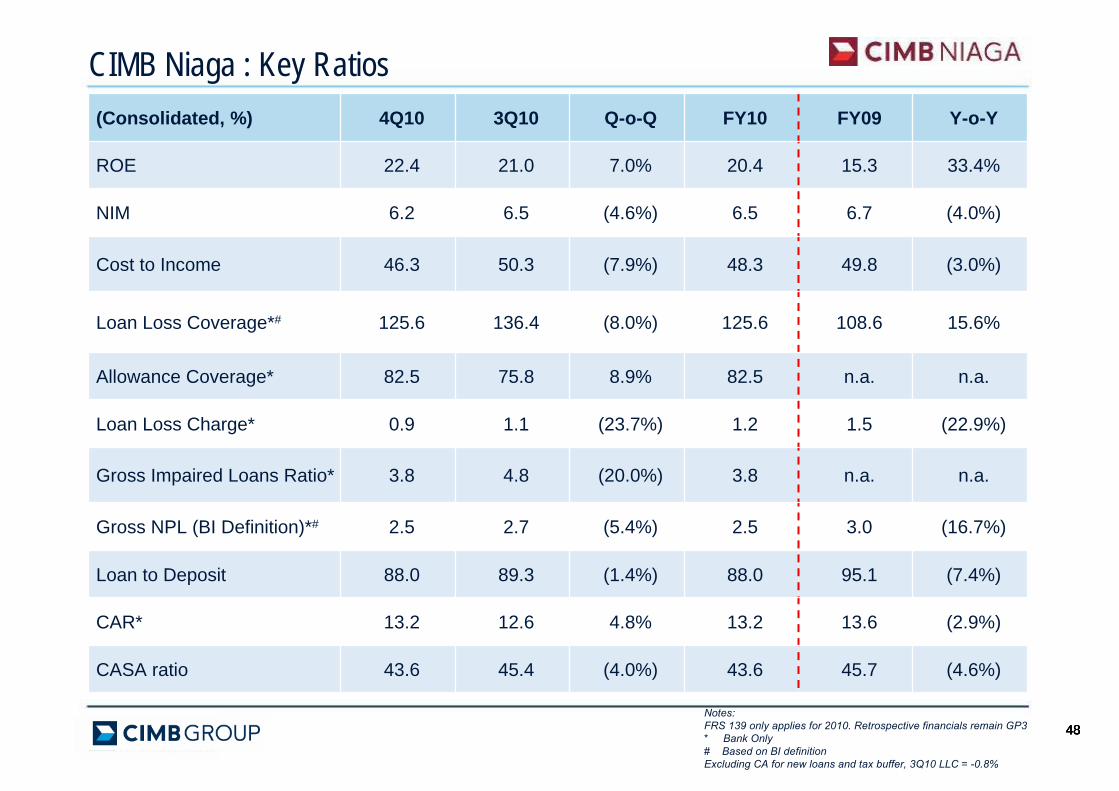
CIMB Niaga : Key Ratios
Notes: FRS 139 only applies for 2010. Retrospective financials remain GP3* Bank Only# Based on BI definitionExcluding CA for new loans and tax buffer, 3Q10 LLC = -0.8%
(Consolidated, %) 4Q10 3Q10 Q-o-Q FY10 FY09 Y-o-Y
ROE 22.4 21.0 7.0% 20.4 15.3 33.4%
NIM 6.2 6.5 (4.6%) 6.5 6.7 (4.0%)
Cost to Income 46.3 50.3 (7.9%) 48.3 49.8 (3.0%)
Loan Loss Coverage*# 125.6 136.4 (8.0%) 125.6 108.6 15.6%
Allowance Coverage* 82.5 75.8 8.9% 82.5 n.a. n.a.
Loan Loss Charge* 0.9 1.1 (23.7%) 1.2 1.5 (22.9%)
Gross Impaired Loans Ratio* 3.8 4.8 (20.0%) 3.8 n.a. n.a.
Gross NPL (BI Definition)*# 2.5 2.7 (5.4%) 2.5 3.0 (16.7%)
Loan to Deposit 88.0 89.3 (1.4%) 88.0 95.1 (7.4%)
CAR* 13.2 12.6 4.8% 13.2 13.6 (2.9%)
CASA ratio 43.6 45.4 (4.0%) 43.6 45.7 (4.6%)
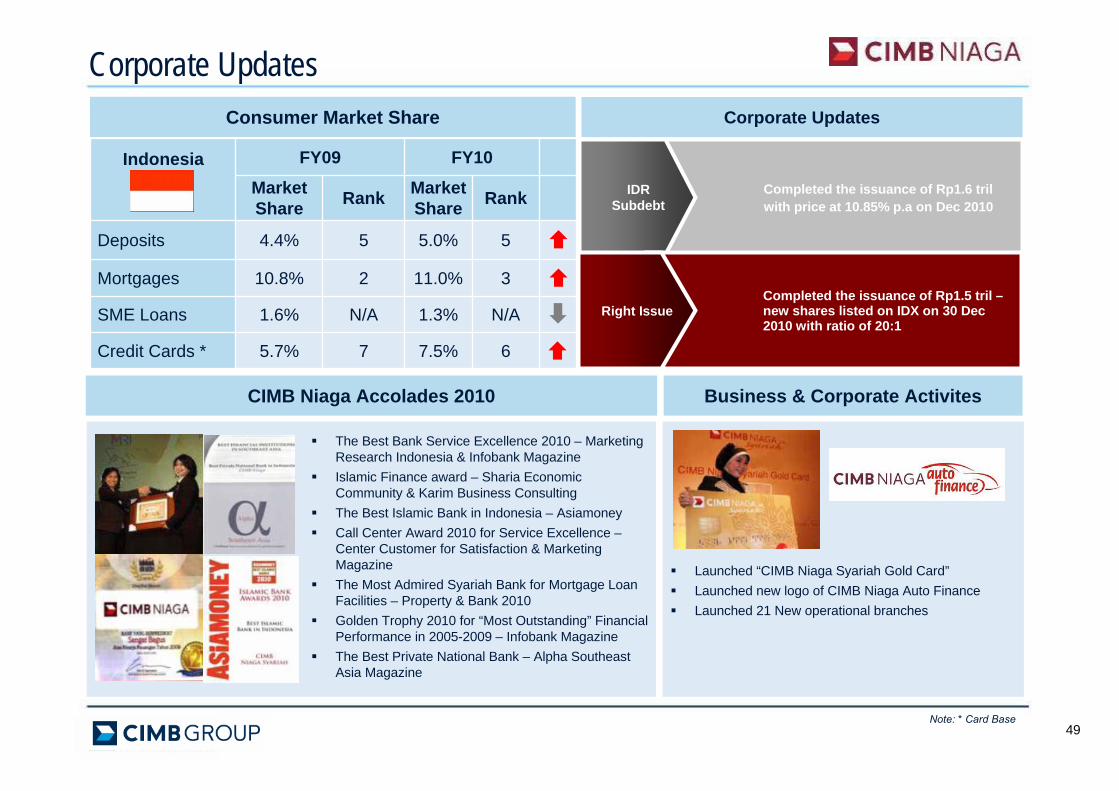
Corporate Updates
49
The Best Bank Service Excellence 2010 – Marketing Research Indonesia & Infobank MagazineIslamic Finance award – Sharia Economic Community & Karim Business ConsultingThe Best Islamic Bank in Indonesia – AsiamoneyCall Center Award 2010 for Service Excellence –Center Customer for Satisfaction & Marketing MagazineThe Most Admired Syariah Bank for Mortgage Loan Facilities – Property & Bank 2010Golden Trophy 2010 for “Most Outstanding” Financial Performance in 2005-2009 – Infobank MagazineThe Best Private National Bank – Alpha Southeast Asia Magazine
CIMB Niaga Accolades 2010 Business & Corporate Activites
67.5%75.7%Credit Cards *
Indonesia FY09 FY10
Market Share Rank Market
Share Rank
Deposits 4.4% 5 5.0% 5
Mortgages 10.8% 2 11.0% 3
SME Loans 1.6% N/A 1.3% N/A
Consumer Market Share
Launched “CIMB Niaga Syariah Gold Card”Launched new logo of CIMB Niaga Auto FinanceLaunched 21 New operational branches
Completed the issuance of Rp1.6 trilwith price at 10.85% p.a on Dec 2010
IDR Subdebt
Completed the issuance of Rp1.5 tril –new shares listed on IDX on 30 Dec 2010 with ratio of 20:1
Right Issue
Corporate Updates
Note: * Card Base
CIMB GROUP: FY10 RESULTSCIMB Thai
515151
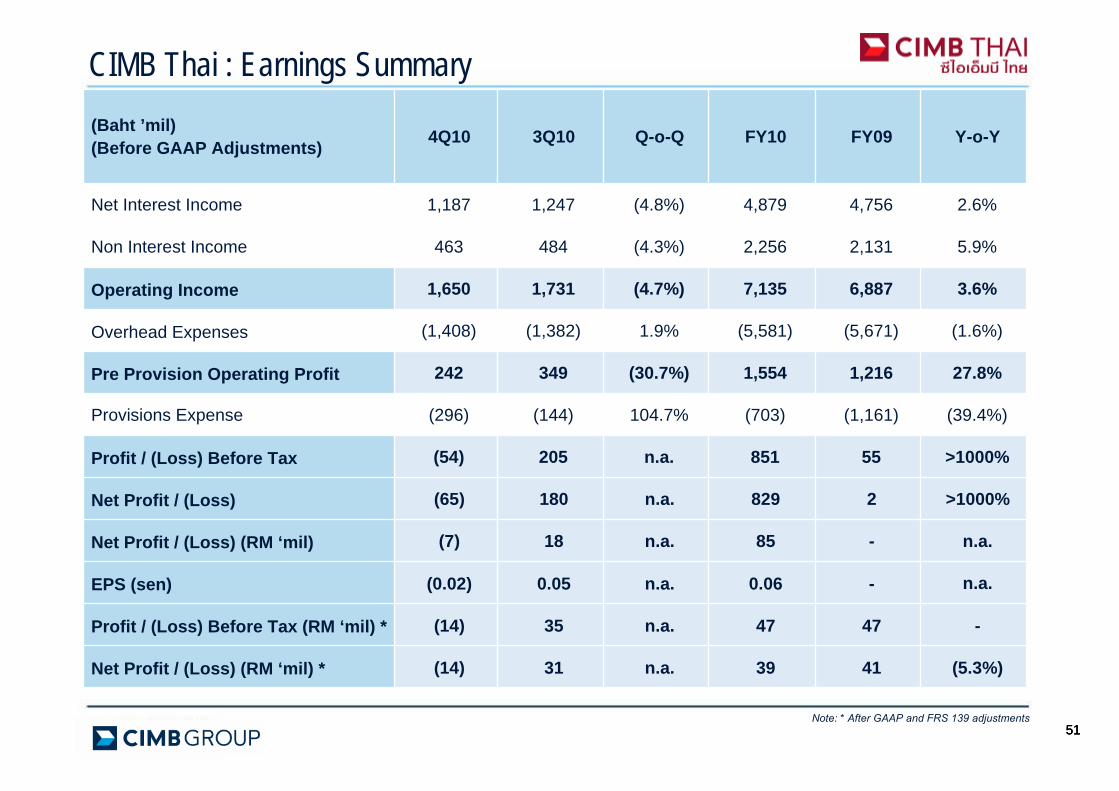
CIMB Thai : Earnings Summary
Note: * After GAAP and FRS 139 adjustments
(Baht ’mil)(Before GAAP Adjustments) 4Q10 3Q10 Q-o-Q FY10 FY09 Y-o-Y
Net Interest Income 1,187 1,247 (4.8%) 4,879 4,756 2.6%
Non Interest Income 463 484 (4.3%) 2,256 2,131 5.9%
Operating Income 1,650 1,731 (4.7%) 7,135 6,887 3.6%
Overhead Expenses (1,408) (1,382) 1.9% (5,581) (5,671) (1.6%)
Pre Provision Operating Profit 242 349 (30.7%) 1,554 1,216 27.8%
Provisions Expense (296) (144) 104.7% (703) (1,161) (39.4%)
Profit / (Loss) Before Tax (54) 205 n.a. 851 55 >1000%
Net Profit / (Loss) (65) 180 n.a. 829 2 >1000%
Net Profit / (Loss) (RM ‘mil) (7) 18 n.a. 85 - n.a.
EPS (sen) (0.02) 0.05 n.a. 0.06 - n.a.
Profit / (Loss) Before Tax (RM ‘mil) * (14) 35 n.a. 47 47 -
Net Profit / (Loss) (RM ‘mil) * (14) 31 n.a. 39 41 (5.3%)
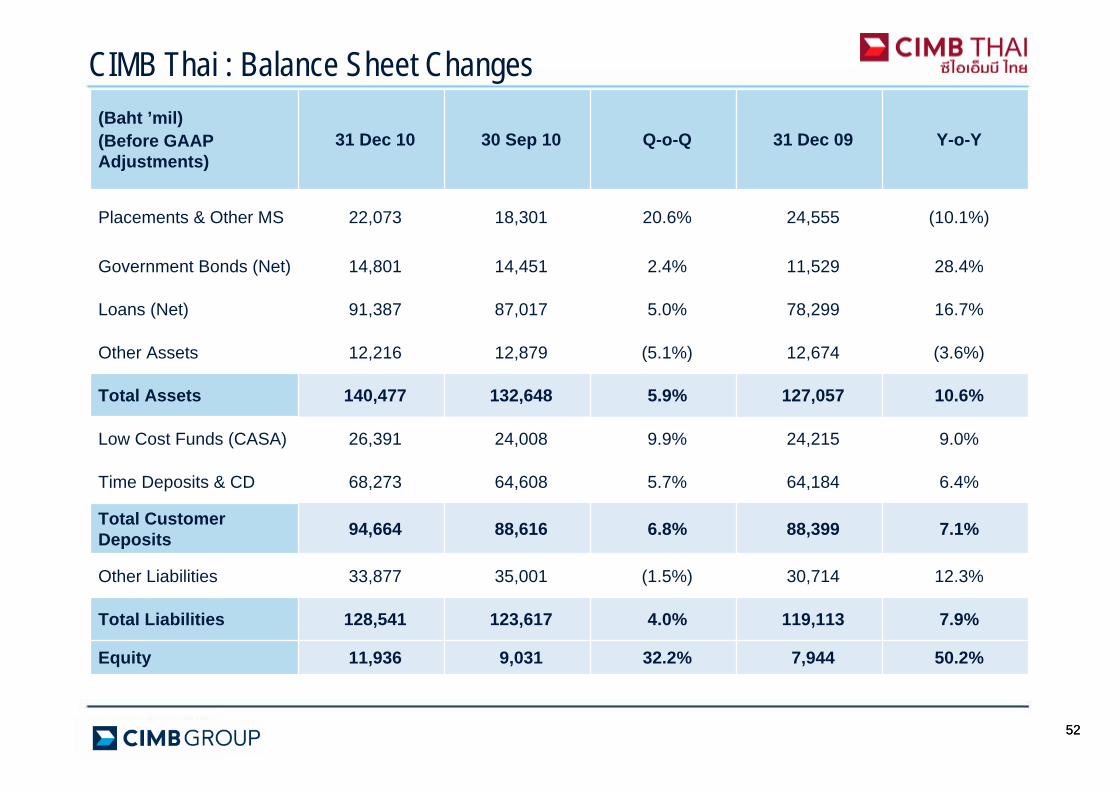
5252
CIMB Thai : Balance Sheet Changes(Baht ’mil)(Before GAAP Adjustments)
31 Dec 10 30 Sep 10 Q-o-Q 31 Dec 09 Y-o-Y
Placements & Other MS 22,073 18,301 20.6% 24,555 (10.1%)
Government Bonds (Net) 14,801 14,451 2.4% 11,529 28.4%
Loans (Net) 91,387 87,017 5.0% 78,299 16.7%
Other Assets 12,216 12,879 (5.1%) 12,674 (3.6%)
Total Assets 140,477 132,648 5.9% 127,057 10.6%
Low Cost Funds (CASA) 26,391 24,008 9.9% 24,215 9.0%
Time Deposits & CD 68,273 64,608 5.7% 64,184 6.4%
Total Customer Deposits 94,664 88,616 6.8% 88,399 7.1%
Other Liabilities 33,877 35,001 (1.5%) 30,714 12.3%
Total Liabilities 128,541 123,617 4.0% 119,113 7.9%
Equity 11,936 9,031 32.2% 7,944 50.2%
535353
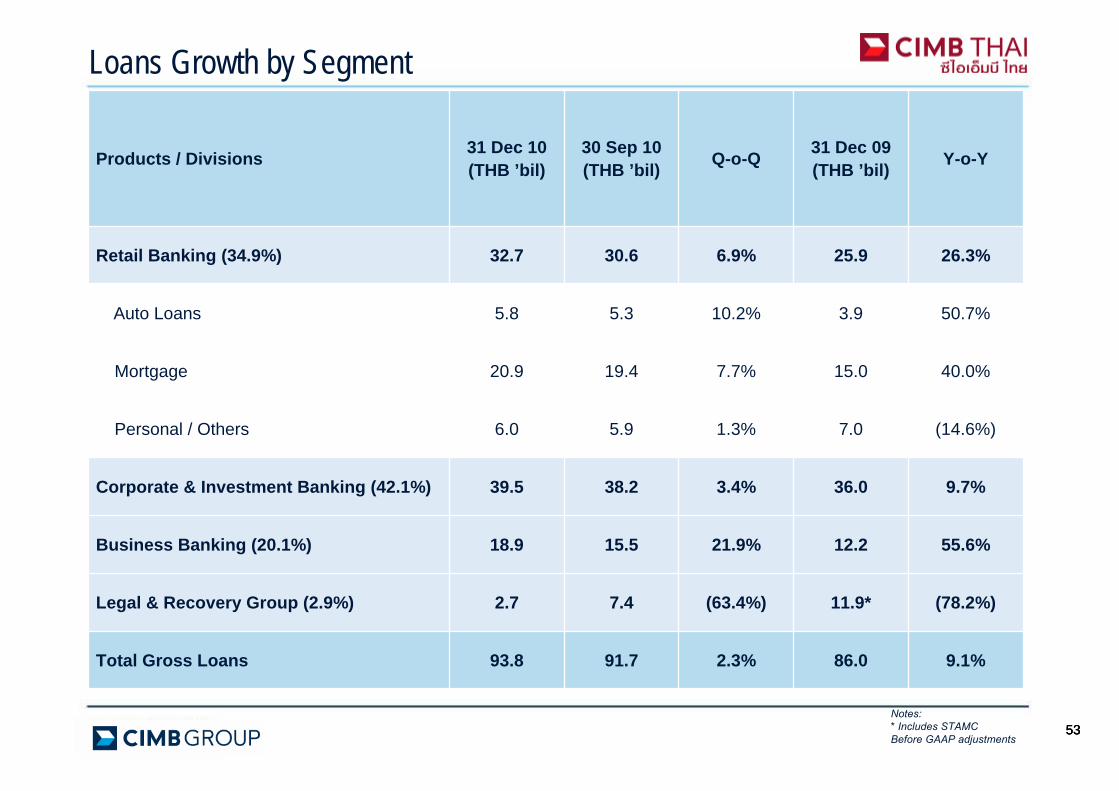
Loans Growth by Segment
Notes:* Includes STAMCBefore GAAP adjustments
Products / Divisions 31 Dec 10(THB ’bil)
30 Sep 10(THB ’bil) Q-o-Q 31 Dec 09
(THB ’bil) Y-o-Y
Retail Banking (34.9%) 32.7 30.6 6.9% 25.9 26.3%
Auto Loans 5.8 5.3 10.2% 3.9 50.7%
Mortgage 20.9 19.4 7.7% 15.0 40.0%
Personal / Others 6.0 5.9 1.3% 7.0 (14.6%)
Corporate & Investment Banking (42.1%) 39.5 38.2 3.4% 36.0 9.7%
Business Banking (20.1%) 18.9 15.5 21.9% 12.2 55.6%
Legal & Recovery Group (2.9%) 2.7 7.4 (63.4%) 11.9* (78.2%)
Total Gross Loans 93.8 91.7 2.3% 86.0 9.1%
5454
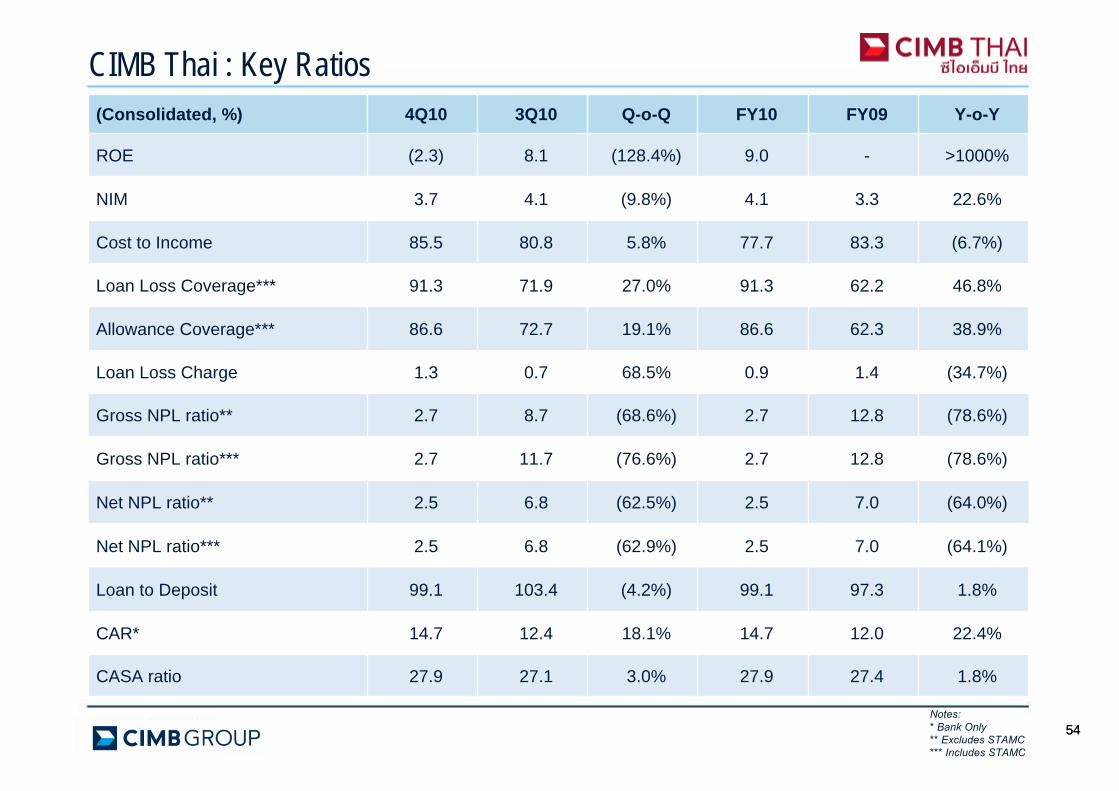
CIMB Thai : Key Ratios
Notes: * Bank Only** Excludes STAMC*** Includes STAMC
(Consolidated, %) 4Q10 3Q10 Q-o-Q FY10 FY09 Y-o-Y
ROE (2.3) 8.1 (128.4%) 9.0 - >1000%
NIM 3.7 4.1 (9.8%) 4.1 3.3 22.6%
Cost to Income 85.5 80.8 5.8% 77.7 83.3 (6.7%)
Loan Loss Coverage*** 91.3 71.9 27.0% 91.3 62.2 46.8%
Allowance Coverage*** 86.6 72.7 19.1% 86.6 62.3 38.9%
Loan Loss Charge 1.3 0.7 68.5% 0.9 1.4 (34.7%)
Gross NPL ratio** 2.7 8.7 (68.6%) 2.7 12.8 (78.6%)
Gross NPL ratio*** 2.7 11.7 (76.6%) 2.7 12.8 (78.6%)
Net NPL ratio** 2.5 6.8 (62.5%) 2.5 7.0 (64.0%)
Net NPL ratio*** 2.5 6.8 (62.9%) 2.5 7.0 (64.1%)
Loan to Deposit 99.1 103.4 (4.2%) 99.1 97.3 1.8%
CAR* 14.7 12.4 18.1% 14.7 12.0 22.4%
CASA ratio 27.9 27.1 3.0% 27.9 27.4 1.8%
Corporate Updates
55
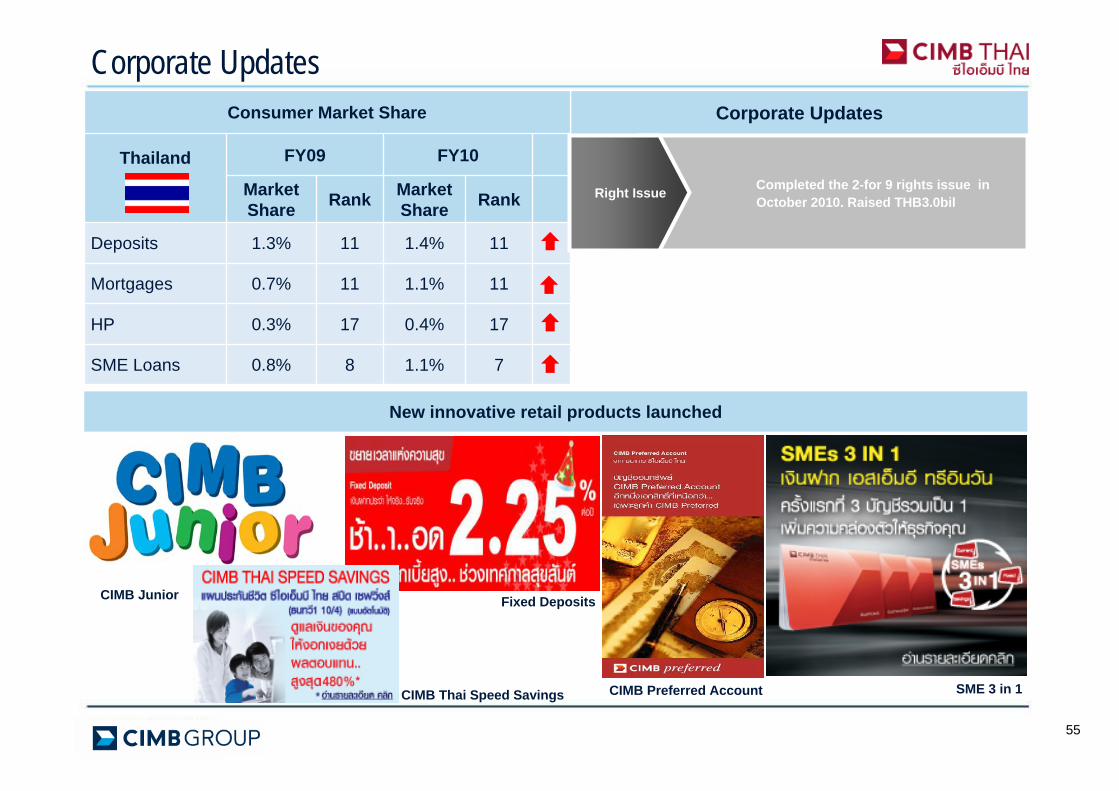
Corporate Updates
Fixed Deposits
Consumer Market Share
Thailand FY09 FY10
Market Share Rank Market
Share Rank
Deposits 1.3% 11 1.4% 11
Mortgages 0.7% 11 1.1% 11
HP 0.3% 17 0.4% 17
SME Loans 0.8% 8 1.1% 7
CIMB Junior
CIMB Thai Speed Savings SME 3 in 1CIMB Preferred Account
New innovative retail products launched
Completed the 2-for 9 rights issue in October 2010. Raised THB3.0bil
Right Issue

CIMB GROUP : FY10 RESULTSOTHER HIGHLIGHTS
57
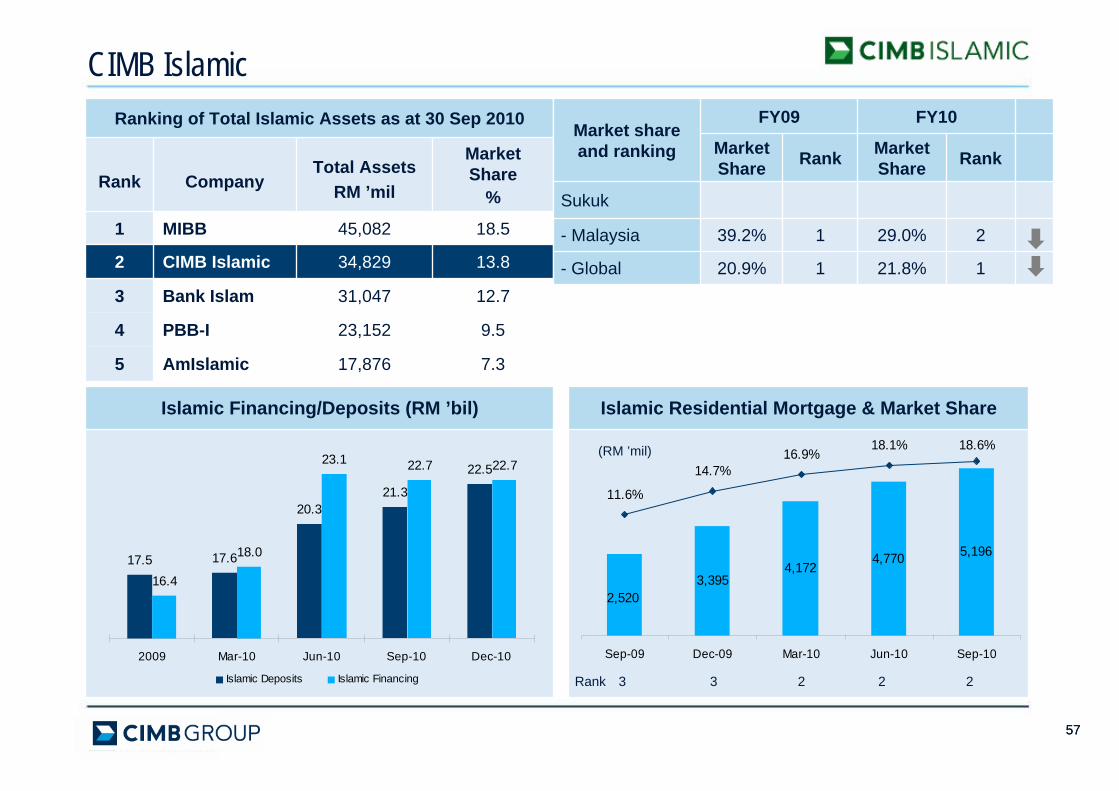
Ranking of Total Islamic Assets as at 30 Sep 2010
Rank CompanyTotal Assets
RM ’mil
Market Share
%
1 MIBB 45,082 18.5
2 CIMB Islamic 34,829 13.8
3 Bank Islam 31,047 12.7
4 PBB-I 23,152 9.5
5 AmIslamic 17,876 7.3
CIMB Islamic
Islamic Financing/Deposits (RM ’bil) Islamic Residential Mortgage & Market Share
57
(RM ’mil)
Rank 3 3 2 2 2
5,1964,7704,172
3,3952,520
11.6%
14.7%16.9%
18.1% 18.6%
Sep-09 Dec-09 Mar-10 Jun-10 Sep-10
16.4
18.0
23.1 22.7 22.7
17.5 17.6
20.321.3
22.5
2009 Mar-10 Jun-10 Sep-10 Dec-10
Islamic Deposits Islamic Financing
Market share and ranking
FY09 FY10
Market Share Rank Market
Share Rank
Sukuk
- Malaysia 39.2% 1 29.0% 2
- Global 20.9% 1 21.8% 1
5858
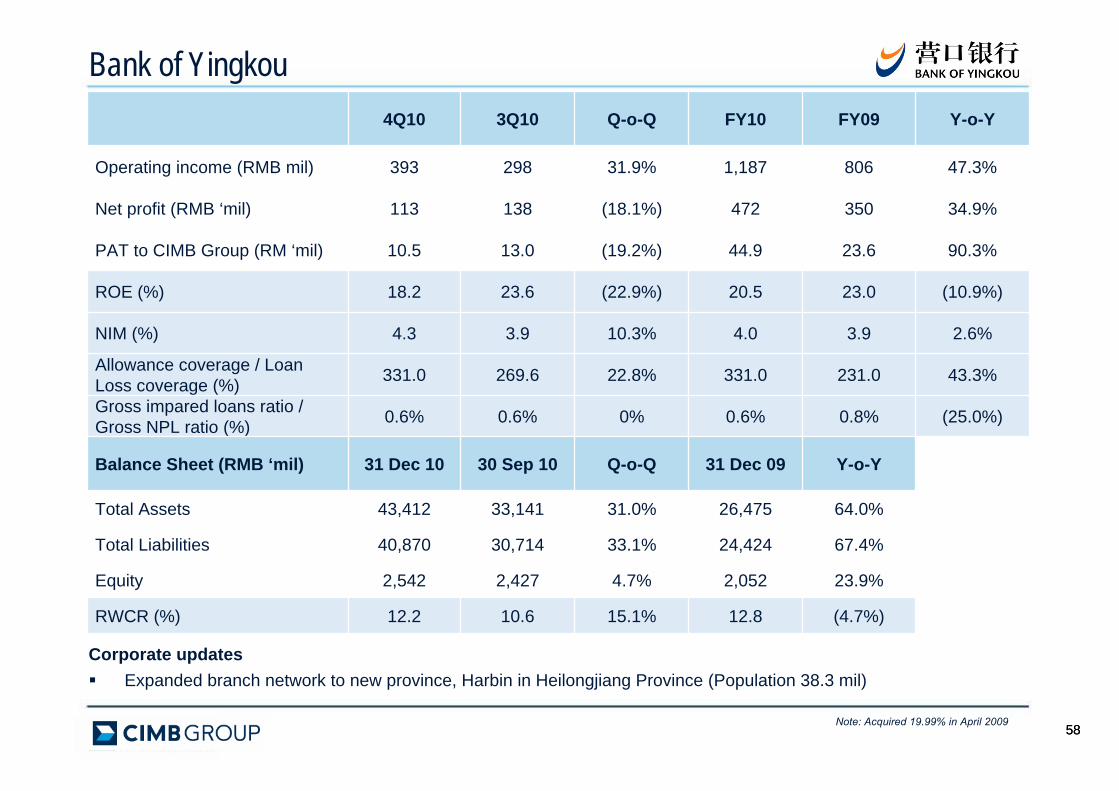
Bank of Yingkou4Q10 3Q10 Q-o-Q FY10 FY09 Y-o-Y
Operating income (RMB mil) 393 298 31.9% 1,187 806 47.3%
Net profit (RMB ‘mil) 113 138 (18.1%) 472 350 34.9%
PAT to CIMB Group (RM ‘mil) 10.5 13.0 (19.2%) 44.9 23.6 90.3%
ROE (%) 18.2 23.6 (22.9%) 20.5 23.0 (10.9%)
NIM (%) 4.3 3.9 10.3% 4.0 3.9 2.6%
Allowance coverage / Loan Loss coverage (%) 331.0 269.6 22.8% 331.0 231.0 43.3%
Gross impared loans ratio / Gross NPL ratio (%) 0.6% 0.6% 0% 0.6% 0.8% (25.0%)
Balance Sheet (RMB ‘mil) 31 Dec 10 30 Sep 10 Q-o-Q 31 Dec 09 Y-o-Y
Total Assets 43,412 33,141 31.0% 26,475 64.0%
Total Liabilities 40,870 30,714 33.1% 24,424 67.4%
Equity 2,542 2,427 4.7% 2,052 23.9%
RWCR (%) 12.2 10.6 15.1% 12.8 (4.7%)
Corporate updatesExpanded branch network to new province, Harbin in Heilongjiang Province (Population 38.3 mil)
Note: Acquired 19.99% in April 2009
5959
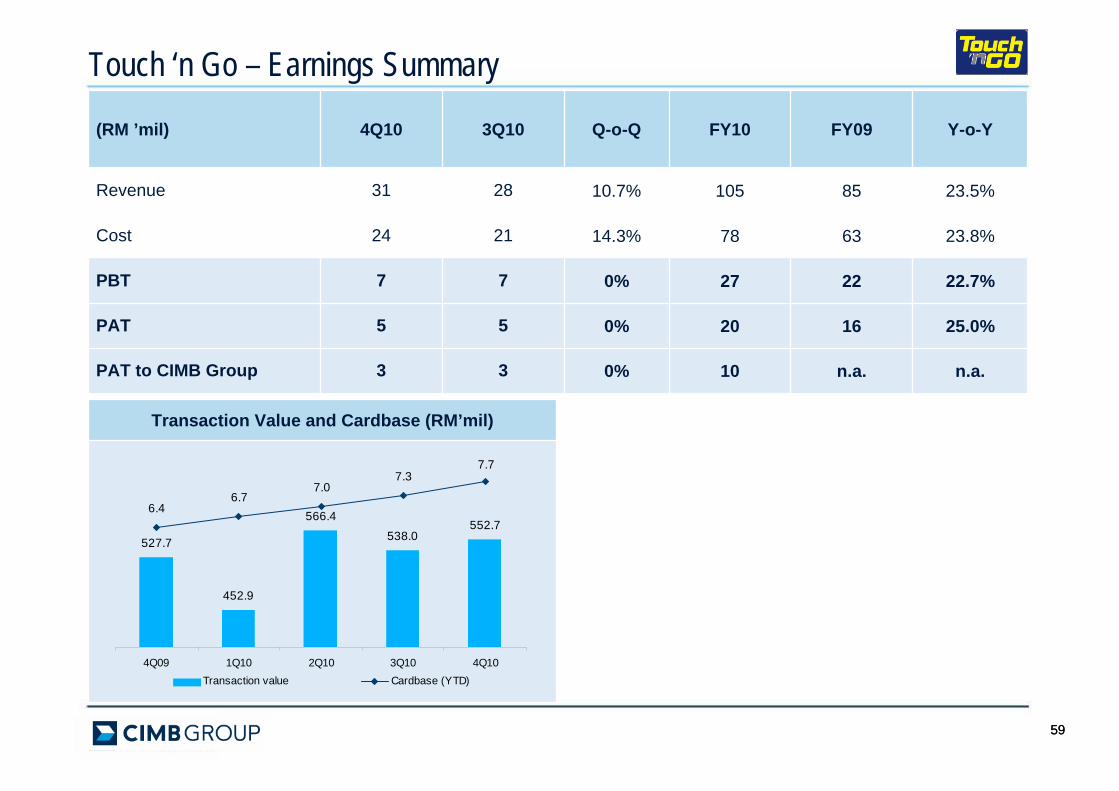
Touch ‘n Go – Earnings Summary
(RM ’mil) 4Q10 3Q10 Q-o-Q FY10 FY09 Y-o-Y
Revenue 31 28 10.7% 105 85 23.5%
Cost 24 21 14.3% 78 63 23.8%
PBT 7 7 0% 27 22 22.7%
PAT 5 5 0% 20 16 25.0%
PAT to CIMB Group 3 3 0% 10 n.a. n.a.
Transaction Value and Cardbase (RM’mil)
527.7
452.9
566.4
538.0552.7
6.46.7
7.0
7.77.3
4Q09 1Q10 2Q10 3Q10 4Q10Transaction value Cardbase (YTD)
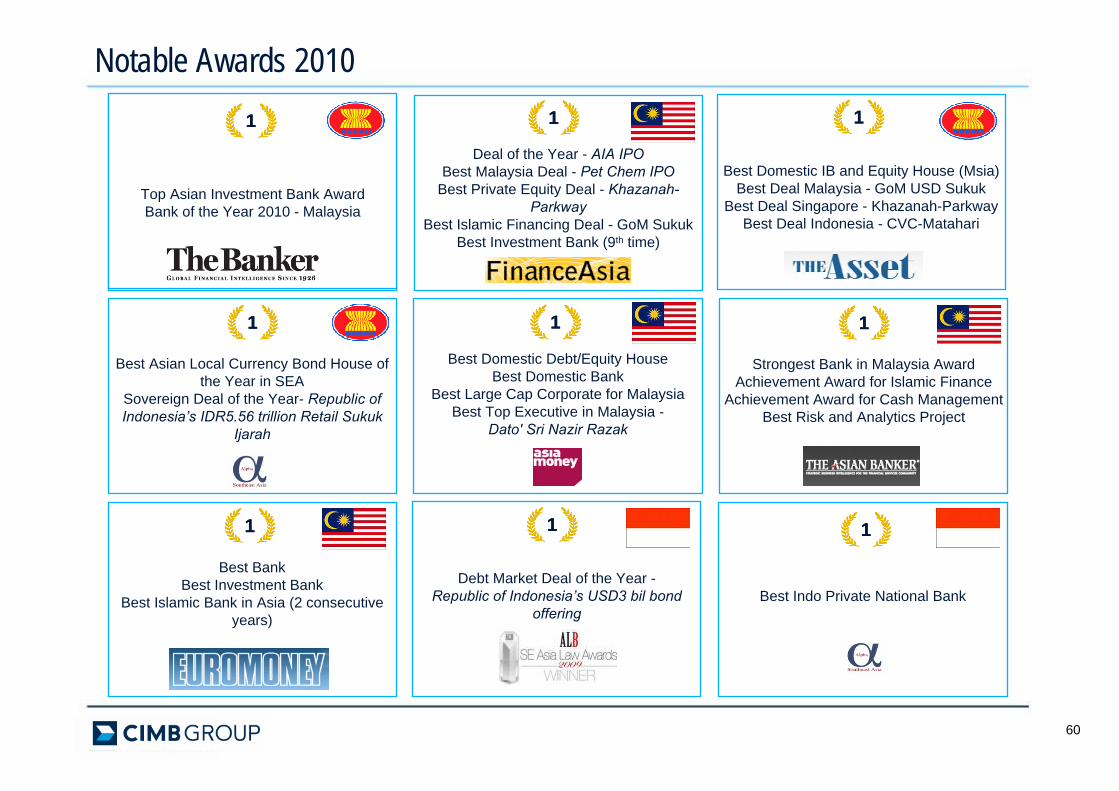
Best Bank Best Investment Bank
Best Islamic Bank in Asia (2 consecutive years)
11
Strongest Bank in Malaysia AwardAchievement Award for Islamic Finance
Achievement Award for Cash ManagementBest Risk and Analytics Project
11
Deal of the Year - AIA IPOBest Malaysia Deal - Pet Chem IPO
Best Private Equity Deal - Khazanah-Parkway
Best Islamic Financing Deal - GoM SukukBest Investment Bank (9th time)
11
Best Asian Local Currency Bond House of the Year in SEA
Sovereign Deal of the Year- Republic of Indonesia’s IDR5.56 trillion Retail Sukuk
Ijarah
11
Debt Market Deal of the Year -Republic of Indonesia’s USD3 bil bond
offering
11
60
Top Asian Investment Bank AwardBank of the Year 2010 - Malaysia
Best Bank Best Investment Bank
Best Islamic Bank in Asia (2 consecutive years)
11
11
Notable Awards 2010
Best Indo Private National Bank
11
Best Domestic IB and Equity House (Msia) Best Deal Malaysia - GoM USD Sukuk
Best Deal Singapore - Khazanah-ParkwayBest Deal Indonesia - CVC-Matahari
11
Best Domestic Debt/Equity HouseBest Domestic Bank
Best Large Cap Corporate for MalaysiaBest Top Executive in Malaysia -
Dato' Sri Nazir Razak
11
CIMB GROUP: 4Q10 RESULTSCLOSING REMARKS
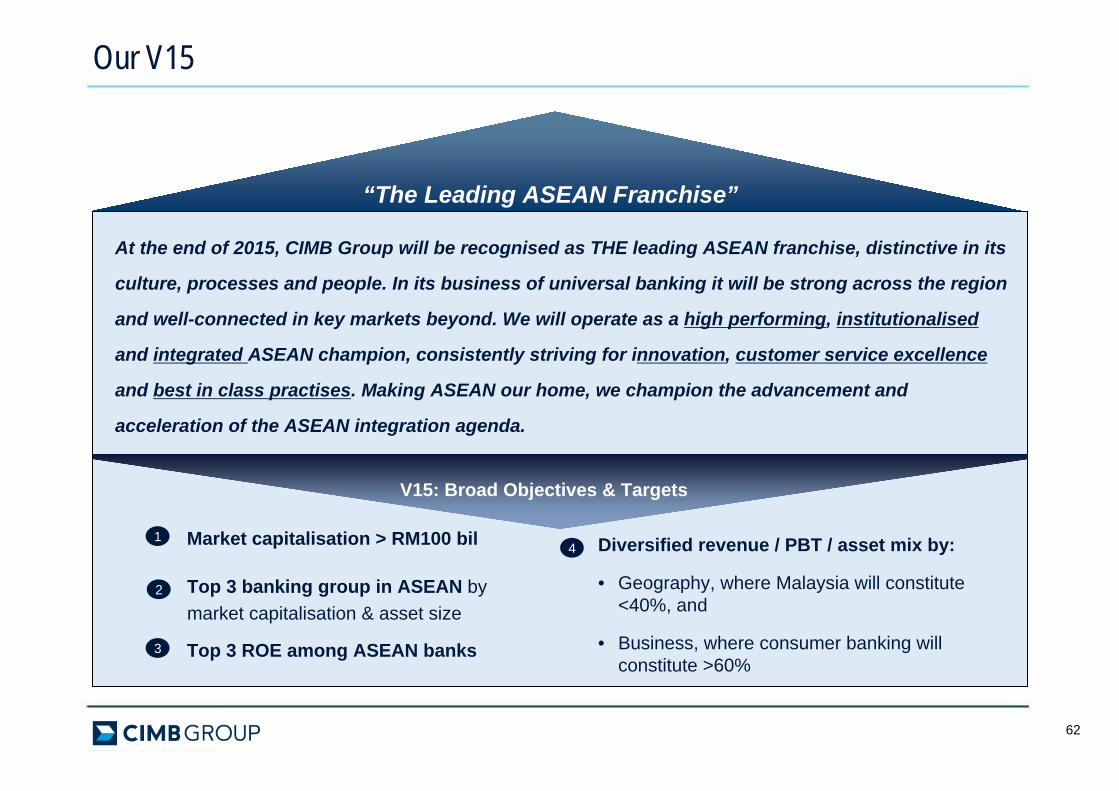
“The Leading ASEAN Franchise”
V15: Broad Objectives & Targets
Top 3 banking group in ASEAN by market capitalisation & asset size
2
3
At the end of 2015, CIMB Group will be recognised as THE leading ASEAN franchise, distinctive in its
culture, processes and people. In its business of universal banking it will be strong across the region
and well-connected in key markets beyond. We will operate as a high performing, institutionalised
and integrated ASEAN champion, consistently striving for innovation, customer service excellence
and best in class practises. Making ASEAN our home, we champion the advancement and
acceleration of the ASEAN integration agenda.
Top 3 ROE among ASEAN banks
4 Diversified revenue / PBT / asset mix by:
• Geography, where Malaysia will constitute <40%, and
• Business, where consumer banking will constitute >60%
Our V15
62
1 Market capitalisation > RM100 bil
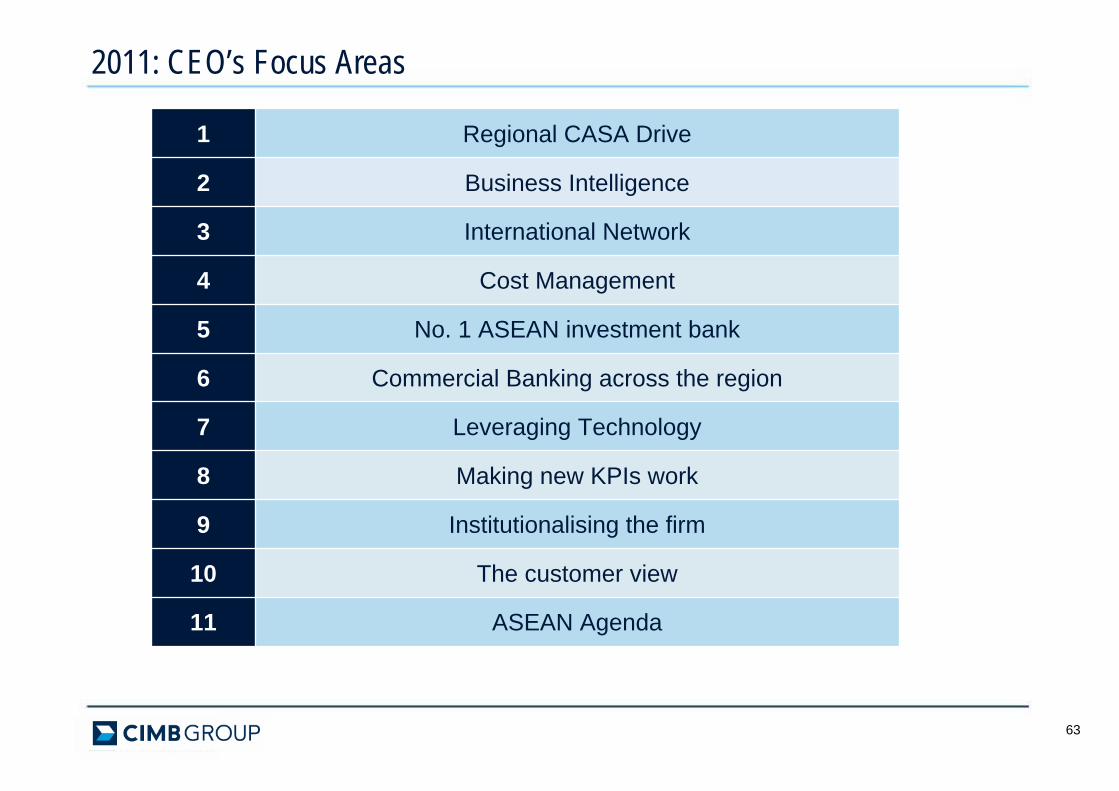
1 Regional CASA Drive
2 Business Intelligence
3 International Network
4 Cost Management
5 No. 1 ASEAN investment bank
6 Commercial Banking across the region
7 Leveraging Technology
8 Making new KPIs work
9 Institutionalising the firm
10 The customer view
11 ASEAN Agenda
63
2011: CEO’s Focus Areas
64
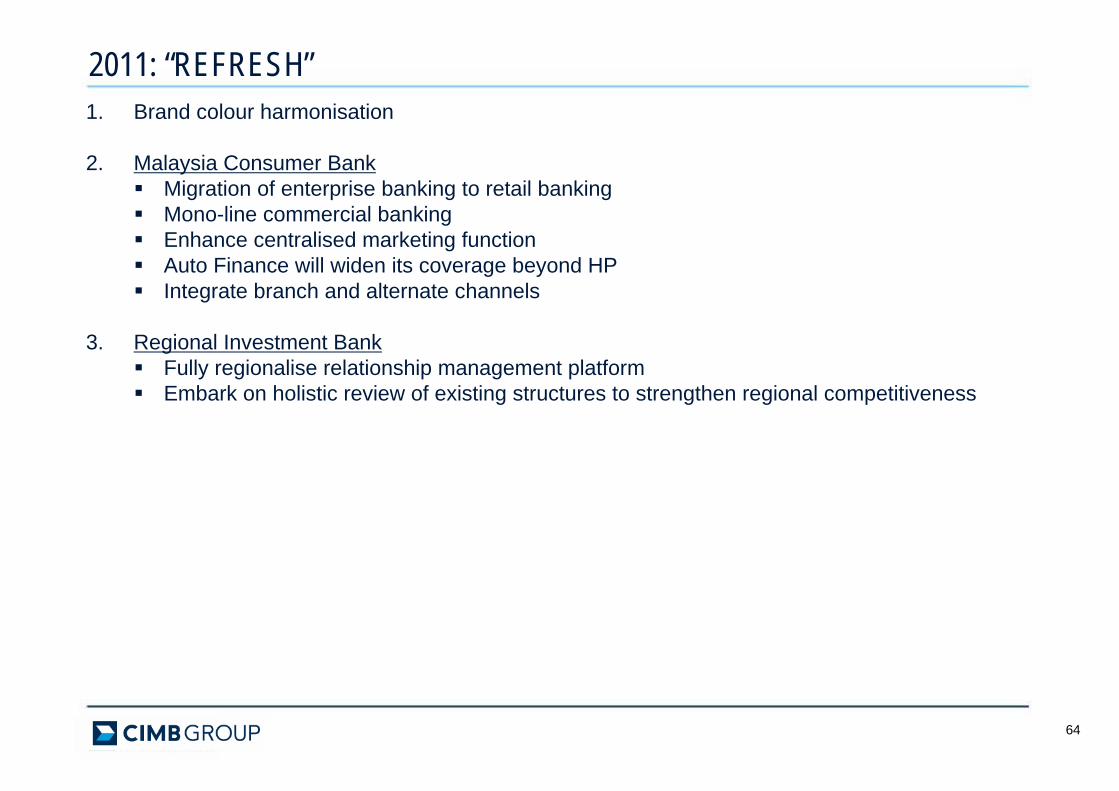
1. Brand colour harmonisation
2. Malaysia Consumer BankMigration of enterprise banking to retail bankingMono-line commercial bankingEnhance centralised marketing functionAuto Finance will widen its coverage beyond HPIntegrate branch and alternate channels
3. Regional Investment BankFully regionalise relationship management platformEmbark on holistic review of existing structures to strengthen regional competitiveness
2011: “REFRESH”
65
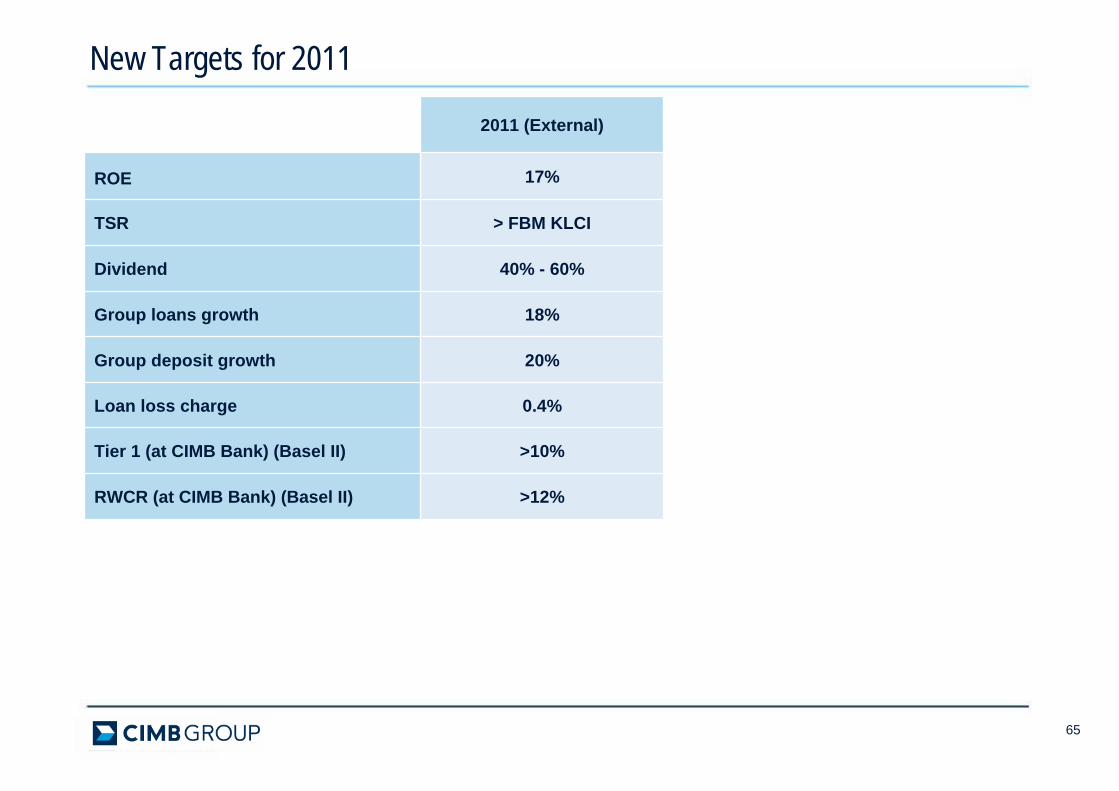
New Targets for 2011
2011 (External)
ROE 17%
TSR > FBM KLCI
Dividend 40% - 60%
Group loans growth 18%
Group deposit growth 20%
Loan loss charge 0.4%
Tier 1 (at CIMB Bank) (Basel II) >10%
RWCR (at CIMB Bank) (Basel II) >12%
6666
Overall 2010 was an excellent year
Operating environment for 2011 will be more challenging with spectre of intense competition, rising interest rates and volatile markets
Nevertheless, ASEAN’s economic fundamentals remain robust. We expect the ETP to derive opportunities in Malaysia while Indonesian banking remains at a high growth trajectory. Cross border ASEAN trade and investment flows will also continue to grow rapidly
Our treasury and IB momentum is strong. CIMB Niaga’s new initiatives post-merger are coming through while CIMB Thai and CIMB Singapore are on high growth paths. Our Malaysian Consumer Bank will ride on a “refreshed” business model to enhance competitiveness
Final Remarks

67
THANK YOU