cimss science review
TRANSCRIPT

CIMSS Science Review
Presented by Steve Ackerman

CIMSS Mission• Foster collaborative research among NOAA, NASA,
and the University in those aspects of atmospheric and earth system science which exploit the use of satellite technology.
• Serve as a center at which scientists and engineers working on problems of mutual interest may focus on satellite related research in atmospheric studies and earth system science.
• Stimulate the training of scientists and engineers in the disciplines involved in the atmospheric and earth sciences.

Measures of Success
•MODIS Algorithms
•ITOVS, IMAPP algorithms
•AODT to TPC
•Community RT Model

Measures of SuccessCIMSS Publishing, 1995-2005
020406080
100120140160180
1995 1996 1997 1998 1999 2000 2001 2002 2003 2004 2005
Peer-Reviewed Pubs.Conference Pubs.Total P-R & Conf. Pubs.Other Pubs.Total Pubs.
•Workshops
•International visitors

Measures of Success
•VISITView
•Undergraduates
•Education workshops

Winds Program

GOESGOES--10 Rapid Scan Visible Cloud10 Rapid Scan Visible Cloud--Drift Drift Winds During PACJET 2001Winds During PACJET 2001
January 28, 2001 23ZJanuary 28, 2001 23Z
Special GOESSpecial GOES--10 schedule coordinated to 10 schedule coordinated to provide an hourly rapid scan image tripletprovide an hourly rapid scan image triplet
Successfully supported PACJET experimentSuccessfully supported PACJET experiment
Successfully demonstrated capability to Successfully demonstrated capability to generate hourly generate hourly satwindsatwind datasets for realdatasets for real--time NWS forecaster use and for time NWS forecaster use and for mesoscale mesoscale NWPNWP

MODIS (left) vs. AIRS (right) Radiance-tracked Winds
A test was performed to track AIRS radiance features from a WV channels for one case on 7 April 2004. The AIRS channel chosen was close to the 6.7 µm MODIS band used for real-time polar winds processing. The reduction in the number of vectors is similar to the spatial resolution factor between MODIS and AIRS.

NWP Sites where MODIS winds are used in the operational model.
NWP Site Operational Begin Date ECMWF
European Centre for Medium-Range Weather Forecasts January 2003
GMAO Global Modeling and Assimilation Office
2003
JMA Japan Meteorological Agency
May 2004
CMC Canadian Meteorological Centre
September 2004
FNMOC US Navy, Fleet Numerical Meteorology and
Oceanography Center
October 2004
Met Office United Kingdom
January 2005
NCEP Planned Summer 2005

Hyperspectral Altitude Resolved Water Vapor Wind Retrieval and Validation
Simulated GIFTS winds (left) versus GOES operational winds (right)
GIFTS - IHOP simulation 1830z 12 June 02 GOES-8 winds 1655z 12 June 02

AIRS Retrieval Moisture Fields
500mb 700mb 850mb
Specific humidity fields from SFOV AIRS retrievals

AIRS Moisture Retrieval Targets and winds (unedited) at 400 hPa
The moisture features are tracked in an area that is inscribed by 3 successive, overlapping passes in the polar region. See below.

CIMSS/SSEC road to the Hyperspectral Sounders
CIMSS/SSEC has played a significant roles in the past, current, and future Hyperspectral Sounders
(labeled in green)
VAS (12; GEO; O)
GOES Sounder (18; GEO; O)
GIFTS (~1600; GEO; E)HES (~1600; GEO; O)
Time
(# of spectral bands)O: Operational
E: ExperimentalVTPR, HIRS (18; LEO; O)
CrIS (~2215; LEO; O)IASI (~8000; LEO; O)
AIRS (~2200; LEO; E)
HIS (4492; Airborne)
IRIS (862; LEO; E)
IMG (18400; LEO; E)NAST-I (8220; Airborne)
S-HIS (4840; Airborne)
1978 2012

Montage of GOES-9, -10 and -12 Sounder data, showing 7.0µm imagery (top panel), 13.7µm imagery (middle), and Total Precipitable Water (TPW) Derived Product Imagery (DPI, bottom), from 23UTC on 13 June 2005.
7 um
13.7 um
TPW

Distributing Products
Providing access at CIMSS to real-time data in the National Weather Service (NWS) Advanced Weather Interactive Processing System (AWIPS) for monitoring and training of NESDIS satellite products, such as the GOES Sounder Derived Product Imagery (DPI)
The same Lifted Index (stability) GOES DPI
Four sources of DPI:
Current 5x5 @ Ops
Exp SFOV @ CIMSS
Exp SFOV @ FPDT
Exp SFOV @ Ops
Captured from AWIPS workstation at CIMSS

Textbox for Figure Description
Advanced Satellite Aviation-weather Products (ASAP) Satellite Derived Fields
Turbulence
VolcanicAsh
Cloud Top Altitude/Mask
Validation Mt St Helens AVHRR Ash Cloud Height Estimate
Convection

Hyperspectral Atmospheric Sounding Profile Retrieval and Validation
Simulation
AIRS Std. Operational Product
CIMSS
Validation

MURI Provided Opportunity to Produce Realistic NWP simulations for Hyperspectral Research
MM5 WRF
• WRF has much finer horizontal resolution than the MM5
• WRF effective resolution is ~7*∆x
• MM5 effective resolution is ~10*∆x
2.5 km Water Vapor Mixing Ratio
Liquid Cloud Water
New computer has provided resource to produce high resolution NWP simulation datasets for future look at GIFTS/HES capabilities

Toward Passive Microwave Radiance Assimilation of Clouds and Precipitation

Toward Model Validation

Several AERI systems deployed around the world providing absolutely calibrated downwelling radiance and thermodynamic retrievals for several years (>10-years at Lamont Oklahoma

AIRS v4 Retrieval Performance Assessment
TWP SGP
Validation of AIRS retrieval against ARM site best estimates of temperature and moisture profiles.(Dashed=bias, Solid= RMS)

GOES-R East local zenith angle (left). There are two possible GOES-R designs: ABI and HES are on the same GOES-R satellite, or ABI and HES are separately on the two GOES-R satellites. The two-satellite design for ABI and HES has impact on ABI/HES synergy. Right panel show the ABI 11 µm BT difference under clear skies between the two designs when the two GOES-R East satellites for ABI and HES are apart away with distance of 2.5 degree longitude.
Degree BT(K)

The GOES-12 Sounder band 1 (14.7 µm) and band 9 (9.7 µm) images before spatial filtering (left panels), images after spatial filtering (middle panels), and the difference images (right panel).
Band 1: 14.7 µm
Before filter After filter Difference
Before filter After filter Difference
Band 9: 9.7 µm

Comparison of Total Precipitable Water:Terra MOD07 (red dots), GOES-8 and -12 (blue diamonds), and radiosonde(black X) TPW is compared to the ground-based ARM SGP microwave water
radiometer for 124 clear sky cases April 2001 to September 2003.
MO
DIS
, GO
ES
, Rad
ioso
nde
TPW
(mm
)
MODIS: bias= 0.32mm, rms= 2.53mm
Microwave Radiometer TPW (mm)
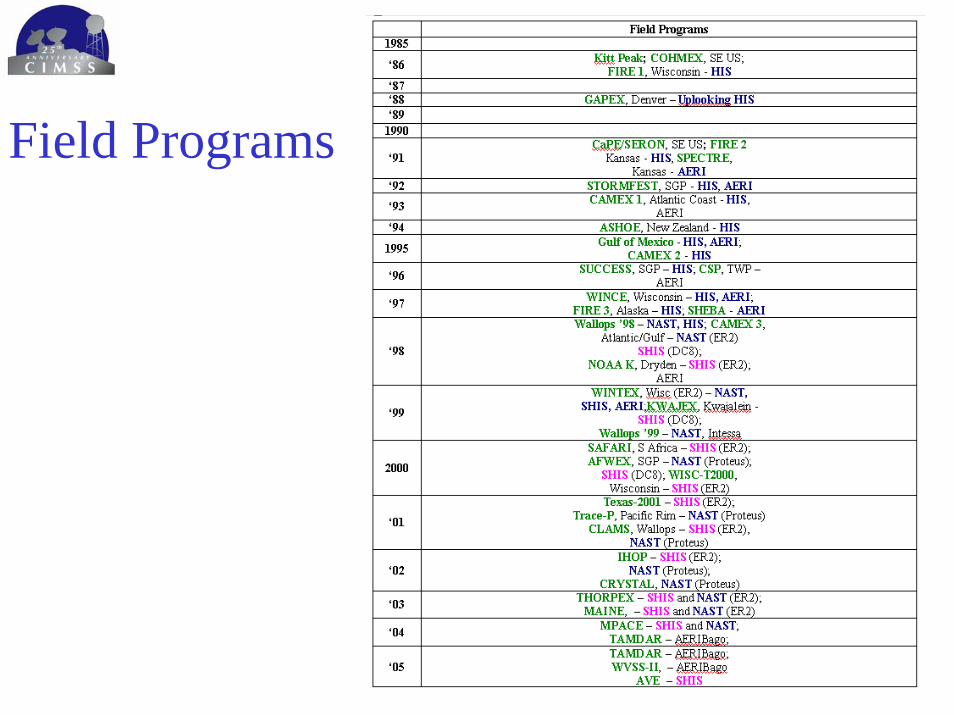
Field Programs

TAMDAR AERIBAGO Validation Experiment22 February - 08 March 2005, 16 May – 27 May 2005, Memphis, TN
TAMDAR temperature, moisture, and wind sensors are mounted on 64 MESABA Saab 340 aircraft. Comparisons are being made with radiosondes to validate these data.
Dashed=descending, solid=ascending

The Lake Tahoe 2004 field activity evaluated Terra MODIS radiometric performance.
April 9, 20040544 UTC
MODIS Band Number
MA
S_SH
IS -
MO
DIS
(K) MODIS
Vertical bars represent radiometric accuracy spec.
Buoy Sites
MAS_SHIS Simulated MODIS BT (K)
MO
DIS
Obs
erve
d B
T (K
)
Wavelength (um)
Pred
icte
d –
Mea
sure
d B
right
ness
Tem
pera
ture
(K)
SHIS
SHIS April 9, 2004 - Night Run 09
-5
-4
-3
-2
-1
0
1
2
3
4
5
8 9 10 11 12 13
Pred
icte
d M
easu
red
BT
(K)
tr1tr2tr3tr4average SHIS

Intercalibrating GEOs with High Spectral Resolution AIRS
Geo: GOES-9 GOES-10 GOES-12 MET-7 MET-5 N 14 16 15 14 16 ∆Tbb (K) -0.63 -0.10 -0.13 -0.87 -1.93 STD (K) 1.04 0.35 0.55 0.38 .55
Table 1. 11µm band results. ∆Tbb (GEO minus AIRS) is the mean of N cases. Geo: GOES-9 GOES-10 GOES-12 MET-7 MET-5 N 14 16 15 6 16 ∆Tbb (K) -1.31 -1.35 -9.94 -7.24 -9.26 STD (K) 0.39 0.18 0.49 0.54 2.42
Table 2. 6 µm band results. ∆Tbb (GEO minus AIRS) is the mean of N cases. Geo: GOES-9 GOES-10 N 14 16 ∆Tbb (K) -0.50 0.32 STD(K) 1.03 0.32
Table 3. 12 µm band results. ∆Tbb (GEO minus AIRS) is the mean of N cases. Geo: GOES-9 GOES-10 GOES-12 N 8 16 14 N (Day) 7 11 8 N (Night) 1 5 6 ∆Tbb (K) -0.97 -0.06 -0.62 ∆Tbb (K) (Day) -1.16 -0.25 -1.13 ∆Tbb (K) (Night) 0.35 0.37 0.07 STD (K) 0.95 0.42 0.74 STD (K) (Day) 0.85 0.35 0.51 STD (K) (Night) NA 0.17 0.29
Table 4. 3.9 µm band results. ∆Tbb (GEO minus AIRS) is the mean of N cases. Day and night are determined by local sunrise and sunset times.

AIRS-MODIS for Band 35 (13.9 µm) with nominal MODIS SRF and shifted SRF
UnshiftedShifted
UnshiftedShifted

Evaluations
Detector Performance (Linearity, NEDT, Stability, Striping)
Before Correction After Correction
Brig
htne
ss T
empe
ratu
re (K
)
Cross Track Frame Number
BOS EOS
Band 36 (14.2 um)
Optics Performance(mirror striping, RVS)
Spectral Calibration
L1B Radiometric Validation
Before Correction After Correction
Crosstalk Assessment

Tropical CycloneThe TC program at CIMSS is a good example of how a successful research program can evolve, maintaining a vigorous research program. A chronology of CIMSS research on tropical cyclone, including student
involvement.

Validation of UWValidation of UW--CIMSS ADT (fullyCIMSS ADT (fully--automated) andautomated) andOperational Center Dvorak Technique Operational Center Dvorak Technique
vs. Aircraft Reconnaissance MSLP (hPa)vs. Aircraft Reconnaissance MSLP (hPa)
Development sample: 1995Development sample: 1995––2003 Atlantic Seasons 2003 Atlantic Seasons –– 56 Total Storms56 Total Storms
BiasBias RMSERMSE Abs ErrorAbs Error SampleSampleAODTAODT--v6.4v6.4 --0.380.38 9.639.63 7.547.54 34343434Op CenterOp Center 0.730.73 9.789.78 7.7267.726 34343434
Op Center = Ave. of 3 Agency DT values

Airc
raft
Mea
sure
d R
MW
(km
)
RMW versus Eye-size as determined byInfrared Imagery
R2=0.60
RMSE = 6.16 km
Average IR- Calculated Eye Size (km)
MSLP (hPa)
Using new IR-derived
RMW
Using standard operational RMW
Bias -0.5 5.1
Absolute Error 6.8 8.3
RMSE 8.7 10.6
N 50 50
UW/CIMSS-AMSU Tropical Cyclone Intensity estimates using IR-derived RMWs perform better than previous estimates that use standard operational RMWs on independent cases verified against Atlantic recon.

Accounting for scattering
Comparison of CIMSS TC intensity algorithm performance before and after precipitation correction.

Self-Organization of Mesovortices as a Mechanism for Tropical Cyclogenesis
A statistical mechanics approach is taken to predict the structure of a nascent tropical cyclone from knowledge of large-scale flow invariants. The upshot to this is that we can better predict whether an incipient vortex has a good chance of intensifying to become a tropical storm.
Two very different outcomes of vortex merger from two very similar Cu-clusters. The MCVs in the cumuli have the same circulation but different energies because they are configured differently.
Cluster A (top panel) has a better chance of intensifying into a tropical storm.

Biomass Burning ABBA Results
GOES-8 1995-2002:
Fires pixels vs. Julian Day
1145UTC2045 UTC

An example of a possible future WFABBA realtime application: Seabreezeenhanced fire in Florida:On 5 April 2004 a wildfire south of Tallahassee, FL suddenly flared in response to a seabreeze front. The fire appeared on GOES WF_ABBA imagery approximately 30 minutes prior to the plume enhancement as seen by the Tallahassee NWS radar. The seabreeze is also visible on the radar loop. Imagery of this type could be generated for regions of interest on a realtime basis.

Fire Monitoring in Southeast Asia (GOES-9) and Africa (MSG)
Animation of GOES-9 3.9 micron imageryDate: 19- Mar-2004Times: 0325 - 0725 UTC
Animation of MSG 3.9 micron imageryDate: 30- Jul-2004Times: 1030 - 1215 UTC
Satellite view angle: 70º
-

GOES-R and GOES I/M Simulations of Southern California Fires
GOESGOES--R Simulated 3.9 micron DataR Simulated 3.9 micron DataPadua/Grand Prix FiresPadua/Grand Prix FiresDate: 27Date: 27--OctOct--03 Time: 09:50 UTC03 Time: 09:50 UTC
GOESGOES--12 Simulated 3.9 micron Data12 Simulated 3.9 micron DataPadua/Grand Prix FiresPadua/Grand Prix FiresDate: 27Date: 27--OctOct--03 Time: 09:50 UTC03 Time: 09:50 UTC
Brightness Temperature (K)Brightness Temperature (K)
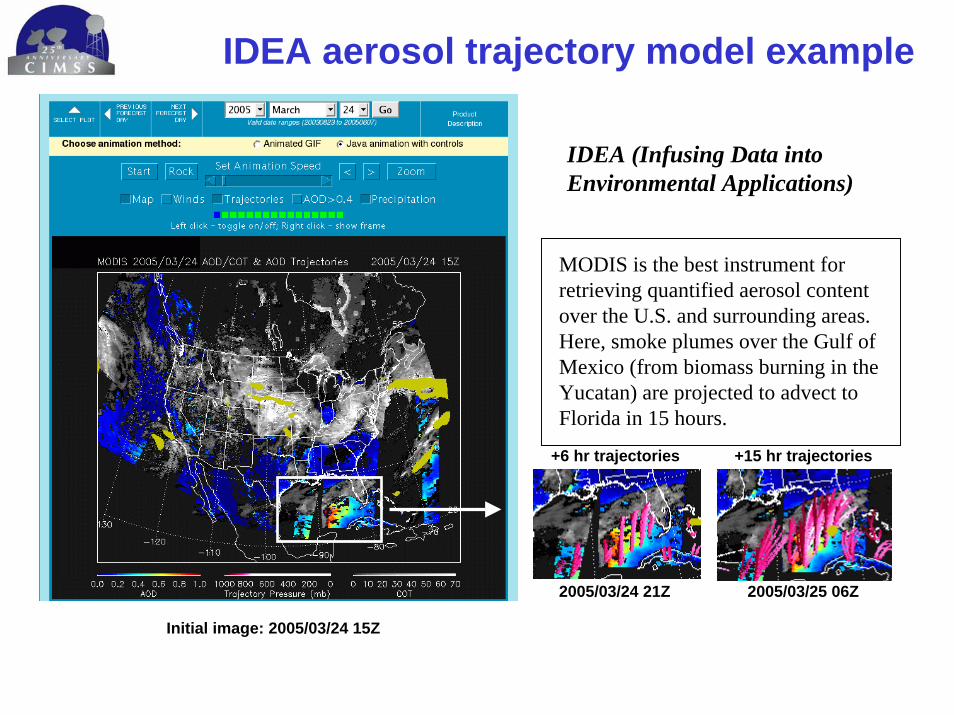
IDEA aerosol trajectory model example
IDEA (Infusing Data into Environmental Applications)
MODIS is the best instrument for retrieving quantified aerosol content over the U.S. and surrounding areas. Here, smoke plumes over the Gulf of Mexico (from biomass burning in the Yucatan) are projected to advect to Florida in 15 hours.
2005/03/24 21Z 2005/03/25 06Z
+6 hr trajectories +15 hr trajectories
Initial image: 2005/03/24 15Z

Aerosols from AVHRR
Example analysis of AVHRR climate records
PATMOS-x provides more data than cloud products. Below is an analysis of a 20 year record of Saharan Dust from AVHRR. CIMSS developed the algorithm and performed the analysis (Amato Evan).
Mean Dust Fraction from PATMOS-x
Correlation with SAHEL NDVI

True color Aqua-MODIS images capturing an eruption of Manam, PNG on October 24, 2004, 0355 UTC.
•New multi-spectral algorithm is much more effective than the standard reverse absorption technique at identifying ash plume.
•The new technique also provides information on the location of ice clouds that are contaminated with volcanic aerosols.
New algorithm
Standard reverse absorption technique
Credit: David Innes
Volcanic Aerosols
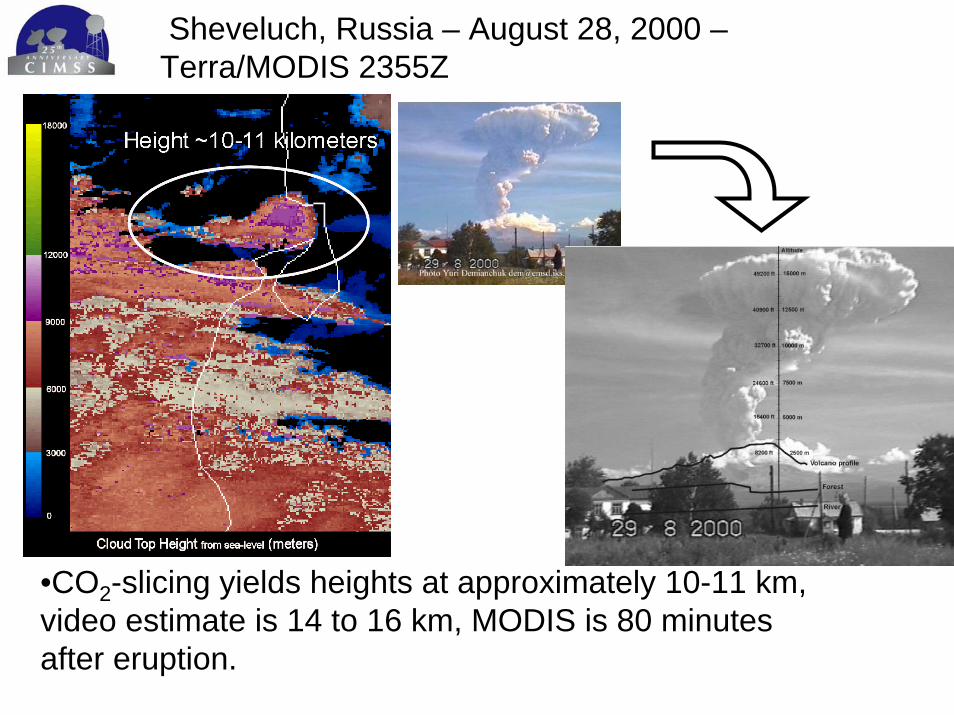
Sheveluch, Russia – August 28, 2000 –Terra/MODIS 2355Z
•CO2-slicing yields heights at approximately 10-11 km, video estimate is 14 to 16 km, MODIS is 80 minutes after eruption.

Clouds at CIMSS

Clouds from HIRSFrequency of Clouds in the Tropics (20 South - 20 North)
Land and Water Combined
0.00
0.10
0.20
0.30
0.40
0.50
0.60
0.70
0.80
0.90
Jul-78 Jul-80 Jul-82 Jul-84 Jul-86 Jul-88 Jul-90 Jul-92 Jul-94 Jul-96 Jul-98 Jul-00 Jul-02
Freq
uenc
y of
Cloud
s
NOAA 5 - 2 pm/am NOAA 7 - 2 pm/am NOAA 9 - 2 pm/am NOAA 11 - 2 pm/amNOAA 14 - 2 pm/am NOAA 16 - 2 pm/am NOAA 6 - 8 pm/am NOAA 8 - 8 pm/amNOAA 10 - 8 pm/am NOAA 12 - 8 pm/am NOAA 15 - 8 pm/am
N11 N14
N11 and N14 show gradual increase of cloud detection
in tropics in part due to orbit drift from 14 to 18 LST

Diurnal Change of Effective Cloud Amount over Central Plains for High Clouds Only
Winter 1998/99 (#obs. 7,305) Spring 1999 (#obs. 8,420)
Summer 1999 (#obs. 18,526) Fall 1999 (#obs. 4,658)
Time (LST)Time (LST)
Freq
uenc
y of
Occ
urre
nce
Thin (0<ECA<50)Thick (50<ECA≤95)Opaque (95<ECA≤100)
Freq
uenc
y of
Occ
urre
nce
•Central Plains includes 31N to 45N and 92W to 107W.•High Cloud is defined as layer from 300 to 100 hPa
010203040506070
1:30 4:30 7:30 10:30 13:30 16:30 19:30 22:300
10203040506070
1:30 4:30 7:30 10:30 13:30 16:30 19:30 22:30
010203040506070
1:30 4:30 7:30 10:30 13:30 16:30 19:30 22:300
10203040506070
1:30 4:30 7:30 10:30 13:30 16:30 19:30 22:30

Improved Cloud Heights from GOES
IR LW window BT CTP from MR (ch. 7-8) CTP from CO2 – slicing (Imager)
GOES-12 Sounder 4 August 2004 1446UTC
CTP from CO2-slicing(Sounder)
CTP from MR (ch. 3-6)(Sounder) Sounder VIS image
(combination)The IR LW window BT and CTP from GOES-12 Sounder with CO2-slicing (left panel), CTP from minimum residual (MR, Li et al. 2004, JAM) (middle panels), CTP from Imager and the visible image (right panels) at 14:46 UTC on 4 August 2004. Combination of CO2-slicing (for middle and high level clouds) and MR (for low clouds) will improve the cloud-top pressure product. Currently, single band IR window technique is applied for low clouds.

Cloud Detection
Terra and AquaEast African Scene from July 11, 2002
Terra at 08:05 UTC, Aqua from 11:00 UTC
MODIS Band 2Terra (left) and Aqua (right)
MODIS Cloud MaskTerra (left) and Aqua (right)
Colors: green is confident clearcyan is probably clearred is uncertainwhite is cloudy

Terra and Aqua
East African Scene from July 11, 2002Terra at 08:05 UTC, Aqua from 11:00 UTC
MODIS Band 26Terra (left) and Aqua (right)
MODIS Cloud Top Pressure (mb)Terra (left) and Aqua (right)
Colors: red ≤ 100 aqua 400-500 white 100-200 tan 500-700cyan 200-300 brown 700-850blue 300-400 orange 850-1000gray is clear

Recent Trends in the ArcticRecent Trends in the Arctic
Results show that the Arctic has warmed and become more cloudy in spring and summer, but has cooled and become less cloudy in winter.

Towards Understanding Difference in Cloud Climatologies.
This comparison shows the yearly variation in the mean July High Cloud Amount in the Tropics.
• AQUA and PATMOS-x agree in magnitude.
•ISCCP-D2 daily value suffers from poor night-time performance.
•HIRS shows a slight positive trend while PATMOS-x shows no trend and ISCCP-D2 shows a very small negative trend.

What is a cloud?C
O2
–Li
dar (
km)

Optical Depth Thresholds for Detection of GLI/MODIS (MAS)
To estimate cloud optical detection limits cloud mask results from the MODIS and GLI were compared to ground based observations from the High-Spectral Resolution Lidar (HSRL), which measures visible optical depth. Comparisons were also made using the ER-2 borne cloud physics lidar and collocated observations of the MODIS Airborne Simulator (MAS).
The number of occurrences that MAS scene was identified as clear and the cloud physics lidar detected a cloud optical depths (visible wavelengths). This figure suggests that the cloud limit is less then approximately 0.3, consistent with comparison with HSRL

Clear
Prop clear
Uncertain
Cloud
GLI and MODIS observations were compared to the HSRL site over the University of Wisconsin-Madison. The HSRL directly measures cloud optical depth at visible wavelengths.Initial results indicate that when the MODIS or GLI flag a cloudy region as Uncertain Clear, the optical depth is less then approximately 0.3.
Optical Depth Thresholds for Detection of GLI/MODIS (MAS)

More Passive and Active SensingThe GLAS cloud amount (for regions dominated by high cloud) is shown below as a function of optical depth filtering, in that the GLAS cloud amount at a given point on the curve was calculated using only observations with a total column optical depth greater than or equal to the value given on the x-axis. The AVHRR (CLAVR-x), the “VIIRS-like” MODIS (MOD35), and HIRS (Wylie and Menzel) intersects are shown on the plot and "OD" stands for optical depth. A month of data were used.
The greater the spectral resolution, the greater the sensitivity to thin clouds.

What cloud properties need to be measured?
microwave -precipitation
microwave - LWP
Infrared – thin IWP
Submm – IWP

Submm IR Ice Cloud ExperimentProvide global measurements of ice water path (IWP-defined as the vertically integrated mass of ice particles per unit area) and median mass particle diameter (Dme).
These measurements will have the temporal and spatial sampling required to resolve ice processes in cloud systems and yield accurate regional averages of needed cloud properties.
Characterize IWP and Dme distributions as a function of meteorological process, thus quantifying the contribution of upper tropospheric ice production by convection and synoptic lifting.
Application of measurements to cloud system modeling research will improve our understanding of ice cloud processes needed for improved climate predictions.
Demonstrate new measurement capability by providing a unique data set of sub-mm wave radiances.
Earth scanning observations over this wavelength range and directly tied to ice cloud water mass and particle size are not available from any satellite platform.

InfraRed Cloud Ice Radiometer (IRCIR)(for a proposed SIRICE ESSP Mission)
Science• IR Cloud Height• Stereo Cloud Height• Winds (flying in orbit with NPP)
4 Imaging Arrays
RotatableScene Mirror
Cross-trackFields of View
Optics Bench
IRCIR Provides Full Cross-track Coverage using Four 640 x 480 pixel Uncooled Silicon Micro-bolometer Arrays

Outreach and Education
2004 Teacher Workshop in Satellite Meteorology
2004 High School Student Workshop on Atmospheric, Earth & Space Science
Satellite Meteorology CDhttp://cimss.ssec.wisc.edu/satmet
Linked to the NESDIS and NPOESS Web pages!
28 teachers participated in the 2005 Teacher Workshop scheduled for June 28th & 29th

Distance Education: VISITView
Sample page from “Midland TX Heavy
Snow Event” VISITview lesson, showing AWIPS
GOES IR imagery with instructor
annotation

Interactive Teaching
Screenshot of “Feature Sizer” RCO used in Sizing Icebergs lesson

CIMSS Research CommunityResearch communities bring people together for shared learning, discovery, and the generation of knowledge. Within a research community, all participants take responsibility for achieving the goals.
Importantly, research communities are the process by which individuals come together to achieve goals. These goals can be specific to individual projects or can be those that guide the entire institute.
Four core ideas define the research community process:

Research Community1. Shared discovery and learning: Collaborative research activities where participants share responsibility for the learning and research that takes place are important to development of a research community.

Research Community2. Functional connections among researchers: Research communities develop when the interactions among researchers are meaningful, when they are functional and necessary for the accomplishment of the "work“. Moreover, meaningful connections must extend throughout the research community—among students, postdocs, faculty, and staff—rather than simply among cohort- or role-related peers.

Research Community3. Connections to other related research, applications and life experiences: Research communities flourish when implicit and explicit connections are made to experiences and activities beyond the program in which one participates at any given moment. These connections help situate one’s research in a larger context by solidifying one’s place in the broader community, decreasing one’s sense of personal isolation.

Research Community4. Inclusive environment: Research communities succeed when the diverse backgrounds and experiences of participants are welcomed in such a way that they help inform the group’s collective research. Whenever possible, activities should be sought that help participants reach out and connect with others from backgrounds different from their own.

Thank you!…and…

CIMSS the next 25 years

The circle

General Comments
Leadership in research and application of Sat Met
Partnerships
International connections
There was a need
There as a vision to fill the need

Evolution of GEO/LEO –
Research in sounding, clouds, surface

Climate Applications
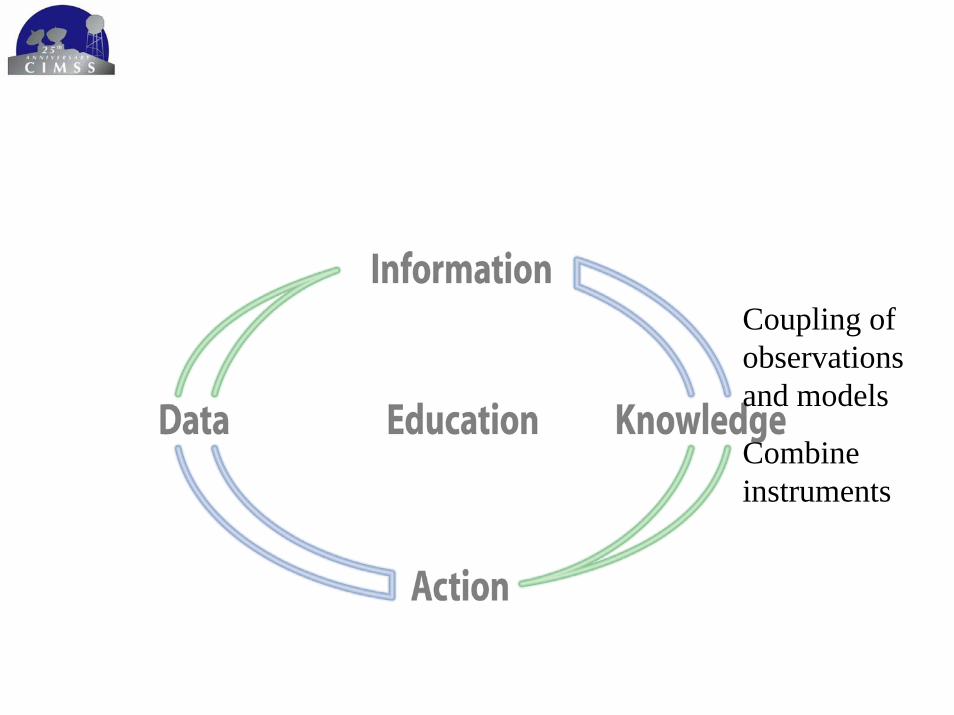
Coupling of observations and models
Combine instruments

How we make decisions is changing
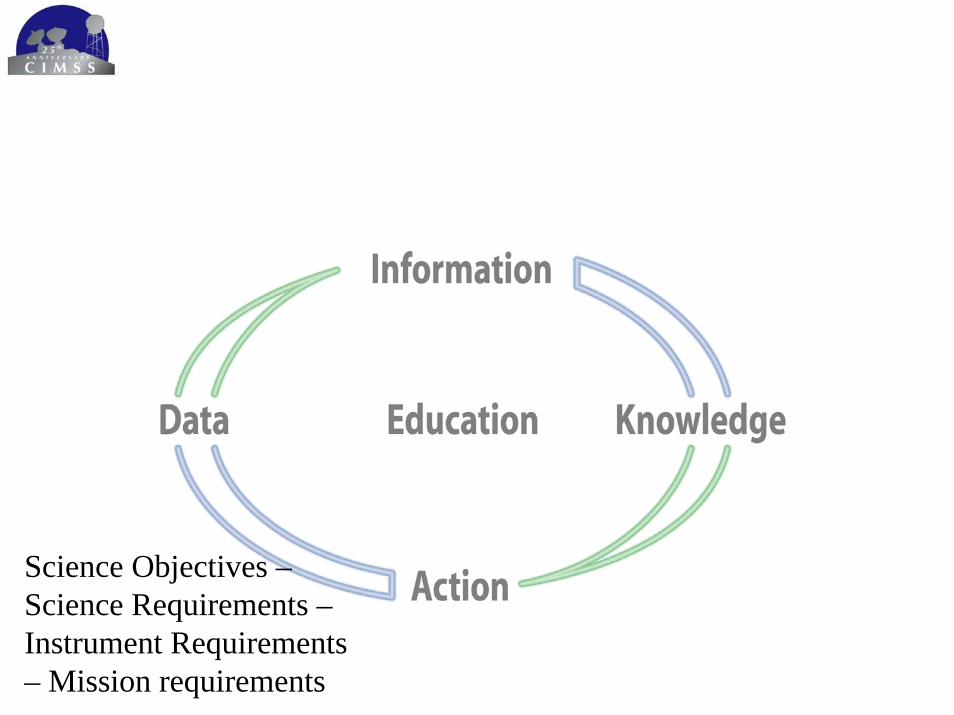
Science Objectives –Science Requirements –Instrument Requirements – Mission requirements
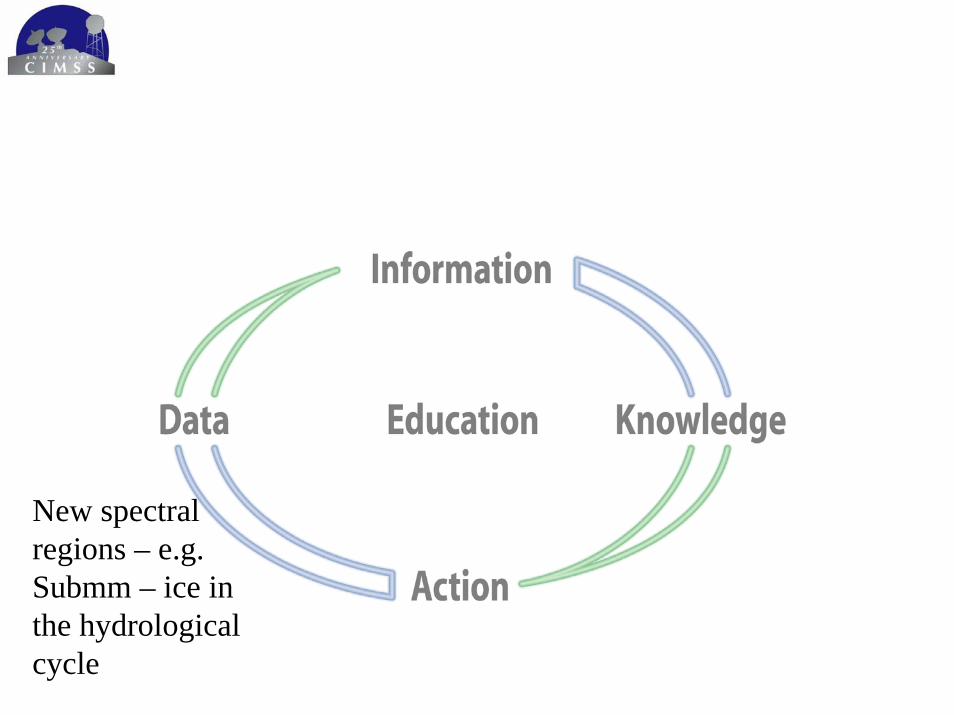
New spectral regions – e.g. Submm – ice in the hydrological cycle
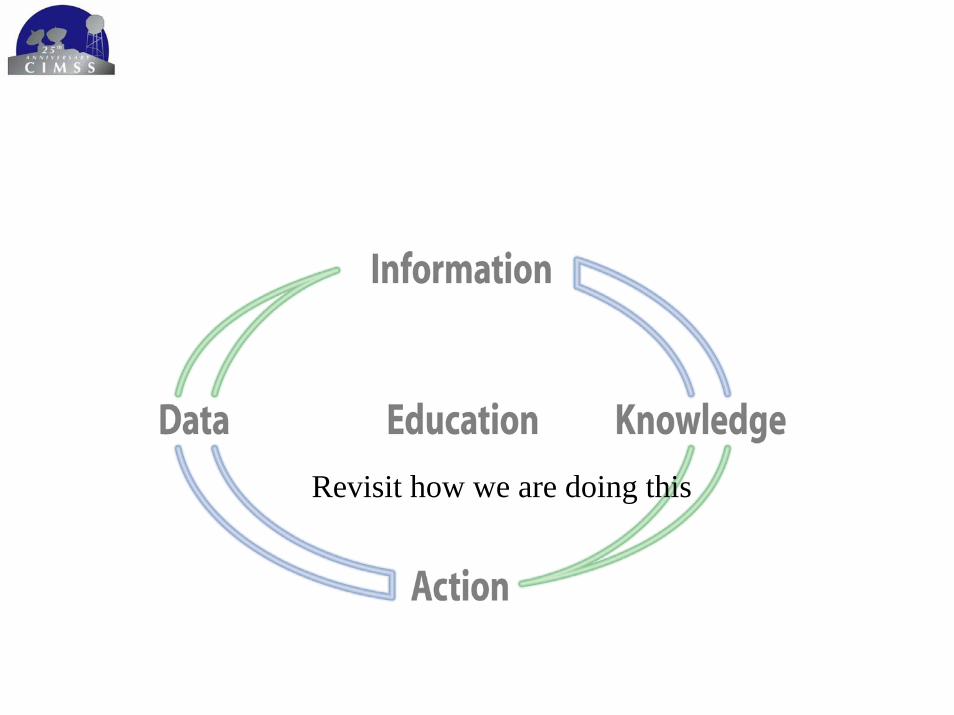
Revisit how we are doing this