circle usd 375 - kansas state department of education finance/budget/budget_at_a_glance/0… ·...
TRANSCRIPT
Circle USD 375

• Budget General Information (characteristics of district)
• Supplemental Information for Tables in Summary of Expenditures
• KSDE Website Information Available
• Summary of Expenditures (Sumexpen.xls)
1
2005-2006 Budget General Information USD #: 375
Introduction Circle District is a unique district in south central Kansas, made up of multiple communities. The towns of Benton, Towanda, Greenwich, Township Village in El Dorado and northeastern Wichita are all part of USD 375. The district encompasses approximately 175 square miles of northeastern Sedgwick and western Butler Counties. The district’s patrons have a vital interest in the educational program and passed an $18.6 million bond issue to remodel and/or expand all schools in 1998. Three grade schools, one middle school and one high school house Circle District’s 1500 students. Benton Elementary has grades kindergarten through sixth grade and is located in the town of Benton. Oil Hill Elementary includes kindergarten through sixth grade students and is located in Township Village, on the western edge of El Dorado. Towanda Elementary is in the community of Towanda with grades kindergarten through third at the newly constructed Primary School and grades fourth through sixth at the Intermediate School. All grade schools offer comprehensive basics in reading, writing, math, science and social studies. Seventh and eighth graders attend the new Circle Middle School in Benton and participate as T-Bolts in the Walnut Valley Middle School League. Each school also has a full music, physical education, computer literacy and health program. The middle school also offers art, foreign language and technology exploration classes. Circle High School is located near the center of the district in Towanda. A new fine arts wing was constructed in 2002 providing new music and drama classrooms plus a new 800 seat auditorium. The school is also completely networked with internet access to all classrooms with a newly expanded library and cafeteria/commons area.
Board Members Roxann Cool..................................... ....................620-752-3133
Marvin Dodson .....................................................316-541-1200
Todd Frankenbery ................................................316-778-2108
Shelley Kinder ......................................................316-778-1956
Herb Pello .............................................................316-778-1712
Stewart Stephens...................................................316-832-0754
Ben Whiteside ......................................................620-752-3509
Key Staff Superintendent: Eliese Holt Associate or Assistant Superintendents: Dr. Robert Grassino District Office Assistants: Carla McCune, Kristy Evans, Angie Clevenger Building Principals: Al Sersland, Circle High School; Nita McLean, Circle Middle School; Dorsey Burgess, Benton Ele.; Don Coffman, Towanda Ele.; and Michael Janzen, Oil Hill Ele. Assistant Principals: Brent Jones, Circle High School; Doug Bacon, Circle Middle School

2
The District’s Accomplishments and Challenges
Accomplishments: All schools in Circle USD 375 met the requirements for North Central Accreditation for the third year. The district is implementing district wide goals to improve students’ reading, math and writing skills across the curriculum. All schools and district met all state and federal requirements for “No Child Left Behind” including Adequate Yearly Progress for all groups of students on the Kansas Math and Reading Assessments. The district met the Standard of Excellence on 16 of the 20 assessments given:
• Oil Hill Elementary – 4th Grade Math, 4th Grade Science, 5th Grade Reading and 6th Grade Social Studies
• Towanda Elementary – 5th Grade Reading • Benton Elementary – 4th Grade Math, 4th Grade Science, 5th Grade Reading and 6th Grade
Social Studies • Circle Middle School – 7th Grade Math, 7th Grade Science, 8th Grade Reading and 8th
Grade Social Studies • Circle High School – 11th Grade Social Studies
Challenges: Circle District lost nearly $500,000 in budget authority for the 2004-2005 school year due to $400,000 less funding for new facilities and a corresponding loss of $100,000 in the 25% Local Option Budget. This loss coupled with no new funding from the state last year required many cost saving reductions. A further challenge facing the district this year is an approximate 2% decline in enrollment. By increasing the district’s Supplemental General Fund (Local Option Budget) to 27%, the district will receive this year approximately $164,000 additional monies in its General and Supplemental General funds over what it received in 2003-2004. Increasing insurance, utility and fuel costs will continue to place burdens on the budget. Staff members are committed to carefully monitoring and implementing cost saving practices while offering programs that will maintain high levels of academic achievement in all schools in USD 375.

3
Supplemental Information for the Following Tables 1. Summary of Total Expenditures by Function (All Funds) 2. Summary of General Fund Expenditures by Function 3. Summary of Supplemental General Fund Expenditures by Function 4. Summary of General and Supplemental General Fund Expenditures by Function 5. Summary of Special Education Fund by Function 6. Instruction Expenditures (1000) 7. Student and Instructional Support Expenditures (2100 & 2200) 8. General Administration Expenditures (2300) 9. School Administration Expenditures (2400) 10. Operations and Maintenance Expenditures (2600) 11. Other Costs (2500 & 2900: Other Supplemental Services) (3000: Non-Instruction Services) 12. Capital Improvements (4000) 13. Debt Services (5000) 14. Miscellaneous Information Unencumbered Cash Balance by Fund 15. Reserve Funds Unencumbered Cash Balance 16. Other Information - FTE 17. Miscellaneous Information Mill Rates by Fund 18. Other Information – Assessed Valuation and Bonded Indebtedness Note: The FTE (full time equivalency) used in this report to calculate the “Amount Per Pupil” is defined as following: Enrollment (FTE) includes the enrollment of the district used for state aid and budget authority, and all other preschool enrollment and kindergarten students attending full time.
4
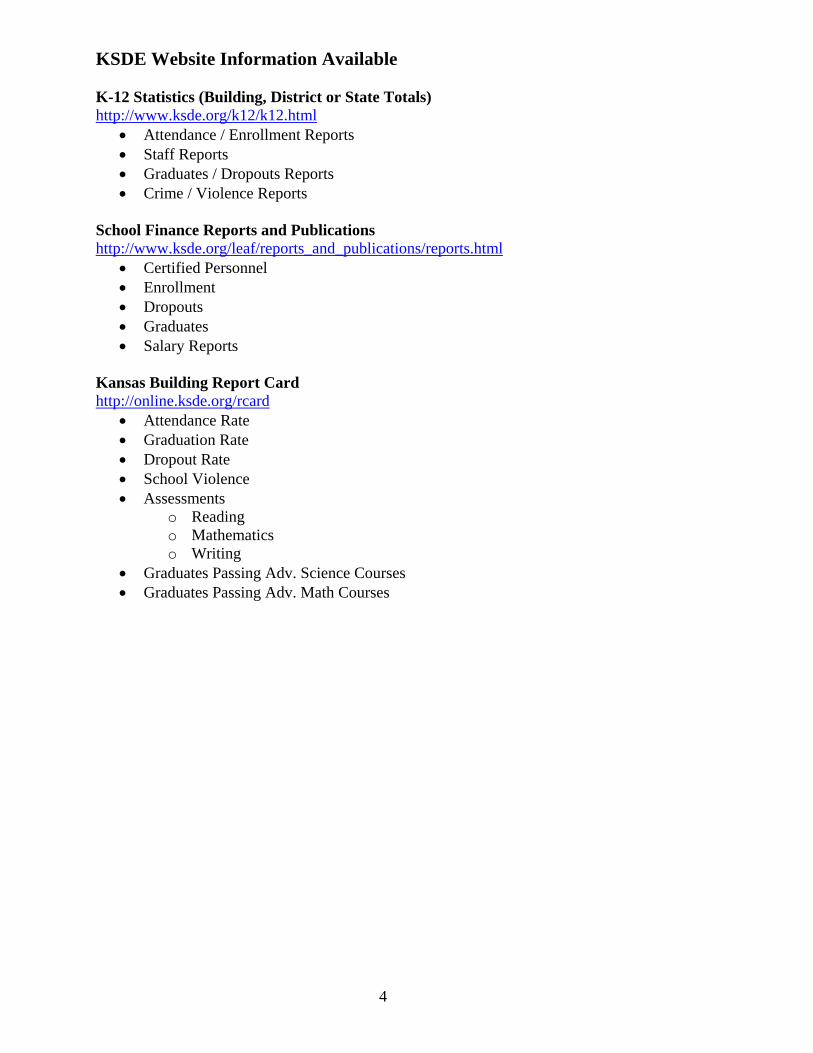
KSDE Website Information Available K-12 Statistics (Building, District or State Totals) http://www.ksde.org/k12/k12.html
• Attendance / Enrollment Reports • Staff Reports • Graduates / Dropouts Reports • Crime / Violence Reports
School Finance Reports and Publications http://www.ksde.org/leaf/reports_and_publications/reports.html
• Certified Personnel • Enrollment • Dropouts • Graduates • Salary Reports
Kansas Building Report Card http://online.ksde.org/rcard
• Attendance Rate • Graduation Rate • Dropout Rate • School Violence • Assessments
o Reading o Mathematics o Writing
• Graduates Passing Adv. Science Courses • Graduates Passing Adv. Math Courses

USD# 375
Summary of Total Expenditures By Function(All Funds)
% % % % %2003-2004 of 2004-2005 of inc/ 2005-2006 of inc/
Actual Tot Actual Tot dec Budget Tot dec
Instruction 6,587,406 50% 7,076,384 51% 7% 7,733,881 53% 9%
Student & Instructional Support 1,201,720 9% 1,347,496 10% 12% 1,220,886 8% -9%
General Administration 380,452 3% 387,823 3% 2% 397,500 3% 2%
School Administration (Building) 713,736 5% 747,797 5% 5% 756,600 5% 1%
Operations & Maintenance 1,854,829 14% 1,328,117 10% -28% 1,566,618 11% 18%
Capital Improvements 36,430 0% 332,048 2% 811% 35,000 0% -89%
Debt Services 1,408,915 11% 1,301,467 9% -8% 1,577,335 11% 21%
Other Costs 1,098,089 8% 1,364,649 10% 24% 1,349,871 9% -1%
Total Expenditures 13,281,577 100% 13,885,781 100% 5% 14,637,691 100% 5%
Amount per Pupil $9,097 $9,289 2% $9,792 5%
Note: Percentages on charts are within +-1% due to rounding used. Pie graph percentages may differ from charts for this reason also.
Further definition of what goes into each category:Instruction - 1000 Operations & Maintenance - 2600Student & Instructional Support - 2100 & 2200 Other Costs - 2500, 2900 and 3000 and all others not included elsewhereGeneral Administration - 2300 Capital Improvements - 4000School Administration (Building) - 2400 Debt Services - 5100 Transfers - 5200
The funds that are included in the categories above are: General, Supplemental General, Bilingual Education, At Risk(4yr Old), At Risk(K-12), Capital Outlay, Driver Education, Declining Enrollment, Extraordinary School Program, Summer School, Special Education, Vocational Education, Professional Development, Bond & Interest #1, Bond & Interest #2, No-Fund Warrant, Special Assessment, Parent Education, School Retirement, Student Materials Revolving & Textbook Rental, Tuition Reimbursement, Gifts/Grants, KPERS Special Retirement Contribution, Contingency, Special Liability Expense, Federal Funds, Adult Education, Adult Supplemental Education, Area Vocational Education, and Special Education Coop.
Summary of Total Expenditures By Function (All Funds)
0
1,000,000
2,000,000
3,000,000
4,000,000
5,000,000
6,000,000
7,000,000
8,000,000
9,000,000
Instruction Student &Instructional
Support
GeneralAdministration
SchoolAdministration
(Building)
Operations &Maintenance
CapitalImprovements
Debt Services Other Costs
2003-20042004-20052005-2006
2005-2006 Summary of Total Expenditures By Function (All Funds)
Instruction53%
General Administration3%
School Administration (Building)5%
Operations & Maintenance11%
Debt Services11%
Other Costs9%
Student & Instructional Support8%
InstructionStudent & Instructional SupportGeneral AdministrationSchool Administration (Building)Operations & MaintenanceCapital ImprovementsDebt ServicesOther Costs
11/1/2005 9:15 AM Sumexpen.xls Page 1 of 19

USD# 375
Summary of General Expendituresby Function
% % % % %2003-2004 of 2004-2005 of inc/ 2005-2006 of inc/
Actual Tot Actual Tot dec Budget Tot dec
Instruction 4,502,127 61% 4,507,964 61% 0% 4,688,766 63% 4%
Student & Instructional Support 985,269 13% 958,724 13% -3% 831,425 11% -13%
General Administration 380,314 5% 379,755 5% 0% 385,500 5% 2%
School Administration (Building) 713,736 10% 712,276 10% 0% 721,600 10% 1%
Operations & Maintenance 420,838 6% 386,390 5% -8% 413,000 6% 7%
Capital Improvements 0 0% 0 0% 0% 0 0% 0%
Other Costs 351,437 5% 401,691 5% 14% 455,550 6% 13%
Total Expenditures 7,353,721 100% 7,346,800 100% 0% 7,495,841 100% 2%
Amount per Pupil $5,037 $4,915 -2% $5,015 2%
The Summary of General Fund Expenditures chart information comes from pages 6-13 and only uses the 'General Fund' line items.
Summary of General Fund Expendituresby Function
0
500,000
1,000,000
1,500,000
2,000,000
2,500,000
3,000,000
3,500,000
4,000,000
4,500,000
5,000,000
Instruction Student &Instructional
Support
GeneralAdministration
SchoolAdministration
(Building)
Operations &Maintenance
CapitalImprovements
Other Costs
2003-20042004-20052005-2006
2005-2006 Summary of General Fund Expendituresby Function
Instruction62%
Student & Instructional Support
11%
General Administration5%
School Administration (Building)
10%
Operations & Maintenance6%
Other Costs6%
InstructionStudent & Instructional SupportGeneral AdministrationSchool Administration (Building)Operations & MaintenanceCapital ImprovementsOther Costs
11/1/2005 9:15 AM Sumexpen.xls Page 2 of 19

USD# 375
Summary of Supplemental General Fund Expendituresby Function
% % % % %2003-2004 of 2004-2005 of inc/ 2005-2006 of inc/
Actual Tot Actual Tot dec Budget Tot dec
Instruction 281,558 18% 94,196 9% -67% 238,697 18% 153%
Student & Instructional Support 160,684 10% 182,192 17% 13% 195,920 15% 8%
General Administration 138 0% 0 0% -100% 0 0% 0%
School Administration (Building) 0 0% 0 0% 0% 0 0% 0%
Operations & Maintenance 1,114,709 72% 785,470 74% -30% 895,368 67% 14%
Capital Improvements 0 0% 0 0% 0% 0 0% 0%
Other Costs 0 0% 0 0% 0% 0 0% 0%
Total Expenditures 1,557,089 100% 1,061,858 100% -32% 1,329,985 100% 25%
Amount per Pupil $1,066 $710 -33% $890 25%
The Summary of Supplemental General Fund Expenditures chart information comes from pages 6-13 and only uses the 'Supplemental General Fund' line items.
2005-2006 Summary of Supplemental General Fund Expendituresby Function
Instruction18%
Student & Instructional Support
15%
Operations & Maintenance67%
InstructionStudent & Instructional SupportGeneral AdministrationSchool Administration (Building)Operations & MaintenanceCapital ImprovementsOther Costs
Summary of Supplemental General Fund Expendituresby Function
0
200,000
400,000
600,000
800,000
1,000,000
1,200,000
Instruction Student &Instructional
Support
GeneralAdministration
SchoolAdministration
(Building)
Operations &Maintenance
CapitalImprovements
Other Costs
2003-20042004-20052005-2006
11/1/2005 9:15 AM Sumexpen.xls Page 3 of 19
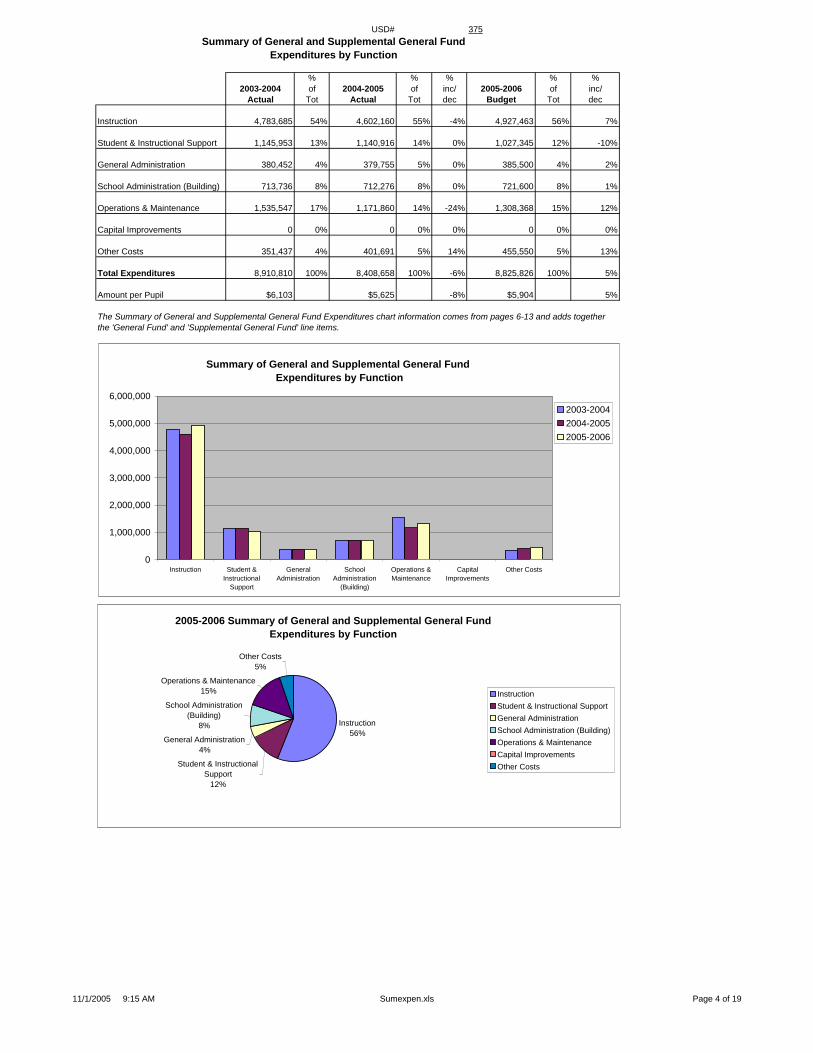
USD# 375Summary of General and Supplemental General Fund
Expenditures by Function
% % % % %2003-2004 of 2004-2005 of inc/ 2005-2006 of inc/
Actual Tot Actual Tot dec Budget Tot dec
Instruction 4,783,685 54% 4,602,160 55% -4% 4,927,463 56% 7%
Student & Instructional Support 1,145,953 13% 1,140,916 14% 0% 1,027,345 12% -10%
General Administration 380,452 4% 379,755 5% 0% 385,500 4% 2%
School Administration (Building) 713,736 8% 712,276 8% 0% 721,600 8% 1%
Operations & Maintenance 1,535,547 17% 1,171,860 14% -24% 1,308,368 15% 12%
Capital Improvements 0 0% 0 0% 0% 0 0% 0%
Other Costs 351,437 4% 401,691 5% 14% 455,550 5% 13%
Total Expenditures 8,910,810 100% 8,408,658 100% -6% 8,825,826 100% 5%
Amount per Pupil $6,103 $5,625 -8% $5,904 5%
The Summary of General and Supplemental General Fund Expenditures chart information comes from pages 6-13 and adds togetherthe 'General Fund' and 'Supplemental General Fund' line items.
Summary of General and Supplemental General Fund Expenditures by Function
0
1,000,000
2,000,000
3,000,000
4,000,000
5,000,000
6,000,000
Instruction Student &Instructional
Support
GeneralAdministration
SchoolAdministration
(Building)
Operations &Maintenance
CapitalImprovements
Other Costs
2003-20042004-20052005-2006
2005-2006 Summary of General and Supplemental General Fund Expenditures by Function
Instruction56%
Student & Instructional Support
12%
General Administration4%
School Administration (Building)
8%
Operations & Maintenance15%
Other Costs5%
InstructionStudent & Instructional SupportGeneral AdministrationSchool Administration (Building)Operations & MaintenanceCapital ImprovementsOther Costs
11/1/2005 9:15 AM Sumexpen.xls Page 4 of 19

USD# 375
Summary of Special Education Fundby Function
% % % % %2003-2004 of 2004-2005 of inc/ 2005-2006 of inc/
Actual Tot Actual Tot dec Budget Tot dec
Instruction 901,574 85% 974,313 88% 8% 1,213,712 88% 25%
Student & Instructional Support 0 0% 0 0% 0% 0 0% 0%
General Administration 0 0% 0 0% 0% 0 0% 0%
School Administration (Building) 0 0% 0 0% 0% 0 0% 0%
Operations & Maintenance 0 0% 620 0% 0% 1,000 0% 61%
Capital Improvements 0 0% 0 0% 0% 0 0% 0%
Other Costs 155,745 15% 133,986 12% -14% 160,200 12% 20%
Total Expenditures 1,057,319 100% 1,108,919 100% 5% 1,374,912 100% 24%
Amount per Pupil $724 $742 2% $920 24%
The Summary of Special Education Fund Expenditures chart information comes from pages 6-13 and only uses the 'Special Education Fund'line items. (Total expenditures excludes Special Ed Coop Fund because it would include expenditures for all schools participating in the Coop.)
Summary of Special Education Fund Expendituresby Function
0
200,000
400,000
600,000
800,000
1,000,000
1,200,000
1,400,000
Instruction Student &Instructional
Support
GeneralAdministration
SchoolAdministration
(Building)
Operations &Maintenance
CapitalImprovements
Other Costs
2003-20042004-20052005-2006
2005-2006 Summary of Special Education Fundby Function
Instruction88%
Other Costs12%
InstructionStudent & Instructional SupportGeneral AdministrationSchool Administration (Building)Operations & MaintenanceCapital ImprovementsOther Costs
11/1/2005 9:15 AM Sumexpen.xls Page 5 of 19

USD# 375Instruction Expenditures (1000)
% %2003-2004 2004-2005 inc/ 2005-2006 inc/
Actual Actual dec Budget dec
General 4,502,127 4,507,964 0% 4,688,766 4%Federal Funds 305,165 289,940 -5% 291,931 1%Supplemental General 281,558 94,196 -67% 238,697 153%At Risk (4yr Old) 0At Risk (K-12) 225,500Bilingual Education 0 0 0% 0 0%Capital Outlay 92,133 319,178 246% 300,000 -6%Driver Education 17,925 16,027 -11% 17,125 7%Declining Enrollment 0Extraordinary School Program 0 0 0% 0 0%Food Service 0 0 0% 0 0%Professional Development 0 0 0% 0 0%Parent Education Program 0 0 0% 0 0%Summer School 0 0 0% 0 0%Special Education 901,574 974,313 8% 1,213,712 25%Vocational Education 400,000 500,000 25% 468,150 -6%Gifts/Grants 0 0 0% 0 0%Special Liability 0 0 0% 0 0%School Retirement 0 0 0% 0 0%Extraordinary Growth Facilities 0 0 0% 0 0%Special Reserve 0 0 0%KPERS Spec. Ret. Contribution 228,000 290,000 27%Contingency Reserve 0 0 0%Text Book & Student Material 86,924 146,766 69%Bond & Interest #1 0 0 0% 0 0%Bond & Interest #2 0 0 0% 0 0%No-Fund Warrant 0 0 0% 0 0%Special Assessment 0 0 0% 0 0%Temporary Note 0 0 0% 0 0%
SUBTOTAL 6,587,406 7,076,384 7% 7,733,881 9%Enrollment (FTE)* 1,460.0 1,494.8 2% 1,494.8 0%Amount per Pupil 4,512 4,734 5% 5,174 9%
Adult Education 0 0 0% 0 0%Adult Supplemental Education 0 0 0% 0 0%Area Vocational School 0 0 0% 0 0%Tuition Reimbursement 0 0 0% 0 0%Special Education Coop 0 0 0% 0 0%TOTAL 6,587,406 7,076,384 7% 7,733,881 9%
NOTE: Gifts/Grants includes private grants and grants from nonfederal sources.
Amount per pupil excludes the following funds: Area Vocational School, Adult Education, Adult Supplemental Education,Special Education Coop and Tuition Reimbursement.
*Enrollment (FTE) includes the enrollment of the district used for state aid and budget authority, and all other preschool enrollmentand kindergarten students attending full time.
Instruction Expenditures
0
1,000,000
2,000,000
3,000,000
4,000,000
5,000,000
6,000,000
7,000,000
8,000,000
9,000,000
2003-2004 2004-2005 2005-2006
Instruction Expenditures
0500,000
1,000,0001,500,0002,000,0002,500,0003,000,0003,500,0004,000,0004,500,0005,000,000
2003-2004 2004-2005 2005-2006
General Supplemental GeneralSpecial Education
11/1/2005 9:15 AM Sumexpen.xls Page 6 of 19

USD# 375
Student and Instructional Support Expenditures (2100 & 2200)
% %2003-2004 2004-2005 inc/ 2005-2006 inc/
Actual Actual dec Budget dec
General 985,269 958,724 -3% 831,425 -13%Federal Funds 1,284 990 -23% 1,000 1%Supplemental General 160,684 182,192 13% 195,920 8%At Risk (4yr Old) 0At Risk (K-12) 0Bilingual Education 0 0 0% 0 0%Capital Outlay 0 2,272 0% 103,000 4433%Driver Training 0 0 0% 0 0%Declining Enrollment 0Extraordinary School Program 0 0 0% 0 0%Food Service 0 0 0% 0 0%Professional Development 31,662 35,318 12% 32,750 -7%Parent Education Program 0 0 0% 0 0%Summer School 0 0 0% 0 0%Special Education 0 0 0% 0 0%Vocational Education 0 0 0% 0 0%Gifts/Grants 0 0 0% 0 0%Special Liability 0 0 0% 0 0%School Retirement 0 0 0% 0 0%Extraordinary Growth Facilities 0 0 0% 0 0%Special Reserve 0 0 0%KPERS Spec. Ret. Contribution 46,000 56,791 23%Contingency Reserve 0 122,000 0%Text Book & Student Material 22,821 0 -100%Bond & Interest #1 0 0 0% 0 0%Bond & Interest #2 0 0 0% 0 0%No-Fund Warrant 0 0 0% 0 0%Special Assessment 0 0 0% 0 0%Temporary Note 0 0 0% 0 0%
SUBTOTAL 1,201,720 1,347,496 12% 1,220,886 -9%Enrollment (FTE)* 1,460.0 1,494.8 2% 1,494.8 0%Amount per Pupil 823 901 10% 817 -9%
Adult Education 0 0 0% 0 0%Adult Supplemental Education 0 0 0% 0 0%Area Vocational School 0 0 0% 0 0%Tuition Reimbursement 0 0 0% 0 0%Special Education Coop 0 0 0% 0 0%TOTAL 1,201,720 1,347,496 12% 1,220,886 -9%Amount per Pupil $811 $901 11% $817 -9%
NOTE: Gifts/Grants includes private grants and grants from nonfederal sources.
Amount per pupil excludes the following funds: Area Vocational School, Adult Education, Adult Supplemental Education,Special Education Coop and Tuition Reimbursement.
*Enrollment (FTE) includes the enrollment of the district used for state aid and budget authority, and all other preschool enrollmentand kindergarten students attending full time.
Student and Instructional Support Expenditures
0
200,000
400,000
600,000
800,000
1,000,000
1,200,000
1,400,000
1,600,000
2003-2004 2004-2005 2005-2006
11/1/2005 9:15 AM Sumexpen.xls Page 7 of 19
USD# 375
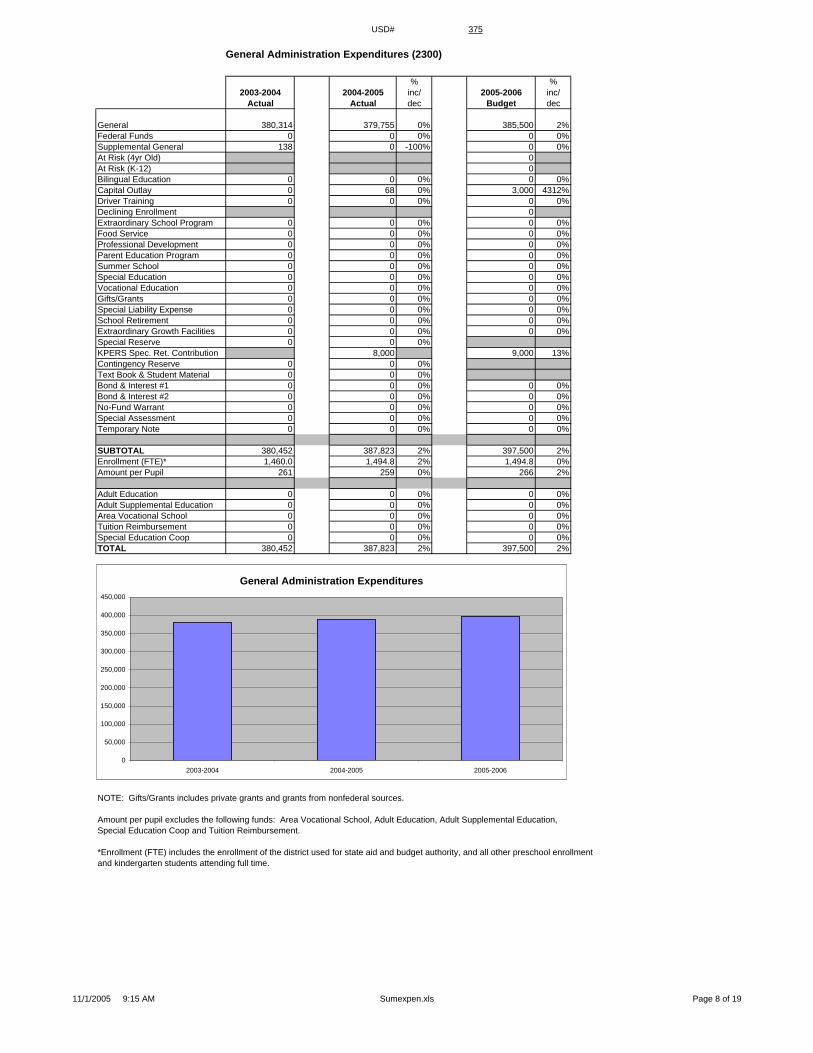
General Administration Expenditures (2300)
% %2003-2004 2004-2005 inc/ 2005-2006 inc/
Actual Actual dec Budget dec
General 380,314 379,755 0% 385,500 2%Federal Funds 0 0 0% 0 0%Supplemental General 138 0 -100% 0 0%At Risk (4yr Old) 0At Risk (K-12) 0Bilingual Education 0 0 0% 0 0%Capital Outlay 0 68 0% 3,000 4312%Driver Training 0 0 0% 0 0%Declining Enrollment 0Extraordinary School Program 0 0 0% 0 0%Food Service 0 0 0% 0 0%Professional Development 0 0 0% 0 0%Parent Education Program 0 0 0% 0 0%Summer School 0 0 0% 0 0%Special Education 0 0 0% 0 0%Vocational Education 0 0 0% 0 0%Gifts/Grants 0 0 0% 0 0%Special Liability Expense 0 0 0% 0 0%School Retirement 0 0 0% 0 0%Extraordinary Growth Facilities 0 0 0% 0 0%Special Reserve 0 0 0%KPERS Spec. Ret. Contribution 8,000 9,000 13%Contingency Reserve 0 0 0%Text Book & Student Material 0 0 0%Bond & Interest #1 0 0 0% 0 0%Bond & Interest #2 0 0 0% 0 0%No-Fund Warrant 0 0 0% 0 0%Special Assessment 0 0 0% 0 0%Temporary Note 0 0 0% 0 0%
SUBTOTAL 380,452 387,823 2% 397,500 2%Enrollment (FTE)* 1,460.0 1,494.8 2% 1,494.8 0%Amount per Pupil 261 259 0% 266 2%
Adult Education 0 0 0% 0 0%Adult Supplemental Education 0 0 0% 0 0%Area Vocational School 0 0 0% 0 0%Tuition Reimbursement 0 0 0% 0 0%Special Education Coop 0 0 0% 0 0%TOTAL 380,452 387,823 2% 397,500 2%
NOTE: Gifts/Grants includes private grants and grants from nonfederal sources.
Amount per pupil excludes the following funds: Area Vocational School, Adult Education, Adult Supplemental Education,Special Education Coop and Tuition Reimbursement.
*Enrollment (FTE) includes the enrollment of the district used for state aid and budget authority, and all other preschool enrollmentand kindergarten students attending full time.
General Administration Expenditures
0
50,000
100,000
150,000
200,000
250,000
300,000
350,000
400,000
450,000
2003-2004 2004-2005 2005-2006
11/1/2005 9:15 AM Sumexpen.xls Page 8 of 19

USD# 375
School Administration Expenditures (2400)
% %2003-2004 2004-2005 inc/ 2005-2006 inc/
Actual Actual dec Budget dec
General 713,736 712,276 0% 721,600 1%Federal Funds 0 0 0% 0 0%Supplemental General 0 0 0% 0 0%At Risk (4yr Old) 0At Risk (K-12) 0Bilingual Education 0 0 0% 0 0%Capital Outlay 0 9,521 0% 5,000 -47%Driver Training 0 0 0% 0 0%Declining Enrollment 0Extraordinary School Program 0 0 0% 0 0%Food Service 0 0 0% 0 0%Professional Development 0 0 0% 0 0%Parent Education Program 0 0 0% 0 0%Summer School 0 0 0% 0 0%Special Education 0 0 0% 0 0%Vocational Education 0 0 0% 0 0%Gifts/Grants 0 0 0% 0 0%Special Liability Expense 0 0 0% 0 0%School Retirement 0 0 0% 0 0%Extraordinary Growth Facilities 0 0 0% 0 0%Special Reserve 0 0 0%KPERS Spec. Ret. Contribution 26,000 30,000 15%Contingency Reserve 0 0 0%Text Book & Student Material 0 0 0%Bond & Interest #1 0 0 0% 0 0%Bond & Interest #2 0 0 0% 0 0%No-Fund Warrant 0 0 0% 0 0%Special Assessment 0 0 0% 0 0%Temporary Note 0 0 0% 0 0%
SUBTOTAL 713,736 747,797 5% 756,600 1%Enrollment (FTE)* 1,460.0 1,494.8 2% 1,494.8 0%Amount per Pupil 489 500 2% 506 1%
Adult Education 0 0 0% 0 0%Adult Supplemental Education 0 0 0% 0 0%Area Vocational School 0 0 0% 0 0%Tuition Reimbursement 0 0 0% 0 0%Special Education Coop 0 0 0% 0 0%TOTAL 713,736 747,797 5% 756,600 1%
NOTE: Gifts/Grants includes private grants and grants from nonfederal sources.
Amount per pupil excludes the following funds: Area Vocational School, Adult Education, Adult Supplemental Education,Special Education Coop and Tuition Reimbursement.
*Enrollment (FTE) includes the enrollment of the district used for state aid and budget authority, and all other preschool enrollmentand kindergarten students attending full time.
School Administration Expenditures
0
100,000
200,000
300,000
400,000
500,000
600,000
700,000
800,000
2003-2004 2004-2005 2005-2006
11/1/2005 9:15 AM Sumexpen.xls Page 9 of 19

USD# 375
Operations and Maintenance Expenditures (2600)
% %2003-2004 2004-2005 inc/ 2005-2006 inc/
Actual Actual dec Budget dec
General 420,838 386,390 -8% 413,000 7%Federal Funds 0 0 0% 0 0%Supplemental General 1,114,709 785,470 -30% 895,368 14%At Risk (4yr Old) 0At Risk (K-12) 0Bilingual Education 0 0 0% 0 0%Capital Outlay 319,272 126,930 -60% 200,000 58%Driver Training 10 0 -100% 0 0%Declining Enrollment 0Extraordinary School Program 0 0 0% 0 0%Food Service 0 6,707 0% 32,250 381%Professional Development 0 0 0% 0 0%Parent Education Program 0 0 0% 0 0%Summer School 0 0 0% 0 0%Special Education 0 620 0% 1,000 61%Vocational Education 0 0 0% 0 0%Gifts/Grants 0 0 0% 0 0%Special Liability 0 0 0% 0 0%School Retirement 0 0 0% 0 0%Extraordinary Growth Facilities 0 0 0% 0 0%Special Reserve 0 0 0%KPERS Spec. Ret. Contribution 22,000 25,000 14%Contingency Reserve 0 0 0%Text Book & Student Material 0 0 0%Bond & Interest #1 0 0 0% 0 0%Bond & Interest #2 0 0 0% 0 0%No-Fund Warrant 0 0 0% 0 0%Special Assessment 0 0 0% 0 0%Temporary Note 0 0 0% 0 0%
SUBTOTAL 1,854,829 1,328,117 -28% 1,566,618 18%Enrollment (FTE)* 1,460.0 1,494.8 2% 1,494.8 0%Amount per Pupil 1,270 888 -30% 1,048 18%
Adult Education 0 0 0% 0 0%Adult Supplemental Education 0 0 0% 0 0%Area Vocational School 0 0 0% 0 0%Tuition Reimbursement 0 0 0% 0 0%Special Education Coop 0 0 0% 0 0%TOTAL 1,854,829 1,328,117 -28% 1,566,618 18%
NOTE: Gifts/Grants includes private grants and grants from nonfederal sources.
Amount per pupil excludes the following funds: Area Vocational School, Adult Education, Adult Supplemental Education,Special Education Coop and Tuition Reimbursement.
*Enrollment (FTE) includes the enrollment of the district used for state aid and budget authority, and all other preschool enrollmentand kindergarten students attending full time.
Operations and Maintenance Expenditures
0
200,000
400,000
600,000
800,000
1,000,000
1,200,000
1,400,000
1,600,000
1,800,000
2,000,000
2003-2004 2004-2005 2005-2006
11/1/2005 9:15 AM Sumexpen.xls Page 10 of 19

USD# 375
Other Costs(2500 & 2900: Other Supplemental Services)
(2700: Transportation)(3000: Non-Instruction Services)
% %2003-2004 2004-2005 inc/ 2005-2006 inc/
Actual Actual dec Budget dec
General 351,437 401,691 14% 455,550 13%Federal Funds 0 0 0% 0 0%Supplemental General 0 0 0% 0 0%At Risk (4yr Old) 0At Risk (K-12) 0Bilingual Education 0 0 0% 0 0%Capital Outlay 1,799 224,123 12358% 106,000 -53%Driver Training 0 0 0% 0 0%Declining Enrollment 0Extraordinary School Program 0 0 0% 0 0%Food Service 589,108 562,429 -5% 580,062 3%Professional Development 0 0 0% 0 0%Parent Education Program 0 0 0% 0 0%Summer School 0 0 0% 0 0%Special Education 155,745 133,986 -14% 160,200 20%Vocational Education 0 0 0% 0 0%Gifts/Grants 0 0 0% 0 0%Special Liability 0 0 0% 0 0%School Retirement 0 0 0% 0 0%Extraordinary Growth Facilities 0 0 0% 0 0%Special Reserve 0 0 0%KPERS Spec. Ret. Contribution 42,420 48,059 13%Contingency Reserve 0 0 0%Text Book & Student Material 0 0 0%Bond & Interest #1 0 0 0% 0 0%Bond & Interest #2 0 0 0% 0 0%No-Fund Warrant 0 0 0% 0 0%Special Assessment 0 0 0% 0 0%Temporary Note 0 0 0% 0 0%
SUBTOTAL 1,098,089 1,364,649 24% 1,349,871 -1%Enrollment (FTE)* 1,460.0 1,494.8 2% 1,494.8 0%Amount per Pupil 752 913 21% 903 -1%
Adult Education 0 0 0% 0 0%Adult Supplemental Education 0 0 0% 0 0%Area Vocational School 0 0 0% 0 0%Tuition Reimbursement 0 0 0% 0 0%Special Education Coop 0 0 0% 0 0%TOTAL 1,098,089 1,364,649 24% 1,349,871 -1%
NOTE: Gifts/Grants includes private grants and grants from nonfederal sources.
Amount per pupil excludes the following funds: Area Vocational School, Adult Education, Adult Supplemental Education,Special Education Coop and Tuition Reimbursement.
*Enrollment (FTE) includes the enrollment of the district used for state aid and budget authority, and all other preschool enrollmentand kindergarten students attending full time.
Other Costs
0
200,000
400,000
600,000
800,000
1,000,000
1,200,000
1,400,000
1,600,000
2003-2004 2004-2005 2005-2006
11/1/2005 9:15 AM Sumexpen.xls Page 11 of 19

USD# 375
Capital Improvements Expenditures (4000)
% %2003-2004 2004-2005 inc/ 2005-2006 inc/
Actual Actual dec Budget dec
General 0 0 0% 0 0%Federal Funds 0 0 0% 0 0%Supplemental General 0 0 0% 0 0%At Risk (4yr Old) 0At Risk (K-12) 0Bilingual Education 0 0 0% 0 0%Capital Outlay 36,430 332,048 811% 35,000 -89%Driver Training 0 0 0% 0 0%Declining Enrollment 0Extraordinary School Program 0 0 0% 0 0%Food Service 0 0 0% 0 0%Professional Development 0 0 0% 0 0%Parent Education Program 0 0 0% 0 0%Summer School 0 0 0% 0 0%Special Education 0 0 0% 0 0%Vocational Education 0 0 0% 0 0%Gifts/Grants 0 0 0% 0 0%Special Liability 0 0 0% 0 0%School Retirement 0 0 0% 0 0%Extraordinary Growth Facilities 0 0 0% 0 0%Special Reserve 0 0 0%KPERS Spec. Ret. Contribution 0 0 0%Contingency Reserve 0 0 0%Text Book & Student Material 0 0 0%Bond & Interest #1 0 0 0% 0 0%Bond & Interest #2 0 0 0% 0 0%No-Fund Warrant 0 0 0% 0 0%Special Assessment 0 0 0% 0 0%Temporary Note 0 0 0% 0 0%
SUBTOTAL 36,430 332,048 811% 35,000 -89%Enrollment (FTE)* 1,460.0 1,494.8 2% 1,494.8 0%Amount per Pupil 25 222 790% 23 -89%
Adult Education 0 0 0% 0 0%Adult Supplemental Education 0 0 0% 0 0%Area Vocational School 0 0 0% 0 0%Tuition Reimbursement 0 0 0% 0 0%Special Education Coop 0 0 0% 0 0%TOTAL 36,430 332,048 811% 35,000 -89%
NOTE: Gifts/Grants includes private grants and grants from nonfederal sources.
Amount per pupil excludes the following funds: Area Vocational School, Adult Education, Adult Supplemental Education,Special Education Coop and Tuition Reimbursement.
*Enrollment (FTE) includes the enrollment of the district used for state aid and budget authority, and all other preschool enrollmentand kindergarten students attending full time.
Capital Improvements (4000)
0
50,000
100,000
150,000
200,000
250,000
300,000
350,000
2003-2004 2004-2005 2005-2006
11/1/2005 9:15 AM Sumexpen.xls Page 12 of 19
USD# 375
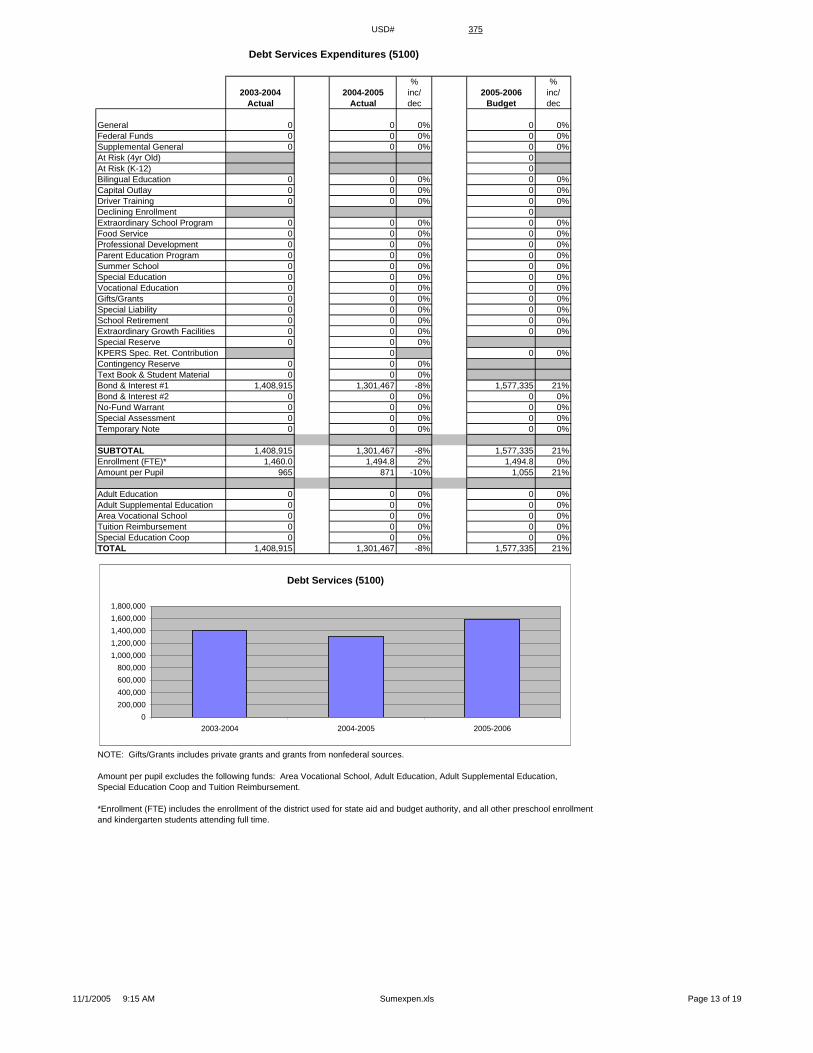
Debt Services Expenditures (5100)
% %2003-2004 2004-2005 inc/ 2005-2006 inc/
Actual Actual dec Budget dec
General 0 0 0% 0 0%Federal Funds 0 0 0% 0 0%Supplemental General 0 0 0% 0 0%At Risk (4yr Old) 0At Risk (K-12) 0Bilingual Education 0 0 0% 0 0%Capital Outlay 0 0 0% 0 0%Driver Training 0 0 0% 0 0%Declining Enrollment 0Extraordinary School Program 0 0 0% 0 0%Food Service 0 0 0% 0 0%Professional Development 0 0 0% 0 0%Parent Education Program 0 0 0% 0 0%Summer School 0 0 0% 0 0%Special Education 0 0 0% 0 0%Vocational Education 0 0 0% 0 0%Gifts/Grants 0 0 0% 0 0%Special Liability 0 0 0% 0 0%School Retirement 0 0 0% 0 0%Extraordinary Growth Facilities 0 0 0% 0 0%Special Reserve 0 0 0%KPERS Spec. Ret. Contribution 0 0 0%Contingency Reserve 0 0 0%Text Book & Student Material 0 0 0%Bond & Interest #1 1,408,915 1,301,467 -8% 1,577,335 21%Bond & Interest #2 0 0 0% 0 0%No-Fund Warrant 0 0 0% 0 0%Special Assessment 0 0 0% 0 0%Temporary Note 0 0 0% 0 0%
SUBTOTAL 1,408,915 1,301,467 -8% 1,577,335 21%Enrollment (FTE)* 1,460.0 1,494.8 2% 1,494.8 0%Amount per Pupil 965 871 -10% 1,055 21%
Adult Education 0 0 0% 0 0%Adult Supplemental Education 0 0 0% 0 0%Area Vocational School 0 0 0% 0 0%Tuition Reimbursement 0 0 0% 0 0%Special Education Coop 0 0 0% 0 0%TOTAL 1,408,915 1,301,467 -8% 1,577,335 21%
NOTE: Gifts/Grants includes private grants and grants from nonfederal sources.
Amount per pupil excludes the following funds: Area Vocational School, Adult Education, Adult Supplemental Education,Special Education Coop and Tuition Reimbursement.
*Enrollment (FTE) includes the enrollment of the district used for state aid and budget authority, and all other preschool enrollmentand kindergarten students attending full time.
Debt Services (5100)
0200,000400,000600,000800,000
1,000,0001,200,0001,400,0001,600,0001,800,000
2003-2004 2004-2005 2005-2006
11/1/2005 9:15 AM Sumexpen.xls Page 13 of 19

USD# 375
Transfers (5200)
% %2003-2004 2004-2005 inc/ 2005-2006 inc/
Actual Actual dec Budget dec
General 1,268,842 806,143 -36% 901,703 12%Federal Funds 0 0 0% 0 0%Supplemental General 541,642 938,625 73% 932,197 -1%At Risk (4yr Old) 0At Risk (K-12) 0Bilingual Education 0 0 0% 0 0%Capital Outlay 0Driver Training 0 0 0% 0 0%Declining Enrollment 0Extraordinary School Program 0 0 0% 0 0%Food Service 0 0 0% 0 0%Professional Development 0 0 0% 0 0%Parent Education Program 0 0 0% 0 0%Summer School 0 0 0% 0 0%Special Education 0 0 0% 0 0%Vocational Education 0 0 0% 0 0%Gifts/Grants 0 0 0% 0 0%Special Liability 0 0 0% 0 0%School Retirement 0 0 0% 0 0%Extraordinary Growth Facilities 0 0 0% 0 0%Special Reserve 0 0 0%KPERS Spec. Ret. Contribution 0 0 0%Contingency Reserve 0 0 0%Text Book & Student Material 0 0 0%Bond & Interest #1 0 0 0% 0 0%Bond & Interest #2 0 0 0% 0 0%No-Fund Warrant 0 0 0% 0 0%Special Assessment 0 0 0% 0 0%Temporary Note 0 0 0% 0 0%
SUBTOTAL 1,810,484 1,744,768 -4% 1,833,900 5%Enrollment (FTE)* 1,460.0 1,494.8 2% 1,494.8 0%Amount per Pupil 1,240 1,167 -6% 1,227 5%
Adult Education 0 0 0% 0 0%Adult Supplemental Education 0 0 0% 0 0%Area Vocational School 0 0 0% 0 0%Tuition Reimbursement 0 0 0% 0 0%Special Education Coop 0 0 0% 0 0%TOTAL 1,810,484 1,744,768 -4% 1,833,900 5%
NOTE: Gifts/Grants includes private grants and grants from nonfederal sources.
Amount per pupil excludes the following funds: Area Vocational School, Adult Education, Adult Supplemental Education,Special Education Coop and Tuition Reimbursement.
*Enrollment (FTE) includes the enrollment of the district used for state aid and budget authority, and all other preschool enrollmentand kindergarten students attending full time.
Transfers (5200)
0
200,000
400,000
600,000
800,000
1,000,000
1,200,000
1,400,000
1,600,000
1,800,000
2,000,000
2003-2004 2004-2005 2005-2006
11/1/2005 9:15 AM Sumexpen.xls Page 14 of 19
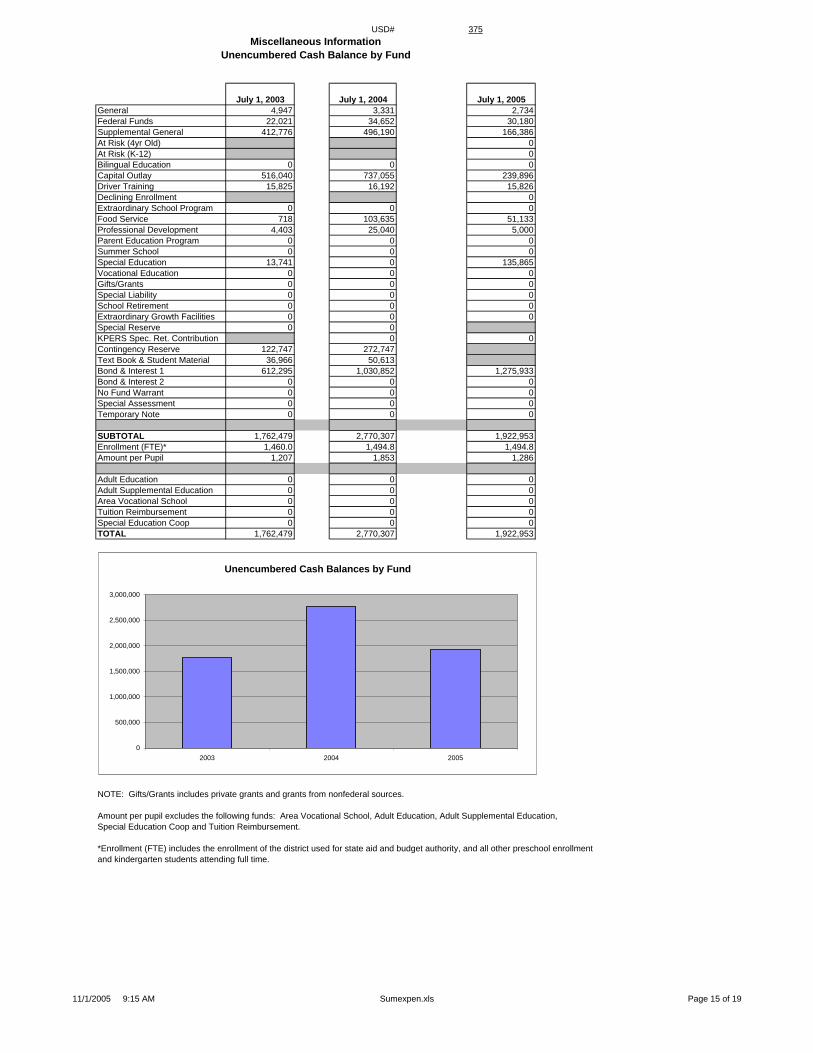
USD# 375Miscellaneous Information
Unencumbered Cash Balance by Fund
July 1, 2003 July 1, 2004 July 1, 2005General 4,947 3,331 2,734Federal Funds 22,021 34,652 30,180Supplemental General 412,776 496,190 166,386At Risk (4yr Old) 0At Risk (K-12) 0Bilingual Education 0 0 0Capital Outlay 516,040 737,055 239,896Driver Training 15,825 16,192 15,826Declining Enrollment 0Extraordinary School Program 0 0 0Food Service 718 103,635 51,133Professional Development 4,403 25,040 5,000Parent Education Program 0 0 0Summer School 0 0 0Special Education 13,741 0 135,865Vocational Education 0 0 0Gifts/Grants 0 0 0Special Liability 0 0 0School Retirement 0 0 0Extraordinary Growth Facilities 0 0 0Special Reserve 0 0KPERS Spec. Ret. Contribution 0 0Contingency Reserve 122,747 272,747Text Book & Student Material 36,966 50,613Bond & Interest 1 612,295 1,030,852 1,275,933Bond & Interest 2 0 0 0No Fund Warrant 0 0 0Special Assessment 0 0 0Temporary Note 0 0 0
SUBTOTAL 1,762,479 2,770,307 1,922,953Enrollment (FTE)* 1,460.0 1,494.8 1,494.8Amount per Pupil 1,207 1,853 1,286
Adult Education 0 0 0Adult Supplemental Education 0 0 0Area Vocational School 0 0 0Tuition Reimbursement 0 0 0Special Education Coop 0 0 0TOTAL 1,762,479 2,770,307 1,922,953
NOTE: Gifts/Grants includes private grants and grants from nonfederal sources.
Amount per pupil excludes the following funds: Area Vocational School, Adult Education, Adult Supplemental Education,Special Education Coop and Tuition Reimbursement.
*Enrollment (FTE) includes the enrollment of the district used for state aid and budget authority, and all other preschool enrollmentand kindergarten students attending full time.
Unencumbered Cash Balances by Fund
0
500,000
1,000,000
1,500,000
2,000,000
2,500,000
3,000,000
2003 2004 2005
11/1/2005 9:15 AM Sumexpen.xls Page 15 of 19

USD# 375
Reserve FundsUnencumbered Cash Balance
July 1, 2003 July 1, 2004Special Reserve 0 0TOTAL OTHER 0 0Amount per Pupil $0 $0
*School districts are authorized by law to self insure rather than purchase insurance for the following categories: Worker's Comp,Health Insurance, Life Insurance, Property and Casualty (Risk Management) and Disability Income Insurance. Monies are placedin the Self Insured Fund to pay for claims which may arise from the categories listed above.
Unencumbered Cash Balances by Fund (Reserve Funds Only)
0
0
0
0
0
1
1
1
1
1
1
2003 2004
11/1/2005 9:15 AM Sumexpen.xls Page 16 of 19

USD# 375Other Information
2001-2002 2002-2003 % 2003-2004 % 2004-2005 % 2005-2006 %Actual Actual inc/ Actual inc/ Actual inc/ Budget inc/
dec dec dec dec
Enrollment (FTE)* 1,486.5 1,475.8 -1% 1,481.5 0% 1,494.8 1% 1,494.8 0%
Enrollment (FTE)** 1,486.5 1,475.8 -1% 1,460.0 -1% 1,494.8 2% 1,494.8 0%Number of Students - Free Meals 234 230 -2% 278 21% 249 -10% 250 0%Number of Students - Reduced Meals 103 135 31% 133 -1% 135 2% 250 85%
*FTE for state aid and budget authority purposes for general fund.
** FTE includes 9/20 enrollment used for state aid purposes and adding the additional FTE for preschool programs, headstart, and all-daykindergarten. For example, preschool students attending half days on September 20th would be counted as .5 FTE. Kindergartenstudents attending full time every day would be counted as 1.0 FTE.
Enrollment (FTE)* for Budget Authority
0.0
200.0
400.0
600.0
800.0
1000.0
1200.0
1400.0
1600.0
2001-2002 2002-2003 2003-2004 2004-2005 2005-2006
Low Income Students
0
50
100
150
200
250
300
2001-2002 2002-2003 2003-2004 2004-2005 2005-2006
Free MealsReduced Meals
Enrollment (FTE)** Used for Calculating "Amount Per Pupil"
1440.0
1450.0
1460.0
1470.0
1480.0
1490.0
1500.0
2001-2002 2002-2003 2003-2004 2004-2005 2005-2006
11/1/2005 9:15 AM Sumexpen.xls Page 17 of 19
USD# 375
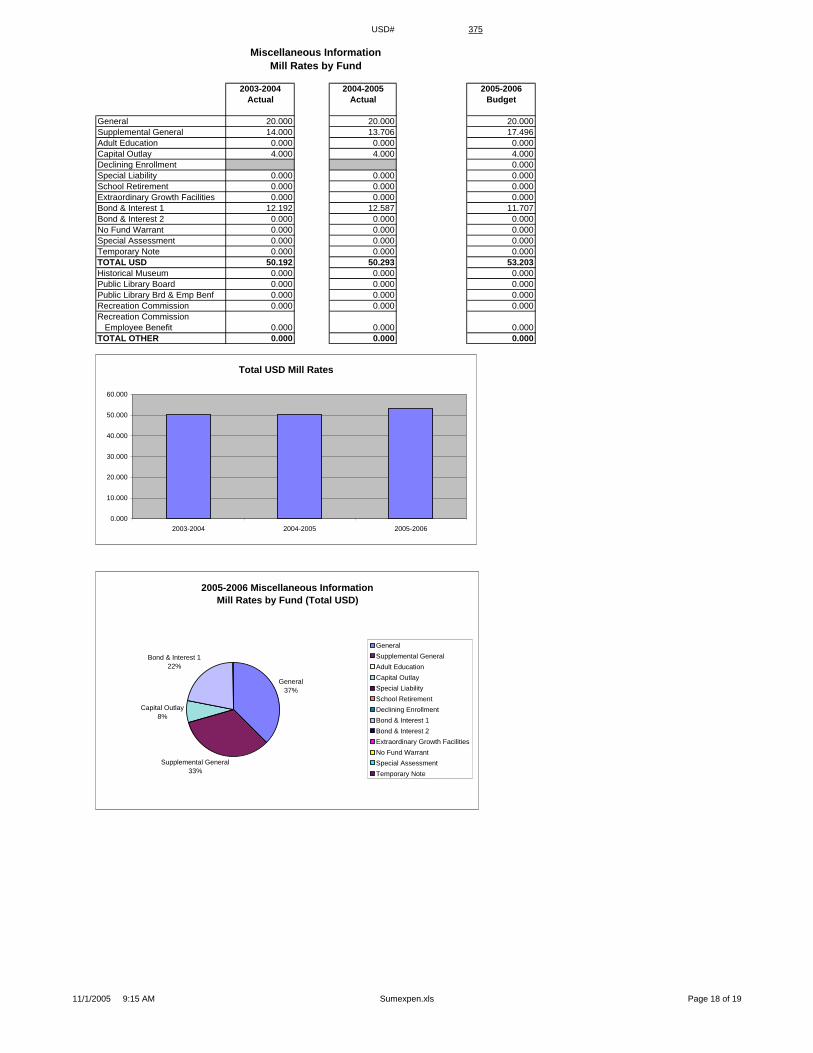
Miscellaneous InformationMill Rates by Fund
2003-2004 2004-2005 2005-2006Actual Actual Budget
General 20.000 20.000 20.000Supplemental General 14.000 13.706 17.496Adult Education 0.000 0.000 0.000Capital Outlay 4.000 4.000 4.000Declining Enrollment 0.000Special Liability 0.000 0.000 0.000School Retirement 0.000 0.000 0.000Extraordinary Growth Facilities 0.000 0.000 0.000Bond & Interest 1 12.192 12.587 11.707Bond & Interest 2 0.000 0.000 0.000No Fund Warrant 0.000 0.000 0.000Special Assessment 0.000 0.000 0.000Temporary Note 0.000 0.000 0.000TOTAL USD 50.192 50.293 53.203Historical Museum 0.000 0.000 0.000Public Library Board 0.000 0.000 0.000Public Library Brd & Emp Benf 0.000 0.000 0.000Recreation Commission 0.000 0.000 0.000Recreation Commission Employee Benefit 0.000 0.000 0.000TOTAL OTHER 0.000 0.000 0.000
2005-2006 Miscellaneous InformationMill Rates by Fund (Total USD)
General37%
Supplemental General33%
Capital Outlay8%
Bond & Interest 122%
GeneralSupplemental GeneralAdult EducationCapital OutlaySpecial LiabilitySchool RetirementDeclining EnrollmentBond & Interest 1Bond & Interest 2Extraordinary Growth FacilitiesNo Fund WarrantSpecial AssessmentTemporary Note
Total USD Mill Rates
0.000
10.000
20.000
30.000
40.000
50.000
60.000
2003-2004 2004-2005 2005-2006
11/1/2005 9:15 AM Sumexpen.xls Page 18 of 19

USD# 375Other Information
2003-2004 2004-2005 2005-2006Actual Actual Budget
Assessed Valuation $104,590,799 $111,938,282 $121,908,130
Bonded Indebtedness $17,970,000 $17,500,000 $17,945,000
Assessed Valuation
$0
$20,000,000
$40,000,000
$60,000,000
$80,000,000
$100,000,000
$120,000,000
$140,000,000
2003-2004 2004-2005 2005-2006
Bonded Indebtedness
$0
$2,000,000
$4,000,000
$6,000,000
$8,000,000
$10,000,000
$12,000,000
$14,000,000
$16,000,000
$18,000,000
$20,000,000
2003-2004 2004-2005 2005-2006
11/1/2005 9:15 AM Sumexpen.xls Page 19 of 19