citation for published version - university of...
TRANSCRIPT

Research Archive
Citation for published version:I. J. M. Crossfield, et al, ‘197 CANDIDATES AND 104 VALIDATED PLANETS IN K2ʼs FIRST FIVE FIELDS’, The Astrophysical Journal Supplement Series, Vol. 226 (1):7, September 2016.
DOI:http://dx.doi.org/10.3847/0067-0049/226/1/7
Document Version:This is the Published Version.
Copyright and Reuse: © 2016. The American Astronomical Society. All rights reserved.
Content in the UH Research Archive is made available for personal research, educational, and non-commercial purposes only. Unless otherwise stated, all content is protected by copyright, and in the absence of an open license, permissions for further re-use should be sought from the publisher, the author, or other copyright holder.
EnquiriesIf you believe this document infringes copyright, please contact the Research & Scholarly Communications Team at [email protected]

197 CANDIDATES AND 104 VALIDATED PLANETS IN K2ʼs FIRST FIVE FIELDS
Ian J. M. Crossfield1,28,30
, David R. Ciardi2, Erik A. Petigura
3,31, Evan Sinukoff
4,32, Joshua E. Schlieder
2,5,33,
Andrew W. Howard4, Charles A. Beichman
2, Howard Isaacson
6, Courtney D. Dressing
3,30, Jessie L. Christiansen
2,
Benjamin J. Fulton4,34
, Sébastien Lépine7, Lauren Weiss
6, Lea Hirsch
6, John Livingston
8, Christoph Baranec
9,
Nicholas M. Law10, Reed Riddle
11, Carl Ziegler
10, Steve B. Howell
5, Elliott Horch
12, Mark Everett
13,
Johanna Teske14, Arturo O. Martinez
7,15, Christian Obermeier
16, Björn Benneke
3, Nic Scott
17, Niall Deacon
18,
Kimberly M. Aller4, Brad M. S. Hansen
19, Luigi Mancini
16, Simona Ciceri
16,20, Rafael Brahm
21,22, Andrés Jordán
21,22,
Heather A. Knutson3, Thomas Henning
16, Michaël Bonnefoy
23,24, Michael C. Liu
4, Justin R. Crepp
25,
Joshua Lothringer1, Phil Hinz
26, Vanessa Bailey
26,27, Andrew Skemer
26,28, and Denis Defrere
23,24,29
1 Lunar & Planetary Laboratory, University of Arizona, 1629 E. University Boulevard., Tucson, AZ, USA2 NASA Exoplanet Science Institute, California Institute of Technology, Pasadena, CA, USA3 Geological and Planetary Sciences, California Institute of Technology, Pasadena, CA, USA
4 Institute for Astronomy, University of Hawai‘i at Mānoa, Honolulu, HI, USA5 NASA Ames Research Center, Moffett Field, CA, USA
6 Astronomy Department, University of California, Berkeley, CA, USA7 Department of Physics and Astronomy, Georgia State University, GA, USA
8 Department of Astronomy, The University of Tokyo, 7-3-1 Bunkyo-ku, Tokyo 113-0033, Japan9 Institute for Astronomy, University of Hawai‘i at Mānoa, Hilo, HI, USA
10 Department of Physics and Astronomy, University of North Carolina at Chapel Hill, Chapel Hill, NC, USA11 Division of Physics, Mathematics, and Astronomy, California Institute of Technology, Pasadena, CA, USA
12 Department of Physics, Southern Connecticut State University, New Haven, CT, USA13 National Optical Astronomy Observatory, Tucson, AZ, USA
14 Carnegie Department of Terrestrial Magnetism, Washington, DC, USA15 Department of Astronomy, San Diego State University, San Diego, CA, USA
16 Max Planck Institut für Astronomie, Heidelberg, Germany17 Sydney Institute of Astronomy, The University of Sydney, Redfern, Australia
18 Centre for Astrophysics Research, University of Hertfordshire, UK19 Department of Physics & Astronomy and Institute of Geophysics & Planetary Physics, University of California Los Angeles, Los Angeles, CA, USA
20 Department of Astronomy, Stockholm University, SE-106 91 Stockholm, Sweden21 Millennium Institute of Astrophysics, Av. Vicuña Mackenna 4860, 7820436 Macul, Santiago, Chile
22 Instituto de Astrofísica, Facultad de Física, Pontificia Universidad Católica de Chile, Av. Vicuña Mackenna 4860, 7820436 Macul, Santiago, Chile23 Univ. Grenoble Alpes, IPAG, F-38000, Grenoble, France
24 CNRS, IPAG, F-38000, Grenoble, France25 Department of Physics, University of Notre Dame, 225 Nieuwland Science Hall, Notre Dame, IN, USA
26 Steward Observatory, The University of Arizona, Tucson, AZ, USA27 Kavli Institute for Particle Astrophysics and Cosmology, Stanford University, Stanford, CA, USA
28 Department of Astronomy, University of California, Santa Cruz, Santa Cruz, CA, USA29 Departement d’Astrophysique, Geophysique et Oceanographie, Universite de Liege, B-4000 Sart Tilman, Belgium
Received 2016 April 1; revised 2016 June 20; accepted 2016 June 20; published 2016 September 2
ABSTRACT
We present 197 planet candidates discovered using data from the first year of the NASA K2 mission (Campaigns0–4), along with the results of an intensive program of photometric analyses, stellar spectroscopy, high-resolutionimaging, and statistical validation. We distill these candidates into sets of 104 validated planets (57 in multi-planetsystems), 30 false positives, and 63 remaining candidates. Our validated systems span a range of properties, withmedian values of RP= ÅR2.3 , P=8.6 days, Teff=5300 K, and Kp=12.7 mag. Stellar spectroscopy providesprecise stellar and planetary parameters for most of these systems. We show that K2 has increased by 30% thenumber of small planets known to orbit moderately bright stars (1–4 R⊕, Kp=9–13mag). Of particular interestare 76 planets smaller than 2 R⊕, 15 orbiting stars brighter than Kp=11.5mag, 5 receiving Earth-like irradiationlevels, and several multi-planet systems—including 4 planets orbiting the M dwarf K2–72 near mean-motionresonances. By quantifying the likelihood that each candidate is a planet we demonstrate that our candidate samplehas an overall false positive rate of 15%–30%, with rates substantially lower for small candidates (< ÅR2 ) andlarger for candidates with radii > ÅR8 and/or with <P 3 days. Extrapolation of the current planetary yieldsuggests that K2 will discover between 500 and 1000 planets in its planned four-year mission, assuming sufficientfollow-up resources are available. Efficient observing and analysis, together with an organized and coherentfollow-up strategy, are essential for maximizing the efficacy of planet-validation efforts for K2, TESS, and futurelarge-scale surveys.
The Astrophysical Journal Supplement Series, 226:7 (20pp), 2016 September doi:10.3847/0067-0049/226/1/7© 2016. The American Astronomical Society. All rights reserved.
30 NASA Sagan Fellow.31 Hubble Fellow.32 NSERC Postgraduate Research Fellow.33 NASA Postdoctoral Program Fellow.34 NSF Graduate Research Fellow.
1

Key words: catalogs – planets and satellites: fundamental parameters – planets and satellites: general – techniques:high angular resolution – techniques: photometric – techniques: spectroscopic
Supporting material: machine-readable tables
1. INTRODUCTION
Planets that transit their host stars offer unique opportunitiesto characterize planetary masses, radii, and densities; atmo-spheric composition, circulation, and chemistry; dynamicalinteractions in multi-planet systems; and orbital alignments andevolution, to name just a few aspects of interest. Transitingplanets are also the most common type of exoplanet known,thanks in large part to NASA’s Kepler spacecraft. Data fromKepler’s initial four-year survey revealed over 4000 candidateexoplanets and many confirmed and validated planets35 (e.g.,Coughlin et al. 2016; Morton et al. 2016). A majority of allexoplanets known today were discovered by Kepler. After thespacecraft’s loss of a second reaction wheel in 2014, themission was renamed K2 and embarked on a new survey of theecliptic plane, divided into campaigns of roughly 80 days each(Howell et al. 2014). In terms of survey area, temporalcoverage, and data release strategy, K2 provides a naturaltransition from Kepler to the TESS mission (Ricker et al. 2014).Kepler observed 1/400th of the sky for four years (initiallywith a default proprietary period), while TESS will observenearly the entire sky for �27 days,36 with no defaultproprietary period.
In its brief history K2 has already made many newdiscoveries. The mission’s data have helped to revealoscillations in variable stars (Angus et al. 2016) and discoveredeclipsing binaries (LaCourse et al. 2015; Armstrong et al. 2016;David et al. 2016a), supernovae (Zenteno et al. 2015), largenumbers of planet candidates (Foreman-Mackey et al. 2015;Adams et al. 2016; Vanderburg et al. 2016), and a growingsample of validated and/or confirmed planets (e.g., Vander-burg & Johnson 2014; Crossfield et al. 2015; Huang et al.2015; Montet et al. 2015; Sanchis-Ojeda et al. 2015; Sinukoffet al. 2016). Here, we report our identification and follow-upobservations of 197 candidate planets using K2 data. Using allavailable observations and a robust statistical framework, wevalidate 104 of these as true, bona fide planets, and for theremaining systems we discriminate between obvious falsepositives and a remaining subset of plausible candidatessuitable for further follow-up.
In Section 2 we review our target sample, photometry andtransit search, and initial target vetting. Section 3 describes oursupporting ground-based observations (stellar spectroscopy andhigh-resolution imaging; HRI), while Section 4 describes ourderivation of stellar parameters. These are followed by ourintensive transit light curve analysis in Section 5, theassessment of FPPs for our candidates in Section 6, and adiscussion of the results, interesting trends, and noteworthyindividual systems in Section 7. Finally, we conclude andsummarize in Section 8.
2. K2 TARGETS AND PHOTOMETRY
2.1. Target Selection
In the analysis that follows we use data from all K2 targets(not just those in our own General Observer proposals37).Huber et al. (2016) present the full distribution of stellar typesobserved by K2. For completeness we describe here our targetselection strategy, which has successfully proposed forthousands of FGK and M dwarfs through two parallel efforts.We select our FGK stellar sample from the all-sky TESS
Dwarf Catalog (TDC; Stassun et al. 2014). The TDC consistsof 3 million F5–M5 candidate stars selected from 2MASS andcross-matched with the NOMAD, Tycho-2, Hipparcos,APASS, and UCAC4 catalogs to obtain photometric colors,proper motions, and parallaxes. We remove giant stars basedon reduced proper motion versus J−H color (see CollierCameron et al. 2007), and generate a magnitude-limited dwarfstar sample from the merged TDC/EPIC by requiringKp< 14mag for these FGK stars. We impose an anti-crowdingcriterion and remove all targets with a second star in EPIC(complete down to Kp∼ 19 mag; Huber et al. 2016) within 4arcsec (approximately the Kepler pixel size). This last criterionremoves <1% of the FGK stars in our proposed samples,improves catalog reliability by reducing false positives, andsimplifies subsequent vetting and Doppler follow-up.We draw our late-type (K and M dwarf) stellar sample
primarily from the SUPERBLINK proper motion database (SB,Lépine & Shara 2005) and the PanSTARRS-1 survey (PS1,Kaiser 2002). We use a combination of reduced proper motion,optical/NIR color cuts, and/or SED fitting to capture themajority of M dwarfs (>85%) within 100 pc with littlecontamination from distant giants. In some K2 campaigns wesupplement our initial database using SDSS, PS1, and/or otherphotometry to identify additional targets with smaller propermotions (following Aller et al. 2013). We estimate approximatespectral types (SpTs) using tabulated photometric relations(Kraus & Hillenbrand 2007; Pecaut & Mamajek 2013;Rodriguez et al. 2013) and convert SpTs into stellar radii(R*) based on interferometric studies (Boyajian et al. 2012).Our exact selection criteria for K and M dwarfs have evolvedwith time, but we typically prioritize this low-temperaturestellar sample by requiring a signal-to-noise ratio (S/N)8for a single transit of an Earth-sized planet, assuming thedemonstrated photometric precision of K2. We additionally seta magnitude limit of Kp<16.5 mag on this late-type dwarfsample to allow feasible spectroscopic characterization.
2.2. Time-series Photometry
Our team’s photometric pipeline (described by, e.g., Cross-field et al. 2015; Petigura et al. 2015 builds on the approachoriginally outlined by Vanderburg & Johnson (2014). Weextract time-series photometry from the target pixel filesprovided by the project using circular, stationary, soft-edgedapertures. During K2 operations, solar radiation pressure35 We distinguish “confirmed” systems (with measured masses) from
“validated” systems (whose planetary nature has been statistically demon-strated, e.g., with false positive probability (FPP) <1%).36 Smaller fractions of the sky will be observed for up to 351 days.
37 K2 Programs 79, 120, 1002, 1036, 2104, 2106, 2107, 3104, 3106, 3107,4011, 4033.
2
The Astrophysical Journal Supplement Series, 226:7 (20pp), 2016 September Crossfield et al

torques the spacecraft, causing it to roll around the boresight.This motion causes a typical target star to drift across the CCDby ∼1 pixel every ∼6 hr. This motion of stars across the CCD,when combined with inter- and intra-pixel sensitivity variationsand aperture losses, results in significant changes in ouraperture photometry.
We remove these stellar brightness variations that correlatewith spacecraft orientation by first solving for the roll anglebetween each frame and an arbitrary reference frame usingroughly 100 stars of Kp∼ 12 mag on an arbitrary outputchannel. Then, we model the time- and roll-dependentbrightness variations using a Gaussian process with asquared-exponential kernel. We apply apertures with radiiranging from 1 to 7 pixels and select the aperture thatminimizes the residual noise in the corrected light curve(computed on three-hour timescales). This minimizationbalances two competing effects: larger apertures yield smallersystematic errors (because aperture losses are smaller), whilesmaller apertures incur less background noise. All of ourprocessed light curves are available for download at theNExScI ExoFOP website.38
2.3. Identifying Transit-like Signals
We search our calibrated photometry for planetary transitsusing the TERRA algorithm (Petigura et al. 2013a). Afterrunning TERRA, we flag stars with putative transits havingS/N>12 as threshold-crossing events (TCEs) for visualinspection. Below this level, transit signals surely persist butTCEs become dominated by spurious detections. Residualoutliers in our photometry prevent us from identifying largenumbers of candidates at lower S/N. In order to reduce thenumber of spurious detections we require that TCEs haveorbital periods P 1 days, and that they also show threetransits. This last criterion sets an upper bound to the longestperiod detectable in our survey at half the campaign baseline,or ∼37 days.39 Thus many longer-period planets likely remainto be found in these data sets, in a manner analogous to thediscovery of HIP-116454b in K2’s initial engineering run(Vanderburg et al. 2016) and additional single-transit candi-dates identified in Campaigns 1–3 (Osborn et al. 2016).
In our analysis, each campaign yields roughly 1000 TCEs.The distribution of their orbital periods, shown in Figure 1,reveals discrete peaks at P=1.5, 2, 4, 8, and 16 days. Thesesharp peaks likely correspond to the 6 hr periodicity of small-scale maneuvering tweaks to rebalance solar pressure and/or tothe 48 hr periodicity of K2’s reaction wheel momentum dumps(Van Cleve et al. 2016). Both these effects could inducecorrelated photometric jitter on integer multiples of thistimescale. We also see a smoother increase in TCEs towardlonger periods (P 16 days) that our manual vetting (describedbelow) shows as corresponding to an increasing false positiverate (FPR) for TCEs showing just 3–5 transit-like events.
In each campaign, our manual vetting process begins withthese TCEs and results in well-defined lists of astrophysicalvariables, including robust planet candidates for further follow-up and validation. TERRA produces a set of diagnostics forevery TCE with a detection above our S/N limit, which we useto determine whether the event was likely caused by a
candidate planet, eclipsing binary, periodic variable, or noise.The diagnostics include a summary of basic fit parameters anda suite of diagnostic plots to visualize the nature of the TCE.These plots include the TERRA periodogram, a normalizedphase-folded light curve with a best-fit model, the light curvephased to 180° to look for eclipses or misidentified periods, themost probable secondary eclipse identified at any phase, and anautocorrelation function. When vetting, the user flags each TCEas an object of interest or not, where objects of interest can beeither candidate planets, eclipsing binaries, or variable stars.We elevate any TCE showing no obvious warning signs to thestatus of “planet candidate,” i.e., an event that is almost surelyastrophysical in nature, possibly a transiting planet, and notobviously a false positive scenario like a background eclipsingbinary. We quantify the FPPs of all our candidates in Section 6.Figure 2 shows an example of a TERRA-derived light curve fora typical candidate.Once we identify a candidate, we re-run TERRA to search for
additional planets in that system as described by Sinukoff et al.(2016). In brief, we mask out the photometry associated withtransits of the previously identified candidate and run TERRAagain to look for additional box-shaped signals. We repeat thisprocess until no candidates are identified with S/N>8 or thenumber of candidates exceeds five. We typically find <10multi-candidate systems per campaign, with a maximum offour planets detected per star.
3. SUPPORTING OBSERVATIONS
3.1. High-resolution Spectroscopy: Observations
3.1.1. Keck/HIRES
We obtained high-resolution optical spectra of 83 planetcandidate hosts using the HIRES echelle spectrometer(Vogt 1994) on the 10 m Keck I telescope. These spectra werecollected using the standard procedures of the California PlanetSearch (CPS; Howard et al. 2010). We used the “C2” decker( ´ 0. 87 14 slit), which is long enough to simultaneouslymeasure the spectra of the target star and the sky background
Figure 1. Distribution of orbital periods of transit-like signals identified in ouranalysis. The pale, narrow-binned histogram (axis at right) indicates theThreshold-Crossing Events (TCEs) identified by TERRA in our initial transitsearch (see Section 2). The coarser histograms (axis at left) indicate thecumulative distributions of 104 validated planets (blue-green; FPP<0.01), 30false positive systems (red; FPP>0.99), and 63 candidates of indeterminatestatus (orange).
38 https://exofop.ipac.caltech.edu39 The handful of candidates with >P 37 days were found by visualinspection.
3
The Astrophysical Journal Supplement Series, 226:7 (20pp), 2016 September Crossfield et al

with spectral resolution R=55,000. The sky was subtractedfrom each stellar spectrum. We used the HIRES exposure meterto automatically terminate each exposure once the desired S/Nwas reached, typically after 1–20 minutes. For stars withV<13.0mag, exposure levels were set to achieve S/N=45per pixel at 550 nm. Exposures of fainter stars were terminatedat S/N=32 per pixel—enough to derive stellar parameterswhile keeping exposure times reasonable. For stars that werepart of subsequent Doppler campaigns, we measured additionalHIRES spectra with higher S/N. These RV measurements willbe the subject of a series of forthcoming papers.
3.1.2. Automated Planet Finder (APF)/Levy
We obtained spectra of 27 candidate host stars using theLevy high-resolution optical spectrograph mounted at the APF.Each spectrum covers a continuous wavelength range from 374to 970 nm. We observed the stars using either the 2″×8″ slitfor a spectral resolution of R≈80,000, or, to minimize skycontamination, the 1″×3″ slit for a spectral resolution ofR≈100,000. We initially observed all bright targets using the2″×8″ slit to maximize S/N but soon noticed that skycontamination was a serious problem on nights with a full orgibbous moon. All APF spectra collected after 2015 May 21were observed using the 1″×3″ decker. In all cases, wecollected three consecutive exposures and combined theextracted 1D spectra using a sigma-clipped mean to rejectcosmic rays. All targets were observed at just a single epoch.The final S/N of the combined spectra ranges from roughly 25to 50 per pixel.
3.1.3. MPG 2.2 m/FEROS
We obtained spectra of a small number of candidate stellarhosts using the FEROS fiber-fed echelle spectrograph (Kaufer& Pasquini 1998) at the 2.2 m MPG telescope. Each spectrumcovers a continuous wavelength range from 350 to 920 nm withan average resolution of R∼48,000. Our FEROS exposuretimes were chosen according to the brightness of each targetand ranged from 10 to 30 minutes. Simultaneously with thescience images we acquired spectra of a ThAr lamp forwavelength calibration.
The FEROS data are processed through a dedicated pipelinebuilt from a modular code (CERES, R. Brahm et al. 2016, inpreparation) designed to reduce, extract and analyze data fromdifferent echelle spectrographs in an automated, homogeneousand robust way. This pipeline is similar to the calibration andoptimal extraction approach described by Jordán et al. (2014).
We compute a global wavelength solution from the calibrationThAr image by fitting a Chebyshev polynomial as function ofthe pixel position and echelle order number. The instrumentalvelocity drifts during the night are computed using the theextracted spectra of the ThAr lamp acquired during the scienceobservations with the reference fiber. The barycentric correc-tion is performed using the JPLephem package. Radialvelocities (RVs) and bisector spans are determined by cross-correlating the continuum-normalized stellar spectrum with abinary mask derived from a G2 dwarf’s spectrum (for moredetails see, e.g., Baranne et al. 1979; Queloz 1995). Wenormalize the stellar continuum to minimize the systematicerrors that would be induced in the derived velocity bydifferences in spectral slope caused by different reddening orstellar type.
3.2. High-resolution Spectroscopy: Methods and Results
As part of our false positive analysis (described in Section 6),we use our high-resolution Keck/HIRES spectra to search foradditional spectral lines in the stellar spectra. This method issensitive to secondary stars that lie within 0 4 of the primarystar (one half of the slit width) and that are as faint as 1% of theapparent brightness of the primary star (Kolbl et al. 2015). Theapproach therefore complements the AO and speckle imagingdescribed in Section 3.3 (Ciardi et al. 2015; Teske et al. 2015).The search for secondary lines in the HIRES spectra begins
with a match of the primary spectrum to a catalog of nearby,slowly rotating, FGKM stars from the CPS. The best matchfrom the catalog is identified, subtracted from the primaryspectrum, and the residuals are then searched (using the samecatalog) to identify any fainter second spectrum. This method isinsensitive to companion stars with velocity offsets of10 km s−1, in which cases multiple stellar lines would beblended too closely together. This method is optimized forslowly rotating FGKM stars, so stars earlier than F and thosewith > -v isin 10 km s 1 are more difficult to detect due totheir having fewer and/or broader spectral lines. The techniqueis less sensitive for stars with Teff3500K due to the smallnumber of such stars in the CPS catalog. The derivedconstraints for all targets are listed in Table 3, and we usethem in our false positive analysis described in Section 6.Figure 3 shows an example of a Keck/HIRES spectrum,together with the secondary line search results and derivedstellar parameters (see Section 4).We performed a similar analysis for the subset of stars
observed by the FEROS spectrograph. Table 1 lists these stars,
Figure 2. Example light curve of K2-77 (EPIC 210363145), which hosts one validated planet: (a) during all of Campaign 4, with individual transit times indicated,and (b) phase-folded, with the best-fit transit model overplotted in red. The transit parameters for all candidates are listed in Table 8.
4
The Astrophysical Journal Supplement Series, 226:7 (20pp), 2016 September Crossfield et al

most of which host candidate hot Jupiters. Three show obvioussigns of multiple peaks in the stellar cross-correlation,indicating these sources are blends of multiple stars; a fourthshows an extremely high rotational velocity. As described inSection 6, we find FPPs of >50% for all four of these systems,indicating that most are likely false positives and low-prioritytargets for future follow-up.
By obtaining FEROS spectra at multiple epochs, we detectRV variations from EPIC205148699 in phase with the transitsignal and with semi-amplitude ~K 28 kms−1, indicating thatthis system is an eclipsing stellar binary. For EPIC201626686,11 RV measurements over 40 days reveal variations at the levelof±50ms−1. Since these variations are not in phase with theorbital period of the detected transits, we do not consider thissystem to be a false positive. Finally, multiple RV measure-ments also set as an upper limit on the RV variations of K2-24(EPIC 203771098) of <20 ms−1 (consistent with the analysisof Petigura et al. 2016). Our analysis in Section 6 ultimately
finds FPP<0.01 for all three of these systems, indicating thatthese are validated planets.Single-epoch FEROS observations reveal that both K2-19
(EPIC 201505350) and EPIC 201862715 are single-lined dwarfstars, consistent with our validation of the former (the latter hasa close stellar companion that prevents us from validating thesystem; see Section 6). A second observation of K2-19 takenthree days later shows an RV variation of ∼20ms−1, roughlyconsistent with the RV signal reported by Barros et al. (2015).
3.3. High-resolution Imaging
3.3.1. Observations
We obtained HRI for 164 of our candidate systems. Ourprimary instrument for this work was NIRC2 at the 10 mKeckII telescope, with which we observed 110 systems. Mostwere observed in Natural Guide Star (NGS) mode, though weused Laser Guide Star (LGS) mode for a subset of targetsorbiting fainter stars. As part of multi-semester program GN-2015B-LP-5 (PI Crossfield) at Gemini Observatory, weobserved 40 systems with the NIRI camera (Hodapp 2003) inthe K-band using NGS or LGS modes. We also observed 33stars with PHARO/PALM-3000 (Hayward et al. 2001; Dekany
Figure 3. Example Keck/HIRES stellar spectrum (blue), template match (black), and derived parameters for K2-77 (EPIC 210363145). The star has low v isin ,moderate Teff , and shows no evidence for additional stellar companions in the spectroscopic autocorrelation function (ACF). The upper-right panel plots the derivedstellar parameters against the parameters of the SpecMatch template stars. Stellar parameters for all targets are listed in Table 7, and results of ACF analyses are inTable 3.
Table 1FEROS Follow-up Observations
EPIC Observation Note
201176672 Multiple peaks in CCF; likely stellar blend.201270176 Multiple peaks in CCF; likely stellar blend.202088212 Multiple peaks in CCF; likely stellar blend.203929178 Multiple peaks in CCF; likely stellar blend.204873331 Multiple peaks in CCF; likely stellar blend.203485624 Very broad CCF peak, >v isin 50 kms−1.205148699 Single-peaked CCF, phased RV variations of±28kms−1.201626686 Single-peaked CCF, unphased RV jitter of±50ms−1.203771098 Single-peaked CCF, RV variations <20ms−1.201505350 Single-peaked CCF, ∼20ms−1 RV variation between two
epochs.201862715 Single-peaked CCF.
Table 2False Positive Rates
Category FP Rate
ÅR R2P 0.07 ÅR R2 8P 0.08 ÅR R8P 0.54P 3 days 0.36 P3 15 0.12P 15 days 0.21
Entire Sample 0.20
5
The Astrophysical Journal Supplement Series, 226:7 (20pp), 2016 September Crossfield et al

et al. 2013) at the 5 m Hale Telescope and 14 systems withLMIRCam at LBT (Leisenring et al. 2012), all at the K-band.We observed 39 stars at visible wavelengths using theautomated Robo-AO laser adaptive optics system at thePalomar 1.5 m telescope (Baranec et al. 2013, 2014). These
Table 3HIRES Follow-up Observations
EPIC Flag Note
201295312 1 1%201338508 1 1%201367065 1 1%201384232 1 1%201393098 1 1%201403446 1 1%201445392 1 1%201465501 1 1%201505350 1 1%201546283 1 1%201549860 1 1%201577035 1 1%201613023 1 1%201629650 1 1%201647718 1 1%201677835 1 1%201702477 1 1%201713348 1 1%201736247 1 1%201754305 1 1%201828749 1 1%201912552 1 1%201920032 1 1%202071401 1 1%202083828 1 1%202089657 1 1%202675839 1 1%203771098 1 1%203826436 1 1%204129699 1 1%204221263 1 1%204890128 1 1%205071984 1 1%205570849 1 1%205916793 1 1%205924614 1 1%205944181 1 1%205999468 1 1%206011496 1 1%206011691 1 1%206024342 1 1%206026136 1 1%206026904 1 1%206036749 1 1%206038483 1 1%206044803 1 1%206061524 1 1%206096602 1 1%206101302 1 1%206125618 1 1%206144956 1 1%206153219 1 1%206154641 1 1%206155547 1 1%206159027 1 1%206181769 1 1%206192335 1 1%206245553 1 1%206247743 1 1%206268299 1 1%206348688 1 1%206432863 1 1%206439513 1 1%206495851 1 1%
Table 3(Continued)
EPIC Flag Note
210363145 1 1%210389383 1 1%210400751 1 1%210402237 1 1%210403955 1 1%210414957 1 1%210448987 1 1%210483889 1 1%210484192 1 1%210508766 1 1%210577548 1 1%210609658 1 1%210666756 1 1%210707130 1 1%210718708 1 1%210731500 1 1%210754505 1 1%210894022 1 1%210957318 1 1%210968143 1 1%211089792 1 1%211099781 1 1%211152484 1 1%201637175 2 N/A; star too cool203710387 2 N/A; star too cool202126852 3 N/A; high v isin202126888 3 N/A; high v isin205703094 3 N/A; Vsini too high208833261 3 N/A; high v isin210954046 3 N/A; high v isin210958990 3 N/A; high v isin211147528 3 N/A; high v isin206027655 4 Marginal detection of 5% binary at −10 kms−1.206028176 4 Marginal detection at 10 kms−1 separation201324549 5 triple star system; 2̃0% brightness202088212 5 companion; 3–13% as bright as primary; 25 kms−1.203753577 5 15% companion at 16 kms−1 separation205947161 5 Nearly equal flux binary206135267 5 Obvious Binary; 50% flux of primary206267115 5 SB2; near equal at 80 kms−1
206543223 5 SB2; 23% flux of primary209036259 5 Obvious triple system.210401157 5 Strange, composite spectrum.210513446 5 SB2; 2% companion at del-RV=122 kms−1
210558622 5 SB2; 3% companion at del-RV=119 kms−1
210744674 5 SB2; equal flux secondary210789323 5 SB2; 22% companion at del-RV=−83 kms−1
210903662 5 SB2; near equal binary
Notes.1 No detection of second spectrum at noted flux ratio.2 Star is unfit for ReaMatch: Teff below 3500 K.3 Star is unfit for ReaMatch: v sin i above 10 km s−1.4 Ambiguous detection.5 Obvious detection.
(This table is available in machine-readable form.)
6
The Astrophysical Journal Supplement Series, 226:7 (20pp), 2016 September Crossfield et al
data were acquired and reduced separately using the standardRobo-AO procedures outlined by Law et al. (2014).We acquired the data from all our large-aperture AO
observations (NIRC2, NIRI, LMIRCam, PHARO) in aconsistent manner. We observed at up to nine dither positions,using integration times short enough to avoid saturation(typically �60 s). We use the dithered images to remove skybackground and dark current, and then align, flat-field, andstack the individual images.Through our Long-Term Gemini program we also acquired
high-resolution speckle imaging of 32 systems in narrowbandfilters centered at 692 and 880 nm using the DSSI camera(Horch et al. 2009, 2012) at the Gemini North telescope. TheDSSI observing procedure is typically to center the target starin the field, set up guiding, and take data using 60 msexposures. The total integration time varies by target brightnessand observing conditions. We measure background sensitivityin a series of concentric annuli around the target star. Theinnermost data point represents the telescope diffraction limit,within which we set our sensitivity to zero. After measuring oursensitivity across the DSSI field of view, we interpolatethrough the measurements using a cubic spline to produce asmooth sensitivity curve.
3.3.2. Contrast and Stellar Companions
We estimate the sensitivity of all our HRI data by injectingfake sources into the final combined images with separations atintegral multiples of the central source’s FWHM (see, e.g.,Adams et al. 2012; Ziegler et al. 2016). Figure 4 shows anexample of a Keck/NIRC2 NGS image and the resulting 5σcontrast curve. The median contrast curves achieved by eachHRI instrument are shown in Figure 5 together with all detectedstellar companions. The companions are also listed in Table 5.Contrast curves for each individual system are uploaded to theExoFOP website. In addition, Table 10 includes the totalintegration times and filters used for all candidates observed inour follow-up efforts.The contrast curves are plotted in the band of observations,
which ranges from optical wavelengths (DSSI; Robo-AO) tothe K-band (large-aperture AO systems). These in-band
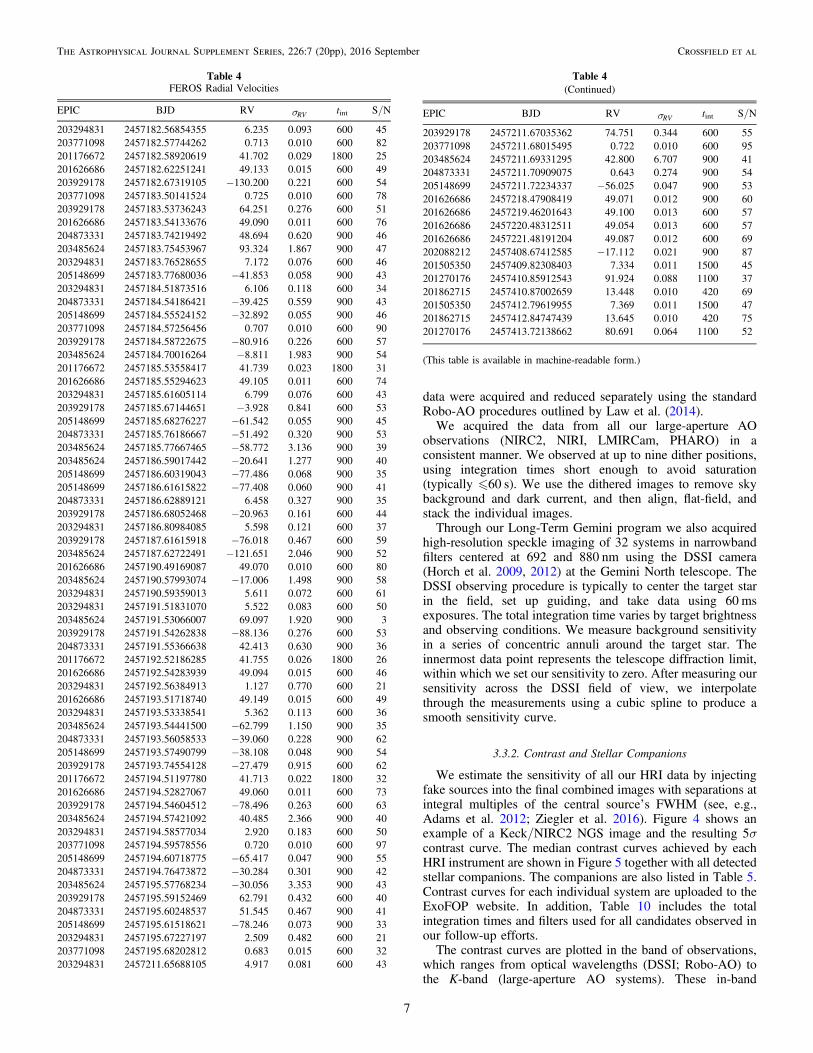
Table 4FEROS Radial Velocities
EPIC BJD RV sRV tint S/N
203294831 2457182.56854355 6.235 0.093 600 45203771098 2457182.57744262 0.713 0.010 600 82201176672 2457182.58920619 41.702 0.029 1800 25201626686 2457182.62251241 49.133 0.015 600 49203929178 2457182.67319105 −130.200 0.221 600 54203771098 2457183.50141524 0.725 0.010 600 78203929178 2457183.53736243 64.251 0.276 600 51201626686 2457183.54133676 49.090 0.011 600 76204873331 2457183.74219492 48.694 0.620 900 46203485624 2457183.75453967 93.324 1.867 900 47203294831 2457183.76528655 7.172 0.076 600 46205148699 2457183.77680036 −41.853 0.058 900 43203294831 2457184.51873516 6.106 0.118 600 34204873331 2457184.54186421 −39.425 0.559 900 43205148699 2457184.55524152 −32.892 0.055 900 46203771098 2457184.57256456 0.707 0.010 600 90203929178 2457184.58722675 −80.916 0.226 600 57203485624 2457184.70016264 −8.811 1.983 900 54201176672 2457185.53558417 41.739 0.023 1800 31201626686 2457185.55294623 49.105 0.011 600 74203294831 2457185.61605114 6.799 0.076 600 43203929178 2457185.67144651 −3.928 0.841 600 53205148699 2457185.68276227 −61.542 0.055 900 45204873331 2457185.76186667 −51.492 0.320 900 53203485624 2457185.77667465 −58.772 3.136 900 39203485624 2457186.59017442 −20.641 1.277 900 40205148699 2457186.60319043 −77.486 0.068 900 35205148699 2457186.61615822 −77.408 0.060 900 41204873331 2457186.62889121 6.458 0.327 900 35203929178 2457186.68052468 −20.963 0.161 600 44203294831 2457186.80984085 5.598 0.121 600 37203929178 2457187.61615918 −76.018 0.467 600 59203485624 2457187.62722491 −121.651 2.046 900 52201626686 2457190.49169087 49.070 0.010 600 80203485624 2457190.57993074 −17.006 1.498 900 58203294831 2457190.59359013 5.611 0.072 600 61203294831 2457191.51831070 5.522 0.083 600 50203485624 2457191.53066007 69.097 1.920 900 3203929178 2457191.54262838 −88.136 0.276 600 53204873331 2457191.55366638 42.413 0.630 900 36201176672 2457192.52186285 41.755 0.026 1800 26201626686 2457192.54283939 49.094 0.015 600 46203294831 2457192.56384913 1.127 0.770 600 21201626686 2457193.51718740 49.149 0.015 600 49203294831 2457193.53338541 5.362 0.113 600 36203485624 2457193.54441500 −62.799 1.150 900 35204873331 2457193.56058533 −39.060 0.228 900 62205148699 2457193.57490799 −38.108 0.048 900 54203929178 2457193.74554128 −27.479 0.915 600 62201176672 2457194.51197780 41.713 0.022 1800 32201626686 2457194.52827067 49.060 0.011 600 73203929178 2457194.54604512 −78.496 0.263 600 63203485624 2457194.57421092 40.485 2.366 900 40203294831 2457194.58577034 2.920 0.183 600 50203771098 2457194.59578556 0.720 0.010 600 97205148699 2457194.60718775 −65.417 0.047 900 55204873331 2457194.76473872 −30.284 0.301 900 42203485624 2457195.57768234 −30.056 3.353 900 43203929178 2457195.59152469 62.791 0.432 600 40204873331 2457195.60248537 51.545 0.467 900 41205148699 2457195.61518621 −78.246 0.073 900 33203294831 2457195.67227197 2.509 0.482 600 21203771098 2457195.68202812 0.683 0.015 600 32203294831 2457211.65688105 4.917 0.081 600 43
Table 4(Continued)
EPIC BJD RV sRV tint S/N
203929178 2457211.67035362 74.751 0.344 600 55203771098 2457211.68015495 0.722 0.010 600 95203485624 2457211.69331295 42.800 6.707 900 41204873331 2457211.70909075 0.643 0.274 900 54205148699 2457211.72234337 −56.025 0.047 900 53201626686 2457218.47908419 49.071 0.012 900 60201626686 2457219.46201643 49.100 0.013 600 57201626686 2457220.48312511 49.054 0.013 600 57201626686 2457221.48191204 49.087 0.012 600 69202088212 2457408.67412585 −17.112 0.021 900 87201505350 2457409.82308403 7.334 0.011 1500 45201270176 2457410.85912543 91.924 0.088 1100 37201862715 2457410.87002659 13.448 0.010 420 69201505350 2457412.79619955 7.369 0.011 1500 47201862715 2457412.84747439 13.645 0.010 420 75201270176 2457413.72138662 80.691 0.064 1100 52
(This table is available in machine-readable form.)
7
The Astrophysical Journal Supplement Series, 226:7 (20pp), 2016 September Crossfield et al

magnitude differences set upper limits on the maximumamount of blending possible within the Kepler bandpass. Ifthe companion has the same color as the primary, then themeasuredΔmag is indeed theΔKp. If the companion is redder,then the Kp-band flux ratio is even smaller. All detectedsources are included in Table 5, even though some lie outsideof our photometric apertures. In these cases the detectedcompanion has little or no impact on the transit parameters andFPPs derived below. We discuss such considerations morethoroughly in Section 6.2.
4. STELLAR PARAMETERS
Stellar parameters are needed to convert the physicalproperties measured by our transit photometry into usefulplanetary parameters such as radius (RP) and incident
Table 5HRI-detected Stellar Companions
EPIC rap ρ Delta mag Filter Telescope(″) (″) (mag)
201176672 11.94 0.340 2.77 K Keck2201295312 11.94 8.110 4.00 K Keck2201295312 11.94 8.070 4.10 K Palomar201324549 11.94 0.090 0.43 K GemN-NIRI201488365 L 4.100 9.56 i Robo-AO201505350 11.94 0.160 0.36 K Palomar201546283 7.96 3.030 5.83 i Robo-AO201546283 7.96 2.960 3.74 K Keck2201626686 11.94 15.390 2.43 K Palomar201629650 11.94 3.210 5.79 K Keck2201828749 11.94 2.540 1.97 i Robo-AO201828749 11.94 2.450 1.07 K Keck2201828749 11.94 2.440 1.11 K Palomar201862715 11.94 1.450 0.90 i Robo-AO201862715 11.94 1.470 0.51 K Palomar202059377 11.94 0.390 0.34 i Robo-AO202059377 11.94 0.360 0.32 K LBT202066212 L 9.120 0.43 K Palomar202066212 L 10.580 2.72 K Palomar202066537 7.96 2.280 0.69 i Robo-AO202066537 7.96 2.290 0.58 K LBT202071289 11.94 0.060 0.09 K Keck2202071401 15.92 2.880 2.49 i Robo-AO202071401 15.92 6.230 5.05 i Robo-AO202071401 15.92 2.840 1.70 K Keck2202071401 15.92 2.840 1.79 K Palomar202071401 15.92 6.050 5.23 K Palomar202071645 11.94 3.700 7.19 i Robo-AO202071645 11.94 3.360 7.06 K Palomar202071645 11.94 3.630 7.43 K Palomar202071645 11.94 9.290 3.67 K Palomar202071645 11.94 10.850 5.88 K Palomar202083828 11.94 5.530 5.02 i Robo-AO202088212 15.92 1.310 6.79 K Keck2202089657 15.92 8.550 5.28 K Palomar202089657 15.92 9.210 5.58 K Palomar202089657 15.92 11.160 4.67 K Palomar202089657 15.92 11.630 6.73 K Palomar202126849 15.92 4.610 5.70 i Robo-AO202126852 15.92 7.150 7.44 K Palomar202126852 15.92 3.730 6.99 K Palomar202126852 15.92 7.170 7.38 i Robo-AO202126887 15.92 5.770 2.79 i Robo-AO202126887 15.92 7.260 2.33 i Robo-AO202126887 15.92 5.580 2.53 K Keck2202126887 15.92 7.200 1.41 K Keck2202126888 15.92 6.700 5.98 i Robo-AO202565282 7.96 2.170 5.19 K Keck2203929178 19.9 0.110 1.37 K Keck2204043888 7.96 5.520 4.73 K Keck2204489514 15.92 5.390 4.49 K Keck2204890128 15.92 7.510 1.55 K Keck2205029914 11.94 3.320 0.87 K Keck2205064326 11.94 4.270 3.92 K Keck2205148699 11.94 0.090 0.83 K Keck2205686202 11.94 0.790 3.82 K Keck2205703094 11.94 0.140 0.37 K Keck2205916793 11.94 7.300 0.35 K Palomar205962680 11.94 0.480 0.27 K Keck2205999468 7.96 18.500 3.27 K Palomar206011496 7.96 0.980 2.81 K Keck2206047297 11.94 9.560 5.90 K Palomar206061524 7.96 0.410 1.37 K Palomar
Table 5(Continued)
EPIC rap ρ Delta mag Filter Telescope(″) (″) (mag)
206192335 11.94 2.240 6.18 K GemN-NIRI206192335 11.94 2.260 6.21 K Palomar207389002 11.94 5.940 2.36 K GemS-GNIRS207389002 11.94 5.370 2.96 K GemS-GNIRS207389002 11.94 5.910 2.29 i Robo-AO207475103 15.92 0.100 0.12 K LBT207475103 15.92 4.340 3.18 i Robo-AO207475103 15.92 7.610 −2.11 i Robo-AO207475103 15.92 7.700 2.51 i Robo-AO207517400 15.92 3.530 2.63 i Robo-AO207517400 15.92 3.430 1.92 K Palomar207517400 15.92 8.320 1.35 K Palomar207517400 15.92 10.620 −2.12 K Palomar207739861 11.94 5.440 1.62 i Robo-AO208445756 11.94 5.970 1.37 i Robo-AO208445756 11.94 5.850 1.19 K Palomar208445756 11.94 11.290 3.06 K Palomar208445756 11.94 13.130 3.79 K Palomar208445756 11.94 12.000 4.05 K Palomar209036259 15.92 4.000 2.96 i Robo-AO210401157 5.572 0.500 2.47 a GemN-Spk210401157 5.572 0.490 2.27 b GemN-Spk210401157 5.572 0.470 1.67 K Keck2210414957 15.92 0.790 2.41 K GemN-NIRI210414957 15.92 1.020 4.95 K GemN-NIRI210513446 7.96 0.240 1.26 K GemN-NIRI210666756 5.572 2.360 1.30 K GemN-NIRI210666756 5.572 7.850 1.28 K GemN-NIRI210769880 15.92 0.780 5.39 K GemN-NIRI210954046 7.96 2.930 1.45 K GemN-NIRI210958990 11.94 1.740 2.52 a GemN-Spk210958990 11.94 1.790 2.80 b GemN-Spk210958990 11.94 1.820 1.71 K Keck2211089792 15.92 4.240 0.89 K GemN-NIRI211147528 15.92 1.330 6.75 b GemN-Spk211147528 15.92 1.300 5.02 K Keck2203099398 L 1.970 1.67 K Keck2203867512 L 0.453 0.61 K Keck2204057095 L 0.790 2.71 K Keck2204057095 L 0.870 2.97 K Keck2204750116 L 2.980 5.91 K Keck2
(This table is available in machine-readable form.)
8
The Astrophysical Journal Supplement Series, 226:7 (20pp), 2016 September Crossfield et al

irradiation (Sinc). We use several complementary techniques toinfer stellar parameters for our entire sample.
For all stars with Keck/HIRES and/or APF/Levy spectra,we attempt to estimate effective temperatures, surface gravities,metallicities, and rotational velocities using SpecMatch(Petigura 2015). SpecMatch fits a high-resolution opticalspectrum to an interpolated library of model spectra fromCoelho et al. (2005), which closely match the spectra of well-characterized stars in this temperature range. Uncertainties onTeff , glog , and [Fe/H] from HIRES spectra are 60 K,0.08–0.10 dex, and 0.04 dex, respectively (Petigura 2015).
Experience shows that SpecMatch is limited to stars withTeff∼4700–6500K and v isin 30 kms−1.
The SpecMatch pipeline used to analyze the APF data isidentical to the Keck SpecMatch pipeline, except we employthe differential-evolution Markov Chain Monte Carlo (DE-MCMC; Ter Braak 2006) fitting engine from ExoPy (Fultonet al. 2013) instead of c2 minimization. The APF SpecMatchpipeline was empirically calibrated to produce consistent stellarparameters for stars that were observed at both Keck and APFby fitting and subtracting a three-dimensional surface to theresiduals of Teff , glog , and Fe/H between the calibrated Keckand initial APF parameters. The errors on the stellar parametersare a quadrature sum of the statistical errors from the DE-MCMC fits and the scatter in the APF versus Keck calibration.The scatter in the calibration is generally an order of magnitude
Table 6Disposition of Multi-star Candidates
EPIC r < 4″ d< ¢F F2 1 Comment
201176672 True True Cannot validate candidate.201295312 False True Same depth for r=1″ aperture.201324549 True True Cannot validate candidate.201546283 True True Cannot validate candidate.201626686 False True Shallower transit with r=1″;
likely FP.201629650 True True Cannot validate candidate.201828749 True True Cannot validate candidate.201862715 True True Cannot validate candidate.202059377 True True Cannot validate candidate.202066537 True True Cannot validate candidate.202071289 True True Cannot validate candidate.202071401 True True Cannot validate candidate.202071645 True False Secondary star sufficiently faint.202083828 False True Same depth for r=1″ aperture.202088212 True False Secondary star sufficiently faint.202126849 False False Secondary star sufficiently faint.202126852 False False Secondary star sufficiently faint.202126887 False True Deeper transit with r=1″ aperture.202126888 False True Same depth for r=1″ aperture.202565282 True False Secondary star sufficiently faint.203929178 True True Cannot validate candidate.204043888 False False Secondary star sufficiently faint.204489514 False False Secondary star sufficiently faint.204890128 False True Same depth for r=1″ aperture.205029914 True True Cannot validate candidate.205064326 False True Shallower transit with r=1″;
likely FP.205148699 True True Cannot validate candidate.205686202 True True Cannot validate candidate.205703094 True True Cannot validate candidate.205916793 False True Deeper transit with r=1″ aperture.205999468 False True Same depth for r=1″ aperture.206011496 True True Cannot validate candidate.206061524 True True Cannot validate candidate.206192335 True True Cannot validate candidate.207389002 False False Secondary star sufficiently faint.207475103 True True Cannot validate candidate.207517400 True True Cannot validate candidate.207739861 False True Cannot validate candidate.208445756 False True Cannot validate candidate.209036259 False True Cannot validate candidate.210401157 True True Cannot validate candidate.210414957 True True Cannot validate candidate.210513446 True True Cannot validate candidate.210666756 True True Cannot validate candidate.210958990 True True Cannot validate candidate.211089792 False True Same depth for r=1″ aperture.211147528 True True Cannot validate candidate.
Figure 4. Example constraints on any additional, nearby stars around K2-77(EPIC 210363145) from Keck/NIRC2 K-band adaptive optics imaging. Forthis target, no companions were detected above the plotted contrast limits.Detected stellar companions around all observed candidates are listed inTable 5.
Figure 5. Stellar companions (triangles) detected near our K2 candidatesystems and the median contrast achieved with each listed instrument and filter(solid curves). As described in Section 3.3, these detected magnitudedifferences set upper limits on the maximum amount of blending possiblewithin the Kepler bandpass. Parameters of these nearby stars are listed inTable 5.
9
The Astrophysical Journal Supplement Series, 226:7 (20pp), 2016 September Crossfield et al
larger than the statistical errors in the S/N regime for the K2targets observed on APF.
Petigura (2015) assessed the accuracy of SpecMatch-derived stellar parameters by modeling the spectra of severalsamples of touchstone stars with well-measured properties. Theproperties of these stars were determined from asteroseismol-ogy (Huber et al. 2012), detailed LTE spectral modeling, andtransit light curve modeling (Torres et al. 2012), and detailedLTE spectral modeling (Valenti & Fischer 2005). Theuncertainties of SpecMatch parameters are dominated byerrors in the Coelho et al. (2005) model spectra (e.g.,inaccuracies in the line lists, assumption of LTE, etc.). Giventhat we observe spectra at S/N35 per pixel, photon-limitederrors are not an appreciable fraction of the overall errorbudget.
To estimate stellar masses and radii for all stars withSpecMatch parameters, we use the free and open sourceisochrones Python package (Morton 2015a). This toolaccepts as inputs the Teff , glog , and [ ]Fe H measured bySpecMatch and interpolates over a grid of stellar modelsfrom the Dartmouth Stellar Evolution Database (Dotteret al. 2008). isochrones uses the emcee Markov ChainMonte Carlo package (Foreman-Mackey et al. 2012) toestimate uncertainties, sometimes reporting fractional uncer-tainties as low as 1%. Following Sinukoff et al. (2016), weadopt a lower limit of 5% for the uncertainties on stellar massand radius to account for the intrinsic uncertainties of theDartmouth models found by Feiden & Chaboyer (2012).
Eighty-five stars in our sample lack SpecMatch para-meters. For most of these, we adopt the stellar parameters ofHuber et al. (2016). This latter analysis relies on the Padova setof stellar models (Marigo et al. 2008), which systematicallyunderestimate the stellar radii of low-mass stars. Follow-upspectroscopy to provide refined parameters for these later-typestars is underway (C. Dressing et al. 2016, in preparation; A.Martinez et al. 2016, in preparation). Our sample includes asmall number of stars not considered by Huber et al. (2016),such as targets in K2’s Campaign 0. For these, we useisochrones in conjunction with broadband photometrycollected from the APASS, 2MASS, and WISE surveys to inferthe stellar parameters.
We then use the free, open source LDTk toolkit (Parviainen& Aigrain 2015) to propagate our measured Teff , glog , [Fe/H],and their uncertainties into limb-darkening coefficients andassociated uncertainties. These limb-darkening parameters actas priors in our transit light curve analysis (described below inSection 5). We upgraded LDTk to allow the (typically non-Gaussian) posterior distributions generated by the iso-chrones package to be fed directly into the limb-darkeninganalysis.40 Because LDTk often reports implausibly smalluncertainties on the limb-darkening parameters, based on ourexperience with such analyses we increase all these uncertain-ties by a factor of five in our light curve analyses. Spot checksof a number of systems reveal that imposing priors on thestellar limb-darkening has a negligible impact (<1σ) on ourfinal results, relative to analyses with much weaker constraintson limb darkening.
All our derived stellar parameters—Teff , glog , R , M —andtheir uncertainties are listed in Table 7.
5. TRANSIT LIGHT CURVE ANALYSES
After identifying planet candidates and determining theparameters of their host stars, we subject the detrended lightcurves to a full maximum-likelihood and MCMC analysis. Weuse a custom Python wrapper of the free, open source BATMANlight curve code (Kreidberg 2015). We upgraded the BATMANcodebase to substantially increase its efficiency when analyzinglong-cadence data.41 The light curves are fit using the standardNelder-Mead Simplex Algorithm42 and then run throughemcee to determine parameter uncertainties.Our general approach follows that used in our previous
papers (Crossfield et al. 2015; Petigura et al. 2015; Schliederet al. 2016; Sinukoff et al. 2016). The model parameters in ouranalysis are the transit time (T0); the candidate’s orbital periodand inclination (P and i); the scaled semimajor axis ( *a R ); thefractional candidate size ( *R Rp ); the orbital eccentricity andlongitude of periastron (e and ω), the fractional level of dilution(δ) from any other sources in the aperture; a single multi-plicative offset for the absolute flux level; and quadratic limb-darkening coefficients (u1 and u2). We initialize each fit withthe best-fit parameters returned from TERRA. Note that boththis analysis and that of TERRA assume a linear ephemeris, sosystems with large transit timing variations (TTVs) could bemissed or misidentified.During the analysis, several parameters are constrained or
subjected to various priors. Gaussian priors are applied to thelimb-darkening parameters (as derived from the LDTkanalysis), to P (with a dispersion of s = 0.01 daysP , to ensurethat the desired candidate signal is the one being analyzed), andto e (m = -10e
4 and s = -10e3, to enforce a circular orbit). We
also apply a uniform prior to T0 (with width P0.06 ), i (from 50°to 90°), *R Rp (from −1 to 1), and ω (from 0 to 2π); both P and
*a R are furthermore constrained to be positive. Allowing
*R RP to take on negative values avoids the Malmquist biasthat would otherwise result from treating it as a positive-definite quantity. For those systems with no identified stellarcompanions, our HRI and/or spectroscopy constrain thedilution level; otherwise, we adopt a log-uniform prior on theinterval (10−6, 1).
6. FALSE POSITIVE ASSESSMENT
During the prime Kepler mission, both the sheer number ofplanet candidates and their intrinsic faintness made directconfirmation by RVs impractical for most systems. Nonethelessmany planets can be statistically validated by assessing therelative probabilities of planetary and false positive scenarios; agrowing number of groups have presented frameworks forquantitatively assessing the likelihoods of planetary and falsepositive scenarios (Torres et al. 2011; Morton 2012; Díazet al. 2014; Santerne et al. 2015). These false positive scenarioscome in several classes: (1) undiluted eclipsing binaries, (2)background (and foreground) eclipsing binaries where theeclipses are diluted by a third star, and (3) eclipsing binaries ingravitationally bound triple systems.To estimate the likelihood that each of our planet candidates
is a true planetary system or a false positive configuration, weuse the free and open source vespa software (Morton 2015).vespa compares the likelihood of each scenario against theplanetary interpretation and accepts additional constraints from
40 GitHub commits 60174cc, 46d140b, and 8927bc6.
41 GitHub commit 9ae9c83.42 As implemented in scipy.optimize.fmin.
10
The Astrophysical Journal Supplement Series, 226:7 (20pp), 2016 September Crossfield et al

HRI and spectroscopy. Throughout this analysis, we applyVersion 0.4.7 of vespa (using the MultiNest backend) to eachindividual planetary candidate. Other types of false positivescenarios exist that are not explicitly treated by vespa, such aseclipsing binaries on eccentric, inclined orbits showing onlytransit or occultation (but not both), or extremely inconvenientarrangements of starspots. The community’s experience offollowing up transiting planet candidates indicates that suchscenarios are much less common than those considered byvespa; nonetheless quantifying the likelihood of suchscenarios for each candidate would be an interesting avenuefor future research.
6.1. Calculating FPPs
To calculate the FPP for each system, we use the followinginputs: stellar photometry from APASS, 2MASS, and WISE;the stellar parameters described in Section 4; the detrendedlight curve (after masking out any transits from othercandidates in that system); the exclusion constraints fromadaptive optics imaging data in terms of contrast versusseparation (where available) and from our high-resolutionspectroscopy (maximum allowed contrast and velocity offset);and an upper limit on the depth of any secondary eclipse. Wederive the last of these by constructing a rectangular signal withdepth unity and duration equal to the best-fit transit duration,scanning the template signal across the out-of-transit lightcurve, and reporting the 99.7th percentile as the eclipse depth’supper limit.
We report the final FPPs of all our systems in Table 8. Forthe purposes of the discussion that follows, we deem anycandidate signal with FPP<0.01 as a validated extrasolarplanet and signals with FPP>0.99 as false positives. For allunvalidated candidates, Table 9 summarizes vespaʼs estimateof the relative (unnormalized) likelihood of each potential falsepositive scenario.
The vespa algorithm implicitly assumes that each planetcandidate lacks any other companion candidates in the samesystem. Studies of Kepler’s multiple-candidate systems showthat almost all are planets (Lissauer et al. 2012). This“multiplicity boost” has subsequently been used to validatehundreds of multi-planet systems (Rowe et al. 2014). Becausevespa treats only single-planet systems, we simply treat thesemulti-candidate systems as independent, isolated candidates in
the FPP analysis. Sinukoff et al. (2016) show that K2’smultiplicity boost is �20 even in crowded fields, comparable tothe boost factor derived for the original Kepler mission.Even without the multiplicity boost, our approach validates
the majority of our multi-candidate systems. BothEPIC201445392 (K2-8) and EPIC206101302 host two-planetcandidates. In each system we validate one candidate and findFPP=4%–7% for the other. The K2 multiplicity boost factorof �20 therefore results in all candidates in both systems beingfirmly labeled as validated planets.A more complicated case is EPIC205703094, which hosts
three planet candidates. Our vespa analysis finds that onecandidate is a false positive and that the others both haveFPP≈ 50% (see Tables 8 and 9). Our light curve analysis findsthat all three candidates are well-fit by grazing transits ( ~b 1),leaving *R RP only weakly constrained. Furthermore, our HRIreveals that the system is a close visual binary with separation0 14 (see Tables 6 and 5). Therefore we can neither validatenor rule out the three candidates in this system.
6.2. Targets with Nearby Stellar Companions
Planet candidates orbiting stars in physical or visual multiplesystems are much more difficult to validate due to blending inthe photometric aperture (see, e.g., Ciardi et al. 2015). Table 5shows that our K2 photometric apertures are quite large (up to20″ in extreme cases) and that HRI follow-up reveals stellarcompanions within these apertures for many systems. There-fore we must treat these systems with greater care.To demonstrate the difficulty, consider two stars with flux
ratio <F F 12 1 and angular separation ρ. Assume both lie in aphotometric aperture with radius r>r , with which a transit isobserved with apparent depth δ′. If the transit occurs around theprimary star, then the true transit depth is ( )d d» ¢ - F F1 ;1 2 1this is at most twice the observed depth, indicating a planetaryradius up to 2 larger than otherwise determined. If instead thetransiting object orbits the secondary, then the true transit depthis d d» ¢F F2 1 2 and the transiting object may be many timeslarger than expected. Table 6 lists all candidates known to hostsecondary stars and their relationships between F F2 1 & d¢ andρ & r.Any planet candidate in a multi-star system and with
d< ¢F F2 1 cannot transit the secondary (which is too faint tobe the source of the observed transit signal). We find several
Table 7Stellar Parameters
EPIC Kp R* M* Teff log g Source(mag) ( R ) ( M ) (K) (dex)
201155177 14.632 0.643(39) 0.702(46) 4613(71) 4.659(50) Huber et al. (2016)201176672 13.980 0.508(98) 0.559(87) 4542(130) 4.747(97) Huber et al. (2016)201205469 14.887 0.570(30) 0.600(30) 3939(87) 4.698(23) Huber et al. (2016)201208431 14.409 0.435(60) 0.487(72) 4044(81) 4.849(60) Huber et al. (2016)201247497 16.770 0.436(27) 0.492(29) 3918(46) 4.846(50) Huber et al. (2016)201295312 12.126 1.58(15) 1.150(60) 5912(51) 4.101(63) SpecMatch201324549 12.146 1.45(25) 1.18(12) 6283(113) 4.17(12) Huber et al. (2016)201338508 14.364 0.462(38) 0.520(44) 4021(62) 4.823(50) Huber et al. (2016)201345483 15.319 0.445(66) 0.503(78) 4103(90) 4.824(70) Huber et al. (2016)201367065 11.574 0.371(50) 0.414(58) 3841(82) 4.906(60) Huber et al. (2016)201384232 12.510 1.010(80) 0.930(30) 5767(58) 4.398(74) SpecMatch
(This table is available in machine-readable form.)
11
The Astrophysical Journal Supplement Series, 226:7 (20pp), 2016 September Crossfield et al

Table 8Planet Candidate Parameters
Other EPIC P T0 T14 *R RP a RP Sinc FPP DispositionName (d) (BJDTDB (hr) (%) (au) (R⊕) (S⊕)
–2454833)
K2-42b 201155177.01 6.68796(93) 1981.6763(52) 3.04(20) 3.04(28) 0.0617(13) 2.15(24) 44.1(6.3) 5.2e−07 Planet201176672.01 79.9999(98) 2044.8046(15) 11.75(17) 18.0(1.1) 0.299(16) 10.2(2.1) 1.10(46) 0.094 Candidate (see Tables 6 and 1)
K2-43b 201205469.01 3.47114(21) 1976.8845(33) 1.97(11) 6.60(36) 0.03784(63) 4.13(31) 49.0(6.9) 9.7e−10 PlanetK2-4b 201208431.01 10.0044(11) 1982.5170(45) 2.87(17) 3.49(41) 0.0715(35) 1.69(30) 8.9(2.7) 0.00028 Planet
201247497.01 2.75391(15) 1977.9031(23) 1.03(14) 7.9(1.3) 0.03035(59) 3.78(68) 43.7(6.1) 0.41 CandidateK2-44b 201295312.01 5.65688(59) 1978.7176(44) 4.36(13) 1.56(12) 0.0651(11) 2.72(32) 646(126) 6.7e−07 Planet
201324549.01 2.519334(35) 1976.99353(69) 1.545(15) 2.41(30) 0.0383(13) 3.91(85) 2002(727) 1 False Positive (see Tables 6 and 3)K2-5c 201338508.01 10.9324(14) 1981.6012(55) 2.84(23) 3.24(29) 0.0775(22) 1.64(20) 8.3(1.6) 2.8e−05 PlanetK2-5b 201338508.02 5.73597(68) 1975.8602(53) 2.35(18) 2.97(22) 0.0504(14) 1.50(17) 19.7(3.7) 5.4e−06 PlanetK2-45b 201345483.01 1.7292684(69) 1976.52604(18) 1.689(14) 13.76(19) 0.0224(12) 6.71(00) 100(32) 6.8e−06 PlanetK2-3b 201367065.01 10.05443(26) 1980.4178(12) 2.520(59) 3.51(15) 0.0679(32) 1.44(20) 5.8(1.7) 1.9e−08 PlanetK2-3c 201367065.02 24.6435(12) 1979.2811(24) 3.38(12) 2.88(16) 0.1235(58) 1.18(17) 1.77(53) 2.1e−08 PlanetK2-3d 201367065.03 44.5609(52) 1993.2285(34) 4.04(19) 2.35(15) 0.1833(86) 0.96(14) 0.80(24) 1.2e−07 Planet
Note. Table 8 is published in its entirety in the machine-readable format. A portion is shown here for guidance regarding its form and content.
(This table is available in its entirety in machine-readable form.)
12
TheAstrophysicalJournalSupplementSeries,226:7
(20pp),2016
Septem
berCrossfieldetal

such systems, though only two (EPIC 202126852 and211147528) have FPP<0.95. Nonetheless, for all thesesystems we account for the dilution of the secondary star(s)as described below.
For candidates with d¢ < F F2 1 and r < r , the transit couldoccur around either star. We compare our nominal time-seriesphotometry to that computed with r=1 pixel for all suchcandidates. For targets with more widely separated nearby
Table 9Unvalidated Candidate False Positive Likelihoods
Target L_heba L_heb_P×2a L_ebb L_eb_P×2b L_bebc L_beb_P×2c L_pld FPP
201176672.01 3.2e−36 0.0097 7.3e−19 0.046 0.002 0.0019 0.035 0.094201247497.01 7.2e−16 7.4e−05 2.6 20 0 2.9 12 0.41201445392.01 0.00027 0.028 0.042 0.83 0 0.081 1.5 0.042201465501.01 0.00047 0.19 0.0036 0.46 0 0.015 0.042 0.45201512465.01 0.0021 0.09 0.013 0.82 1.3 5.6 8.3 0.23201546283.01 6e−15 1e−07 8.1e−10 5.4e−16 0.0019 0.00045 14 4.4e−07201565013.01 3.6e−07 0.073 16 1.2 1.1 0.44 8 0.76201617985.01 0.0048 0.77 0.0046 1.5 0.09 0 0.025 0.96201626686.01 5.5e−20 1.1e−10 0.3 0.012 4.6e−05 5.6e−07 1.6 0.16201629650.01 5.9e−69 2.3e−21 1.2e−07 1.1e−08 5.2e−11 1.2e−39 0.002 3.6e−05201637175.01 4 1.3 0.23 15 0.17 2.2 19 0.15201702477.01 1.6e−12 2.9e−06 0.13 0.0048 0.19 0.021 0.79 0.41201717274.01 7e−12 1.6e−05 3.9e−08 0.00016 0.25 0.71 8.9 0.013201828749.01 1.4e−14 1.1e−13 5.4e−09 5.3e−28 0 0 0.059 3.3e−08201862715.01 2.2e−23 4e−09 6.8e−18 4.5e−13 0.014 2.3e−07 5.8 2.4e−07201920032.01 7.9e−34 2.4e−10 0.078 0.056 0.0014 0 0.99 0.054202071289.01 0.076 0.96 4.5 3.5 0.00015 1.9e−08 11 0.97202071401.01 0.0062 0.16 0.0086 0.27 0 7.1e−05 2.5 0.002202126852.01 0.059 0.0024 4.2 0.036 0 0.015 2.8 0.65202675839.01 0.045 0.19 0.18 0.24 1e−14 0 0.46 0.19205029914.01 2e−34 5.4e−10 1e−34 4.7e−16 0 3.3e−12 0.0054 1.4e−10205148699.01 5.4e−58 4.7e−34 6.5e−31 1.2e−48 0 0 0.81 0205570849.01 0.041 0.38 0.78 0.48 0 4.7e−25 1.2 0.32205686202.01 1.8e−36 3.2e−16 2.7e−40 7e−11 2e−08 0 2.5 1.3e−11205703094.02 0.0027 0.049 0.0011 0.034 0.0073 0.0097 0.13 0.66205999468.01 0.056 0.85 0.96 1.2 0.43 1.1 2.8 0.1206011496.01 4.1e−26 1.7e−06 4.4e−15 1.4e−05 0 0 12 1.6e−08206024342.01 3e−07 6.6e−06 0.021 0.027 0 0 0.84 0.025206028176.01 0.0024 0.072 0.015 0.1 0 0 0.0065 0.64206036749.01 1.3 1.3 1.6 0.59 0 0 2.1 0.097206061524.01 4.7e−22 1e−08 1.1e−16 3.7e−18 0.0023 5e−08 36 4.6e−08206101302.01 0.00036 0.0023 0.051 0.085 0.072 0 0.61 0.069206114294.01 0.0083 0.16 0.46 2 0 0 19 0.028206154641.01 0.00065 0.016 2.1 0.059 0 0 15 0.074206192335.01 1.4e−08 0.0042 2.1e−05 0.022 0 0 11 6e−05206247743.01 8.7e−78 2.6e−22 8.5e−26 3.2e−06 0 0 2.3e−06 0.025206403979.01 1.2e−08 8.5e−07 0.13 0.06 0.015 0.012 0.26 0.72206543223.01 0.045 0.25 1.2 0.0046 0.0016 0.021 2.2 0.67207739861.01 3.5e−203 1.4e−80 1.4e−66 2.6e−21 0 0 2.4e−05 1.1e−16208833261.01 0 8.9e−196 1.1e−05 0.00091 0.23 0.25 2.5 0.011209036259.01 0 4e−40 3.9e−19 0.075 0 0 0.00059 0.96210389383.01 4.3e−77 3.8e−64 5.2e−07 6.2e−39 6.9e−05 3.4e−09 2.4 4.1e−05210609658.01 2.5e−146 2.3e−20 3.3e−13 0.0098 3.7e−18 6.6e−12 0.0077 0.015210625740.01 2.3 0.86 0.18 5 0.036 1.5 31 0.13210659688.01 0.017 0.012 0.016 0.073 0.016 0.023 0.17 0.25210666756.01 5.3 0 0.42 2.8 0.055 0.37 2.4 0.013210754505.01 1e−07 0.015 15 0.8 0 1.6 1.5 0.24210903662.01 4.1 5.2 12 7.9 0.61 0 7 0.59210958990.01 3.8 0.0015 0.01 9.1e−16 0.41 1.1e−09 0.032 0.98211147528.01 0.018 0.00047 0.45 0.003 0.47 0.053 1.8 0.26211916756.01 1.3e−33 2.7e−09 1e−28 2.3e−09 0.9 0.43 0.003 0.88
Notes.a Likelihood that the system is a hierarchical eclipsing binary, with orbital period either as measured or twice that measured.b Likelihood that the system is an eclipsing binary, with orbital period either as measured or twice that measured.c Likelihood that the system is a blended eclipsing binary, with orbital period either as measured or twice that measured.d Likelihood that the system is a transiting planet.
(This table is available in machine-readable form.)
13
The Astrophysical Journal Supplement Series, 226:7 (20pp), 2016 September Crossfield et al
stars, if the one-pixel-photometry reveals a shallower transit,then the transit probably occurs around the secondary star.However, if r < 1pix then we cannot reliably identify thesource of the transits. We find 28 candidates of these types thatwe cannot validate at present, and note the disposition of allsuch systems in Table 6.
For all remaining systems, the detected transits must occuraround the primary star but will be diluted by light from thesecondary. We estimate the total brightness of these systems’secondary star(s) as follows. For stars detected by opticalimaging (Robo-AO and DSSI), we use the measured contrastratio with an uncertainty of 0.05mag. For stars detected byinfrared imaging, we use the relations of Howell et al. (2012) totranslate the observed infrared color into the Kepler bandpass.Since these relations are approximate and depend strongly onSpT, we conservatively apply an uncertainty of 0.5mag tothese values. Section 6.2 describes how we use these data toconstrain the dilution parameter’s posterior distribution,thereby reducing the systematic biases induced by unrecog-nized sources of dilution (e.g., Ciardi et al. 2015).
7. RESULTS AND DISCUSSION
We find 104 validated planets (i.e., FPP< 0.01) in our set of197 planet candidates. Significantly, we show that K2’s surveysincrease by 30% the number of small planets orbitingmoderately bright stars compared to previously known planets.In Section 7.1 we present a general overview of our surveyresults. Then, in Section 7.2 we discuss individual systems,both new targets and previously identified planets andcandidates.
7.1. Overview of Results
Our validated planetary systems span a range of properties,with median values of RP= ÅR2.3 , P=8.6 days,Teff =5300 K, and Kp=12.7 mag. Figure 7 shows thedistribution of planet radius, orbital period, and final disposi-tion for our entire candidate sample. The candidates range from0.7 to 44 days, and from < ÅR1 to larger than any knownplanets.
Figure 8 shows that the majority of candidates have<R 3P R⊕, and these smallest candidates exhibit the highest
validation rates. In contrast, we validate less than half ofcandidates with >R 3P R⊕ and less than half of candidateswith <P 2 days (Figure 1). We find a substantially highervalidation rate for target stars cooler than ∼5500 K versus
hotter stars (65% versus 37%; see Figure 9). Figure 10 showsthat we validate no systems with Kp>16 mag, but otherwisereveals no obvious trends with stellar brightness.Our analyses leave 63 planet candidates with no obvious
disposition (i.e., 0.01< FPP< 0.99). These candidates aretypically large ( > ÅR R3P ), and their FPPs are listed in Table 8.Furthermore, in Table 9 we list the individual likelihoods ofeach false positive scenario considered by vespa.We calculate the FPR of our entire planet candidate sample
by taking our 197 candidates, excluding the 28 candidates withnearby stars discovered by HRI that we cannot validate (seeSection 6.2), and integrating over the probability that eachcandidate is a planet. In this way we estimate that our entiresample contains roughly 145 total planets (though we validatejust 104). This ratio corresponds to a false positive rate of15%–30%, with higher FPPs for candidates showing largersizes and/or shorter orbital periods (see Figures 1 and 8).We also split our sample into several bins in radius and
period to estimate the FPR for each subset, listed in Table 2.Our FPR is dominated by larger candidates, just as Figure 8suggests. Sub-Jovian candidates (with ÅR R8P ) have acumulative FPR of ∼10%, whereas over half of the largercandidates are likely false positives. The FPR for largercandidates is consistent with that measured for the originalKepler candidate sample (Santerne et al. 2016b). Candidateswith <P 3 days have a FPR roughly twice as high as that forlonger-period systems.Since we have excluded the 28 candidates described above,
these FPRs are only approximate and we defer a more detailedanalysis of our survey completeness and accuracy to a futurepublication. Nonetheless, further follow-up observations forsystems lacking high-resolution spectroscopy, HRI, and/or RVmeasurements may expect to identify, validate, and confirm aconsiderable number of additional planetary systems.Figure 11 shows planet radius versus the irradiation levels
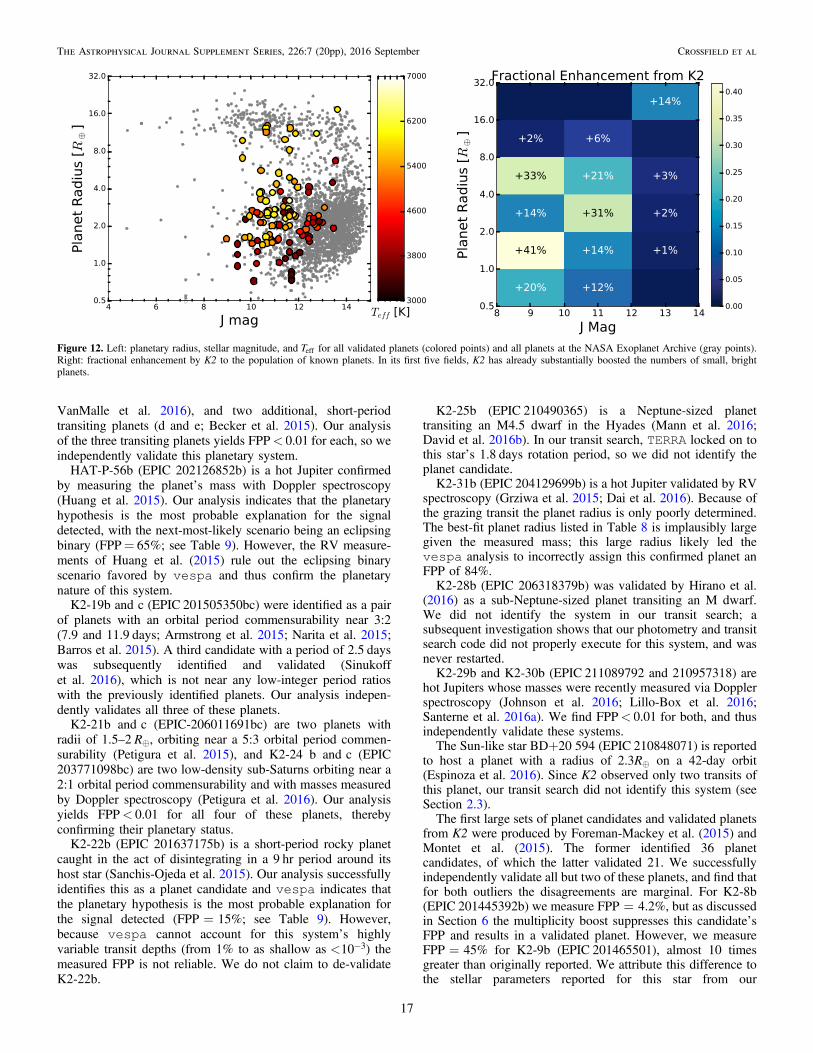
incident upon each of our validated planets relative to thatreceived by the Earth (S⊕), color-coded by Teff . These planetsreceive a wide range of irradiation, from roughly that of Earthto over 104×greater. As expected, our coolest validatedplanets orbit cooler stars (K and M dwarfs). However, wecaution that the stellar parameters for these systems come frombroadband colors and/or Huber et al. (2016), so uncertaintiesare large and biases may remain. Follow-up spectroscopy isunderway to more tightly constrain the stellar and planetaryproperties of these systems (C. Dressing et al. 2016, inpreparation; A. Martinez et al. 2016, in preparation).Finally, Figure 12 shows that K2 planet survey efforts have
substantially increased the number of smaller planets known toorbit moderately bright stars. Although our sensitivity appearsto drop off below ∼1.3R⊕ (as shown in Figure 8) and we findno planets around stars brighter than <J 8.9 mag, we validatea substantial number of intermediate-size planets aroundmoderately bright stars. In particular, the right panel ofFigure 12 shows that the first five fields of K2 have alreadyincreased the number of small planets orbiting fairly brightstars by roughly 30% compared to those tabulated at the NASAExoplanet Archive. Considering the sizes of these planets andthe brightness of their host stars, many of these systems areamenable to follow-up characterization via Doppler spectrosc-opy and/or JWST transit observations.
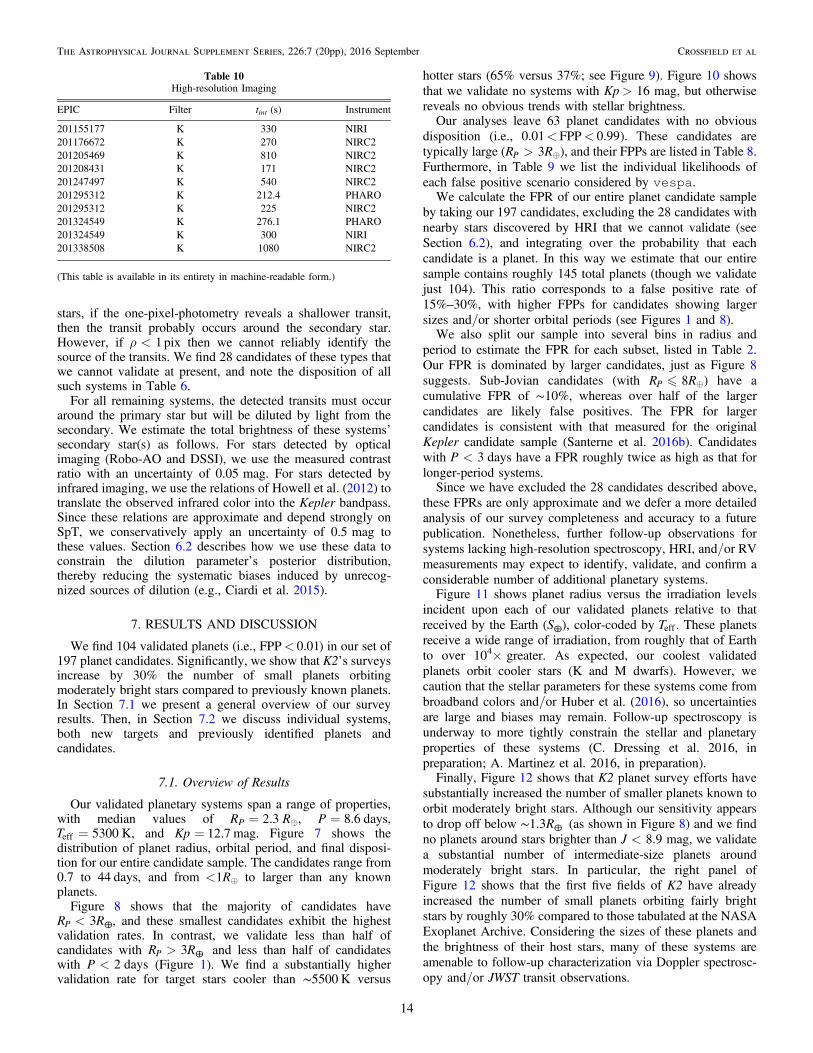
Table 10High-resolution Imaging
EPIC Filter tint (s) Instrument
201155177 K 330 NIRI201176672 K 270 NIRC2201205469 K 810 NIRC2201208431 K 171 NIRC2201247497 K 540 NIRC2201295312 K 212.4 PHARO201295312 K 225 NIRC2201324549 K 276.1 PHARO201324549 K 300 NIRI201338508 K 1080 NIRC2
(This table is available in its entirety in machine-readable form.)
14
The Astrophysical Journal Supplement Series, 226:7 (20pp), 2016 September Crossfield et al

7.2. Notes on Individual Systems
Of the 104 planets validated by our analysis, 64 are newlyvalidated. These include several new multi-planet systems,systems as bright as V=10.8mag, and several small, roughlyEarth-sized planets receiving roughly Earth-like levels ofirradiation. Below we describe some of the most interestingnew systems in Section 7.2.1, our analysis of previouslyconfirmed or validated planets in Section 7.2.2, and our resultsfor known but unvalidated candidates in Section 7.2.3.
7.2.1. New Validated Planets
K2-72 (EPIC 206209135) is a dwarf star hosting a planetcandidate on a 5.57 day orbit (Vanderburg et al. 2016); we findthree additional candidates and validate all four planets in thissystem. We see the transits in both our photometry (shown inFigure 6) and that of Vanderburg & Johnson (2014), and ourlight curve fits give consistent values of
*r ,circ for all planets—
both points give us confidence that these are true planetary
systems. Huber et al. (2016) reports a stellar radius of 0.23 Rebut notes that this is likely an underestimate. The weightedmean of our four stellar density measurements is9.0±3.6gcm−3; using the mass–radius relation of Maldo-nado et al. (2015) implies a stellar radius of -
+0.40 0.070.12 Re and
planetary radii of 1.2–1.5 R⊕ for all planets. Analysis of thestellar spectrum is also consistent with this size (C. Dressing etal. 2016, in preparation; A. Martinez et al. 2016, inpreparation). These four small planets have orbital periods of5.58, 7.76, 15.19, and 24.16 days. The irradiation levels forseveral planets are also quite consistent with Earth’s insolation.Several of these planet pairs orbit near mean-motion reso-nances: planets c and d orbit near the first-order 2:1 MMR, andb and c orbit near the second-order 7:5 MMR. Although thestar K2-72 is relatively faint—Kp=14.4 mag, K=11.0 mag— follow-up Doppler or transit spectroscopy observations tomeasure the planets’ masses or atmospheric compositions willbe challenging; the system’s near-integer period ratios suggest
Figure 6. Photometry of K2-72 (EPIC 206209135), which hosts four transiting planets. Top: full time-series, with colored tick marks indicating each individual transittime. Bottom: phase-folded photometry with the color-coded, best-fit transit model overplotted for each planet. Our analysis indicates a stellar radius of -
+0.40 0.070.12 Re,
planetary radii of –1.2 1.5R⊕, and (from left to right) orbital periods of 5.58, 7.76, 15.19, and 24.16 days.
Figure 7. Orbital periods and radii of our 104 validated planets, 30 falsepositive systems, and 63 remaining planet candidates. Uncertainties on planetradius (listed in Table 8) are typically ∼13%.
Figure 8. Distribution of planet candidate radii for our validated planets, falsepositive systems, and remaining planet candidates. We validate most of thecandidates smaller than ÅR3 , consistent with the low false positive rate we findfor small planets.
15
The Astrophysical Journal Supplement Series, 226:7 (20pp), 2016 September Crossfield et al

that measurements of TTVs may help reveal the masses andbulk densities of all these planets.
We also identify and validate four new two-planet systems inCampaign 4: K2-80, K2-83, K2-84, and K2-90 (EPIC210403955, 210508766, 210577548, and 210968143, respec-tively). Our light curve analyses of the planets in each systemyield values of
*r ,circ that are consistent at <1σ, consistent with
the hypothesis that both planets in each pair orbit the same star.Future transit follow-up of these systems will be challengingbut feasible, with the most easily observed transits havingdepths of ∼1 mmag. None of the systems appear to haveplanets near low-order mean-motion resonance, but additional(non-transiting) planets in these systems could lie nearresonance and induce detectable TTVs.
Our brightest validated system, K2-65 (EPIC 206144956),contains a 1.6 R⊕ planet orbiting a star with V=10.8 mag,J=9.0 mag located in Campaign 3. Despite its 13-day orbitalperiod and low predicted RV semi-amplitude(likely 1 m s−1), the bright star, relatively small planet size,
and low planet insolation (just 45× that of Earth’s) may makethis system an attractive target for future RV efforts.Also of interest for RV follow-up is K2-89 (EPIC
210838726), which hosts a highly irradiated, roughly Earth-sized planet on a one-day orbit around an M dwarf. The planetshould have a RV semi-amplitude of roughly 1 m s−1, andalthough the star is not especially bright (Kp= 13.3 mag,K= 10.1 mag) detection of the planet’s RV signal may liewithin reach of existing and planned high-precision Dopplerspectrographs.
7.2.2. Previously Confirmed Planets
K2-3bcd and K2-26b (EPIC 201367065 and 202083828,respectively) were previously validated as sub-Neptune-sizedplanets orbiting M dwarfs (Crossfield et al. 2015; Schliederet al. 2016), and K2-3b was confirmed by Doppler spectrosc-opy (Almenara et al. 2015). Transits of all four planets werealso recently observed by Spitzer (Beichman et al. 2016). Weindependently validate all these planets. Note, however, thatthe stellar parameters we estimate here for these systemssystematically underestimate the more accurate, spectroscopi-cally derived parameters presented in those papers.K2-10b and K2-27b (EPIC 201577035b and 201546283b,
respectively) were previously validated as planets (Montetet al. 2015; Van Eylen et al. 2016a). We find FPP< 0.01 forboth, thus independently validating these two planetarysystems. A new stellar companion with ρ=3″ andΔi=5.8 mag slightly dilutes the latter’s transit but does notsignificantly affect its reported parameters.We report a new stellar companion with ρ=3 2 and Δ
K=5.8 mag near K2-13b (EPIC 201629650; Montetet al. 2015). This new, faint star is bright enough that it couldbe the source of the observed transits; we therefore suggest thatthis previously validated system should be deemed a planetcandidate.WASP-47 (EPIC 206103150) hosts a hot Jupiter (planet b;
Hellier et al. 2012), a giant planet on a 1.5 year orbit (c; Neveu-
Figure 9. Distribution of stellar effective temperatures for systems withvalidated planets, false positive, and remaining planet candidates. There is ahint of a higher validation rate around stars cooler than ∼5500 K.
Figure 10. Distribution of Kp for systems with validated planets, falsepositives, and remaining planet candidates. Our brightest validated system, K2-65 (EPIC 206144956), contains a 1.6 R⊕ planet orbiting a V=10.8 mag star.
Figure 11. Planetary radii, incident insolation, and stellar effective temperaturefor our 104 validated planets (colored points) and all planets at the NASAExoplanet Archive (gray points). As expected, most of our smaller, coolerplanets are found around cooler, later-type stars ( T 4000eff K). Uncertainties,omitted for clarity, are listed in Table 8. Statistical uncertainties on planetradius and insolation (listed in Table 8) are typically ∼13% and ∼26%,respectively, but the coolest host stars are likely larger, hotter, and moreluminous than they appear (Huber et al. 2016).
16
The Astrophysical Journal Supplement Series, 226:7 (20pp), 2016 September Crossfield et al
VanMalle et al. 2016), and two additional, short-periodtransiting planets (d and e; Becker et al. 2015). Our analysisof the three transiting planets yields FPP< 0.01 for each, so weindependently validate this planetary system.
HAT-P-56b (EPIC 202126852b) is a hot Jupiter confirmedby measuring the planet’s mass with Doppler spectroscopy(Huang et al. 2015). Our analysis indicates that the planetaryhypothesis is the most probable explanation for the signaldetected, with the next-most-likely scenario being an eclipsingbinary (FPP= 65%; see Table 9). However, the RV measure-ments of Huang et al. (2015) rule out the eclipsing binaryscenario favored by vespa and thus confirm the planetarynature of this system.
K2-19b andc (EPIC 201505350bc) were identified as a pairof planets with an orbital period commensurability near 3:2(7.9 and 11.9 days; Armstrong et al. 2015; Narita et al. 2015;Barros et al. 2015). A third candidate with a period of 2.5 dayswas subsequently identified and validated (Sinukoffet al. 2016), which is not near any low-integer period ratioswith the previously identified planets. Our analysis indepen-dently validates all three of these planets.
K2-21b andc (EPIC-206011691bc) are two planets withradii of 1.5–2 ÅR , orbiting near a 5:3 orbital period commen-surability (Petigura et al. 2015), and K2-24 b andc (EPIC203771098bc) are two low-density sub-Saturns orbiting near a2:1 orbital period commensurability and with masses measuredby Doppler spectroscopy (Petigura et al. 2016). Our analysisyields FPP< 0.01 for all four of these planets, therebyconfirming their planetary status.
K2-22b (EPIC 201637175b) is a short-period rocky planetcaught in the act of disintegrating in a 9 hr period around itshost star (Sanchis-Ojeda et al. 2015). Our analysis successfullyidentifies this as a planet candidate and vespa indicates thatthe planetary hypothesis is the most probable explanation forthe signal detected (FPP=15%; see Table 9). However,because vespa cannot account for this system’s highlyvariable transit depths (from 1% to as shallow as < -10 3) themeasured FPP is not reliable. We do not claim to de-validateK2-22b.
K2-25b (EPIC 210490365) is a Neptune-sized planettransiting an M4.5 dwarf in the Hyades (Mann et al. 2016;David et al. 2016b). In our transit search, TERRA locked on tothis star’s 1.8 days rotation period, so we did not identify theplanet candidate.K2-31b (EPIC 204129699b) is a hot Jupiter validated by RV
spectroscopy (Grziwa et al. 2015; Dai et al. 2016). Because ofthe grazing transit the planet radius is only poorly determined.The best-fit planet radius listed in Table 8 is implausibly largegiven the measured mass; this large radius likely led thevespa analysis to incorrectly assign this confirmed planet anFPP of 84%.K2-28b (EPIC 206318379b) was validated by Hirano et al.
(2016) as a sub-Neptune-sized planet transiting an M dwarf.We did not identify the system in our transit search; asubsequent investigation shows that our photometry and transitsearch code did not properly execute for this system, and wasnever restarted.K2-29b and K2-30b (EPIC 211089792 and 210957318) are
hot Jupiters whose masses were recently measured via Dopplerspectroscopy (Johnson et al. 2016; Lillo-Box et al. 2016;Santerne et al. 2016a). We find FPP< 0.01 for both, and thusindependently validate these systems.The Sun-like star BD+20 594 (EPIC 210848071) is reported
to host a planet with a radius of ÅR2.3 on a 42-day orbit(Espinoza et al. 2016). Since K2 observed only two transits ofthis planet, our transit search did not identify this system (seeSection 2.3).The first large sets of planet candidates and validated planets
from K2 were produced by Foreman-Mackey et al. (2015) andMontet et al. (2015). The former identified 36 planetcandidates, of which the latter validated 21. We successfullyindependently validate all but two of these planets, and find thatfor both outliers the disagreements are marginal. For K2-8b(EPIC 201445392b) we measure FPP=4.2%, but as discussedin Section 6 the multiplicity boost suppresses this candidate’sFPP and results in a validated planet. However, we measureFPP=45% for K2-9b (EPIC 201465501), almost 10 timesgreater than originally reported. We attribute this difference tothe stellar parameters reported for this star from our
Figure 12. Left: planetary radius, stellar magnitude, and Teff for all validated planets (colored points) and all planets at the NASA Exoplanet Archive (gray points).Right: fractional enhancement by K2 to the population of known planets. In its first five fields, K2 has already substantially boosted the numbers of small, brightplanets.
17
The Astrophysical Journal Supplement Series, 226:7 (20pp), 2016 September Crossfield et al

homogeneous isochrones stellar analysis: it reports K2-9 tobe an early M dwarf, but a more reliable spectroscopic analysisreveals the star to be a smaller and cooler mid-M dwarf (Huberet al. 2016; Schlieder et al. 2016). The planet K2-9b issuccessfully validated when we use the spectroscopic para-meters in our FPP analysis (Schlieder et al. 2016). Thediscrepancy highlights the importance of accurate and spectro-scopically derived stellar parameters (especially for M dwarfs)when assessing planetary candidates.
Recently, our team validated several new multi-planetsystems found by K2: K2-35, K2-36, K2-37, and K2-38 (EPIC201549860, 201713348, 203826436, and 204221263; Sinukoffet al. 2016). Our analysis here uses much of the samemachinery as in that work, so it should be of little surprise thatwe again validate all the planets in these systems.
Most recently, the giant planet K2-39b was confirmed by RVspectroscopy (Van Eylen et al. 2016b). Our analysis findsFPP=0.025%, independently demonstrating (with high like-lihood) that the candidate is a planet.
7.2.3. Previously Identified Candidates
Several planet candidates showing just a single transit eachwere discovered in K2 Campaigns 1–3 (Osborn et al. 2016).Since our transit search focuses on shorter-period planets (seeSection 2.3), we did not identify these systems.
K2-44 (EPIC 201295312) was identified as hosting a planetcandidate by Montet et al. (2015) and Doppler spectroscopyconstrains its mass to be< ÅM12 (95% confidence; Van Eylenet al. 2016a). Our analysis of this system yields FPP< 0.01 andthus validates this previously identified candidate.
Of the nine planet candidates identified by Montet et al.(2015), we validate five as planets: K2-44, K2-46, K2-8, K2-27, K2-35 (EPIC 201295312, 201403446, 201445392,201546283, and 201549860, respectively). For three candi-dates (EPIC 201702477, 201617985, and 201565013), we find0.01< FPP< 0.99. For EPIC 201828749 we find FPP< 0.01,but a nearby star seen via high-resolution imaging prevents usfrom validating this candidate.
The largest single sample of K2 planet candidates released todate is the 234 candidates identified by Vanderburg et al.(2016) in Campaigns 0–3. Our analysis independentlyidentifies 127 of their candidates. Of these 127, we validate72 as planets and identify 19 as false positives. Our analysisvalidates several multi-planet candidate systems announced inthat work: K2-23, K2-58, K2-59, K2-62, K2-63, and K2-75(EPIC 206103150, 206026904, 206027655, 206096602,206101302, and 206348688, respectively).
Furthermore, our analysis identifies 69 new candidates notpublished in the sample of Vanderburg et al. (2016); these aremostly in Campaign 4; some are in earlier Campaigns. The twosamples largely overlap, but each also contains manycandidates identified by only a single team. The differencesbetween the two samples (along with our non-detection ofEPIC 206318379, noted above) suggest that multiple indepen-dent analyses are essential if many planet candidates are not tobe missed.
When comparing our sample with that of Vanderburg et al.(2016), we find that the largest single systematic differencebetween them is that they report roughly 25% more candidateswith <P 5 days. Our vetting checks suggest that most of theseexcess short-period planets are eclipsing binaries. In particular,our early-stage vetting procedures (described in Section 2.3)
indicate that EPIC201182911, 201270176, 201407812,201488365, 201569483, 201649426, 202072965, 202086968,202093020, 202843107, 203942067, 204649811, 205463986,and 206532093 are all likely false positives. Furthermore, high-resolution imaging of a random selection of four of theircandidate systems revealed all four to have nearby multiplestars (EPIC 203099398, 203867512, 204057095, 204750116).While these newly detected stars do not prove that the systemsare false positives, they will nonetheless complicate any effortto validate these candidates.Aside from the apparent excess of short-period false
positives in the Vanderburg et al. (2016) sample, we find nostatistical differences between the properties of theirs and ourcandidate samples. Measurements of both pipelines’ detectionefficiencies could determine why each team has missed somany of the candidates detected by the other group. Theimplication for future surveys is that multiple independentpipelines may substantially increase the total survey complete-ness of independent, relatively low-budget survey programs.Adams et al. (2016) report nine new candidates in
Campaigns 0–5 with <P 1 days. Of their five new candidatesin Campaigns 0–4, we identify and validate one: K2-85b(EPIC 210707130b), which hosts a small planet on a 16 hrperiod. Because our transit search did not extend to ultra-shortorbital periods, we did not identify EPIC 202094740,203533312, 210605073, or 210961508.Schmitt et al. (2016) identify several dozen systems as likely
eclipsing binaries (see their Table 1). Of these we identify four:EPIC201324549 is a false positive, while EPIC201626686,204129699, and 206135267 remain candidate planets. Of theirplanet candidates we find three to have low FPPsEPIC201920032, 206061524, and 206247743) and we valid-ate five as planets (K2-55, K2-60, K2-67, K2-73, and K2-76,respectively, EPIC 205924614, 206038483, 206155547,206245553, and 206432863). We did not identify theircandidate EPIC201516974 because of its 36.7-day orbitalperiod.
8. CONCLUSION AND FINAL THOUGHTS
We have presented 104 validated planets discovered usingK2 photometry and supporting ground-based observations. Ofthese, 64 are planets validated here for the first time. Ouranalysis shows that K2 has increased by 30% the number ofsmall (1–4 R⊕) planets orbiting bright stars ( –=J 8 12 mag), asdepicted in Figure 12. We report several new multi-planetsystems, including the four-planet system K2-72 (EPIC206209135); for all these systems we verify that the derivedstellar parameters are consistent for each planet in each system.Our analysis finds 63 remaining planet candidates, which likelyinclude a substantial number of planets waiting to be validated.In this work, we specifically utilize all our available follow-updata to assess the candidate systems. We claim to validatecandidates only when no other plausible explanations areavailable; for example, many systems remain candidatesbecause of nearby stars detected by our high-resolutionimaging.The size of our validated-planet sample demonstrates yet
again the power of high-precision time-series photometry todiscover large numbers of new planets, even when obtainedfrom the wobbly platform of K2. Since K2 represents a naturaltransition from the narrow-field, long-baseline Kepler missionto the nearly all-sky, mostly short-baseline TESS survey, the
18
The Astrophysical Journal Supplement Series, 226:7 (20pp), 2016 September Crossfield et al

results of our K2 efforts bode well for the productivity of theupcoming TESS mission. The substantial numbers of inter-mediate-sized planets orbiting moderately bright stars discov-ered by our (and other) K2 surveys (Figure 12) will be ofconsiderable interest for future follow-up characterization viaRV spectroscopy and JWST transit observations (e.g., Greeneet al. 2016).
We searched the entire sample of K2 targets without regardfor the different criteria used to propose all these stars as targetsfor the K2 mission. Thus, although the planet population wepresent is broadly consistent with the early candidate popula-tion discovered by Kepler (e.g., Borucki et al. 2011), ourresults should not be used to draw conclusions about theintrinsic frequency with which various types of planets occuraround different stars. To do so, we are already investigating afull end-to-end measurement of our survey completeness as afunction of planet and stellar properties. By doing so, we alsohope to compare the quality of the various input catalogs andselection metrics used to pick K2 targets.
Both K2 and TESS offer the potential for exciting newdemographic studies of planets and their host stars. K2observes a qualitatively different stellar population than Kepler,namely a much larger fraction of late-type stars (Huberet al. 2016). Stellar parameters for these late-type systemsderived from photometry alone are relatively uncertain, andfollow-up spectroscopy is underway to characterize these stars(Dressing et al., in prep; Martinez et al., in prep). In addition tothe difference in median SpT, K2 also surveys a much broaderrange of Galactic environments than was observed in the mainKepler mission. These two factors suggest that, once K2’sdetection efficiency is improved and quantified, the mission’sdata could address new questions about the intrinsic frequencyof planets around these different stellar populations.
At present, when comparing our planets and candidates withthose identified by Vanderburg et al. (2016) we find only apartial overlap between the two samples. This result couldimply significant, qualitative differences in vetting effective-ness and survey completeness, and suggests that the analysis oftransit survey data by multiple teams is an essential componentof any strategy to maximize the number of discoveries. Asnoted in Section 6, we estimate that our sample has an overallFPR of 15%–30% (depending on the FPR of candidates withadditional nearby stars), with an indication that FPP increasesfor larger sizes and shorter periods.
We therefore re-emphasize that lists of K2 candidates and/orvalidated planets are not currently suitable for the studies ofplanetary demographics that Kepler so successfully enabled(e.g., Howard et al. 2012; Mulders et al. 2015). The best pathforward to enabling such studies would seem to include robustcharacterization of pipeline detection efficiency, as was donewith Kepler (Petigura et al. 2013b; Dressing & Charbon-neau 2015; Christiansen et al. 2015). It may be that such anapproach, combined with further refinement of the existingphotometry and transit detection pipelines, would allow thefirst characterization of the frequency of planet occurrence withGalactic environment across the diverse stellar populationsprobed by K2’s ecliptic survey.
Barring unexpected technical mishaps, K2 is currentlycapable of operating through at least C18. The number oftargets observed in these first K2 campaigns contains compar-able numbers of targets to later campaigns (with the exceptionof Campaign 0, which had a duration only roughly half that of
the later, ∼80 day campaigns). If K2 continues to observe,based on current discoveries we would expect a planet yieldroughly 4–5 times as great as that currently produced.Accounting for the relatively large survey incompletenessrevealed by comparing our results to other K2 surveys(Vanderburg et al. 2016), we expect K2 to find anywherefrom 500 to 1000 planets over its total mission lifetime.Analysis and follow-up of these systems will occupy exoplanetobservers up to the TESS era, and beyond.
For useful suggestions and comments on an early draft wethank Andrew Vanderburg, Knicole Colon, Tim Morton, andMichael Werner. We thank Katherine de Kleer and Imke dePater for contributing observations, and our many, manytelescope operators and observing assistants for helping usobtain such a wealth of data.This paper includes data collected by the K2 mission.
Funding for the K2 mission is provided by the NASA ScienceMission directorate.This work was performed in part under contract with the Jet
Propulsion Laboratory (JPL) funded by NASA through theSagan Fellowship Program executed by the NASA ExoplanetScience Institute. E.A.P. acknowledges support by NASAthrough a Hubble Fellowship grant awarded by the SpaceTelescope Science Institute, which is operated by the Associa-tion of Universities for Research in Astronomy, Inc., forNASA, under contract NAS 5-26555. The Research of JES wassupported by an appointment to the NASA PostdoctoralProgram at the NASA Ames Research Center, administeredby Universities Space Research Association under contractwith NASA. B.J.F. was supported by the National ScienceFoundation Graduate Research Fellowship under grant No.2014184874. Any opinion, findings, and conclusions orrecommendations expressed in this material are those of theauthors and do not necessarily reflect the views of the NationalScience Foundation. A.J. acknowledges support from FON-DECYT project 1130857, BASAL CATA PFB-06, and fromthe Ministry for the Economy, Development, and Tourism’sPrograma Iniciativa Científica Milenio through grantIC 120009, awarded to the Millennium Institute of Astro-physics (MAS).Some of the data presented herein were obtained at the W.M.
Keck Observatory (which is operated as a scientific partnershipamong Caltech, UC, and NASA) and at the Infrared TelescopeFacility (IRTF, operated by UH under NASA contractNNH14CK55B). The authors wish to recognize and acknowl-edge the very significant cultural role and reverence that thesummit of Maunakea has always had within the indigenousHawaiian community. We are most fortunate to have theopportunity to conduct observations from this mountain.C.B. acknowledges support from the Alfred P. Sloan
Foundation. The Robo-AO system was developed by thecollaborating partner institutions, the California Institute ofTechnology and the Inter-University Centre for Astronomy andAstrophysics, and with the support of the National ScienceFoundation under grant Nos. AST-0906060, AST-0960343,and AST-1207891, the Mt. Cuba Astronomical Foundation,and by a gift from Samuel Oschin.The Pan-STARRS1 Surveys (PS1) have been made possible
through the contributions of the Institute for Astronomy, theUniversity of Hawaii, the Pan-STARRS Project Office, theMax Planck Society and its participating institutes, the Max
19
The Astrophysical Journal Supplement Series, 226:7 (20pp), 2016 September Crossfield et al

Planck Institute for Astronomy, Heidelberg and the MaxPlanck Institute for Extraterrestrial Physics, Garching, TheJohns Hopkins University, Durham University, the Universityof Edinburgh, Queen’s University Belfast, the Harvard-Smithsonian Center for Astrophysics, the Las CumbresObservatory Global Telescope Network Incorporated, theNational Central University of Taiwan, the Space TelescopeScience Institute, the National Aeronautics and Space Admin-istration under grant No. NNX08AR22G issued through thePlanetary Science Division of the NASA Science MissionDirectorate, the National Science Foundation under grant No.AST-1238877, the University of Maryland, and Eotvos LorandUniversity (ELTE).
Facilities: APF (Levy), Kepler, K2, Keck:I (HIRES),Keck:II (NIRC2), IRTF (SpeX), Palomar:Hale (PALM-3000/PHARO), Palomar:1.5 m (Robo-AO), Gemini:North (DSSI),Gemini:South (NIRI), LBT (LMIRCam).
REFERENCES
Adams, E. R., Ciardi, D. R., Dupree, A. K., et al. 2012, AJ, 144, 42Adams, E. R., Jackson, B., & Endl, M. 2016, AJ, 152, 47Aller, K. M., Kraus, A. L., Liu, M. C., et al. 2013, ApJ, 773, 63Almenara, J. M., Astudillo-Defru, N., Bonfils, X., et al. 2015, A&A, 581, L7Angus, R., Foreman-Mackey, D., & Johnson, J. A. 2016, ApJ, 818, 109Armstrong, D. J., Kirk, J., Lam, K. W. F., et al. 2016, MNRAS, 456, 2260Armstrong, D. J., Santerne, A., Veras, D., et al. 2015, A&A, 582, A33Baranec, C., Riddle, R., Law, N. M., et al. 2013, Journal of Visualized
Experiments, 72, e50021Baranec, C., Riddle, R., Law, N. M., et al. 2014, ApJL, 790, L8Baranne, A., Mayor, M., & Poncet, J. L. 1979, VA, 23, 279Barros, S. C. C., Almenara, J. M., Demangeon, O., et al. 2015, MNRAS,
454, 4267Becker, J. C., Vanderburg, A., Adams, F. C., Rappaport, S. A., &
Schwengeler, H. M. 2015, ApJL, 812, L18Beichman, C., Livingston, J., Werner, M., et al. 2016, ApJ, 822, 39Borucki, W. J., Koch, D. G., Basri, G., et al. 2011, ApJ, 736, 19Boyajian, T. S., von Braun, K., van Belle, G., et al. 2012, ApJ, 757, 112Christiansen, J. L., Clarke, B. D., Burke, C. J., et al. 2015, ApJ, 810, 95Ciardi, D. R., Beichman, C. A., Horch, E. P., & Howell, S. B. 2015, ApJ,
805, 16Coelho, P., Barbuy, B., Meléndez, J., Schiavon, R. P., & Castilho, B. V. 2005,
A&A, 443, 735Collier Cameron, A., Wilson, D. M., West, R. G., et al. 2007, MNRAS,
380, 1230Coughlin, J. L., Mullally, F., Thompson, S. E., et al. 2016, ApJS, 224, 12Crossfield, I. J. M., Petigura, E., Schlieder, J. E., et al. 2015, ApJ, 804, 10Dai, F., Winn, J. N., Albrecht, S., et al. 2016, ApJ, 823, 115David, T. J., Hillenbrand, L. A., Cody, A. M., Carpenter, J. M., &
Howard, A. W. 2016a, ApJ, 816, 21David, T. J., Hillenbrand, L. A., Petigura, E. A., et al. 2016b, Natur, 534, 658Dekany, R., Roberts, J., Burruss, R., et al. 2013, ApJ, 776, 130Díaz, R. F., Almenara, J. M., Santerne, A., et al. 2014, MNRAS, 441, 983Dotter, A., Chaboyer, B., Jevremović, D., et al. 2008, ApJS, 178, 89Dressing, C. D., & Charbonneau, D. 2015, ApJ, 807, 45Espinoza, N., et al. 2016, arXiv:1601.07635Feiden, G. A., & Chaboyer, B. 2012, ApJ, 757, 42Foreman-Mackey, D., Hogg, D. W., Lang, D., & Goodman, J. 2012,
arXiv:1202.3665Foreman-Mackey, D., Montet, B. T., Hogg, D. W., et al. 2015, ApJ,
806, 215Fulton, B. J., Howard, A. W., Winn, J. N., et al. 2013, ApJ, 772, 80Greene, T. P., Line, M. R., Montero, C., et al. 2016, ApJ, 817, 17Grziwa, S., Gandolfi, D., Csizmadia, S., et al. 2015, arXiv:1510.09149Hayward, T. L., Brandl, B., Pirger, B., et al. 2001, PASP, 113, 105Hellier, C., Anderson, D. R., Collier Cameron, A., et al. 2012, MNRAS,
426, 739Hirano, T., Fukui, A., Mann, A. W., et al. 2016, ApJ, 820, 41Hodapp, K.-W., Irwin, E. M., Yamada, H., et al. 2003, Proc. SPIE, 4841, 869
Horch, E. P., Howell, S. B., Everett, M. E., & Ciardi, D. R. 2012, AJ, 144, 165Horch, E. P., Veillette, D. R., Baena Gallé, R., et al. 2009, AJ, 137, 5057Howard, A. W., Marcy, G. W., Bryson, S. T., et al. 2012, ApJS, 201, 15Howard, A. W., Marcy, G. W., Johnson, J. A., et al. 2010, Sci, 330, 653Howell, S. B., Rowe, J. F., Bryson, S. T., et al. 2012, ApJ, 746, 123Howell, S. B., Sobeck, C., Haas, M., et al. 2014, PASP, 126, 398Huang, C. X., Hartman, J. D., Bakos, G. Á., et al. 2015, AJ, 150, 85Huber, D., Bryson, S. T., Haas, M. R., et al. 2016, ApJS, 224, 2Huber, D., Ireland, M. J., Bedding, T. R., et al. 2012, ApJ, 760, 32Johnson, M. C., Gandolfi, D., Fridlund, M., et al. 2016, AJ, 151, 171Jordán, A., Brahm, R., Bakos, G. Á., et al. 2014, AJ, 148, 29Kaiser, N., Aussel, H., Burke, B. E., et al. 2002, Proc. SPIE, 4836, 154Kaufer, A., & Pasquini, L. 1998, Proc. SPIE, 3355, 844Kolbl, R., Marcy, G. W., Isaacson, H., & Howard, A. W. 2015, AJ, 149, 18Kraus, A. L., & Hillenbrand, L. A. 2007, AJ, 134, 2340Kreidberg, L. 2015, PASP, 127, 1161LaCourse, D. M., Jek, K. J., Jacobs, T. L., et al. 2015, MNRAS, 452, 3561Law, N. M., Morton, T., Baranec, C., et al. 2014, ApJ, 791, 35Leisenring, J. M., Skrutskie, M. F., Hinz, P. M., et al. 2012, Proc. SPIE, 8446,
84464FLépine, S., & Shara, M. M. 2005, AJ, 129, 1483Lillo-Box, J., Demangeon, O., Santerne, A., et al. 2016, arXiv:1601.07635Lissauer, J. J., Marcy, G. W., Rowe, J. F., et al. 2012, ApJ, 750, 112Maldonado, J., Affer, L., Micela, G., et al. 2015, A&A, 577, A132Mann, A. W., Gaidos, E., Mace, G. N., et al. 2016, ApJ, 818, 46Marigo, P., Girardi, L., Bressan, A., et al. 2008, A&A, 482, 883Montet, B. T., Morton, T. D., Foreman-Mackey, D., et al. 2015, ApJ, 809, 25Morton, T. D. 2012, ApJ, 761, 6Morton, T. D. 2015, VESPA: False Positive Probabilities Calculator,
Astrophysics Source Code Library, ascl:1503.011Morton, T. D., Bryson, S. T., Coughlin, J. L., et al. 2016, ApJ, 822, 86Mulders, G. D., Pascucci, I., & Apai, D. 2015, ApJ, 814, 130Narita, N., Hirano, T., Fukui, A., et al. 2015, ApJ, 815, 47Neveu-VanMalle, M., Queloz, D., Anderson, D. R., et al. 2016, A&A,
586, A93Osborn, H. P., Armstrong, D. J., Brown, D. J. A., et al. 2016, MNRAS,
457, 2273Parviainen, H., & Aigrain, S. 2015, MNRAS, 453, 3821Pecaut, M. J., & Mamajek, E. E. 2013, ApJS, 208, 9Petigura, E. A. 2015, arXiv:1510.03902Petigura, E. A., Howard, A. W., & Marcy, G. W. 2013a, PNAS, 110, 19273Petigura, E. A., Howard, A. W., Lopez, E. D., et al. 2016, ApJ, 818, 36Petigura, E. A., Marcy, G. W., & Howard, A. W. 2013b, ApJ, 770, 69Petigura, E. A., Schlieder, J. E., Crossfield, I. J. M., et al. 2015, ApJ, 811, 102Queloz, D. 1995, in IAU Symp. 167, New Developments in Array Technology
and Applications, ed. A. G. D. Philip, K. Janes, & A. R. Upgren, 221Ricker, G. R., Winn, J. N., Vanderspek, R., et al. 2014, Proc. SPIE, 9143
20Rodriguez, D. R., Zuckerman, B., Kastner, J. H., et al. 2013, ApJ, 774, 101Rowe, J. F., Bryson, S. T., Marcy, G. W., et al. 2014, ApJ, 784, 45Sanchis-Ojeda, R., Rappaport, S., Pallé, E., et al. 2015, ApJ, 812, 112Santerne, A., Díaz, R. F., Almenara, J.-M., et al. 2015, MNRAS, 451, 2337Santerne, A., Hébrard, G., Lillo-Box, J., et al. 2016a, ApJ, 824, 55Santerne, A., Moutou, C., Tsantaki, M., et al. 2016b, A&A, 587, A64Schlieder, J. E., Crossfield, I. J. M., Petigura, E. A., et al. 2016, ApJ, 818, 87Schmitt, J. R., Tokovinin, A., Wang, J., et al. 2016, AJ, 151, 159Sinukoff, E., Howard, A. W., Petigura, E., et al. 2016, ApJ, 827, 78Stassun, K. G., Pepper, J. A., Paegert, M., De Lee, N., & Sanchis-Ojeda, R.
2014, arXiv:1410.6379Ter Braak, C. J. F. 2006, Statistics and Computing, 16, 239Teske, J. K., Everett, M. E., Hirsch, L., et al. 2015, AJ, 150, 144Torres, G., Fischer, D. A., Sozzetti, A., et al. 2012, ApJ, 757, 161Torres, G., Fressin, F., Batalha, N. M., et al. 2011, ApJ, 727, 24Valenti, J. A., & Fischer, D. A. 2005, ApJS, 159, 141Van Cleve, J. E., Howell, S. B., Smith, J. C., et al. 2016, PASP, 128, 075002Van Eylen, V., Albrecht, S., Gandolfi, D., et al. 2016b, arXiv:1605.09180Van Eylen, V., Nowak, G., Albrecht, S., et al. 2016a, ApJ, 820, 56Vanderburg, A., & Johnson, J. A. 2014, PASP, 126, 948Vanderburg, A., Latham, D. W., Buchhave, L. A., et al. 2016, ApJS, 222, 14Vanderburg, A., Montet, B. T., Johnson, J. A., et al. 2015, ApJ, 800, 59Vogt, S. S., Allen, S. L., Bigelow, B. C., et al. 1994, Proc. SPIE, 2198, 362Zenteno, A., Forster, F., Rest, A., et al. 2015, ATel, 7664Ziegler, C., Law, N. M., Morton, T., et al. 2016, arXiv:1605.03584
20
The Astrophysical Journal Supplement Series, 226:7 (20pp), 2016 September Crossfield et al