citigroup october 16, 2008 - third quarter press release
TRANSCRIPT

CITIGROUP - QUARTERLY FINANCIAL DATA SUPPLEMENT 3Q08
Page Number
Citigroup Consolidated Financial Summary 1Consolidated Statement of Income 2Consolidated Balance Sheet 3Income: Segment View 4 Regional View 5Net Revenues:
Segment View 6Regional View 7
Segment Detail
Global Cards 8 - 10
Consumer Banking 11 -14
Institutional Clients Group (ICG) 15Securities and Banking 16Transaction Services 17
Global Wealth Management 18 - 19
Regional DetailNorth America 20EMEA 21Latin America 22Asia 23 -24
Citigroup Supplemental DetailReturn on Capital 25Average Balances and Interest Rates 26Consumer Loan Delinquency Amounts, Net Credit Losses and Ratios 27Allowance for Credit Losses:
Total Citigroup 28 Consumer Loans 29 Corporate Loans 30
Components of Provision for Loan Losses 31Non-Performing Assets 32

Page 1
CITIGROUP -- FINANCIAL SUMMARY(In millions of dollars, except per share amounts)
3Q08 vs. Nine Nine YTD 2008 vs.1Q 2Q 3Q 4Q 1Q 2Q 3Q 3Q07 Increase/ Months Months YTD 2007 Increase/
2007 2007 2007 2007 2008 2008 2008 (Decrease) 2007 2008 (Decrease)
Total Revenues, Net of Interest Expense $ 24,646 $ 25,790 $ 21,640 $ 6,419 $ 12,441 $ 18,077 $ 16,680 (23%) $ 72,076 $ 47,198 (35%)Total Operating Expenses 15,121 14,429 14,152 16,100 15,775 15,644 14,425 2% 43,702 45,844 5%Provision for Loan Losses and for Benefits and Claims 2,810 2,579 4,867 7,661 5,852 7,100 9,067 86% 10,256 22,019 NMIncome Taxes 1,797 2,619 492 (7,406) (3,939) (2,404) (3,294) NM 4,908 (9,637) NMMinority Interest 47 123 20 95 (21) 76 (95) NM 190 (40) NM
Income (Loss) from Continuing Operations $ 4,871 $ 6,040 $ 2,109 $ (10,031) $ (5,226) $ (2,339) $ (3,423) NM $ 13,020 $ (10,988) NMDiscontinued Operations, After-tax 141 186 103 198 115 (156) 608 NM 430 567 32%
Net Income (Loss) $ 5,012 $ 6,226 $ 2,212 $ (9,833) $ (5,111) $ (2,495) $ (2,815) NM $ 13,450 $ (10,421) NM
Diluted Earnings Per Share:
Income (Loss) from Continuing Operations $ 0.98 $ 1.21 $ 0.42 $ (2.03) (1) $ (1.04) (1) $ (0.51) (1) $ (0.71) (1) NM $ 2.60 $ (2.26) (1) NM
Net Income (Loss) $ 1.01 $ 1.24 $ 0.44 $ (1.99) (1) $ (1.02) (1) $ (0.54) (1) $ (0.60) (1) NM $ 2.69 $ (2.15) (1) NM
Shares (in millions):
Average Basic 4,877.0 4,898.3 4,916.1 4,931.9 5,085.6 5,287.4 5,341.8 9% 4,897.1 5,238.3 Average Diluted 4,967.9 4,992.9 5,010.9 5,009.3 5,591.1 5,800.0 5,867.3 17% 4,990.6 5,752.8
Common Shares Outstanding, at period end 4,946.4 4,974.6 4,981.1 4,994.6 5,249.8 5,445.4 5,449.5 9%
Preferred Dividends - Basic (in millions) (2) $ 16 $ 14 $ 6 $ - $ 83 $ 361 $ 389 $ 36 $ 833
Preferred Dividends - Diluted (in millions) (2) $ 16 $ 14 $ 6 $ - $ 17 $ 91 $ 119 $ 36 $ 227
Financial Ratios:Tier 1 Capital Ratio 8.26% 7.91% 7.32% 7.12% 7.74% 8.74% 8.2% *
Total Capital Ratio 11.48% 11.23% 10.61% 10.70% 11.22% 12.29% 11.7% *
Leverage Ratio 4.84% 4.37% 4.13% 4.03% 4.39% 5.04% 4.7% *
Return on Common Equity 17.1% 20.1% 6.9% (32.4%) (18.6%) (10.4%) (12.2%) * 14.6% (13.8%)
Balance Sheet Data, EOP (in billions, except Book Value per Share):
Total Assets $ 2,020.8 $ 2,220.7 $ 2,358.1 $ 2,187.5 $ 2,199.7 $ 2,100.4 $ 2,050.5 * (13%)
Trading Account Assets 460.1 538.3 581.2 539.0 578.4 505.4 457.2 * (21%)
Total Loans 693.3 742.9 774.0 778.0 789.8 746.8 717.0 * (7%)
Total Deposits 738.5 771.8 812.9 826.2 831.2 803.6 780.3 * (4%)
Stockholders' Equity 121.9 127.6 127.0 113.4 128.1 136.4 126.1 * (1%)
Equity and Trust Securities 131.3 137.8 138.7 137.2 152.2 160.1 149.7 * 8%
Book Value Per Share $ 24.45 $ 25.53 $ 25.45 $ 22.71 $ 20.70 $ 20.01 $ 18.10 * (29%)
Direct Staff (in thousands) 343 361 371 375 369 363 352 * (5%)
Segment Net Income:Global Cards $ 1,250 $ 1,048 $ 1,442 $ 934 $ 1,226 $ 452 $ (902) NM $ 3,740 $ 776 (79%)
Consumer Banking 1,179 1,400 156 (578) 52 (828) (1,099) NM 2,735 (1,875) NMInstitutional Clients Group (ICG) 2,917 3,384 267 (10,723) (6,357) (2,044) (2,017) NM 6,568 (10,418) NMGlobal Wealth Management (GWM) 448 512 490 524 294 405 363 (26%) 1,450 1,062 (27%)Corporate/Other (923) (304) (246) (188) (441) (324) 232 NM (1,473) (533) 64%Discontinued Operations 141 186 103 198 115 (156) 608 NM 430 567 32%
Total Net Income $ 5,012 $ 6,226 $ 2,212 $ (9,833) $ (5,111) $ (2,495) $ (2,815) NM $ 13,450 $ (10,421) NM
Regional Net Income (3):
North America $ 3,244 $ 3,397 $ 481 $ (8,947) $ (5,586) $ (3,317) $ (4,639) NM $ 7,122 $ (13,542) NMEurope, Middle East and Africa (EMEA) 693 910 (20) (3,296) (1,159) (128) 9 NM 1,583 (1,278) NMLatin America 785 787 1,084 939 1,195 658 280 (74%) 2,656 2,133 (20%)Asia 1,072 1,250 810 1,461 765 772 695 (14%) 3,132 2,232 (29%)Corporate/Other (923) (304) (246) (188) (441) (324) 232 NM (1,473) (533) 64%Discontinued Operations 141 186 103 198 115 (156) 608 NM 430 567 32%
Total Net Income $ 5,012 $ 6,226 $ 2,212 $ (9,833) $ (5,111) $ (2,495) $ (2,815) NM $ 13,450 $ (10,421) NM
(1) Diluted shares used in the Diluted EPS calculation represent Basic Shares for the fourth quarter of 2007, first, second and third quarters of 2008 due to the Net Loss. Using actual Diluted shares would result in anti-dilution.
(2) Beginning in the fourth quarter of 2008, preferred stock dividends (subject to declaration) will vary quarter-to-quarter due to Series E being declared on a semi-annual basis compared to a quarterly basis for all other series.
(3) Asia includes Japan, Latin America includes Mexico, and North America includes U.S., Canada and Puerto Rico.
NM Not meaningful
Reclassified to conform to the current period's presentation.
* Preliminary

Page 2
CITIGROUP CONSOLIDATED STATEMENT OF INCOME(In millions of dollars)
3Q08 vs. Nine Nine YTD 2008 vs.1Q 2Q 3Q 4Q 1Q 2Q 3Q 3Q07 Increase/ Months Months YTD 2007 Increase/
2007 2007 2007 2007 2008 2008 2008 (Decrease) 2007 2008 (Decrease)Revenues
Interest revenue $ 27,417 $ 29,889 $ 32,267 $ 31,856 $ 29,190 $ 27,372 $ 26,182 (19%) $ 89,573 $ 82,744 (8%)Interest expense 17,192 18,812 20,423 19,624 16,122 13,407 12,776 (37%) 56,427 42,305 (25%)
Net interest revenue 10,225 11,077 11,844 12,232 13,068 13,965 13,406 13% 33,146 40,439 22%
Commissions and fees 5,488 6,526 3,944 4,748 1,576 6,043 3,425 (13%) 15,958 11,044 (31%)Principal transactions 3,166 2,627 (246) (17,633) (6,663) (5,589) (2,904) NM 5,547 (15,156) NMAdministrative and other fiduciary fees 1,941 2,234 2,460 2,497 2,298 2,289 2,165 (12%) 6,635 6,752 2%Realized gains (losses) from sales of investments 473 119 263 313 (119) (139) (605) NM 855 (863) NM
Insurance premiums 730 743 772 817 843 847 823 7% 2,245 2,513 12%Other revenue 2,623 2,464 2,603 3,445 1,438 661 370 (86%) 7,690 2,469 (68%)
Total non-interest revenues 14,421 14,713 9,796 (5,813) (627) 4,112 3,274 (67%) 38,930 6,759 (83%)
Total revenues, net of interest expense 24,646 25,790 21,640 6,419 12,441 18,077 16,680 (23%) 72,076 47,198 (35%)
Provisions for Credit Losses and for Benefits and ClaimsProvision for loan losses 2,549 2,382 4,581 7,320 5,577 6,983 8,943 95% 9,512 21,503 NMPolicyholder benefits and claims 261 197 236 241 275 260 274 16% 694 809 17%Provision for unfunded lending commitments - - 50 100 - (143) (150) NM 50 (293) NM
Total provisions for credit losses and for benefits and claims 2,810 2,579 4,867 7,661 5,852 7,100 9,067 86% 10,256 22,019 NM
Operating ExpensesCompensation and benefits 8,566 8,787 7,595 8,944 8,933 9,060 7,865 4% 24,948 25,858 4%Premises and Equipment 1,525 1,595 1,741 1,787 1,783 1,834 1,771 2% 4,861 5,388 11%Technology / communication expense 970 1,139 1,159 1,243 1,215 1,248 1,240 7% 3,268 3,703 13%Advertising and marketing expense 578 733 766 726 636 648 515 (33%) 2,077 1,799 (13%)Restructuring-related items 1,377 63 35 53 15 (44) 8 (77%) 1,475 (21) NMOther operating 2,105 2,112 2,856 3,347 3,193 2,898 3,026 6% 7,073 9,117 29%
Total operating expenses 15,121 14,429 14,152 16,100 15,775 15,644 14,425 2% 43,702 45,844 5%
Income (Loss) from Continuing Operations before Income
Taxes and Minority Interest 6,715 8,782 2,621 (17,342) (9,186) (4,667) (6,812) NM 18,118 (20,665) NM
Provision (benefits) for income taxes 1,797 2,619 492 (7,406) (3,939) (2,404) (3,294) NM 4,908 (9,637) NMMinority interest, net of income taxes 47 123 20 95 (21) 76 (95) NM 190 (40) NM
Income (Loss) from Continuing Operations 4,871 6,040 2,109 (10,031) (5,226) (2,339) (3,423) NM 13,020 (10,988) NM
Discontinued Operations (1)Income from Discontinued Operations 206 277 148 294 163 232 501 631 896 Gain (Loss) on Sale / Pending Sale - - - - - (517) 9 - (508)Provision (benefits) for income taxes 65 91 45 96 48 (129) (98) 201 (179)
Income from Discontinued Operations, net 141 186 103 198 115 (156) 608 430 567
Net Income (Loss) $ 5,012 $ 6,226 $ 2,212 $ (9,833) $ (5,111) $ (2,495) $ (2,815) NM $ 13,450 $ (10,421) NM
(1) Discontinued Operations includes:
NM Not meaningful
Reclassified to conform to the current period's presentation.
a) The sale of substantially all of Citigroup’s CitiCapital equipment finance unit to General Electric.b) The sale of substantially all of Citigroup’s Retail Banking Operations in Germany to Credit Mutuel.

Page 3
CITIGROUP CONSOLIDATED BALANCE SHEET(In millions of dollars)
Sept 30, 2008vs.
March 31, June 30, September 30, December 31, March 31, June 30, September 30, December 31, 20072007 2007 2007 2007 2008 2008 2008 (1) Inc (Decr)
AssetsCash and due from banks (including segregated cash and other deposits) $ 24,421 $ 30,635 $ 38,226 $ 38,206 $ 30,837 $ 44,824 $ 62,951 65%Deposits with banks 44,906 70,897 58,713 69,366 73,318 67,945 78,670 13%Federal funds sold and securities borrowed or purchased under agreements to resell 303,925 348,129 383,217 274,066 239,006 220,169 225,409 (18%)Brokerage receivables 51,976 61,144 69,062 57,359 65,653 62,492 80,532 40%Trading account assets 460,065 538,316 581,220 538,984 578,437 505,439 457,193 (15%)Investments 286,567 257,880 240,828 215,008 204,155 232,528 205,731 (4%)Loans, net of unearned income
Consumer (2) 519,105 551,223 570,891 592,307 596,987 571,238 543,436 (8%)Corporate 174,239 191,701 203,078 185,686 192,856 175,552 173,519 (7%)
Loans, net of unearned income 693,344 742,924 773,969 777,993 789,843 746,790 716,955 (8%)Allowance for loan losses (9,510) (10,381) (12,728) (16,117) (18,257) (20,777) (24,005) (49%)
Total loans, net 683,834 732,543 761,241 761,876 771,586 726,013 692,950 (9%)Goodwill 34,229 39,080 39,798 41,053 43,471 42,386 39,662 (3%)Intangible assets 19,330 22,975 23,651 22,687 23,945 24,542 23,464 3%Other assets 111,562 119,116 162,159 168,875 169,289 161,101 165,280 (2%)Assets of discontinued operations held for sale (2) - - - - - 12,946 18,627 -
Total assets $ 2,020,815 $ 2,220,715 $ 2,358,115 $ 2,187,480 $ 2,199,697 $ 2,100,385 $ 2,050,469 (6%)
LiabilitiesNon-interest-bearing deposits in U.S. offices $ 39,296 $ 41,740 $ 38,842 $ 40,859 $ 43,779 $ 49,636 $ 61,694 51%Interest-bearing deposits in U.S. offices 198,840 196,481 211,147 225,198 226,285 210,916 215,423 (4%)Non-interest-bearing deposits in offices outside the U.S. 36,328 39,132 43,052 43,335 45,230 46,765 46,348 7%Interest-bearing deposits in offices outside the U.S. 464,057 494,408 519,809 516,838 515,914 496,325 456,878 (12%)
Total deposits (2) 738,521 771,761 812,850 826,230 831,208 803,642 780,343 (6%)
Federal funds purchased and securities loaned or sold under agreements to repurchase 393,670 394,143 440,369 304,243 279,561 246,107 250,419 (18%)Brokerage payables 88,722 96,528 94,830 84,951 95,597 96,432 117,536 38%Trading account liabilities 173,902 217,992 215,623 182,082 201,986 189,468 169,283 (7%)
Short-term borrowings 111,179 167,139 194,304 146,488 135,799 114,445 101,855 (30%)Long-term debt 310,768 340,077 364,526 427,112 424,959 417,928 396,097 (7%)Other liabilities (3) 82,121 105,472 108,651 102,927 102,519 95,502 94,601 (8%)Liabilities of discontinued operations held for sale (2) - - - - - 456 14,273 -
Total liabilities 1,898,883 2,093,112 2,231,153 2,074,033 2,071,629 1,963,980 1,924,407 (7%) Stockholders' equityPreferred Stock 1,000 600 200 - 19,384 27,424 27,424 -Common Stock 55 55 55 55 55 57 57 4%Additional paid-in capital 17,341 17,725 18,297 18,007 11,131 16,594 16,884 (6%)Retained earnings 131,244 134,781 134,294 121,769 114,899 110,290 105,340 (13%)Treasury stock (23,833) (22,588) (22,329) (21,724) (10,020) (9,911) (9,642) 56%Accumulated other comprehensive income (loss) (3,875) (2,970) (3,555) (4,660) (7,381) (8,049) (14,001) NM
Total stockholders' equity 121,932 127,603 126,962 113,447 128,068 136,405 126,062 11%
Total liabilities and stockholders' equity $ 2,020,815 $ 2,220,715 $ 2,358,115 $ 2,187,480 $ 2,199,697 $ 2,100,385 $ 2,050,469 (6%)
(1) Preliminary
(2) Assets and Liabilities of discontinued operations held-for-sale include $15.6 billion of loans and $13.5 billion of deposits at September 30, 2008, respectively, related to the announced sale of Citigroup's Retail Banking Operations in Germany.
(3) Includes allowance for credit losses for letters of credit and unfunded lending commitments of $1,100 million for
the first and second quarters of 2007, $1,150 million for the third quarter of 2007 and $1,250 million for the fourth quarter of 2007, respectively, $1,250 million for the first quarter of 2008, $1,107 million for the second quarter of 2008, and $957 million for the third quarter of 2008, respectively.
NM Not meaningful
Reclassified to conform to the current period's presentation.
Page 4
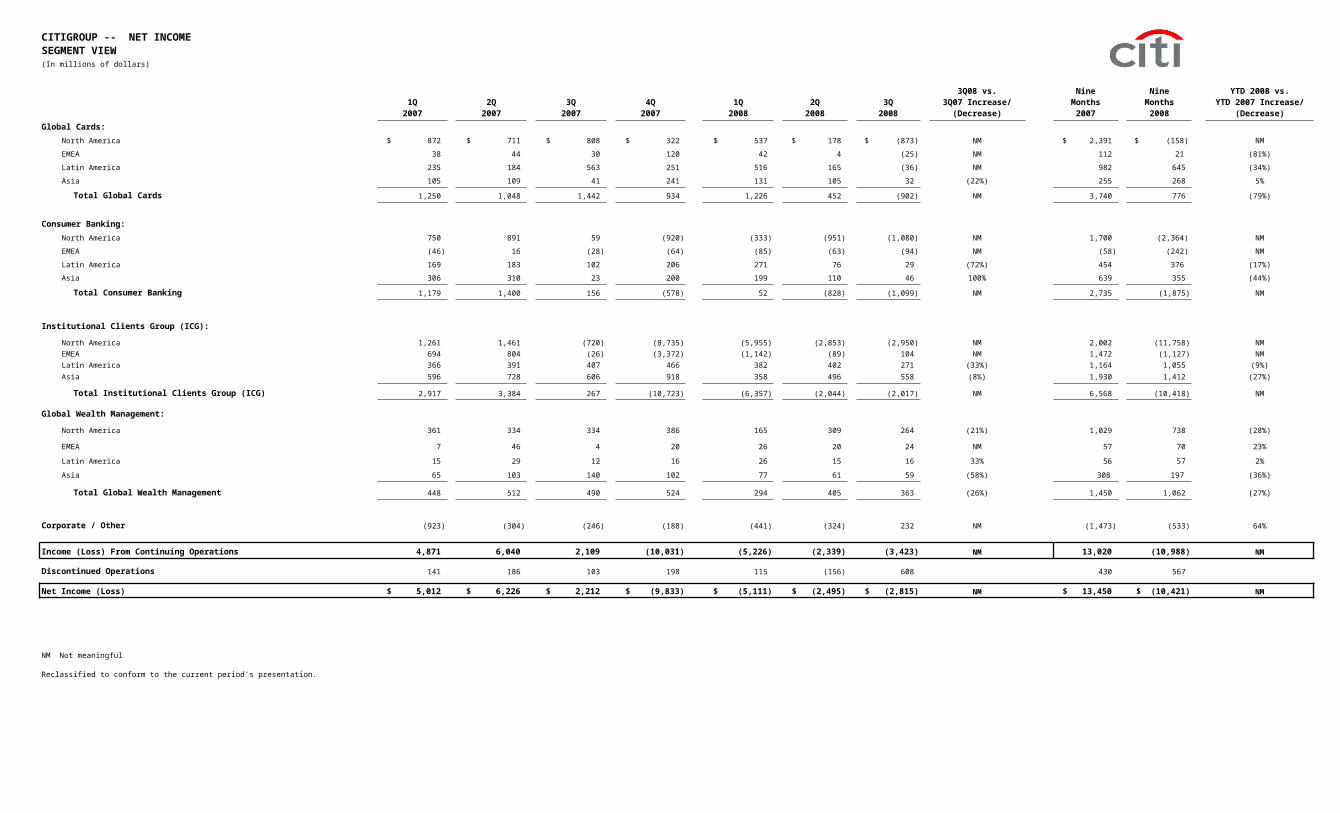
CITIGROUP -- NET INCOMESEGMENT VIEW(In millions of dollars)
3Q08 vs. Nine Nine YTD 2008 vs.1Q 2Q 3Q 4Q 1Q 2Q 3Q 3Q07 Increase/ Months Months YTD 2007 Increase/
2007 2007 2007 2007 2008 2008 2008 (Decrease) 2007 2008 (Decrease)Global Cards:
North America $ 872 $ 711 $ 808 $ 322 $ 537 $ 178 $ (873) NM $ 2,391 $ (158) NM
EMEA 38 44 30 120 42 4 (25) NM 112 21 (81%)
Latin America 235 184 563 251 516 165 (36) NM 982 645 (34%)
Asia 105 109 41 241 131 105 32 (22%) 255 268 5%
Total Global Cards 1,250 1,048 1,442 934 1,226 452 (902) NM 3,740 776 (79%)
Consumer Banking:North America 750 891 59 (920) (333) (951) (1,080) NM 1,700 (2,364) NM
EMEA (46) 16 (28) (64) (85) (63) (94) NM (58) (242) NM
Latin America 169 183 102 206 271 76 29 (72%) 454 376 (17%)
Asia 306 310 23 200 199 110 46 100% 639 355 (44%)
Total Consumer Banking 1,179 1,400 156 (578) 52 (828) (1,099) NM 2,735 (1,875) NM
Institutional Clients Group (ICG):
North America 1,261 1,461 (720) (8,735) (5,955) (2,853) (2,950) NM 2,002 (11,758) NMEMEA 694 804 (26) (3,372) (1,142) (89) 104 NM 1,472 (1,127) NMLatin America 366 391 407 466 382 402 271 (33%) 1,164 1,055 (9%)Asia 596 728 606 918 358 496 558 (8%) 1,930 1,412 (27%)
Total Institutional Clients Group (ICG) 2,917 3,384 267 (10,723) (6,357) (2,044) (2,017) NM 6,568 (10,418) NM
Global Wealth Management:
North America 361 334 334 386 165 309 264 (21%) 1,029 738 (28%)
EMEA 7 46 4 20 26 20 24 NM 57 70 23%
Latin America 15 29 12 16 26 15 16 33% 56 57 2%
Asia 65 103 140 102 77 61 59 (58%) 308 197 (36%)
Total Global Wealth Management 448 512 490 524 294 405 363 (26%) 1,450 1,062 (27%)
Corporate / Other (923) (304) (246) (188) (441) (324) 232 NM (1,473) (533) 64%
Income (Loss) From Continuing Operations 4,871 6,040 2,109 (10,031) (5,226) (2,339) (3,423) NM 13,020 (10,988) NM
Discontinued Operations 141 186 103 198 115 (156) 608 430 567
Net Income (Loss) $ 5,012 $ 6,226 $ 2,212 $ (9,833) $ (5,111) $ (2,495) $ (2,815) NM $ 13,450 $ (10,421) NM
NM Not meaningful
Reclassified to conform to the current period's presentation.

Page 5
CITIGROUP -- NET INCOMEREGIONAL VIEW(In millions of dollars)
3Q08 vs. Nine Nine YTD 2008 vs.1Q 2Q 3Q 4Q 1Q 2Q 3Q 3Q07 Increase/ Months Months YTD 2007 Increase/
2007 2007 2007 2007 2008 2008 2008 (Decrease) 2007 2008 (Decrease)
North AmericaGlobal Cards $ 872 $ 711 $ 808 $ 322 $ 537 $ 178 $ (873) NM $ 2,391 $ (158) NMConsumer Banking 750 891 59 (920) (333) (951) (1,080) NM 1,700 (2,364) NMInstitutional Clients Group 1,261 1,461 (720) (8,735) (5,955) (2,853) (2,950) NM 2,002 (11,758) NM Securities & Banking 1,227 1,409 (780) (8,785) (6,034) (2,904) (3,037) NM 1,856 (11,975) NM Transaction Services 34 52 60 50 79 51 87 45% 146 217 49%Global Wealth Management 361 334 334 386 165 309 264 (21%) 1,029 738 (28%)
Total North America 3,244 3,397 481 (8,947) (5,586) (3,317) (4,639) NM 7,122 (13,542) NM
EMEAGlobal Cards 38 44 30 120 42 4 (25) NM 112 21 (81%)Consumer Banking (46) 16 (28) (64) (85) (63) (94) NM (58) (242) NMInstitutional Clients Group 694 804 (26) (3,372) (1,142) (89) 104 NM 1,472 (1,127) NM Securities & Banking 544 631 (205) (3,543) (1,364) (327) (175) 15% 970 (1,866) NM Transaction Services 150 173 179 171 222 238 279 56% 502 739 47%Global Wealth Management 7 46 4 20 26 20 24 NM 57 70 23%
Total EMEA 693 910 (20) (3,296) (1,159) (128) 9 NM 1,583 (1,278) NM
Latin AmericaGlobal Cards 235 184 563 251 516 165 (36) NM 982 645 (34%)Consumer Banking 169 183 102 206 271 76 29 (72%) 454 376 (17%)Institutional Clients Group 366 391 407 466 382 402 271 (33%) 1,164 1,055 (9%) Securities & Banking 289 301 297 334 250 260 126 (58%) 887 636 (28%) Transaction Services 77 90 110 132 132 142 145 32% 277 419 51%Global Wealth Management 15 29 12 16 26 15 16 33% 56 57 2%
Total Latin America 785 787 1,084 939 1,195 658 280 (74%) 2,656 2,133 (20%)
AsiaGlobal Cards 105 109 41 241 131 105 32 (22%) 255 268 5%Consumer Banking 306 310 23 200 199 110 46 100% 639 355 (44%)Institutional Clients Group 596 728 606 918 358 496 558 (8%) 1,930 1,412 (27%) Securities & Banking 409 527 364 604 59 226 252 (31%) 1,300 537 (59%) Transaction Services 187 201 242 314 299 270 306 26% 630 875 39%Global Wealth Management 65 103 140 102 77 61 59 (58%) 308 197 (36%)
Total Asia 1,072 1,250 810 1,461 765 772 695 (14%) 3,132 2,232 (29%)
Corporate / Other (923) (304) (246) (188) (441) (324) 232 NM (1,473) (533) 64%
Income (Loss) From Continuing Operations 4,871 6,040 2,109 (10,031) (5,226) (2,339) (3,423) NM 13,020 (10,988) NM
Discontinued Operations 141 186 103 198 115 (156) 608 430 567
Net Income (Loss) $ 5,012 $ 6,226 $ 2,212 $ (9,833) $ (5,111) $ (2,495) $ (2,815) NM $ 13,450 $ (10,421) NM
NM Not meaningful
Reclassified to conform to the current period's presentation.

Page 6
CITIGROUP -- NET REVENUESSEGMENT VIEW(In millions of dollars)
3Q08 vs. Nine Nine YTD 2008 vs.1Q 2Q 3Q 4Q 1Q 2Q 3Q 3Q07 Increase/ Months Months YTD 2007 Increase/
2007 2007 2007 2007 2008 2008 2008 (Decrease) 2007 2008 (Decrease)Global Cards:
North America $ 3,407 $ 3,298 $ 3,510 $ 3,678 $ 3,343 $ 2,928 $ 1,388 (60%) $ 10,215 $ 7,659 (25%)
EMEA 349 475 566 565 585 611 593 5% 1,390 1,789 29%
Latin America 867 990 1,728 1,218 1,776 1,229 1,143 (34%) 3,585 4,148 16%
Asia 513 531 538 818 675 659 665 24% 1,582 1,999 26%
Total Global Cards 5,136 5,294 6,342 6,279 6,379 5,427 3,789 (40%) 16,772 15,595 (7%)
Consumer Banking:North America 4,058 4,224 4,164 4,545 4,485 4,124 4,414 6% 12,446 13,023 5%
EMEA 560 603 625 697 700 762 622 - 1,788 2,084 17%
Latin America 946 996 1,071 1,172 1,048 1,038 1,015 (5%) 3,013 3,101 3%
Asia 1,458 1,475 1,442 1,422 1,558 1,431 1,378 (4%) 4,375 4,367 -
Total Consumer Banking 7,022 7,298 7,302 7,836 7,791 7,355 7,429 2% 21,622 22,575 4%
Institutional Clients Group (ICG):
North America 4,245 4,026 110 (11,421) (7,824) (1,748) (2,165) NM 8,381 (11,737) NM
EMEA 2,827 2,993 1,398 (2,983) 133 1,740 1,913 37% 7,218 3,786 (48%)
Latin America 965 985 1,103 1,153 1,012 1,075 828 (25%) 3,053 2,915 (5%)Asia 1,616 2,257 2,006 2,460 1,721 1,872 1,817 (9%) 5,879 5,410 (8%)
Total Institutional Clients Group (ICG) 9,653 10,261 4,617 (10,791) (4,958) 2,939 2,393 (48%) 24,531 374 (98%)
Global Wealth Management:
North America 2,385 2,441 2,455 2,509 2,376 2,427 2,317 (6%) 7,281 7,120 (2%)
EMEA 108 137 139 159 170 153 147 6% 384 470 22%
Latin America 91 92 92 98 100 102 92 - 275 294 7%
Asia 234 527 833 698 633 633 608 (27%) 1,594 1,874 18%
Total Global Wealth Management 2,818 3,197 3,519 3,464 3,279 3,315 3,164 (10%) 9,534 9,758 2%
Corporate / Other 17 (260) (140) (369) (50) (959) (95) 32% (383) (1,104) NM
Total Net Revenues $ 24,646 $ 25,790 $ 21,640 $ 6,419 $ 12,441 $ 18,077 $ 16,680 (23%) $ 72,076 $ 47,198 (35%)
NM Not meaningful
Reclassified to conform to the current period's presentation.

Page 7
CITIGROUP -- NET REVENUESREGIONAL VIEW(In millions of dollars)
3Q08 vs. Nine Nine YTD 2008 vs.1Q 2Q 3Q 4Q 1Q 2Q 3Q 3Q07 Increase/ Months Months YTD 2007 Increase/
2007 2007 2007 2007 2008 2008 2008 (Decrease) 2007 2008 (Decrease)
North AmericaGlobal Cards $ 3,407 $ 3,298 $ 3,510 $ 3,678 $ 3,343 $ 2,928 $ 1,388 (60%) $ 10,215 $ 7,659 (25%)Consumer Banking 4,058 4,224 4,164 4,545 4,485 4,124 4,414 6% 12,446 13,023 5%Institutional Clients Group 4,245 4,026 110 (11,421) (7,824) (1,748) (2,165) NM 8,381 (11,737) NM Securities & Banking 3,907 3,655 (336) (11,889) (8,317) (2,244) (2,693) NM 7,226 (13,254) NM Transaction Services 338 371 446 468 493 496 528 18% 1,155 1,517 31%Global Wealth Management 2,385 2,441 2,455 2,509 2,376 2,427 2,317 (6%) 7,281 7,120 (2%)
Total North America 14,095 13,989 10,239 (689) 2,380 7,731 5,954 (42%) 38,323 16,065 (58%)
EMEAGlobal Cards 349 475 566 565 585 611 593 5% 1,390 1,789 29%Consumer Banking 560 603 625 697 700 762 622 - 1,788 2,084 17%Institutional Clients Group 2,827 2,993 1,398 (2,983) 133 1,740 1,913 37% 7,218 3,786 (48%) Securities & Banking 2,229 2,313 674 (3,762) (680) 871 1,043 55% 5,216 1,234 (76%) Transaction Services 598 680 724 779 813 869 870 20% 2,002 2,552 27%Global Wealth Management 108 137 139 159 170 153 147 6% 384 470 22%
Total EMEA 3,844 4,208 2,728 (1,562) 1,588 3,266 3,275 20% 10,780 8,129 (25%)
Latin AmericaGlobal Cards 867 990 1,728 1,218 1,776 1,229 1,143 (34%) 3,585 4,148 16%Consumer Banking 946 996 1,071 1,172 1,048 1,038 1,015 (5%) 3,013 3,101 3%Institutional Clients Group 965 985 1,103 1,153 1,012 1,075 828 (25%) 3,053 2,915 (5%) Securities & Banking 730 724 812 812 680 707 463 (43%) 2,266 1,850 (18%) Transaction Services 235 261 291 341 332 368 365 25% 787 1,065 35%Global Wealth Management 91 92 92 98 100 102 92 - 275 294 7%
Total Latin America 2,869 3,063 3,994 3,641 3,936 3,444 3,078 (23%) 9,926 10,458 5%
AsiaGlobal Cards 513 531 538 818 675 659 665 24% 1,582 1,999 26%Consumer Banking 1,458 1,475 1,442 1,422 1,558 1,431 1,378 (4%) 4,375 4,367 -Institutional Clients Group 1,616 2,257 2,006 2,460 1,721 1,872 1,817 (9%) 5,879 5,410 (8%) Securities & Banking 1,137 1,722 1,398 1,749 1,012 1,205 1,106 (21%) 4,257 3,323 (22%) Transaction Services 479 535 608 711 709 667 711 17% 1,622 2,087 29%Global Wealth Management 234 527 833 698 633 633 608 (27%) 1,594 1,874 18%
Total Asia 3,821 4,790 4,819 5,398 4,587 4,595 4,468 (7%) 13,430 13,650 2%
Corporate / Other 17 (260) (140) (369) (50) (959) (95) 32% (383) (1,104) NM
Total Net Revenues $ 24,646 $ 25,790 $ 21,640 $ 6,419 $ 12,441 $ 18,077 $ 16,680 (23%) $ 72,076 $ 47,198 (35%)
NM Not meaningful
Reclassified to conform to the current period's presentation.

Page 8
GLOBAL CARDSPage 1(In millions of dollars)
3Q08 vs. Nine Nine YTD 2008 vs.1Q 2Q 3Q 4Q 1Q 2Q 3Q 3Q07 Increase/ Months Months YTD 2007 Increase/
2007 2007 2007 2007 2008 2008 2008 (Decrease) 2007 2008 (Decrease)
Net Interest Revenue $ 2,291 $ 2,660 $ 2,723 $ 3,008 $ 2,706 $ 2,998 $ 2,884 6% $ 7,674 $ 8,588 12%
Non-Interest Revenue 2,845 2,634 3,619 3,271 3,673 2,429 905 (75%) 9,098 7,007 (23%)
Total Revenues, Net of Interest Expense (1) 5,136 5,294 6,342 6,279 6,379 5,427 3,789 (40%) 16,772 15,595 (7%)
Total Operating Expenses 2,400 2,479 2,610 3,082 2,595 2,710 2,595 (1%) 7,489 7,900 5%
Net Credit Losses 865 847 1,045 1,120 1,248 1,412 1,588 52% 2,757 4,248 54%
Credit Reserve Build / (Release) (9) 426 503 652 623 583 1,069 NM 920 2,275 NM
Provision for Benefits & Claims 20 13 20 15 20 24 15 (25%) 53 59 11%
Provision for Loan Losses and for Benefits and Claims 876 1,286 1,568 1,787 1,891 2,019 2,672 70% 3,730 6,582 76%
Income Before Taxes and Minority Interest 1,860 1,529 2,164 1,410 1,893 698 (1,478) NM 5,553 1,113 (80%)
Income Taxes 609 478 719 472 664 242 (579) NM 1,806 327 (82%)Minority Interest 1 3 3 4 3 4 3 - 7 10 43%
Net Income $ 1,250 $ 1,048 $ 1,442 $ 934 $ 1,226 $ 452 $ (902) NM $ 3,740 $ 776 (79%)
Average Assets (in billions of dollars) $ 104 $ 109 $ 113 $ 123 $ 123 $ 123 $ 119 5% $ 109 $ 122 12%
Return on Assets 4.87% 3.86% 5.06% 3.01% 4.01% 1.48% (3.02%) 4.59% 0.85%
Net Credit Loss Ratio 4.70% 4.26% 5.00% 4.78% 5.39% 6.18% 7.02%
Average Risk Capital $ 8,197 $ 8,399 $ 8,722 $ 9,397 $ 14,762 $ 15,233 $ 14,520 66% $ 8,439 $ 14,838 76%
Return on Risk Capital 62% 50% 66% 39% 33% 12% (25%) 59% 7%
Return on Invested Capital 26% 22% 29% 18% 18% 7% (13%) 26% 4%
KEY INDICATORS
EOP Open Accounts (in millions)North America 152.6 150.1 149.1 151.9 148.6 146.9 145.3 (3%)
EMEA 5.6 8.0 8.2 8.4 8.8 8.9 9.1 11%
Latin America 11.7 12.0 12.4 12.9 12.9 12.9 12.9 4%Asia 13.8 14.1 14.3 15.4 15.7 15.7 15.4 8%
Total 183.7 184.2 184.0 188.6 186.0 184.4 182.7 (1%)
Purchase Sales (in billions of dollars)North America $ 73.8 $ 83.5 $ 83.1 $ 89.3 $ 76.9 $ 83.8 $ 80.3 (3%)EMEA 3.9 6.0 7.0 7.8 7.0 7.5 7.5 7%Latin America 5.8 6.8 7.4 8.4 8.2 8.8 8.4 14%Asia 11.6 12.6 13.1 14.8 14.7 15.3 14.9 14%
Total $ 95.1 $ 108.9 $ 110.6 $ 120.3 $ 106.8 $ 115.4 $ 111.1 -
Average Managed Loans (2):North America (managed basis) $ 144.3 $ 143.2 $ 145.3 $ 150.5 $ 152.7 $ 151.2 $ 150.6 4%EMEA 7.2 11.6 14.2 15.1 15.7 16.5 16.2 14%Latin America 10.2 11.7 12.3 13.5 14.1 14.7 14.6 19%Asia 13.2 13.9 14.8 16.0 17.1 17.6 17.3 17%
Total $ 174.9 $ 180.4 $ 186.6 $ 195.1 $ 199.6 $ 200.0 $ 198.7 6%
(1) The 2007 first quarter, 2007 second quarter, 2007 third quarter, 2007 fourth quarter, 2008 first quarter, 2008 second quarter and 2008 third quarter include releases of
$98 million, $144 million, $73 million, $157 million, $58 million, $21 million and $23 million, respectively, from the allowance for credit losses related to loan receivables that were either securitized or transferred to loans held-for-sale during the quarter.
(2) Managed basis is applicable only in North America, as securitizations are not done in any other region.Managed basis presentation includes results from both the on-balance sheet loans and off- balance sheet loans, and excludes the impact of card securitization activity.Managed disclosures assume that securitized loans have not been sold and present the results of the securitized loans in the same manner as the Company's owned loans.
NM Not meaningful
Reclassified to conform to the current period's presentation.

Page 9
GLOBAL CARDSPage 2
(In millions of dollars)
1Q 2Q 3Q 4Q 1Q 2Q 3Q2007 2007 2007 2007 2008 2008 2008
KEY INDICATORS (continued) (1)
Managed Average YieldNorth America (managed basis) 14.21% 14.17% 14.40% 13.87% 13.41% 13.24% 13.64%EMEA 17.94% 16.47% 16.17% 15.31% 15.65% 15.38% 15.50%Latin America 28.28% 29.24% 28.68% 26.27% 28.44% 30.36% 29.03%Asia 13.72% 14.04% 13.78% 13.89% 13.82% 13.79% 13.63%
Global Total 15.13% 15.29% 15.42% 14.84% 14.69% 14.72% 14.92%
Managed Net Interest Revenue as a % of Average Managed Loans
North America (managed basis) 10.07% 10.28% 10.50% 10.07% 10.09% 10.56% 11.03%
EMEA 13.47% 13.89% 13.01% 11.55% 12.20% 12.18% 12.25%
Latin America 21.25% 23.90% 23.26% 21.13% 22.93% 25.51% 22.93%
Asia 10.17% 10.49% 10.16% 10.21% 10.04% 9.85% 9.70%
Global Total 10.87% 11.42% 11.51% 10.96% 11.16% 11.73% 11.89%
Coincident Managed Net Credit Loss RatioNorth America (managed basis) 4.60% 4.51% 4.51% 5.10% 5.81% 6.53% 7.13%EMEA 3.20% 2.70% 4.90% 0.72% 3.56% 3.94% 4.41%Latin America 8.75% 6.84% 9.65% 9.01% 10.25% 11.41% 13.16%Asia 3.19% 3.32% 3.11% 3.06% 3.17% 3.37% 3.63%
Global Total 4.67% 4.45% 4.77% 4.86% 5.72% 6.40% 7.05%
Managed Net Credit Margin as a % of Average Managed Loans
North America (managed basis) 7.48% 7.43% 8.03% 7.67% 7.14% 6.52% 5.90%
EMEA 16.38% 13.83% 10.91% 14.12% 11.39% 10.96% 10.16%
Latin America 25.89% 26.98% 46.08% 26.73% 40.43% 22.23% 17.92%
Asia 12.53% 12.02% 11.32% 17.27% 12.69% 11.73% 11.65%
Global Total 9.30% 9.46% 11.02% 10.28% 10.30% 8.50% 7.63%
Managed Loans 90+ Days Past Due as a % of EOP Managed LoansNorth America (managed basis) 1.57% 1.47% 1.60% 1.77% 1.96% 2.02% 2.11%
EMEA 1.96% 2.02% 1.81% 1.53% 1.62% 1.81% 2.08%
Latin America 3.39% 3.79% 3.67% 3.92% 3.75% 4.16% 4.36%Asia 1.59% 1.43% 1.43% 1.50% 1.49% 1.53% 1.57%
Global Total 1.70% 1.66% 1.74% 1.88% 2.02% 2.12% 2.22%
(1) Managed basis is applicable only in North America, as securitizations are not done in any other region.Managed basis presentation includes results from both the on-balance sheet loans and off- balance sheet loans, and excludes the impact of card securitization activity.Managed disclosures assume that securitized loans have not been sold and present the results of the securitized loans in the same manner as the Company's owned loans.
Reclassified to conform to the current period's presentation.

Page 10
GLOBAL CARDSPage 3North America
(In millions of dollars) 3Q08 vs.
1Q 2Q 3Q 4Q 1Q 2Q 3Q 3Q07 Increase/2007 2007 2007 2007 2008 2008 2008 (Decrease)
SUPPLEMENTAL DISCLOSURE - MANAGED BASIS (1)
Total GAAP Revenues $ 3,407 $ 3,298 $ 3,510 $ 3,678 $ 3,343 $ 2,928 $ 1,388 (60%)
Net Impact of Credit Card Securitization Activity (2) 929 998 1,124 1,200 1,610 2,016 3,579 NM
Total Managed Revenues $ 4,336 $ 4,296 $ 4,634 $ 4,878 $ 4,953 $ 4,944 $ 4,967 7%
Return on Managed Assets 2.26% 1.84% 2.04% 0.79% 1.32% 0.44% (2.13%)
Average Managed Loans Securitized $ 97.4 $ 97.6 $ 101.0 $ 99.8 $ 105.8 $ 107.4 $ 108.8 8%(in billions of dollars) Held for Sale 3.0 3.3 3.0 2.7 1.0 1.0 - (100%)
On Balance Sheet 43.9 42.3 41.3 48.0 45.9 42.8 41.8 1%Total $ 144.3 $ 143.2 $ 145.3 $ 150.5 $ 152.7 $ 151.2 $ 150.6 4%
Citi Branded $ 92.6 $ 91.6 $ 92.4 $ 95.3 $ 96.8 $ 96.6 $ 95.6 3%Retail Partners 51.7 51.6 52.9 55.2 55.9 54.6 55.0 4%Total $ 144.3 $ 143.2 $ 145.3 $ 150.5 $ 152.7 $ 151.2 $ 150.6 4%
EOP Managed Loans Citi Branded $ 91.6 $ 92.9 $ 93.6 $ 98.7 $ 96.3 $ 96.0 $ 96.0 3%Retail Partners 50.9 52.3 53.8 57.9 54.4 55.2 55.1 2%Total $ 142.5 $ 145.2 $ 147.4 $ 156.6 $ 150.7 $ 151.2 $ 151.1 3%
Managed Average Yield (3) Citi Branded 12.31% 12.25% 12.50% 12.12% 11.46% 11.19% 11.68%Retail Partners 17.60% 17.59% 17.71% 16.90% 16.77% 16.87% 17.04%
Total 14.21% 14.17% 14.40% 13.87% 13.41% 13.24% 13.64%
Managed Net Interest Revenue Citi Branded $ 1,784 $ 1,797 $ 1,885 $ 1,886 $ 1,894 $ 1,998 $ 2,116 12%
(in millions of dollars) (4) Retail Partners 1,798 1,873 1,962 1,935 1,935 1,971 2,058 5%
Total $ 3,582 $ 3,670 $ 3,847 $ 3,821 $ 3,829 $ 3,969 $ 4,174 9%
Managed Net Interest Revenue as Citi Branded 7.81% 7.87% 8.09% 7.85% 7.87% 8.32% 8.81%a % of Average Managed Loans Retail Partners 14.10% 14.56% 14.71% 13.91% 13.92% 14.52% 14.89%
Total 10.07% 10.28% 10.50% 10.07% 10.09% 10.56% 11.03%
Managed Net Credit Margin Citi Branded $ 1,644 $ 1,593 $ 1,732 $ 1,790 $ 1,658 $ 1,459 $ 1,295 (25%)
(in millions of dollars) (5) Retail Partners 1,017 1,059 1,210 1,121 1,053 993 938 (22%)
Total $ 2,661 $ 2,652 $ 2,942 $ 2,911 $ 2,711 $ 2,452 $ 2,233 (24%)
Managed Net Credit Margin as Citi Branded 7.20% 6.98% 7.44% 7.45% 6.89% 6.07% 5.39%
a % of Average Managed Loans Retail Partners 7.98% 8.23% 9.07% 8.06% 7.58% 7.31% 6.78%
Total 7.48% 7.43% 8.03% 7.67% 7.14% 6.52% 5.90%
Managed Net Credit Losses Citi Branded $ 876 $ 878 $ 900 $ 1,034 $ 1,187 $ 1,375 $ 1,473 64%
Retail Partners 759 733 753 899 1,018 1,078 1,228 63%
Total $ 1,635 $ 1,611 $ 1,653 $ 1,933 $ 2,205 $ 2,453 $ 2,701 63%
Coincident Managed Net Citi Branded 3.84% 3.84% 3.86% 4.30% 4.93% 5.72% 6.10% Credit Loss Ratio: Retail Partners 5.95% 5.70% 5.65% 6.46% 7.32% 7.94% 8.87%
Total 4.60% 4.51% 4.51% 5.10% 5.81% 6.53% 7.13%
Managed Loans 90+Days Past Due Citi Branded $ 1,191 $ 1,138 $ 1,248 $ 1,489 $ 1,616 $ 1,674 $ 1,728 38%Retail Partners 1,045 997 1,112 1,286 1,337 1,376 1,466 32%
Total $ 2,236 $ 2,135 $ 2,360 $ 2,775 $ 2,953 $ 3,050 $ 3,194 35%
% of EOP Managed Loans Citi Branded 1.30% 1.22% 1.33% 1.51% 1.68% 1.74% 1.80%Retail Partners 2.05% 1.91% 2.07% 2.22% 2.46% 2.49% 2.66%
Total 1.57% 1.47% 1.60% 1.77% 1.96% 2.02% 2.11%
(1) Managed basis is applicable only in North America, as securitizations are not done in any other region.Managed basis presentation includes results from both the on-balance sheet loans and off- balance sheet loans, and excludes the impact of card securitization activity.Managed disclosures assume that securitized loans have not been sold and present the results of the securitized loans in the same manner as the Company's owned loans.
(2) Net impact of Securitization Activity includes the removal of securitization-related items that are part of GAAP revenues such as the gain on sale of credit card loans,mark-to-market revenue for interests retained in securitized assets classified as Trading, and net credit losses on loans that are considered sold for GAAP purposes.
(3) Gross interest revenue earned divided by average managed loans.
(4) Includes certain fees that are recorded as interest revenue.
(5) Total Revenues, net of Interest Expense, less Net Credit Losses and Policy Benefits and Claims.
NM Not meaningful
Reclassified to conform to the current period's presentation.
Managed Revenues: (in millions of dollars)

Page 11
CONSUMER BANKINGPage 1(In millions of dollars)
3Q08 vs. Nine Nine YTD 2008 vs.1Q 2Q 3Q 4Q 1Q 2Q 3Q 3Q07 Increase/ Months Months YTD 2007 Increase/
2007 2007 2007 2007 2008 2008 2008 (Decrease) 2007 2008 (Decrease)CONSUMER BANKING
Net Interest Revenue $ 5,007 $ 5,192 $ 5,258 $ 5,284 $ 5,651 $ 5,779 $ 5,709 9% $ 15,457 $ 17,139 11%
Non-Interest Revenue 2,015 2,106 2,044 2,552 2,140 1,576 1,720 (16%) 6,165 5,436 (12%)
Total Revenues, Net of Interest Expense 7,022 7,298 7,302 7,836 7,791 7,355 7,429 2% 21,622 22,575 4%
Total Operating Expenses 3,809 3,975 4,270 4,262 4,309 4,442 4,188 (2%) 12,054 12,939 7%
Net Credit Losses 1,096 1,134 1,373 1,774 2,279 2,552 3,005 NM 3,603 7,836 NMCredit Reserve Build / (Release) 325 21 1,449 2,877 1,161 1,672 2,128 47% 1,795 4,961 NMProvision for Benefits & Claims 189 158 183 182 203 191 200 9% 530 594 12%
Provision for Loan Losses and for Benefits and Claims 1,610 1,313 3,005 4,833 3,643 4,415 5,333 77% 5,928 13,391 NM
Income Before Taxes and Minority Interest 1,603 2,010 27 (1,259) (161) (1,502) (2,092) NM 3,640 (3,755) NM
Income Taxes 415 593 (136) (691) (215) (683) (996) NM 872 (1,894) NM
Minority Interest, Net of Tax 9 17 7 10 2 9 3 (57%) 33 14 (58%)
Net Income $ 1,179 $ 1,400 $ 156 $ (578) $ 52 $ (828) $ (1,099) NM $ 2,735 $ (1,875) NM
Average Assets (in billions of dollars) $ 557 $ 585 $ 576 $ 568 $ 568 $ 570 $ 542 (6%) $ 573 $ 560 (2%)
Return on Assets 0.86% 0.96% 0.11% (0.40%) 0.04% (0.58%) (0.81%) 0.64% (0.45%)
Average Risk Capital $ 20,276 $ 22,088 $ 21,221 $ 20,368 $ 27,272 $ 29,978 $ 30,965 46% $ 21,195 $ 29,405 39%
Return on Risk Capital 24% 25% 3% (11%) 1% (11%) (14%) 17% (9%)
Return on Invested Capital 13% 14% 2% (4%) 0% (6%) (8%) 10% (5%)
CONSUMER FINANCE JAPAN
Net Interest Revenue $ 415 $ 344 $ 263 $ 113 $ 264 $ 173 $ 224 (15%) $ 1,022 $ 661 (35%)
Non-Interest Revenue 7 1 1 13 13 3 1 - 9 17 89%
Total Revenues, Net of Interest Expense 422 345 264 126 277 176 225 (15%) 1,031 678 (34%)
Total Operating Expenses 126 102 251 97 95 101 84 (67%) 479 280 (42%)
Net Credit Losses 302 302 324 314 317 314 295 (9%) 928 926 -Credit Reserve Build / (Release) 4 14 161 - - - 91 (43%) 179 91 (49%)Provision for Benefits & Claims - - - - - - 1 - - 1 -
Provision for Loan Losses and for Benefits and Claims 306 316 485 314 317 314 387 (20%) 1,107 1,018 (8%)
Income Before Taxes and Minority Interest (10) (73) (472) (285) (135) (239) (246) 48% (555) (620) (12%)
Income Taxes (12) (33) (174) (101) (49) (85) (87) 50% (219) (221) (1%)
Minority Interest, Net of Tax - - - - - - - - - - -
Net Income $ 2 $ (40) $ (298) $ (184) $ (86) $ (154) $ (159) 47% $ (336) $ (399) (19%)
Average Assets (in billions of dollars) $ 10 $ 10 $ 9 $ 9 $ 9 $ 8 $ 8 (11%) $ 10 $ 8 (20%)
Return on Assets 0.08% (1.60%) (13.14%) (8.11%) (3.84%) (7.74%) (7.91%) (4.49%) (6.66%)
CONSUMER BANKING EXCLUDING CONSUMER FINANCE JAPAN
Net Interest Revenue $ 4,592 $ 4,848 $ 4,995 $ 5,171 $ 5,387 $ 5,606 $ 5,485 10% $ 14,435 $ 16,478 14%
Non-Interest Revenue 2,008 2,105 2,043 2,539 2,127 1,573 1,719 (16%) 6,156 5,419 (12%)
Total Revenues, Net of Interest Expense 6,600 6,953 7,038 7,710 7,514 7,179 7,204 2% 20,591 21,897 6%
Total Operating Expenses 3,683 3,873 4,019 4,165 4,214 4,341 4,104 2% 11,575 12,659 9%
Net Credit Losses 794 832 1,049 1,460 1,962 2,238 2,710 NM 2,675 6,910 NMCredit Reserve Build / (Release) 321 7 1,288 2,877 1,161 1,672 2,037 58% 1,616 4,870 NMProvision for Benefits & Claims 189 158 183 182 203 191 199 9% 530 593 12%
Provision for Loan Losses and for Benefits and Claims 1,304 997 2,520 4,519 3,326 4,101 4,946 96% 4,821 12,373 NM
Income Before Taxes and Minority Interest 1,613 2,083 499 (974) (26) (1,263) (1,846) NM 4,195 (3,135) NM
Income Taxes 427 626 38 (590) (166) (598) (909) NM 1,091 (1,673) NM
Minority Interest, Net of Tax 9 17 7 10 2 9 3 (57%) 33 14 (58%)
Net Income $ 1,177 $ 1,440 $ 454 $ (394) $ 138 $ (674) $ (940) NM $ 3,071 $ (1,476) NM
Average Assets (in billions of dollars) $ 547 $ 575 $ 567 $ 559 $ 559 $ 562 $ 534 (6%) $ 563 $ 552 -
Return on Assets 0.87% 1.00% 0.32% (0.28%) 0.10% (0.48%) (0.70%) 0.73% (0.36%)
NM Not meaningful
Reclassified to conform to the current period's presentation.
Page 12
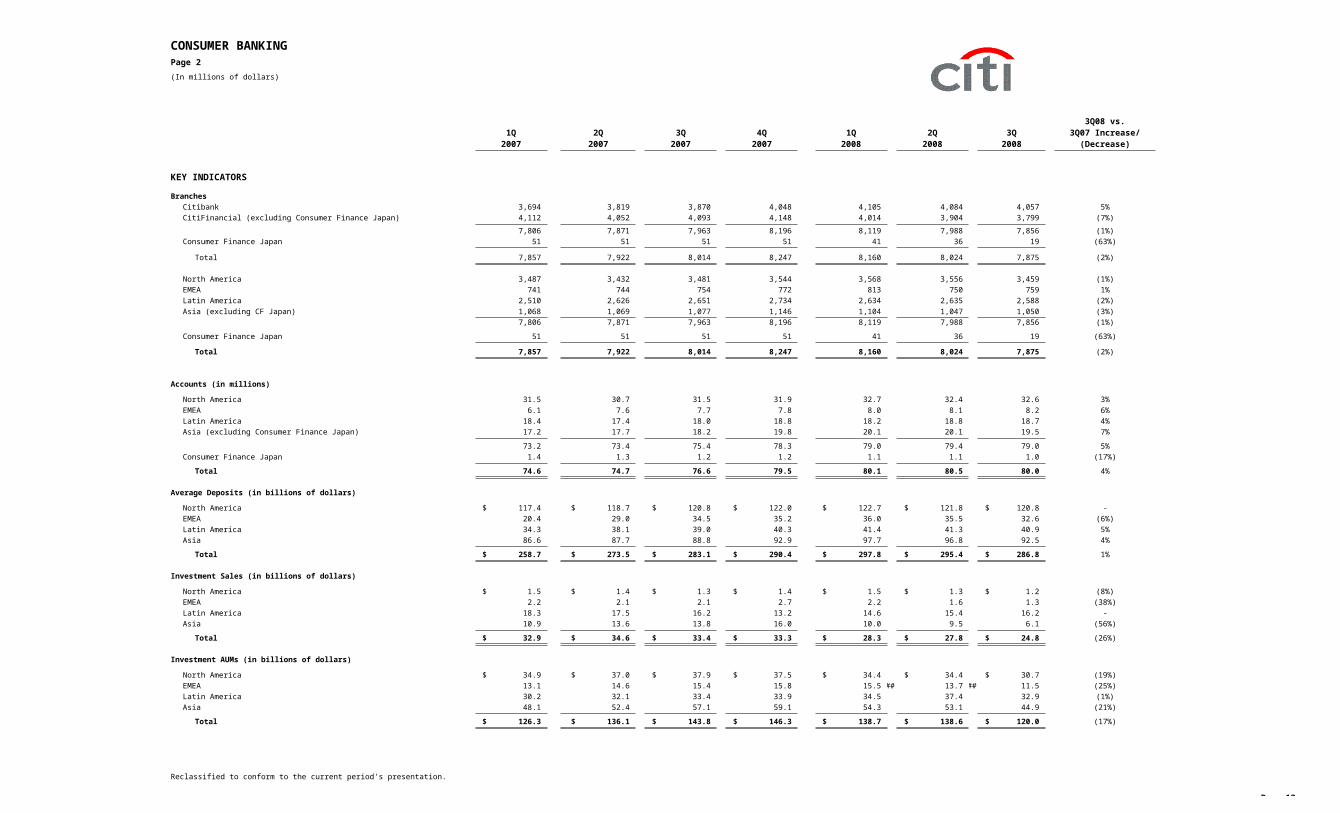
CONSUMER BANKINGPage 2(In millions of dollars)
3Q08 vs.1Q 2Q 3Q 4Q 1Q 2Q 3Q 3Q07 Increase/
2007 2007 2007 2007 2008 2008 2008 (Decrease)
KEY INDICATORS
BranchesCitibank 3,694 3,819 3,870 4,048 4,105 4,084 4,057 5%CitiFinancial (excluding Consumer Finance Japan) 4,112 4,052 4,093 4,148 4,014 3,904 3,799 (7%)
7,806 7,871 7,963 8,196 8,119 7,988 7,856 (1%)Consumer Finance Japan 51 51 51 51 41 36 19 (63%)
Total 7,857 7,922 8,014 8,247 8,160 8,024 7,875 (2%)
North America 3,487 3,432 3,481 3,544 3,568 3,556 3,459 (1%)EMEA 741 744 754 772 813 750 759 1%Latin America 2,510 2,626 2,651 2,734 2,634 2,635 2,588 (2%)Asia (excluding CF Japan) 1,068 1,069 1,077 1,146 1,104 1,047 1,050 (3%)
7,806 7,871 7,963 8,196 8,119 7,988 7,856 (1%)
Consumer Finance Japan 51 51 51 51 41 36 19 (63%)
Total 7,857 7,922 8,014 8,247 8,160 8,024 7,875 (2%)
Accounts (in millions)
North America 31.5 30.7 31.5 31.9 32.7 32.4 32.6 3%EMEA 6.1 7.6 7.7 7.8 8.0 8.1 8.2 6%Latin America 18.4 17.4 18.0 18.8 18.2 18.8 18.7 4%Asia (excluding Consumer Finance Japan) 17.2 17.7 18.2 19.8 20.1 20.1 19.5 7%
73.2 73.4 75.4 78.3 79.0 79.4 79.0 5%Consumer Finance Japan 1.4 1.3 1.2 1.2 1.1 1.1 1.0 (17%)
Total 74.6 74.7 76.6 79.5 80.1 80.5 80.0 4%
Average Deposits (in billions of dollars)
North America $ 117.4 $ 118.7 $ 120.8 $ 122.0 $ 122.7 $ 121.8 $ 120.8 -EMEA 20.4 29.0 34.5 35.2 36.0 35.5 32.6 (6%)Latin America 34.3 38.1 39.0 40.3 41.4 41.3 40.9 5%Asia 86.6 87.7 88.8 92.9 97.7 96.8 92.5 4%
Total $ 258.7 $ 273.5 $ 283.1 $ 290.4 $ 297.8 $ 295.4 $ 286.8 1%
Investment Sales (in billions of dollars)
North America $ 1.5 $ 1.4 $ 1.3 $ 1.4 $ 1.5 $ 1.3 $ 1.2 (8%)EMEA 2.2 2.1 2.1 2.7 2.2 1.6 1.3 (38%)Latin America 18.3 17.5 16.2 13.2 14.6 15.4 16.2 -Asia 10.9 13.6 13.8 16.0 10.0 9.5 6.1 (56%)
Total $ 32.9 $ 34.6 $ 33.4 $ 33.3 $ 28.3 $ 27.8 $ 24.8 (26%)
Investment AUMs (in billions of dollars)
North America $ 34.9 $ 37.0 $ 37.9 $ 37.5 $ 34.4 $ 34.4 $ 30.7 (19%)EMEA 13.1 14.6 15.4 15.8 15.5 ### 13.7 ### 11.5 (25%)Latin America 30.2 32.1 33.4 33.9 34.5 37.4 32.9 (1%)Asia 48.1 52.4 57.1 59.1 54.3 53.1 44.9 (21%)
Total $ 126.3 $ 136.1 $ 143.8 $ 146.3 $ 138.7 $ 138.6 $ 120.0 (17%)
Reclassified to conform to the current period's presentation.

Page 13
CONSUMER BANKINGPage 3(In millions of dollars)
3Q08 vs.1Q 2Q 3Q 4Q 1Q 2Q 3Q 3Q07 Increase/
2007 2007 2007 2007 2008 2008 2008 (Decrease)
KEY INDICATORS (Continued):
Average Loans (in billions of dollars)
North America $ 277.3 $ 286.0 $ 293.2 $ 302.6 $ 307.2 $ 305.1 $ 291.7 -EMEA 17.6 21.9 24.0 25.2 25.1 26.1 25.3 5%Latin America 11.2 13.1 13.9 14.6 14.6 15.6 16.0 15%Asia (excluding CF Japan) 43.4 45.3 46.4 49.5 51.9 51.6 49.9 8%
349.5 366.3 377.5 391.9 398.8 398.4 382.9 1%Consumer Finance Japan 9.0 8.5 8.5 8.5 8.9 8.4 7.8 (8%)
Total $ 358.5 $ 374.8 $ 386.0 $ 400.4 $ 407.7 $ 406.8 $ 390.7 1%
EOP Loans (in billions of dollars)
North America $ 280.3 $ 288.2 $ 298.5 $ 303.2 $ 306.1 $ 291.9 $ 291.1 (2%)EMEA 17.9 23.5 24.6 24.4 25.8 26.7 24.3 (1%)Latin America 11.7 13.5 14.1 14.9 14.6 15.8 15.5 10%Asia (excluding CF Japan) 44.4 45.8 47.8 51.1 52.1 51.8 47.6 -
354.3 371.0 385.0 393.6 398.6 386.2 378.5 (2%)Consumer Finance Japan 9.0 8.2 8.5 8.3 9.1 8.2 7.7 (9%)
Total $ 363.3 $ 379.2 $ 393.5 $ 401.9 $ 407.7 $ 394.4 $ 386.2 (2%)
Net Interest Revenue as a % of Average Loans
North America 3.35% 3.29% 3.25% 3.25% 3.41% 3.64% 3.53%EMEA 7.07% 5.99% 5.98% 6.82% 6.70% 6.59% 6.11%Latin America 9.74% 9.38% 9.08% 9.30% 9.76% 8.76% 8.57%Asia (excluding CF Japan) 3.09% 3.14% 3.16% 3.12% 3.21% 3.24% 3.20%
3.71% 3.65% 3.63% 3.69% 3.82% 3.99% 3.87%
Consumer Finance Japan 16.33% 13.50% 9.42% 2.52% 10.56% 8.21% 11.42%
Total 4.02% 3.88% 3.76% 3.66% 3.97% 4.07% 4.02%
Net Credit Losses as a % of Average Loans
North America 0.84% 0.87% 1.01% 1.40% 2.02% 2.33% 2.95%EMEA 2.50% 2.15% 1.99% 2.80% 2.55% 2.59% 2.95%Latin America 1.41% 0.46% 2.51% 2.96% 3.78% 4.08% 4.53%Asia (excluding CF Japan) 0.66% 0.72% 0.78% 0.82% 0.98% 1.16% 1.38%
0.92% 0.91% 1.10% 1.48% 1.98% 2.26% 2.82%
Consumer Finance Japan 13.61% 14.20% 15.12% 14.66% 14.33% 15.03% 15.05%
Total 1.24% 1.21% 1.41% 1.76% 2.25% 2.52% 3.06%
Loans 90+ Days Past Due as a % of EOP Loans
North America 1.37% 1.49% 1.80% 2.13% 2.38% 2.76% 3.28%EMEA 1.99% 1.56% 1.57% 1.32% 1.46% 1.66% 1.97%Latin America 2.96% 2.86% 2.96% 3.07% 3.98% 3.54% 3.43%Asia (excluding CF Japan) 0.53% 0.53% 0.55% 0.54% 0.57% 0.63% 0.61%
1.35% 1.43% 1.67% 1.91% 2.14% 2.43% 2.86%
Consumer Finance Japan 2.35% 2.53% 2.53% 2.20% 2.35% 2.44% 2.51%
Total 1.37% 1.45% 1.69% 1.91% 2.15% 2.43% 2.86%
Reclassified to conform to the current period's presentation.
Page 14
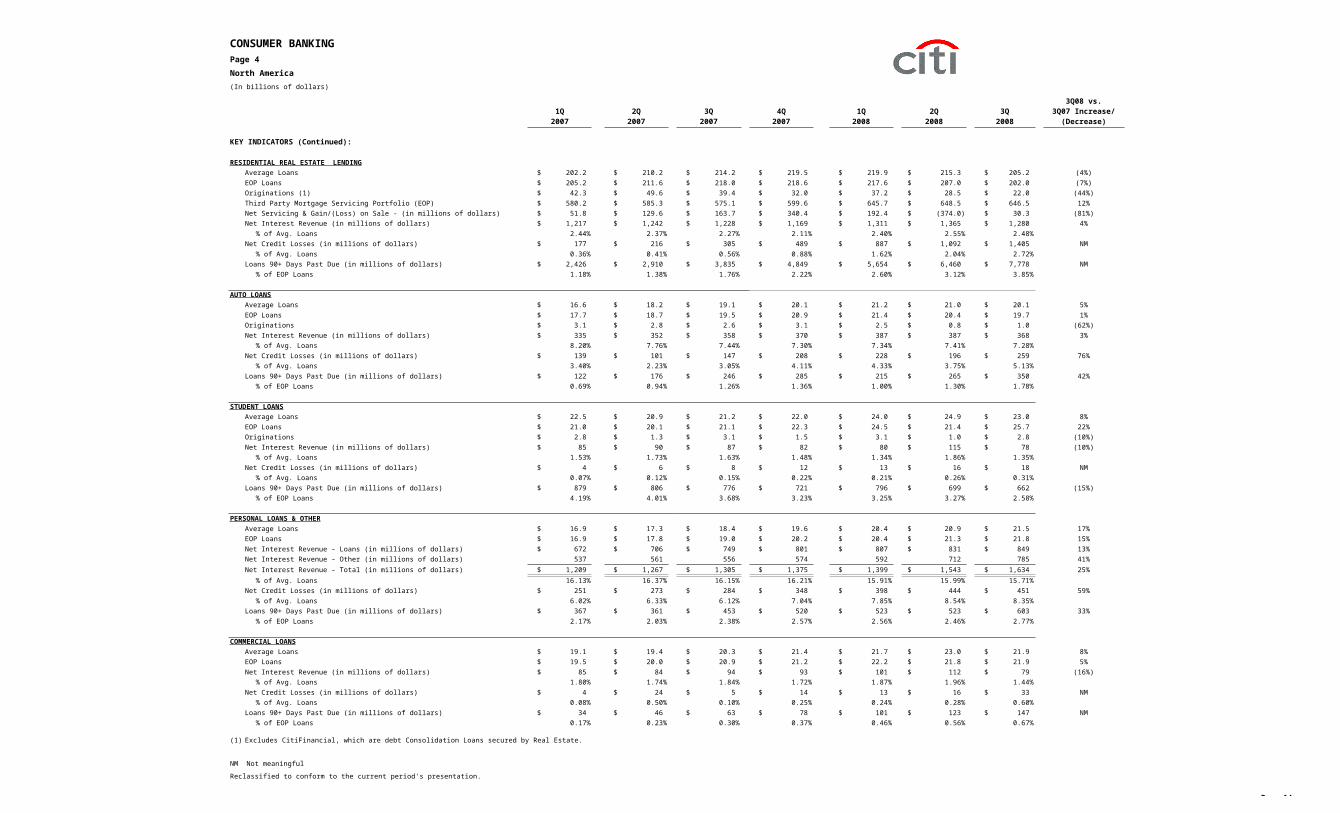
CONSUMER BANKINGPage 4North America(In billions of dollars)
3Q08 vs.1Q 2Q 3Q 4Q 1Q 2Q 3Q 3Q07 Increase/
2007 2007 2007 2007 2008 2008 2008 (Decrease)
KEY INDICATORS (Continued):
RESIDENTIAL REAL ESTATE LENDINGAverage Loans $ 202.2 $ 210.2 $ 214.2 $ 219.5 $ 219.9 $ 215.3 $ 205.2 (4%)EOP Loans $ 205.2 $ 211.6 $ 218.0 $ 218.6 $ 217.6 $ 207.0 $ 202.0 (7%)Originations (1) $ 42.3 $ 49.6 $ 39.4 $ 32.0 $ 37.2 $ 28.5 $ 22.0 (44%)Third Party Mortgage Servicing Portfolio (EOP) $ 580.2 $ 585.3 $ 575.1 $ 599.6 $ 645.7 $ 648.5 $ 646.5 12%Net Servicing & Gain/(Loss) on Sale - (in millions of dollars) $ 51.8 $ 129.6 $ 163.7 $ 340.4 $ 192.4 $ (374.0) $ 30.3 (81%)Net Interest Revenue (in millions of dollars) $ 1,217 $ 1,242 $ 1,228 $ 1,169 $ 1,311 $ 1,365 $ 1,280 4%
% of Avg. Loans 2.44% 2.37% 2.27% 2.11% 2.40% 2.55% 2.48%Net Credit Losses (in millions of dollars) $ 177 $ 216 $ 305 $ 489 $ 887 $ 1,092 $ 1,405 NM
% of Avg. Loans 0.36% 0.41% 0.56% 0.88% 1.62% 2.04% 2.72%Loans 90+ Days Past Due (in millions of dollars) $ 2,426 $ 2,910 $ 3,835 $ 4,849 $ 5,654 $ 6,460 $ 7,778 NM
% of EOP Loans 1.18% 1.38% 1.76% 2.22% 2.60% 3.12% 3.85%
AUTO LOANSAverage Loans $ 16.6 $ 18.2 $ 19.1 $ 20.1 $ 21.2 $ 21.0 $ 20.1 5%EOP Loans $ 17.7 $ 18.7 $ 19.5 $ 20.9 $ 21.4 $ 20.4 $ 19.7 1%Originations $ 3.1 $ 2.8 $ 2.6 $ 3.1 $ 2.5 $ 0.8 $ 1.0 (62%)Net Interest Revenue (in millions of dollars) $ 335 $ 352 $ 358 $ 370 $ 387 $ 387 $ 368 3%
% of Avg. Loans 8.20% 7.76% 7.44% 7.30% 7.34% 7.41% 7.28%Net Credit Losses (in millions of dollars) $ 139 $ 101 $ 147 $ 208 $ 228 $ 196 $ 259 76%
% of Avg. Loans 3.40% 2.23% 3.05% 4.11% 4.33% 3.75% 5.13%Loans 90+ Days Past Due (in millions of dollars) $ 122 $ 176 $ 246 $ 285 $ 215 $ 265 $ 350 42%
% of EOP Loans 0.69% 0.94% 1.26% 1.36% 1.00% 1.30% 1.78%
STUDENT LOANSAverage Loans $ 22.5 $ 20.9 $ 21.2 $ 22.0 $ 24.0 $ 24.9 $ 23.0 8%EOP Loans $ 21.0 $ 20.1 $ 21.1 $ 22.3 $ 24.5 $ 21.4 $ 25.7 22%Originations $ 2.8 $ 1.3 $ 3.1 $ 1.5 $ 3.1 $ 1.0 $ 2.8 (10%)Net Interest Revenue (in millions of dollars) $ 85 $ 90 $ 87 $ 82 $ 80 $ 115 $ 78 (10%)
% of Avg. Loans 1.53% 1.73% 1.63% 1.48% 1.34% 1.86% 1.35%Net Credit Losses (in millions of dollars) $ 4 $ 6 $ 8 $ 12 $ 13 $ 16 $ 18 NM
% of Avg. Loans 0.07% 0.12% 0.15% 0.22% 0.21% 0.26% 0.31%Loans 90+ Days Past Due (in millions of dollars) $ 879 $ 806 $ 776 $ 721 $ 796 $ 699 $ 662 (15%)
% of EOP Loans 4.19% 4.01% 3.68% 3.23% 3.25% 3.27% 2.58%
PERSONAL LOANS & OTHERAverage Loans $ 16.9 $ 17.3 $ 18.4 $ 19.6 $ 20.4 $ 20.9 $ 21.5 17%EOP Loans $ 16.9 $ 17.8 $ 19.0 $ 20.2 $ 20.4 $ 21.3 $ 21.8 15%Net Interest Revenue - Loans (in millions of dollars) $ 672 $ 706 $ 749 $ 801 $ 807 $ 831 $ 849 13%Net Interest Revenue - Other (in millions of dollars) 537 561 556 574 592 712 785 41%Net Interest Revenue - Total (in millions of dollars) $ 1,209 $ 1,267 $ 1,305 $ 1,375 $ 1,399 $ 1,543 $ 1,634 25%
% of Avg. Loans 16.13% 16.37% 16.15% 16.21% 15.91% 15.99% 15.71%Net Credit Losses (in millions of dollars) $ 251 $ 273 $ 284 $ 348 $ 398 $ 444 $ 451 59%
% of Avg. Loans 6.02% 6.33% 6.12% 7.04% 7.85% 8.54% 8.35%Loans 90+ Days Past Due (in millions of dollars) $ 367 $ 361 $ 453 $ 520 $ 523 $ 523 $ 603 33%
% of EOP Loans 2.17% 2.03% 2.38% 2.57% 2.56% 2.46% 2.77%
COMMERCIAL LOANSAverage Loans $ 19.1 $ 19.4 $ 20.3 $ 21.4 $ 21.7 $ 23.0 $ 21.9 8%EOP Loans $ 19.5 $ 20.0 $ 20.9 $ 21.2 $ 22.2 $ 21.8 $ 21.9 5%Net Interest Revenue (in millions of dollars) $ 85 $ 84 $ 94 $ 93 $ 101 $ 112 $ 79 (16%)
% of Avg. Loans 1.80% 1.74% 1.84% 1.72% 1.87% 1.96% 1.44%Net Credit Losses (in millions of dollars) $ 4 $ 24 $ 5 $ 14 $ 13 $ 16 $ 33 NM
% of Avg. Loans 0.08% 0.50% 0.10% 0.25% 0.24% 0.28% 0.60%Loans 90+ Days Past Due (in millions of dollars) $ 34 $ 46 $ 63 $ 78 $ 101 $ 123 $ 147 NM
% of EOP Loans 0.17% 0.23% 0.30% 0.37% 0.46% 0.56% 0.67%
(1) Excludes CitiFinancial, which are debt Consolidation Loans secured by Real Estate.
NM Not meaningful
Reclassified to conform to the current period's presentation.
Page 15
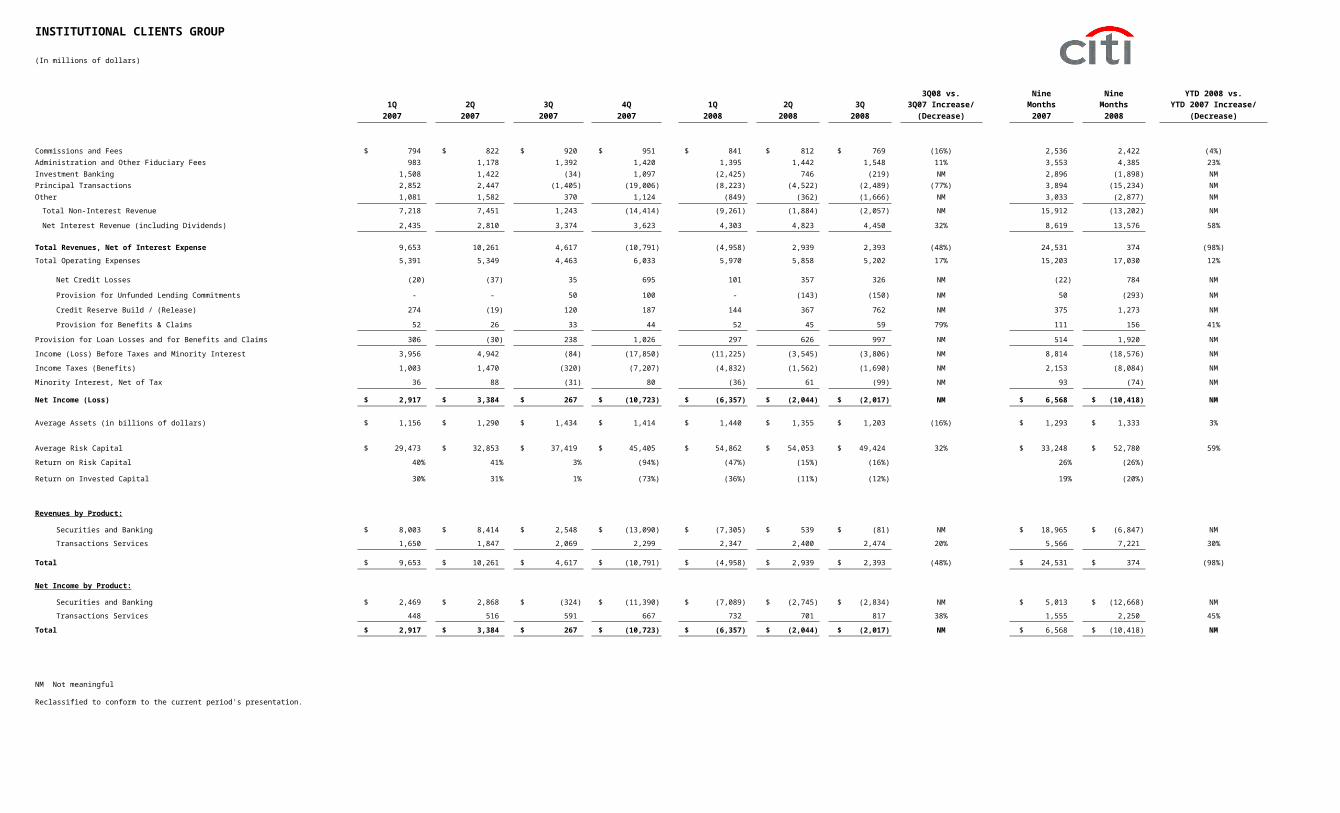
INSTITUTIONAL CLIENTS GROUP
(In millions of dollars)
3Q08 vs. Nine Nine YTD 2008 vs.1Q 2Q 3Q 4Q 1Q 2Q 3Q 3Q07 Increase/ Months Months YTD 2007 Increase/
2007 2007 2007 2007 2008 2008 2008 (Decrease) 2007 2008 (Decrease)
Commissions and Fees $ 794 $ 822 $ 920 $ 951 $ 841 $ 812 $ 769 (16%) 2,536 2,422 (4%)Administration and Other Fiduciary Fees 983 1,178 1,392 1,420 1,395 1,442 1,548 11% 3,553 4,385 23%Investment Banking 1,508 1,422 (34) 1,097 (2,425) 746 (219) NM 2,896 (1,898) NMPrincipal Transactions 2,852 2,447 (1,405) (19,006) (8,223) (4,522) (2,489) (77%) 3,894 (15,234) NMOther 1,081 1,582 370 1,124 (849) (362) (1,666) NM 3,033 (2,877) NM
Total Non-Interest Revenue 7,218 7,451 1,243 (14,414) (9,261) (1,884) (2,057) NM 15,912 (13,202) NM
Net Interest Revenue (including Dividends) 2,435 2,810 3,374 3,623 4,303 4,823 4,450 32% 8,619 13,576 58%
Total Revenues, Net of Interest Expense 9,653 10,261 4,617 (10,791) (4,958) 2,939 2,393 (48%) 24,531 374 (98%)
Total Operating Expenses 5,391 5,349 4,463 6,033 5,970 5,858 5,202 17% 15,203 17,030 12%
Net Credit Losses (20) (37) 35 695 101 357 326 NM (22) 784 NM
Provision for Unfunded Lending Commitments - - 50 100 - (143) (150) NM 50 (293) NM
Credit Reserve Build / (Release) 274 (19) 120 187 144 367 762 NM 375 1,273 NM
Provision for Benefits & Claims 52 26 33 44 52 45 59 79% 111 156 41%
Provision for Loan Losses and for Benefits and Claims 306 (30) 238 1,026 297 626 997 NM 514 1,920 NM
Income (Loss) Before Taxes and Minority Interest 3,956 4,942 (84) (17,850) (11,225) (3,545) (3,806) NM 8,814 (18,576) NM
Income Taxes (Benefits) 1,003 1,470 (320) (7,207) (4,832) (1,562) (1,690) NM 2,153 (8,084) NM
Minority Interest, Net of Tax 36 88 (31) 80 (36) 61 (99) NM 93 (74) NM
Net Income (Loss) $ 2,917 $ 3,384 $ 267 $ (10,723) $ (6,357) $ (2,044) $ (2,017) NM $ 6,568 $ (10,418) NM
Average Assets (in billions of dollars) $ 1,156 $ 1,290 $ 1,434 $ 1,414 $ 1,440 $ 1,355 $ 1,203 (16%) $ 1,293 $ 1,333 3%
Average Risk Capital $ 29,473 $ 32,853 $ 37,419 $ 45,405 $ 54,862 $ 54,053 $ 49,424 32% $ 33,248 $ 52,780 59%
Return on Risk Capital 40% 41% 3% (94%) (47%) (15%) (16%) 26% (26%)
Return on Invested Capital 30% 31% 1% (73%) (36%) (11%) (12%) 19% (20%)
Revenues by Product:
Securities and Banking $ 8,003 $ 8,414 $ 2,548 $ (13,090) $ (7,305) $ 539 $ (81) NM $ 18,965 $ (6,847) NM
Transactions Services 1,650 1,847 2,069 2,299 2,347 2,400 2,474 20% 5,566 7,221 30%
Total $ 9,653 $ 10,261 $ 4,617 $ (10,791) $ (4,958) $ 2,939 $ 2,393 (48%) $ 24,531 $ 374 (98%)
Net Income by Product:
Securities and Banking $ 2,469 $ 2,868 $ (324) $ (11,390) $ (7,089) $ (2,745) $ (2,834) NM $ 5,013 $ (12,668) NM
Transactions Services 448 516 591 667 732 701 817 38% 1,555 2,250 45%
Total $ 2,917 $ 3,384 $ 267 $ (10,723) $ (6,357) $ (2,044) $ (2,017) NM $ 6,568 $ (10,418) NM
NM Not meaningful
Reclassified to conform to the current period's presentation.
Page 16
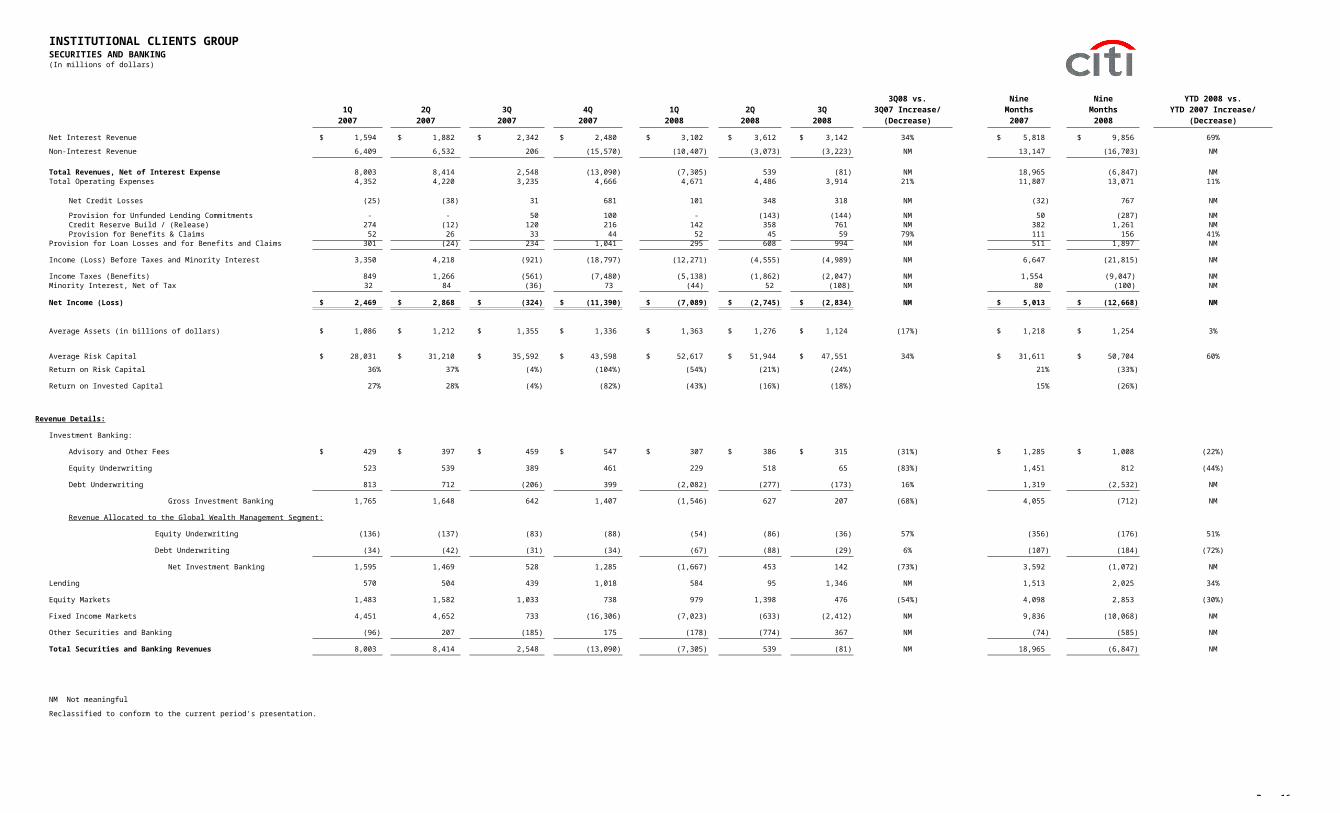
INSTITUTIONAL CLIENTS GROUPSECURITIES AND BANKING(In millions of dollars)
3Q08 vs. Nine Nine YTD 2008 vs.1Q 2Q 3Q 4Q 1Q 2Q 3Q 3Q07 Increase/ Months Months YTD 2007 Increase/
2007 2007 2007 2007 2008 2008 2008 (Decrease) 2007 2008 (Decrease)
Net Interest Revenue $ 1,594 $ 1,882 $ 2,342 $ 2,480 $ 3,102 $ 3,612 $ 3,142 34% $ 5,818 $ 9,856 69%
Non-Interest Revenue 6,409 6,532 206 (15,570) (10,407) (3,073) (3,223) NM 13,147 (16,703) NM
Total Revenues, Net of Interest Expense 8,003 8,414 2,548 (13,090) (7,305) 539 (81) NM 18,965 (6,847) NMTotal Operating Expenses 4,352 4,220 3,235 4,666 4,671 4,486 3,914 21% 11,807 13,071 11%
Net Credit Losses (25) (38) 31 681 101 348 318 NM (32) 767 NM
Provision for Unfunded Lending Commitments - - 50 100 - (143) (144) NM 50 (287) NMCredit Reserve Build / (Release) 274 (12) 120 216 142 358 761 NM 382 1,261 NMProvision for Benefits & Claims 52 26 33 44 52 45 59 79% 111 156 41%
Provision for Loan Losses and for Benefits and Claims 301 (24) 234 1,041 295 608 994 NM 511 1,897 NM
Income (Loss) Before Taxes and Minority Interest 3,350 4,218 (921) (18,797) (12,271) (4,555) (4,989) NM 6,647 (21,815) NM
Income Taxes (Benefits) 849 1,266 (561) (7,480) (5,138) (1,862) (2,047) NM 1,554 (9,047) NMMinority Interest, Net of Tax 32 84 (36) 73 (44) 52 (108) NM 80 (100) NM
Net Income (Loss) $ 2,469 $ 2,868 $ (324) $ (11,390) $ (7,089) $ (2,745) $ (2,834) NM $ 5,013 $ (12,668) NM
Average Assets (in billions of dollars) $ 1,086 $ 1,212 $ 1,355 $ 1,336 $ 1,363 $ 1,276 $ 1,124 (17%) $ 1,218 $ 1,254 3%
Average Risk Capital $ 28,031 $ 31,210 $ 35,592 $ 43,598 $ 52,617 $ 51,944 $ 47,551 34% $ 31,611 $ 50,704 60%
Return on Risk Capital 36% 37% (4%) (104%) (54%) (21%) (24%) 21% (33%)
Return on Invested Capital 27% 28% (4%) (82%) (43%) (16%) (18%) 15% (26%)
Revenue Details:
Investment Banking:
Advisory and Other Fees $ 429 $ 397 $ 459 $ 547 $ 307 $ 386 $ 315 (31%) $ 1,285 $ 1,008 (22%)
Equity Underwriting 523 539 389 461 229 518 65 (83%) 1,451 812 (44%)
Debt Underwriting 813 712 (206) 399 (2,082) (277) (173) 16% 1,319 (2,532) NM
Gross Investment Banking 1,765 1,648 642 1,407 (1,546) 627 207 (68%) 4,055 (712) NM
Revenue Allocated to the Global Wealth Management Segment:
Equity Underwriting (136) (137) (83) (88) (54) (86) (36) 57% (356) (176) 51%
Debt Underwriting (34) (42) (31) (34) (67) (88) (29) 6% (107) (184) (72%)
Net Investment Banking 1,595 1,469 528 1,285 (1,667) 453 142 (73%) 3,592 (1,072) NM
Lending 570 504 439 1,018 584 95 1,346 NM 1,513 2,025 34%
Equity Markets 1,483 1,582 1,033 738 979 1,398 476 (54%) 4,098 2,853 (30%)
Fixed Income Markets 4,451 4,652 733 (16,306) (7,023) (633) (2,412) NM 9,836 (10,068) NM
Other Securities and Banking (96) 207 (185) 175 (178) (774) 367 NM (74) (585) NM
Total Securities and Banking Revenues 8,003 8,414 2,548 (13,090) (7,305) 539 (81) NM 18,965 (6,847) NM
NM Not meaningful
Reclassified to conform to the current period's presentation.

Page 17
INSTITUTIONAL CLIENTS GROUPTRANSACTION SERVICES(In millions of dollars)
3Q08 vs. Nine Nine YTD 2008 vs.1Q 2Q 3Q 4Q 1Q 2Q 3Q 3Q07 Increase/ Months Months YTD 2007 Increase/
2007 2007 2007 2007 2008 2008 2008 (Decrease) 2007 2008 (Decrease)
Net Interest Revenue $ 841 $ 928 $ 1,032 $ 1,143 $ 1,201 $ 1,211 $ 1,308 27% $ 2,801 $ 3,720 33%
Non-Interest Revenue 809 919 1,037 1,156 1,146 1,189 1,166 12% 2,765 3,501 27%
Total Revenues, Net of Interest Expense 1,650 1,847 2,069 2,299 2,347 2,400 2,474 20% 5,566 7,221 30%Total Operating Expenses 1,039 1,129 1,228 1,367 1,299 1,372 1,288 5% 3,396 3,959 17%
Net Credit Losses 5 1 4 14 - 9 8 100% 10 17 70%
Provision for Unfunded Lending Commitments - - - - - - (6) - - (6) -Credit Reserve Build / (Release) - (7) - (29) 2 9 1 - (7) 12 NMProvision for Benefits & Claims - - - - - - - - - - -
Provision for Loan Losses and for Benefits and Claims 5 (6) 4 (15) 2 18 3 (25%) 3 23 NM
Income Before Taxes and Minority Interest 606 724 837 947 1,046 1,010 1,183 41% 2,167 3,239 49%
Income Taxes 154 204 241 273 306 300 357 48% 599 963 61%
Minority Interest, Net of Tax 4 4 5 7 8 9 9 80% 13 26 100%
Net Income $ 448 $ 516 $ 591 $ 667 $ 732 $ 701 $ 817 38% 1,555 2,250 45%
Average Assets (in billions of dollars) $ 70 $ 78 $ 79 $ 78 $ 77 $ 79 $ 79 - $ 76 $ 78 3%
Average Risk Capital $ 1,442 $ 1,643 $ 1,827 $ 1,807 $ 2,245 $ 2,109 $ 1,873 3% $ 1,637 $ 2,076 27%
Return on Risk Capital 126% 126% 128% 146% 131% 134% 174% 127% 145%
Return on Invested Capital 67% 69% 67% 69% 66% 63% 79% 68% 69%
Revenue Details:
Treasury and Trade Solutions $ 1,143 $ 1,222 $ 1,334 $ 1,483 $ 1,519 $ 1,581 $ 1,667 25% $ 3,699 $ 4,767 29%
Securities Services 507 625 735 816 828 819 807 10% 1,867 2,454 31%
Total $ 1,650 $ 1,847 $ 2,069 $ 2,299 $ 2,347 $ 2,400 $ 2,474 20% $ 5,566 $ 7,221 30%
Average Deposits and Other Customer Liability Balances (in billions)
North America $ 51 $ 59 $ 54 $ 61 $ 61 $ 52 $ 54 -
EMEA 79 88 94 99 105 110 109 16%
Latin America 12 12 18 20 20 20 20 11%
Asia 73 80 90 97 97 94 90 -
Total $ 215 ### $ 239 $ 256 $ 277 $ 283 $ 276 $ 273 7%
Assets Under Custody (EOP in trillions) $ 10.7 $ 11.3 12.7 $ 13.1 $ 12.9 $ 12.8 $ 11.9 (6%)
NM Not meaningful
Reclassified to conform to the current period's presentation.

Page 18
GLOBAL WEALTH MANAGEMENTPage 1(In millions of dollars)
3Q08 vs. Nine Nine YTD 2008 vs.1Q 2Q 3Q 4Q 1Q 2Q 3Q 3Q07 Increase/ Months Months YTD 2007 Increase/
2007 2007 2007 2007 2008 2008 2008 (Decrease) 2007 2008 (Decrease)
Net Interest Revenue $ 529 $ 526 $ 538 $ 581 $ 570 $ 599 $ 671 25% $ 1,593 $ 1,840 16%
Non-Interest Revenue 2,289 2,671 2,981 2,883 2,709 2,716 2,493 (16%) 7,941 7,918 -
Total Revenues, Net of Interest Expense 2,818 3,197 3,519 3,464 3,279 3,315 3,164 (10%) 9,534 9,758 2%
Total Operating Expenses 2,103 2,461 2,621 2,664 2,796 2,634 2,513 (4%) 7,185 7,943 11%
Net Credit Losses - - 1 - 10 (1) 1 - 1 10 NM
Credit Reserve Build / (Release) 17 12 56 15 11 41 64 14% 85 116 36%
Total Provision for Loan Losses 17 12 57 15 21 40 65 14% 86 126 47%
Income Before Taxes and Minority Interest 698 724 841 785 462 641 586 (30%) 2,263 1,689 (25%)
Income Taxes 250 197 312 260 159 232 225 (28%) 759 616 (19%)
Minority Interest, Net of Tax - 15 39 1 9 4 (2) NM 54 11 (80%)
Net Income $ 448 $ 512 $ 490 $ 524 $ 294 $ 405 $ 363 (26%) $ 1,450 $ 1,062 (27%)
Pretax Profit Margin 25% 23% 24% 23% 14% 19% 19% 24% 17%
Average Assets (in billions of dollars) $ 65 $ 78 $ 97 $ 104 $ 107 $ 110 $ 111 14% $ 80 $ 109
Average Risk Capital $ 2,879 $ 2,878 $ 3,164 $ 3,781 $ 4,509 $ 4,131 $ 3,847 22% $ 2,974 $ 4,162 40%
Return on Risk Capital 63% 71% 61% 55% 26% 39% 38% 65% 34%
Return on Invested Capital 39% 30% 23% 24% 11% 15% 15% 29% 13%
Fee-Based Revenues $ 1,775 $ 1,879 $ 2,011 $ 2,065 $ 1,960 $ 1,951 $ 1,983 (1%)
Financial Advisors (FA) / Bankers 13,605 15,595 15,458 15,454 15,241 14,983 14,735 (5%)
Net Client Asset Flows (in billions) $ 6 $ - $ 8 $ 1 $ (1) $ (11) $ 3 (63%)
Revenues:
Smith Barney $ 2,246 $ 2,611 $ 2,902 $ 2,782 $ 2,648 $ 2,715 $ 2,576 (11%) $ 7,759 $ 7,939 2%
Private Bank 572 586 617 682 631 600 588 (5%) 1,775 1,819 2%
Total Revenues $ 2,818 $ 3,197 $ 3,519 $ 3,464 $ 3,279 $ 3,315 $ 3,164 (10%) $ 9,534 $ 9,758 2%
NM Not meaningful
Reclassified to conform to the current period's presentation.

Page 19
GLOBAL WEALTH MANAGEMENTPage 2
3Q08 vs.1Q 2Q 3Q 4Q 1Q 2Q 3Q 3Q07 Increase/
2007 2007 2007 2007 2008 2008 2008 (Decrease)
KEY INDICATORS (in billions of dollars, except for branches)
Client Assets Under Fee-Based ManagementNorth America $ 377 $ 398 $ 402 $ 391 $ 364 $ 357 $ 314 (22%)EMEA 19 21 21 21 20 19 17 (19%)Latin America 13 14 14 14 13 13 11 (21%)Asia 9 76 78 81 84 80 73 (6%)
Total $ 418 $ 509 $ 515 $ 507 $ 481 $ 469 $ 415 (19%)
Average Deposits and Other Customer Liability BalancesNorth America $ 67.6 $ 66.6 $ 69.4 $ 73.0 $ 80.0 $ 78.0 $ 76.0 10%EMEA 18.0 19.0 22.0 23.0 22.0 18.0 19.0 (14%)Latin America 7.0 9.0 9.0 10.0 9.0 9.0 7.0 (22%)Asia 19.4 18.4 18.6 21.0 21.0 22.0 22.0 18%
Total $ 112.0 $ 113.0 $ 119.0 $ 127.0 $ 132.0 $ 127.0 $ 124.0 4%
Total Client Assets (1)North America $ 1,312 $ 1,375 $ 1,389 $ 1,356 $ 1,273 $ 1,242 $ 1,146 (17%)EMEA 65 69 72 69 65 63 57 (21%)Latin America 44 48 49 47 47 47 41 (16%)Asia 72 296 310 312 322 310 288 (7%)
Total $ 1,493 $ 1,788 $ 1,820 $ 1,784 $ 1,707 $ 1,662 $ 1,532 (16%)
Average LoansNorth America $ 30.4 $ 32.4 $ 34.2 $ 38.0 $ 39.9 $ 39.0 $ 38.0 11%EMEA 5.4 7.3 8.9 8.8 9.2 10.0 10.0 12%Latin America 2.2 2.2 2.6 2.6 2.5 3.0 3.0 15%Asia 8.0 9.1 11.3 11.6 12.4 13.0 13.0 15%
Total 46.0 51.0 57.0 61.0 64.0 65.0 64.0 12%
OfficesNorth America 642 700 697 683 683 674 658 (6%)EMEA 27 28 28 29 29 29 29 4%Latin America 13 12 13 13 11 11 10 (23%)Asia 23 132 133 136 136 134 134 1%
Total 705 872 871 861 859 848 831 (5%)
(1) Total Client Assets include Average Deposits and Other Customer Liability Balances.
Reclassified to conform to the current period's presentation.

Page 20
NORTH AMERICA(In millions of dollars)
3Q08 vs. Nine Nine YTD 2008 vs.1Q 2Q 3Q 4Q 1Q 2Q 3Q 3Q07 Increase/ Months Months YTD 2007 Increase/
2007 2007 2007 2007 2008 2008 2008 (Decrease) 2007 2008 (Decrease)
Net Interest Revenue $ 5,246 $ 5,676 $ 5,876 $ 6,535 $ 6,691 $ 7,180 $ 7,072 20% $ 16,798 $ 20,943 25%
Non-Interest Revenue 8,849 8,313 4,363 (7,224) (4,311) 551 (1,118) NM 21,525 (4,878) NM
Total Revenues, Net of Interest Expense 14,095 13,989 10,239 (689) 2,380 7,731 5,954 (42%) 38,323 16,065 (58%)
Total Operating Expenses 7,716 7,352 6,844 8,274 8,277 8,146 7,533 10% 21,912 23,956 9%
Net Credit Losses 1,053 1,092 1,227 2,308 2,190 2,663 3,090 NM 3,372 7,943 NMCredit Reserve Build / (Release) 267 238 1,359 3,534 1,477 2,044 2,775 NM 1,864 6,296 NMProvision for Benefits & Claims 209 170 188 193 222 214 213 13% 567 649 14%
Provision for Loan Losses and for Benefits and Claims 1,529 1,500 2,774 6,035 3,889 4,921 6,078 NM 5,803 14,888 NM
Income (Loss) Before Taxes and Minority Interest 4,850 5,137 621 (14,998) (9,786) (5,336) (7,657) NM 10,608 (22,779) NM
Income Taxes (Benefits) 1,576 1,674 143 (6,060) (4,165) (2,070) (2,892) NM 3,393 (9,127) NM
Minority Interest, Net of Tax 30 66 (3) 9 (35) 51 (126) NM 93 (110) NM
Net Income (Loss) $ 3,244 $ 3,397 $ 481 $ (8,947) $ (5,586) $ (3,317) $ (4,639) NM $ 7,122 $ (13,542) NM
Average Assets (in billions of dollars) $ 1,156 $ 1,215 $ 1,254 $ 1,262 $ 1,289 $ 1,272 $ 1,118 (11%) $ 1,208 $ 1,226 1%
Return on Assets 1.14% 1.12% 0.15% (2.81%) (1.74%) (1.05%) (1.65%) 0.79% (1.48%)
Key Drivers (in billions of dollars, except branches):
Average LoansManaged Cards $ 144.3 $ 143.2 $ 145.3 $ 150.5 $ 152.7 $ 151.2 $ 150.6 4%
Consumer Banking 277.3 286.0 293.2 302.6 307.2 305.1 291.7 (1%)
Corporate 30.8 35.0 43.3 41.9 49.3 44.9 46.2 7%
Global Wealth Management 30.4 32.4 34.2 38.0 39.9 39.0 38.0 11%
Total $ 482.8 $ 496.6 $ 516.0 $ 533.0 $ 549.1 $ 540.2 $ 526.5 2%
Average Consumer Banking LoansResidential Real Estate $ 202.2 $ 210.2 $ 214.2 $ 219.5 $ 219.9 $ 215.3 $ 205.2 (4%)Auto 16.6 18.2 19.1 20.1 21.2 21.0 20.1 5%Student 22.5 20.9 21.2 22.0 24.0 24.9 23.0 8%Personal and Other 16.9 17.3 18.4 19.6 20.4 20.9 21.5 17%Commercial 19.1 19.4 20.3 21.4 21.7 23.0 21.9 8%
Total $ 277.3 $ 286.0 $ 293.2 $ 302.6 $ 307.2 $ 305.1 $ 291.7 (1%)
Average Deposits (and other Customer Liability Balances)
Checking, Savings & Money Market Deposits $ 88.1 $ 90.7 $ 90.6 $ 90.0 $ 92.7 $ 97.4 $ 95.0 5%Time Deposits, CDs and Other 29.3 28.0 30.2 32.0 30.0 24.4 25.8 (15%)
Consumer Banking Deposits 117.4 118.7 120.8 122.0 122.7 121.8 120.8 -
Transaction Services 51.0 59.0 54.0 61.0 61.0 52.0 54.0 -Global Wealth Management 67.6 66.6 69.4 73.0 80.0 78.0 76.0 10%
Total $ 236.0 $ 244.3 $ 244.2 $ 256.0 $ 263.7 $ 251.8 $ 250.8 3%
Global Wealth Management Assets Under Fee-Based Management $ 377 $ 398 $ 402 $ 391 $ 364 $ 357 $ 314 (22%)
Global Wealth Management Total Client Assets $ 1,312 $ 1,375 $ 1,389 $ 1,356 $ 1,273 $ 1,242 $ 1,146 (17%)
Consumer Banking Investment Sales $ 1.5 $ 1.4 $ 1.3 $ 1.4 $ 1.5 $ 1.3 $ 1.2 (8%)
Consumer Banking Investment AUMs $ 34.9 $ 37.0 $ 37.9 $ 37.5 $ 34.4 $ 34.4 $ 30.7 (19%)
Branches / OfficesCitibank 993 1,001 1,015 1,046 1,051 1,030 1,010 -CitiFinancial 2,494 2,431 2,466 2,498 2,517 2,526 2,449 (1%)Global Wealth Management Offices 642 700 697 683 683 674 658 (6%)
Total 4,129 4,132 4,178 4,227 4,251 4,230 4,117 (1%)
Consumer Loans Excluding GWM
Net Credit Loss Ratio 1.34% 1.31% 1.43% 1.96% 2.45% 2.83% 3.50%
Loans 90+Days Past Due (in millions) $ 4,489 $ 4,929 $ 6,098 $ 7,349 $ 8,115 $ 8,957 $ 10,486 72%% of EOP Loans 1.40% 1.50% 1.80% 2.10% 2.34% 2.70% 3.14%
NM Not meaningful
Reclassified to conform to the current period's presentation.

Page 21
EMEA(In millions of dollars)
3Q08 vs. Nine Nine YTD 2008 vs.1Q 2Q 3Q 4Q 1Q 2Q 3Q 3Q07 Increase/ Months Months YTD 2007 Increase/
2007 2007 2007 2007 2008 2008 2008 (Decrease) 2007 2008 (Decrease)
Net Interest Revenue $ 1,410 $ 1,817 $ 1,922 $ 1,918 $ 2,104 $ 2,367 $ 2,066 7% $ 5,149 $ 6,537 27%
Non-Interest Revenue 2,434 2,391 806 (3,480) (516) 899 1,209 50% 5,631 1,592 (72%)
Total Revenues, Net of Interest Expense 3,844 4,208 2,728 (1,562) 1,588 3,266 3,275 20% 10,780 8,129 (25%)
Total Operating Expenses 2,599 2,794 2,362 3,109 3,072 2,888 2,504 6% 7,755 8,464 9%
Net Credit Losses 167 181 333 340 345 447 513 54% 681 1,305 92%Credit Reserve Build / (Release) 254 40 286 213 110 165 474 66% 580 749 29%Provision for Benefits & Claims 1 1 1 1 1 - 1 - 3 2 (33%)
Provision for Loan Losses and for Benefits and Claims 422 222 620 554 456 612 988 59% 1,264 2,056 63%
Income (Loss) Before Taxes and Minority Interest 823 1,192 (254) (5,225) (1,940) (234) (217) 15% 1,761 (2,391) NM
Income Taxes (Benefits) 113 257 (255) (1,951) (802) (127) (254) 0% 115 (1,183) NM
Minority Interest, Net of Tax 17 25 21 22 21 21 28 33% 63 70 11%
Net Income (Loss) $ 693 $ 910 $ (20) $ (3,296) $ (1,159) $ (128) $ 9 NM $ 1,583 $ (1,278) NM
Average Assets (in billions of dollars) $ 348 $ 405 $ 440 $ 431 $ 432 $ 373 $ 364 (17%) $ 398 $ 390 (2%)
Return on Assets 0.81% 0.90% (0.02%) (3.03%) (1.08%) (0.14%) 0.01% 0.53% (0.44%)
Key Drivers (in billions of dollars, except branches):
Average LoansCards $ 7.2 $ 11.6 $ 14.2 $ 15.1 $ 15.7 $ 16.5 $ 16.2 14%
Consumer Banking 17.6 21.9 24.0 25.2 25.1 26.1 25.3 5%
Corporate 68.2 75.0 81.2 78.2 73.2 70.4 61.9 (24%)
Global Wealth Management 5.4 7.3 8.9 8.8 9.2 10.0 10.0 12%
Total $ 98.4 $ 115.8 $ 128.3 $ 127.3 $ 123.2 $ 123.0 $ 113.4 (12%)
Average Consumer Banking LoansResidential Real Estate $ 6.7 $ 8.0 $ 8.6 $ 9.1 $ 8.7 $ 9.0 $ 8.6 -Personal 9.8 12.8 14.2 14.9 15.0 15.7 15.3 8%Commercial and other 1.1 1.1 1.2 1.2 1.4 1.4 1.4 17%
Total $ 17.6 $ 21.9 $ 24.0 $ 25.2 $ 25.1 $ 26.1 $ 25.3 5%
Average Deposits (and other Customer Liability Balances)
Consumer Banking Deposits $ 20.4 $ 29.0 $ 34.5 $ 35.2 $ 36.0 $ 35.5 $ 32.6 (6%)
Transaction Services 79.0 88.0 94.0 99.0 105.0 110.0 109.0 16%Global Wealth Management 18.0 19.0 22.0 23.0 22.0 18.0 19.0 (14%)
Total $ 117.4 $ 136.0 $ 150.5 $ 157.2 $ 163.0 $ 163.5 $ 160.6 7%
Global Wealth Management Assets Under Fee-Based Management $ 19 $ 21 $ 21 $ 21 $ 20 $ 19 $ 17 (19%)
Global Wealth Management Total Client Assets $ 65 $ 69 $ 72 $ 69 $ 65 $ 63 $ 57 (21%)
Consumer Banking Investment Sales $ 2.2 $ 2.1 $ 2.1 $ 2.7 $ 2.2 $ 1.6 $ 1.3 (38%)
Consumer Banking Investment AUMs $ 13.1 $ 14.6 $ 15.4 $ 15.8 $ 15.5 $ 13.7 $ 11.5 (25%)
Branches / OfficesCitibank 435 436 444 455 496 491 497 12%CitiFinancial 306 308 310 317 317 259 262 (15%)Global Wealth Management Offices 27 28 28 29 29 29 29 4%
Total 768 772 782 801 842 779 788 1%
Consumer Loans Excluding GWM
Net Credit Loss Ratio 2.71% 2.34% 3.07% 2.02% 2.94% 3.11% 3.52%
Loans 90+Days Past Due (in millions) $ 503 $ 647 $ 649 $ 555 $ 644 $ 751 $ 810 25%% of EOP Loans 1.98% 1.73% 1.66% 1.40% 1.53% 1.72% 2.02%
NM Not meaningful
Reclassified to conform to the current period's presentation.
Page 22
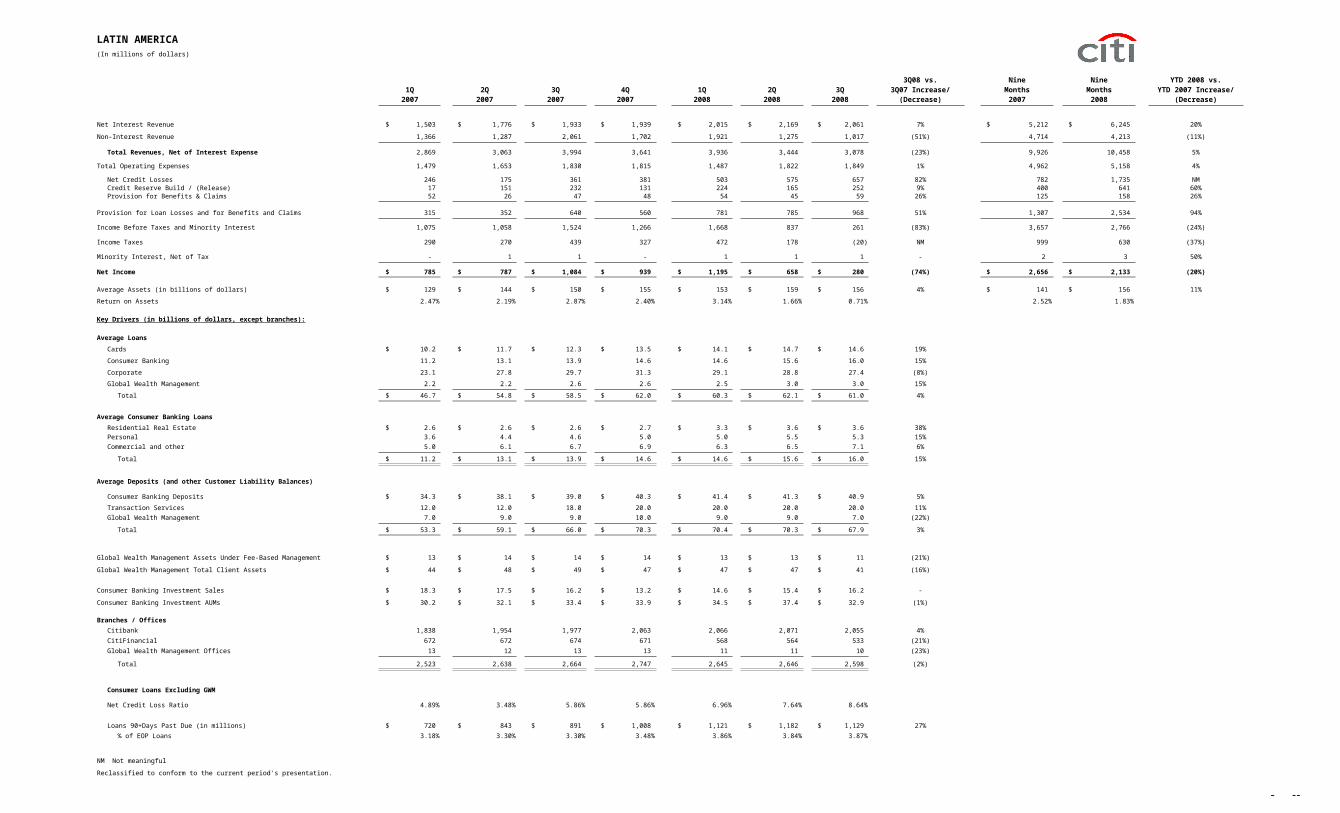
LATIN AMERICA(In millions of dollars)
3Q08 vs. Nine Nine YTD 2008 vs.1Q 2Q 3Q 4Q 1Q 2Q 3Q 3Q07 Increase/ Months Months YTD 2007 Increase/
2007 2007 2007 2007 2008 2008 2008 (Decrease) 2007 2008 (Decrease)
Net Interest Revenue $ 1,503 $ 1,776 $ 1,933 $ 1,939 $ 2,015 $ 2,169 $ 2,061 7% $ 5,212 $ 6,245 20%
Non-Interest Revenue 1,366 1,287 2,061 1,702 1,921 1,275 1,017 (51%) 4,714 4,213 (11%)
Total Revenues, Net of Interest Expense 2,869 3,063 3,994 3,641 3,936 3,444 3,078 (23%) 9,926 10,458 5%
Total Operating Expenses 1,479 1,653 1,830 1,815 1,487 1,822 1,849 1% 4,962 5,158 4%
Net Credit Losses 246 175 361 381 503 575 657 82% 782 1,735 NMCredit Reserve Build / (Release) 17 151 232 131 224 165 252 9% 400 641 60%Provision for Benefits & Claims 52 26 47 48 54 45 59 26% 125 158 26%
Provision for Loan Losses and for Benefits and Claims 315 352 640 560 781 785 968 51% 1,307 2,534 94%
Income Before Taxes and Minority Interest 1,075 1,058 1,524 1,266 1,668 837 261 (83%) 3,657 2,766 (24%)
Income Taxes 290 270 439 327 472 178 (20) NM 999 630 (37%)
Minority Interest, Net of Tax - 1 1 - 1 1 1 - 2 3 50%
Net Income $ 785 $ 787 $ 1,084 $ 939 $ 1,195 $ 658 $ 280 (74%) $ 2,656 $ 2,133 (20%)
Average Assets (in billions of dollars) $ 129 $ 144 $ 150 $ 155 $ 153 $ 159 $ 156 4% $ 141 $ 156 11%
Return on Assets 2.47% 2.19% 2.87% 2.40% 3.14% 1.66% 0.71% 2.52% 1.83%
Key Drivers (in billions of dollars, except branches):
Average LoansCards $ 10.2 $ 11.7 $ 12.3 $ 13.5 $ 14.1 $ 14.7 $ 14.6 19%
Consumer Banking 11.2 13.1 13.9 14.6 14.6 15.6 16.0 15%
Corporate 23.1 27.8 29.7 31.3 29.1 28.8 27.4 (8%)
Global Wealth Management 2.2 2.2 2.6 2.6 2.5 3.0 3.0 15%
Total $ 46.7 $ 54.8 $ 58.5 $ 62.0 $ 60.3 $ 62.1 $ 61.0 4%
Average Consumer Banking LoansResidential Real Estate $ 2.6 $ 2.6 $ 2.6 $ 2.7 $ 3.3 $ 3.6 $ 3.6 38%Personal 3.6 4.4 4.6 5.0 5.0 5.5 5.3 15%Commercial and other 5.0 6.1 6.7 6.9 6.3 6.5 7.1 6%
Total $ 11.2 $ 13.1 $ 13.9 $ 14.6 $ 14.6 $ 15.6 $ 16.0 15%
Average Deposits (and other Customer Liability Balances)
Consumer Banking Deposits $ 34.3 $ 38.1 $ 39.0 $ 40.3 $ 41.4 $ 41.3 $ 40.9 5%
Transaction Services 12.0 12.0 18.0 20.0 20.0 20.0 20.0 11%Global Wealth Management 7.0 9.0 9.0 10.0 9.0 9.0 7.0 (22%)
Total $ 53.3 $ 59.1 $ 66.0 $ 70.3 $ 70.4 $ 70.3 $ 67.9 3%
Global Wealth Management Assets Under Fee-Based Management $ 13 $ 14 $ 14 $ 14 $ 13 $ 13 $ 11 (21%)
Global Wealth Management Total Client Assets $ 44 $ 48 $ 49 $ 47 $ 47 $ 47 $ 41 (16%)
Consumer Banking Investment Sales $ 18.3 $ 17.5 $ 16.2 $ 13.2 $ 14.6 $ 15.4 $ 16.2 -
Consumer Banking Investment AUMs $ 30.2 $ 32.1 $ 33.4 $ 33.9 $ 34.5 $ 37.4 $ 32.9 (1%)
Branches / OfficesCitibank 1,838 1,954 1,977 2,063 2,066 2,071 2,055 4%CitiFinancial 672 672 674 671 568 564 533 (21%)Global Wealth Management Offices 13 12 13 13 11 11 10 (23%)
Total 2,523 2,638 2,664 2,747 2,645 2,646 2,598 (2%)
Consumer Loans Excluding GWM
Net Credit Loss Ratio 4.89% 3.48% 5.86% 5.86% 6.96% 7.64% 8.64%
Loans 90+Days Past Due (in millions) $ 720 $ 843 $ 891 $ 1,008 $ 1,121 $ 1,182 $ 1,129 27%% of EOP Loans 3.18% 3.30% 3.30% 3.48% 3.86% 3.84% 3.87%
NM Not meaningful
Reclassified to conform to the current period's presentation.

Page 23
ASIAPage 1(In millions of dollars)
3Q08 vs. Nine Nine YTD 2008 vs.1Q 2Q 3Q 4Q 1Q 2Q 3Q 3Q07 Increase/ Months Months YTD 2007 Increase/
2007 2007 2007 2007 2008 2008 2008 (Decrease) 2007 2008 (Decrease)ASIA
Net Interest Revenue $ 2,103 $ 1,920 $ 2,162 $ 2,105 $ 2,419 $ 2,484 $ 2,514 16% $ 6,185 $ 7,417 20%
Non-Interest Revenue 1,718 2,870 2,657 3,293 2,168 2,111 1,954 (26%) 7,245 6,233 (14%)
Total Revenues, Net of Interest Expense 3,821 4,790 4,819 5,398 4,587 4,595 4,468 (7%) 13,430 13,650 2%
Total Operating Expenses 1,909 2,465 2,928 2,843 2,834 2,788 2,612 (11%) 7,302 8,234 13%
Net Credit Losses 475 497 531 560 599 634 660 24% 1,503 1,893 26%Credit Reserve Build / (Release) 68 11 301 (47) 128 147 372 24% 380 647 70%Provision for Benefits & Claims - - - - - - - - - - -
Provision for Loan Losses and for Benefits and Claims 543 508 832 513 727 781 1,032 24% 1,883 2,540 35%
Income Before Taxes and Minority Interest 1,369 1,817 1,059 2,042 1,026 1,026 824 (22%) 4,245 2,876 (32%)
Income Taxes 297 533 249 518 273 250 127 (49%) 1,079 650 (40%)
Minority Interest, Net of Tax - 34 - 63 (12) 4 2 - 34 (6) NM
Net Income $ 1,072 $ 1,250 $ 810 $ 1,461 $ 765 $ 772 $ 695 (14%) $ 3,132 $ 2,232 (29%)
Average Assets (in billions of dollars) $ 249 $ 298 $ 375 $ 362 $ 364 $ 354 $ 337 (10%) $ 307 $ 352 15%
Return on Assets 1.75% 1.68% 0.86% 1.60% 0.85% 0.88% 0.82% 1.36% 0.85%
CONSUMER FINANCE JAPAN
Net Interest Revenue $ 415 $ 344 $ 263 $ 113 $ 264 $ 173 $ 224 (15%) $ 1,022 $ 661 (35%)
Non-Interest Revenue 7 1 1 13 13 3 1 - 9 17 89%
Total Revenues, Net of Interest Expense 422 345 264 126 277 176 225 (15%) 1,031 678 (34%)
Total Operating Expenses 126 102 251 97 95 101 84 (67%) 479 280 (42%)
Net Credit Losses 302 302 324 314 317 314 295 (9%) 928 926 -Credit Reserve Build / (Release) 4 14 161 - - - 91 (43%) 179 91 (49%)Provision for Benefits & Claims - - - - - - 1 - - 1 -
Provision for Loan Losses and for Benefits and Claims 306 316 485 314 317 314 387 (20%) 1,107 1,018 (8%)
Income Before Taxes and Minority Interest (10) (73) (472) (285) (135) (239) (246) 48% (555) (620) (12%)
Income Taxes (12) (33) (174) (101) (49) (85) (87) 50% (219) (221) (1%)
Minority Interest, Net of Tax - - - - - - - - - - -
Net Income $ 2 $ (40) $ (298) $ (184) $ (86) $ (154) $ (159) 47% $ (336) $ (399) (19%)
Average Assets (in billions of dollars) $ 10 $ 10 $ 9 $ 9 $ 9 $ 8 $ 8 (11%) $ 10 $ 8 (20%)
Return on Assets 0.08% (1.60%) (13.14%) (8.11%) (3.84%) (7.74%) (7.91%) (4.49%) (6.66%)
ASIA EXCLUDING CONSUMER FINANCE JAPAN
Net Interest Revenue $ 1,688 $ 1,576 $ 1,899 $ 1,992 $ 2,155 $ 2,311 $ 2,290 21% $ 5,163 $ 6,756 31%
Non-Interest Revenue 1,711 2,869 2,656 3,280 2,155 2,108 1,953 (26%) 7,236 6,216 (14%)
Total Revenues, Net of Interest Expense 3,399 4,445 4,555 5,272 4,310 4,419 4,243 (7%) 12,399 12,972 5%
Total Operating Expenses 1,783 2,363 2,677 2,746 2,739 2,687 2,528 (6%) 6,823 7,954 17%
Net Credit Losses 173 195 207 246 282 320 365 76% 575 967 68%Credit Reserve Build / (Release) 64 (3) 140 (47) 128 147 281 101% 201 556 NMProvision for Benefits & Claims - - - - - - (1) - - (1) -
Provision for Loan Losses and for Benefits and Claims 237 192 347 199 410 467 645 86% 776 1,522 96%
Income Before Taxes and Minority Interest 1,379 1,890 1,531 2,327 1,161 1,265 1,070 (30%) 4,800 3,496 (27%)
Income Taxes 309 566 423 619 322 335 214 (49%) 1,298 871 (33%)
Minority Interest, Net of Tax - 34 - 63 (12) 4 2 - 34 (6) NM
Net Income $ 1,070 $ 1,290 $ 1,108 $ 1,645 $ 851 $ 926 $ 854 (23%) $ 3,468 $ 2,631 (24%)
Average Assets (in billions of dollars) $ 239 $ 288 $ 366 $ 353 $ 355 $ 346 $ 329 (10%) $ 298 $ 343 15%
Return on Assets 1.82% 1.80% 1.20% 1.85% 0.96% 1.08% 1.03% 1.56% 1.02%
NM Not meaningful
Reclassified to conform to the current period's presentation.

Page 24
ASIAPage 2(In millions of dollars)
3Q08 vs.1Q 2Q 3Q 4Q 1Q 2Q 3Q 3Q07 Increase/
2007 2007 2007 2007 2008 2008 2008 (Decrease)
Key Drivers (in billions of dollars, except branches):
Average LoansCards $ 13.2 $ 13.9 $ 14.8 $ 16.0 $ 17.1 $ 17.6 $ 17.3 17%
Consumer Banking (excluding CF Japan) 43.4 45.3 46.4 49.5 51.9 51.6 49.9 8%
Corporate 42.7 46.9 48.4 48.3 45.2 43.6 40.1 (17%)
Global Wealth Management 8.0 9.1 11.3 11.6 12.4 13.0 13.0 15%
107.3 115.2 120.9 125.4 126.6 125.8 120.3 -
Consumer Finance Japan 9.0 8.5 8.5 8.5 8.9 8.4 7.8 (8%)
Total $ 116.3 $ 123.7 $ 129.4 $ 133.9 $ 135.5 $ 134.2 $ 128.1 (1%)
Average Consumer Banking Loans (excluding CF Japan)Residential Real Estate $ 23.9 $ 24.6 $ 24.7 $ 26.5 $ 28.4 $ 28.4 $ 27.1 10%Personal 8.6 9.3 9.9 10.7 11.1 11.1 10.8 9%Commercial and other 10.9 11.4 11.8 12.3 12.4 12.1 12.0 1%
Total $ 43.4 $ 45.3 $ 46.4 $ 49.5 $ 51.9 $ 51.6 $ 49.9 8%
Average Deposits (and other Customer Liability Balances)
Consumer Banking Deposits $ 86.6 $ 87.7 $ 88.8 $ 92.9 $ 97.7 $ 96.8 $ 92.5 4%
Transaction Services 73.0 80.0 90.0 97.0 97.0 94.0 90.0 -Global Wealth Management 19.4 18.4 18.6 21.0 21.0 22.0 22.0 18%
Total $ 179.0 $ 186.1 $ 197.4 $ 210.9 $ 215.7 $ 212.8 $ 204.5 4%
Global Wealth Management Assets Under Fee-Based Management $ 9 $ 76 $ 78 $ 81 $ 84 $ 80 $ 73 (6%)
Global Wealth Management Total Client Assets $ 72 $ 296 $ 310 $ 312 $ 322 $ 310 $ 288 (7%)
Consumer Banking Investment Sales $ 10.9 $ 13.6 $ 13.8 $ 16.0 $ 10.0 $ 9.5 $ 6.1 (56%)
Consumer Banking Investment AUMs $ 48.1 $ 52.4 $ 57.1 $ 59.1 $ 54.3 $ 53.1 $ 44.9 (21%)
Branches / OfficesCitibank 428 428 434 484 492 492 495 14%CitiFinancial (excluding Japan) 640 641 643 662 612 555 555 (14%)Global Wealth Management Offices 23 132 133 136 136 134 134 1%
1,091 1,201 1,210 1,282 1,240 1,181 1,184 (2%)Consumer Finance Japan 51 51 51 51 41 36 19 (63%)
Total 1,142 1,252 1,261 1,333 1,281 1,217 1,203 (5%)
Consumer Loans Excluding GWM
Net Credit Loss Ratio 2.95% 2.95% 3.02% 2.89% 2.99% 3.16% 3.32%
Loans 90+Days Past Due (in millions) $ 658 $ 657 $ 697 $ 706 $ 765 $ 798 $ 747 7%% of EOP Loans 0.99% 0.96% 0.98% 0.93% 0.98% 1.03% 1.04%
Reclassified to conform to the current period's presentation.

Page 25
Average Risk Capital ($M) (2) Return on Risk Capital Return on Invested Capital
Third Second Third Third Second Third Third Second ThirdQuarter Quarter Quarter Quarter Quarter Quarter Quarter Quarter Quarter
2007 2008 2008 2007 2008 2008 2007 2008 2008
Global Cards $ 8,722 $ 15,233 $ 14,520 66% 12% (25%) 29% 7% (13%)
Consumer Banking 21,221 29,978 30,965 3% (11%) (14%) 2% (6%) (8%)
Institutional Clients Group (ICG):
Securities and Banking 35,592 51,944 47,551 (4%) (21%) (24%) (4%) (16%) (18%)Transaction Services 1,827 2,109 1,873 128% 134% 174% 67% 63% 79%
Total Institutional Clients Group (ICG) 37,419 54,053 49,424 3% (15%) (16%) 1% (11%) (12%)
Global Wealth Management 3,164 4,131 3,847 61% 39% 38% 23% 15% 15%
Corporate / Other 4,144 4,736 4,794 NM NM NM NM NM NM
Total Citigroup - Risk Capital (2) $ 74,670 $ 108,131 $ 103,550 11% (9%) (13%)
Total Citigroup - Return on Invested Capital (2) (3) 7% (10%) (12%)
(1) Risk Capital is defined as the amount of capital needed to cover unexpected economic losses during extreme events. Return on Risk Capital is defined as income divided by Risk
Capital. Return on Invested Capital is a similar calculation but includes adjustments for goodwill and intangibles in both the numerator and denominator, similar to those necessary
to translate return on tangible equity to return on total equity. Return on Risk Capital and Return on Invested Capital are non-GAAP performance measures. Management believes
Return on Risk Capital is useful to make incremental investment decisions and serves as a key metric for organic growth initiatives. Return on Invested Capital is used for multi-year
investment decisions and as a long term performance measure.
(2) Average Risk Capital is net of the cross-sector diversification. Average Invested Capital includes the difference between Tangible Equity and Risk Capital, which is also included
in the Total Citigroup Return on Invested Capital.
(3) Total Citigroup Return on Invested Capital equals Citigroup Return on Common Equity.
NM Not meaningful
Reclassified to conform to the current period's presentation.
CITIGROUP -- RETURN ON CAPITAL (1)

Page 26
Average Volumes Interest
Third Second Third Third Second Third Third Second ThirdQuarter Quarter Quarter Quarter Quarter Quarter Quarter Quarter Quarter
In millions of dollars 2007 2008 2007 2008 2008 2007 2008Assets:
Deposits with Banks $ 60,972 $ 63,952 $ 66,922 $ 855 $ 773 $ 803 5.56% 4.86% 4.77%
369,561 241,854 234,337 5,090 2,377 2,222 5.46% 3.95% 3.77%
487,688 410,346 368,657 5,156 4,644 4,154 4.19% 4.55% 4.48%
257,894 222,055 225,178 3,340 2,548 2,597 5.14% 4.62% 4.59%
Consumer Loans 531,236 565,339 546,319 12,089 12,208 11,925 9.03% 8.69% 8.68%
Corporate Loans 202,349 189,262 172,603 4,252 3,733 3,603 8.34% 7.93% 8.30%
733,585 754,601 718,922 16,341 15,941 15,528 8.84% 8.50% 8.59%
Other Interest-Earning Assets 97,506 94,129 92,022 1,485 1,089 878 6.04% 4.65% 3.80%
Total Average Interest-Earning Assets $ 2,007,206 $ 1,786,937 $ 1,706,038 $ 32,267 $ 27,372 $ 26,182 6.38% 6.16% 6.11%
Liabilities:
Deposits $ 707,268 $ 710,138 $ 674,617 $ 7,456 $ 5,082 $ 4,915 4.18% 2.88% 2.90%
428,281 283,347 262,380 6,431 2,964 2,737 5.96% 4.21% 4.15%
117,854 75,948 73,040 371 456 290 1.25% 2.41% 1.58%
Short-Term Borrowings 263,450 217,767 197,951 1,965 994 935 2.96% 1.84% 1.88%
315,351 353,333 362,631 4,200 3,911 3,899 5.28% 4.45% 4.28%
Total Average Interest-Bearing Liabilities $ 1,832,204 $ 1,640,533 $ 1,570,619 $ 20,423 $ 13,407 $ 12,776 4.42% 3.29% 3.24%
Net Interest Revenue as a % of Average Interest-Earning Assets (NIM) $ 11,844 $ 13,965 $ 13,406 2.34% 3.14% 3.13%
3Q08 Increase From 79 bps (1) bps
(1) Interest Revenue excludes the taxable equivalent adjustments (based on the U.S. federal statutory tax rate of 35%) of $34 million for the 2007 third quarter,
$65 million for the 2008 second quarter and $51 million for the 2008 third quarter.
(2) Citigroup Average Balances and Interest Rates include both domestic and international operations.
(3) Monthly or quarterly averages have been used by certain subsidiaries where daily averages are unavailable.
(4) Average Rate % is calculated as annualized interest over average volumes.
(5) Preliminary
(6) Average volumes of securities borrowed or purchased under agreements to resell and securities loaned or sold under agreements to repurchase are reported net pursuant to FIN 41; the related interest excludes the impact of FIN 41.
(7) Interest expense on trading account liabilities of ICG is reported as a reduction of interest revenue. Interest revenue and interest expense on cash collateral positions are reported in trading account assets and trading account liabilities, respectively.
(8) Excludes hybrid financial instruments and beneficial interests in consolidated VIEs that are classified as long-term debt as these obligations are accounted for at fair value with changes recorded in Principal Transactions.
In addition, the majority of the funding provided by Corporate Treasury to CitiCapital operations is excluded from this line.
Reclassified to conform to the current period's presentation and has been reclassified to exclude Discontinued Operations.
AVERAGE BALANCES AND INTEREST RATES (1)(2)(3)(4)(5)
% Average Rate (4)
2008 (5) 2008 (5)
Fed Funds Sold and Resale Agreements (6)
Trading Account Assets (7)
Investments (1)
Total Loans (net of Unearned Income)
Fed Funds Purchased and Repurchase Agreements (6)
Trading Account Liabilities (7)
Long-Term Debt (8)

Page 27
CONSUMER LOAN DELINQUENCY AMOUNTS, NET CREDIT LOSSES AND RATIOS(In millions of dollars, except loan amounts in billions)
EOP Average90 Days Or More Past Due (1) Loans Net Credit Losses (1) Loans
3Q07 2Q08 3Q08 3Q08 3Q07 2Q08 3Q08 3Q08PRODUCT VIEW:
Global Cards
North America $ 725 $ 887 $ 946 $ 43.2 $ 455 $ 687 $ 766 $ 41.8 Ratio 1.80% 2.21% 2.19% 4.37% 6.46% 7.30%EMEA 264 309 330 15.8 175 161 180 16.2 Ratio 1.81% 1.81% 2.08% 4.90% 3.94% 4.41%Latin America 473 625 597 13.7 299 417 484 14.6 Ratio 3.67% 4.16% 4.36% 9.65% 11.41% 13.16%Asia 218 274 263 16.7 116 147 158 17.3 Ratio 1.43% 1.53% 1.57% 3.11% 3.37% 3.63%
Consumer BankingNorth America 5,373 8,070 9,540 291.1 749 1,764 2,166 291.7 Ratio 1.80% 2.76% 3.28% 1.01% 2.33% 2.95%
EMEA 385 442 480 24.3 121 168 188 25.3 Ratio 1.57% 1.66% 1.97% 1.99% 2.59% 2.95%
Latin America 418 557 532 15.5 88 158 182 16.0 Ratio 2.96% 3.54% 3.43% 2.51% 4.08% 4.53%
Asia 479 524 484 55.3 415 462 469 57.7 Ratio 0.85% 0.87% 0.88% 3.00% 3.10% 3.23%
Global Wealth Management 31 80 147 63.4 1 (1) 1 64.0 Ratio 0.05% 0.13% 0.23% 0.00% (0.01%) 0.01%
On-Balance Sheet Loans (2) $ 8,366 $ 11,768 $ 13,319 $ 539.0 $ 2,419 $ 3,963 $ 4,594 $ 544.6
Ratio 1.56% 2.14% 2.47% 1.82% 2.82% 3.35%
Securitized Receivables (all in NA Cards) 1,595 2,163 2,248 107.9 1,198 1,766 1,935 108.8
Loans Held-for-Sale 40 - - - - - - -
Managed Loans (3) $ 10,001 $ 13,931 $ 15,567 $ 646.9 $ 3,617 $ 5,729 $ 6,529 $ 653.4
Ratio 1.56% 2.11% 2.41% 2.28% 3.43% 3.97%
REGIONAL VIEW:
North America $ 6,125 $ 9,033 $ 10,626 $ 372.8 $ 1,205 $ 2,450 $ 2,933 $ 371.5 Ratio 1.63% 2.43% 2.85% 1.29% 2.55% 3.13%
EMEA 650 752 813 49.4 296 329 367 51.5 Ratio 1.37% 1.38% 1.65% 2.49% 2.52% 2.83%
Latin America 891 1,182 1,130 32.3 387 575 666 33.6 Ratio 3.01% 3.50% 3.50% 5.34% 6.99% 7.85%
Asia 700 801 750 84.5 531 609 628 88.0 Ratio 0.84% 0.88% 0.89% 2.60% 2.71% 2.84%
On-Balance Sheet Loans (2) $ 8,366 $ 11,768 $ 13,319 $ 539.0 $ 2,419 $ 3,963 $ 4,594 $ 544.6
Ratio 1.56% 2.14% 2.47% 1.82% 2.82% 3.35%Securitized Receivables (all in NA Cards) 1,595 2,163 2,248 107.9 1,198 1,766 1,935 108.8
Loans Held-for-Sale 40 - - - - - - -
Managed Loans (3) $ 10,001 $ 13,931 $ 15,567 $ 646.9 $ 3,617 $ 5,729 $ 6,529 $ 653.4 Ratio 1.56% 2.11% 2.41% 2.28% 3.43% 3.97%
(1) The ratios of 90 days or more past due and net credit losses are calculated based on end-of-period and average loans, respectively, both net of unearned income.
(2) Total Loans and Total Average Loans exclude certain interest and fees on credit cards of approximately $3 billion and $3 billion, respectively, which are included in Consumer Loans on the Consolidated Balance Sheet.
(3) This table presents consumer credit information on a held basis and shows the impact of securitizations to reconcile to a managed basis. Only N.A. Cards from a productview and North America from a regional view are impacted. Managed basis reporting is a non-GAAP measure. Held basis reporting is the related GAAP measure. For a discussion ofmanaged basis reporting see Note 1 to the Global Cards business on page 10.
Reclassified to conform to the current period's presentation.

Page 28
ALLOWANCE FOR CREDIT LOSSESTOTAL CITIGROUP(In millions of dollars)
3Q08 vs. Nine Nine YTD 2008 vs.1Q 2Q 3Q 4Q 1Q 2Q 3Q 3Q07 Increase/ Months Months YTD 2007 Increase/
2007 2007 2007 2007 2008 2008 2008 (Decrease) 2007 2008 (Decrease)
Allowance for Loan Losses at Beginning of Period $ 8,940 $ 9,510 $ 10,381 $ 12,728 $ 16,117 $ 18,257 $ 20,777 $ 8,940 $ 16,117
Gross Credit (Losses) (2,548) (2,627) (3,013) (4,251) (4,247) (4,969) (5,467) (81%) (8,188) (14,683) (79%)
Gross Recoveries 606 685 560 662 609 649 547 (2%) 1,851 1,805 (2%)
Net Credit (Losses) / Recoveries (NCL's) (1,942) (1,942) (2,453) (3,589) (3,638) (4,320) (4,920) (101%) (6,337) (12,878) NM
NCL's 1,942 1,942 2,453 3,589 3,638 4,320 4,920 101% 6,337 12,878 NM
Reserve Releases (1) (36) - - (4) (89) (115) (56) - (36) (260) NM
Reserve Builds (1) 627 496 1,983 3,537 1,885 2,646 3,483 76% 3,106 8,014 NM
Specific Reserve Releases / Utilizations (30) (65) (50) (9) (35) (29) (13) 74% (145) (77) 47%
Specific Reserve Builds 43 - 197 205 170 159 614 NM 240 943 NM
Build(Release/Utilization)for Purchased Distressed Loan Portfolios 3 9 (2) 2 8 2 (5) NM 10 5 (50%)
Provision for Loan Losses 2,549 2,382 4,581 7,320 5,577 6,983 8,943 95% 9,512 21,503 NM
Other (2) (37) 431 219 (342) 201 (143) (795) 613 (737) NM
Allowance for Loan Losses at End of Period (a) $ 9,510 $ 10,381 $ 12,728 $ 16,117 $ 18,257 $ 20,777 $ 24,005 $ 12,728 $ 24,005
Corporate Allowance for Unfunded Lending Commitments (3) (a) $ 1,100 $ 1,100 $ 1,150 $ 1,250 $ 1,250 $ 1,107 $ 957 $ 1,150 $ 957
Provision for Unfunded Lending Commitments $ - $ - $ 50 $ 100 $ - $ (143) $ (150) $ 50 $ (293)
Total Allowance for Loans, Leases and Unfunded Lending Commitments [Sum of (a)] $ 10,610 $ 11,481 $ 13,878 $ 17,367 $ 19,507 $ 21,884 $ 24,962 $ 13,878 $ 24,962
Total Allowance for Loans, Leases and Unfunded Lending
Commitments as a Percentage of Total Loans 1.53% 1.55% 1.79% 2.23% 2.47% 2.93% 3.48%
(1) Allowance for Credit Losses represents management's estimate of probable losses inherent in the portfolio. Attribution of the allowance is made for analytical purposes only, and the entire allowance is
available to absorb probable credit losses inherent in the portfolio. Included in the allowance for loan losses are reserves for Trouble Debt Restructurings (TDRs) of $1,443 million, $882 million and $443
million as of September 30 2008, June 30 2008 and March 31, 2008, respectively.
(2) Includes all adjustments to the Allowance for Credit Losses, such as changes in the allowance from acquisitions, securitizations, foreign exchange translation, purchase
accounting adjustments, etc. The significant items reported on this line for the periods presented include:
- For the 2008 third quarter, reductions to the credit loss reserves of $23 million related to securitizations, reductions of $244 million related to the pending sale of Germany and
reductions of approximately $400 million related to foreign currency translation.
- For the 2008 second quarter, reductions to the credit loss reserves of $21 million related to securitizations, reductions of $156 million related to the sale of CitiCapital and additions of $56 million related to purchase price adjustments
for the Cuscatlan acquisition.
- For the 2008 first quarter, reductions to the credit loss reserves of $58 million related to securitizations and additions of $50 million related to purchase price adjustments
for the Bank of Overseas Chinese acquisition.
- For the 2007 fourth quarter, reductions to the credit loss reserves of $150 million related to securitizations and $7 million related to transfers to loans held-for-sale, reductions of $151 million related to purchase price adjustments
for the Egg Bank acquisition and reductions of $83 million related to the transfer of the U.K. CitiFinancial portfolio to held-for-sale.
- For the 2007 third quarter, reductions to the credit loss reserves of $73 million related to securitizations. Additionally includes adjustments for purchase accounting relating to the acquisition of Grupo Cuscatlan of $181 million.
- For the 2007 second quarter, reductions to the credit loss reserves of $70 million related to securitizations and $77 million related to transfers to loans held-for-sale, and the addition of $505
million related to the acquisition of Egg and Nikko.
- For the 2007 first quarter, reductions to the credit loss reserves of $98 million related to securitizations and transfers to loans held-for-sale, and the addition of $75 million related to the acquisition of Grupo Financiero Uno.
(3) Represents additional credit reserves recorded as other liabilities on the Consolidated Balance Sheet.
NM Not meaningful
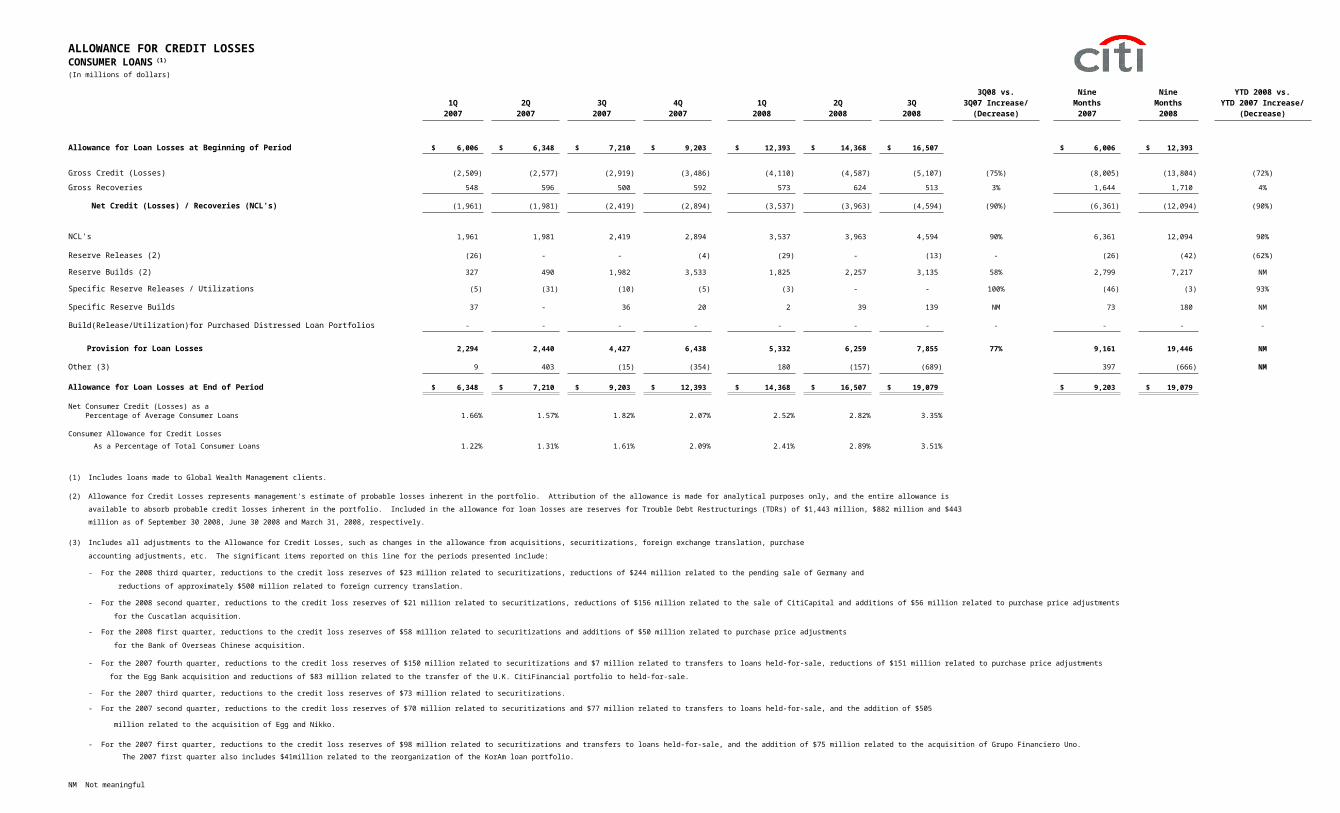
Page 29
ALLOWANCE FOR CREDIT LOSSES
(In millions of dollars)
3Q08 vs. Nine Nine YTD 2008 vs.1Q 2Q 3Q 4Q 1Q 2Q 3Q 3Q07 Increase/ Months Months YTD 2007 Increase/
2007 2007 2007 2007 2008 2008 2008 (Decrease) 2007 2008 (Decrease)
Allowance for Loan Losses at Beginning of Period $ 6,006 $ 6,348 $ 7,210 $ 9,203 $ 12,393 $ 14,368 $ 16,507 $ 6,006 $ 12,393
Gross Credit (Losses) (2,509) (2,577) (2,919) (3,486) (4,110) (4,587) (5,107) (75%) (8,005) (13,804) (72%)
Gross Recoveries 548 596 500 592 573 624 513 3% 1,644 1,710 4%
Net Credit (Losses) / Recoveries (NCL's) (1,961) (1,981) (2,419) (2,894) (3,537) (3,963) (4,594) (90%) (6,361) (12,094) (90%)
NCL's 1,961 1,981 2,419 2,894 3,537 3,963 4,594 90% 6,361 12,094 90%
Reserve Releases (2) (26) - - (4) (29) - (13) - (26) (42) (62%)
Reserve Builds (2) 327 490 1,982 3,533 1,825 2,257 3,135 58% 2,799 7,217 NM
Specific Reserve Releases / Utilizations (5) (31) (10) (5) (3) - - 100% (46) (3) 93%
Specific Reserve Builds 37 - 36 20 2 39 139 NM 73 180 NM
Build(Release/Utilization)for Purchased Distressed Loan Portfolios - - - - - - - - - - -
Provision for Loan Losses 2,294 2,440 4,427 6,438 5,332 6,259 7,855 77% 9,161 19,446 NM
Other (3) 9 403 (15) (354) 180 (157) (689) 397 (666) NM
Allowance for Loan Losses at End of Period $ 6,348 $ 7,210 $ 9,203 $ 12,393 $ 14,368 $ 16,507 $ 19,079 $ 9,203 $ 19,079
Net Consumer Credit (Losses) as a Percentage of Average Consumer Loans 1.66% 1.57% 1.82% 2.07% 2.52% 2.82% 3.35%
Consumer Allowance for Credit Losses
As a Percentage of Total Consumer Loans 1.22% 1.31% 1.61% 2.09% 2.41% 2.89% 3.51%
(1) Includes loans made to Global Wealth Management clients.
(2) Allowance for Credit Losses represents management's estimate of probable losses inherent in the portfolio. Attribution of the allowance is made for analytical purposes only, and the entire allowance is
available to absorb probable credit losses inherent in the portfolio. Included in the allowance for loan losses are reserves for Trouble Debt Restructurings (TDRs) of $1,443 million, $882 million and $443
million as of September 30 2008, June 30 2008 and March 31, 2008, respectively.
(3) Includes all adjustments to the Allowance for Credit Losses, such as changes in the allowance from acquisitions, securitizations, foreign exchange translation, purchase
accounting adjustments, etc. The significant items reported on this line for the periods presented include:
- For the 2008 third quarter, reductions to the credit loss reserves of $23 million related to securitizations, reductions of $244 million related to the pending sale of Germany and
reductions of approximately $500 million related to foreign currency translation.
- For the 2008 second quarter, reductions to the credit loss reserves of $21 million related to securitizations, reductions of $156 million related to the sale of CitiCapital and additions of $56 million related to purchase price adjustments
for the Cuscatlan acquisition.
- For the 2008 first quarter, reductions to the credit loss reserves of $58 million related to securitizations and additions of $50 million related to purchase price adjustments
for the Bank of Overseas Chinese acquisition.
- For the 2007 fourth quarter, reductions to the credit loss reserves of $150 million related to securitizations and $7 million related to transfers to loans held-for-sale, reductions of $151 million related to purchase price adjustments
for the Egg Bank acquisition and reductions of $83 million related to the transfer of the U.K. CitiFinancial portfolio to held-for-sale.
- For the 2007 third quarter, reductions to the credit loss reserves of $73 million related to securitizations.
- For the 2007 second quarter, reductions to the credit loss reserves of $70 million related to securitizations and $77 million related to transfers to loans held-for-sale, and the addition of $505
million related to the acquisition of Egg and Nikko.
- For the 2007 first quarter, reductions to the credit loss reserves of $98 million related to securitizations and transfers to loans held-for-sale, and the addition of $75 million related to the acquisition of Grupo Financiero Uno.
The 2007 first quarter also includes $41million related to the reorganization of the KorAm loan portfolio.
NM Not meaningful
CONSUMER LOANS (1)
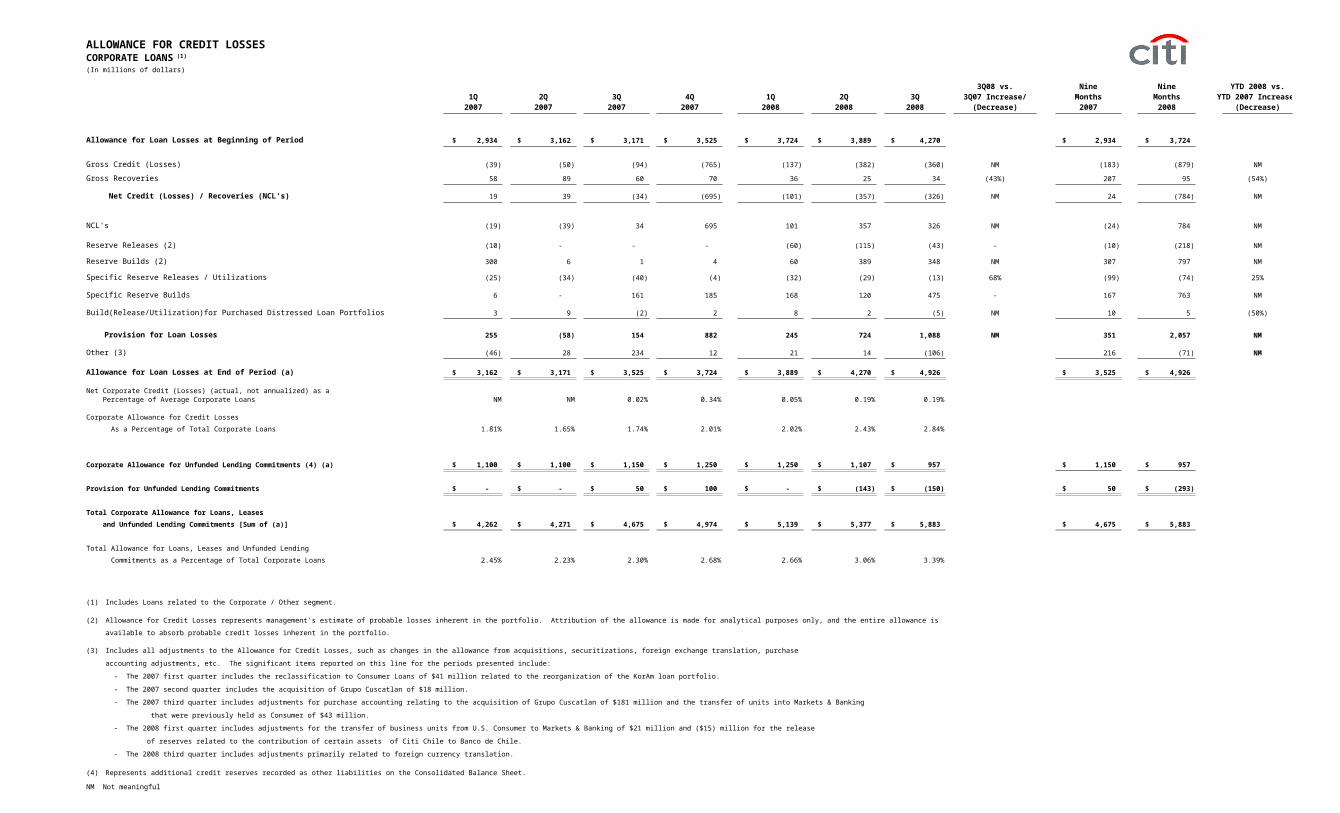
Page 30
ALLOWANCE FOR CREDIT LOSSES
(In millions of dollars)
3Q08 vs. Nine Nine YTD 2008 vs.1Q 2Q 3Q 4Q 1Q 2Q 3Q 3Q07 Increase/ Months Months YTD 2007 Increase/
2007 2007 2007 2007 2008 2008 2008 (Decrease) 2007 2008 (Decrease)
Allowance for Loan Losses at Beginning of Period $ 2,934 $ 3,162 $ 3,171 $ 3,525 $ 3,724 $ 3,889 $ 4,270 $ 2,934 $ 3,724
Gross Credit (Losses) (39) (50) (94) (765) (137) (382) (360) NM (183) (879) NM
Gross Recoveries 58 89 60 70 36 25 34 (43%) 207 95 (54%)
Net Credit (Losses) / Recoveries (NCL's) 19 39 (34) (695) (101) (357) (326) NM 24 (784) NM
NCL's (19) (39) 34 695 101 357 326 NM (24) 784 NM
Reserve Releases (2) (10) - - - (60) (115) (43) - (10) (218) NM
Reserve Builds (2) 300 6 1 4 60 389 348 NM 307 797 NM
Specific Reserve Releases / Utilizations (25) (34) (40) (4) (32) (29) (13) 68% (99) (74) 25%
Specific Reserve Builds 6 - 161 185 168 120 475 - 167 763 NM
Build(Release/Utilization)for Purchased Distressed Loan Portfolios 3 9 (2) 2 8 2 (5) NM 10 5 (50%)
Provision for Loan Losses 255 (58) 154 882 245 724 1,088 NM 351 2,057 NM
Other (3) (46) 28 234 12 21 14 (106) 216 (71) NM
Allowance for Loan Losses at End of Period (a) $ 3,162 $ 3,171 $ 3,525 $ 3,724 $ 3,889 $ 4,270 $ 4,926 $ 3,525 $ 4,926
Net Corporate Credit (Losses) (actual, not annualized) as a Percentage of Average Corporate Loans NM NM 0.02% 0.34% 0.05% 0.19% 0.19%
Corporate Allowance for Credit Losses
As a Percentage of Total Corporate Loans 1.81% 1.65% 1.74% 2.01% 2.02% 2.43% 2.84%
Corporate Allowance for Unfunded Lending Commitments (4) (a) $ 1,100 $ 1,100 $ 1,150 $ 1,250 $ 1,250 $ 1,107 $ 957 $ 1,150 $ 957
Provision for Unfunded Lending Commitments $ - $ - $ 50 $ 100 $ - $ (143) $ (150) $ 50 $ (293)
Total Corporate Allowance for Loans, Leases and Unfunded Lending Commitments [Sum of (a)] $ 4,262 $ 4,271 $ 4,675 $ 4,974 $ 5,139 $ 5,377 $ 5,883 $ 4,675 $ 5,883
Total Allowance for Loans, Leases and Unfunded Lending
Commitments as a Percentage of Total Corporate Loans 2.45% 2.23% 2.30% 2.68% 2.66% 3.06% 3.39%
(1) Includes Loans related to the Corporate / Other segment.
(2) Allowance for Credit Losses represents management's estimate of probable losses inherent in the portfolio. Attribution of the allowance is made for analytical purposes only, and the entire allowance is
available to absorb probable credit losses inherent in the portfolio.
(3) Includes all adjustments to the Allowance for Credit Losses, such as changes in the allowance from acquisitions, securitizations, foreign exchange translation, purchase
accounting adjustments, etc. The significant items reported on this line for the periods presented include:
- The 2007 first quarter includes the reclassification to Consumer Loans of $41 million related to the reorganization of the KorAm loan portfolio.
- The 2007 second quarter includes the acquisition of Grupo Cuscatlan of $18 million.
- The 2007 third quarter includes adjustments for purchase accounting relating to the acquisition of Grupo Cuscatlan of $181 million and the transfer of units into Markets & Banking
that were previously held as Consumer of $43 million.
- The 2008 first quarter includes adjustments for the transfer of business units from U.S. Consumer to Markets & Banking of $21 million and ($15) million for the release
of reserves related to the contribution of certain assets of Citi Chile to Banco de Chile.
- The 2008 third quarter includes adjustments primarily related to foreign currency translation.
(4) Represents additional credit reserves recorded as other liabilities on the Consolidated Balance Sheet.
NM Not meaningful
CORPORATE LOANS (1)
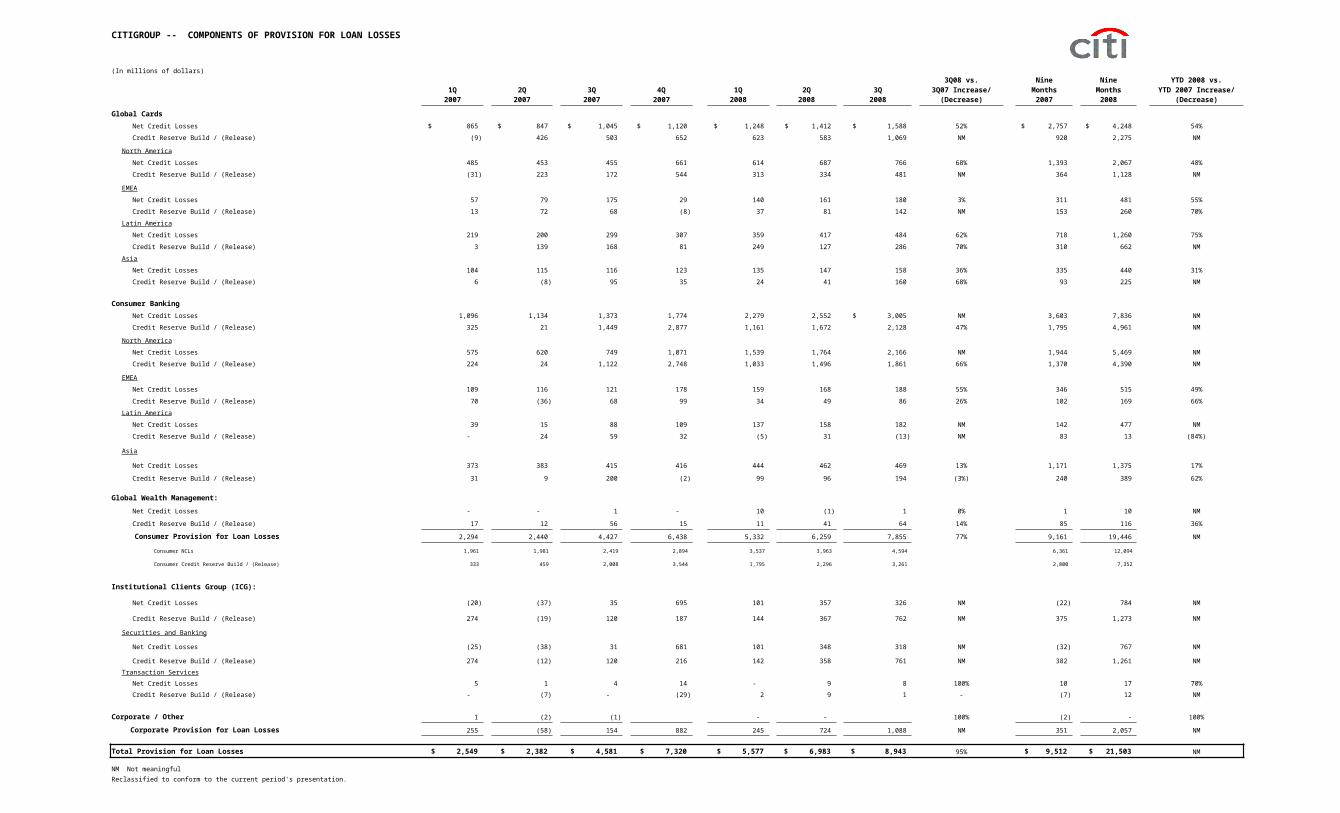
Page 31
CITIGROUP -- COMPONENTS OF PROVISION FOR LOAN LOSSES
(In millions of dollars)3Q08 vs. Nine Nine YTD 2008 vs.
1Q 2Q 3Q 4Q 1Q 2Q 3Q 3Q07 Increase/ Months Months YTD 2007 Increase/2007 2007 2007 2007 2008 2008 2008 (Decrease) 2007 2008 (Decrease)
Global CardsNet Credit Losses $ 865 $ 847 $ 1,045 $ 1,120 $ 1,248 $ 1,412 $ 1,588 52% $ 2,757 $ 4,248 54%
Credit Reserve Build / (Release) (9) 426 503 652 623 583 1,069 NM 920 2,275 NM
North America
Net Credit Losses 485 453 455 661 614 687 766 68% 1,393 2,067 48%
Credit Reserve Build / (Release) (31) 223 172 544 313 334 481 NM 364 1,128 NM
EMEA
Net Credit Losses 57 79 175 29 140 161 180 3% 311 481 55%
Credit Reserve Build / (Release) 13 72 68 (8) 37 81 142 NM 153 260 70%
Latin America
Net Credit Losses 219 200 299 307 359 417 484 62% 718 1,260 75%
Credit Reserve Build / (Release) 3 139 168 81 249 127 286 70% 310 662 NM
Asia
Net Credit Losses 104 115 116 123 135 147 158 36% 335 440 31%
Credit Reserve Build / (Release) 6 (8) 95 35 24 41 160 68% 93 225 NM
Consumer BankingNet Credit Losses 1,096 1,134 1,373 1,774 2,279 2,552 $ 3,005 NM 3,603 7,836 NM
Credit Reserve Build / (Release) 325 21 1,449 2,877 1,161 1,672 2,128 47% 1,795 4,961 NM
North America
Net Credit Losses 575 620 749 1,071 1,539 1,764 2,166 NM 1,944 5,469 NM
Credit Reserve Build / (Release) 224 24 1,122 2,748 1,033 1,496 1,861 66% 1,370 4,390 NM
EMEA
Net Credit Losses 109 116 121 178 159 168 188 55% 346 515 49%
Credit Reserve Build / (Release) 70 (36) 68 99 34 49 86 26% 102 169 66%
Latin America
Net Credit Losses 39 15 88 109 137 158 182 NM 142 477 NM
Credit Reserve Build / (Release) - 24 59 32 (5) 31 (13) NM 83 13 (84%)
Asia
Net Credit Losses 373 383 415 416 444 462 469 13% 1,171 1,375 17%
Credit Reserve Build / (Release) 31 9 200 (2) 99 96 194 (3%) 240 389 62%
Global Wealth Management:
Net Credit Losses - - 1 - 10 (1) 1 0% 1 10 NM
Credit Reserve Build / (Release) 17 12 56 15 11 41 64 14% 85 116 36%
Consumer Provision for Loan Losses 2,294 2,440 4,427 6,438 5,332 6,259 7,855 77% 9,161 19,446 NM
Consumer NCLs 1,961 1,981 2,419 2,894 3,537 3,963 4,594 6,361 12,094
Consumer Credit Reserve Build / (Release) 333 459 2,008 3,544 1,795 2,296 3,261 2,800 7,352
Institutional Clients Group (ICG):
Net Credit Losses (20) (37) 35 695 101 357 326 NM (22) 784 NM
Credit Reserve Build / (Release) 274 (19) 120 187 144 367 762 NM 375 1,273 NM
Securities and Banking
Net Credit Losses (25) (38) 31 681 101 348 318 NM (32) 767 NM
Credit Reserve Build / (Release) 274 (12) 120 216 142 358 761 NM 382 1,261 NM
Transaction Services
Net Credit Losses 5 1 4 14 - 9 8 100% 10 17 70%
Credit Reserve Build / (Release) - (7) - (29) 2 9 1 - (7) 12 NM
Corporate / Other 1 (2) (1) - - 100% (2) - 100%
Corporate Provision for Loan Losses 255 (58) 154 882 245 724 1,088 NM 351 2,057 NM
Total Provision for Loan Losses $ 2,549 $ 2,382 $ 4,581 $ 7,320 $ 5,577 $ 6,983 $ 8,943 95% $ 9,512 $ 21,503 NM
NM Not meaningfulReclassified to conform to the current period's presentation.

Page 32
(In millions of dollars)
1Q 2Q 3Q 4Q 1Q 2Q 3Q
2007 2007 2007 2007 2008 2008 2008
CASH-BASIS AND RENEGOTIATED LOANSCorporate Cash-Basis LoansCollateral Dependent (at lower of cost or collateral value) $ 19 $ 11 $ 11 $ 11 $ 6 $ 5 $ 5 Other 481 588 1,207 1,747 2,028 2,271 2,661
Total Corporate Cash-Basis Loans (1) $ 500 $ 599 $ 1,218 $ 1,758 $ 2,034 $ 2,276 $ 2,666
Corporate Cash-Basis Loans JENA (2) $ 118 $ 204 $ 841 $ 1,320 $ 1,577 $ 1,939 $ 1,965 Other International (3) 382 395 377 438 457 337 701
Total Corporate Cash-Basis Loans (1) $ 500 $ 599 $ 1,218 $ 1,758 $ 2,034 $ 2,276 $ 2,666
Corporate Cash-Basis Loans as a % of Total Corporate Loans (1) 0.29% 0.31% 0.60% 0.95% 1.05% 1.30% 1.54%
Total Consumer Cash-Basis Loans (1) $ 4,578 $ 5,160 $ 6,137 $ 7,210 $ 8,301 $ 9,350 $ 10,877
Renegotiated Loans (includes Corporate and Commercial Business Loans) $ 26 $ 27 $ 56 $ 118 $ 174 $ 184 $ 124
OTHER REAL ESTATE OWNED AND OTHER REPOSSESSED ASSETS
Consumer $ 470 $ 524 $ 596 $ 716 $ 1,008 $ 1,121 $ 1,200
ICG 348 219 348 512 545 489 402
TOTAL OTHER REAL ESTATE OWNED (4) $ 818 $ 743 $ 944 $ 1,228 $ 1,553 $ 1,610 $ 1,602
OTHER REPOSSESSED ASSETS (5) $ 77 $ 66 $ 86 $ 99 $ 107 $ 94 $ 81
(1) Excludes purchased distressed loans. The carrying value of these loans was: $957 million at March 31, 2007, $1,013 million at June 30, 2007, $1,188 at September 30,
2007, $2,399 million at December 31, 2007, $2,224 million at March 31, 2008, $1,891 million at June 30, 2008, and $1,550 million at September 30, 2008.
(2) JENA includes Japan, Western Europe and North America.
(3) Other International includes Asia (excluding Japan), Mexico, Latin America, Central and Eastern Europe, the Middle East and Africa.
(4) Represents repossessed real estate, carried at lower of cost or fair value, less costs to sell.
(5) Primarily transportation equipment, carried at lower of cost or fair value, less costs to sell.
*** END OF FILE ***
NON-PERFORMING ASSETS