citrus marketing in punjab: constraints and potential for
TRANSCRIPT

The Pakistan Development Review 44 : 4 Part II (Winter 2005) pp. 673–694
Citrus Marketing in Punjab: Constraints and Potential for Improvement
MUHAMMAD SHARIF, UMAR FAROOQ, and WAQAR MALIK*
I. INTRODUCTION
Pakistan is blessed with the agro-ecological environment conducive to the production of nearly thirty types of fruits of which citrus, mango, dates, guava, apple, melons and banana are relatively more common. The market value of these fruits produced during 2002-03 is estimated at about Rs 73 billion, which is roughly 6.73 percent of agriculture value added in the year [Pakistan (2004)]. During the same period, Pakistan earned nearly 5 billion rupees from fruit exports, representing 9 percent of total export earnings from all raw agricultural commodities. Citrus is the largest grown fruit in Pakistan. The market value of citrus produced in 2002-03 was Rs 10.6 billion [Pakistan (2004)]. Within the citrus family, Kinnow is the largest planted specie.
Besides income, citrus is also significantly contributing to employment generation through the various activities ranging from production to domestic and international marketing activities. Assuming that all the Kinnow produced in Punjab is domestically marketed, the employment generated from Kinnow production and marketing is estimated at about 23.48 million labour-days or full time round the year jobs for more than 75 thousand people (about 57 thousand in production and remaining in marketing sectors) during 2001-02. In per capita terms, the annual availability of citrus fruits is nearly 12.5 kilograms of which Kinnow makes up about 8 kilograms [Sharif (2004)].
About 94 percent of the citrus area is located in the Punjab province. The area and production of citrus in Punjab have grown at the rates of 5.6 percent and 4.7 percent per annum, respectively during 1980-81 to 1990-91. However, subsequently during the period 1991-92 to 2001-02, this pace could not be maintained. The growth rate fell to 1.08 percent and 1.06 percent per annum, respectively [Sharif (2004)]. The low level of growth in citrus production during the 1990s indicates that the
Muhammad Sharif, Umar Farooq, and Waqar Malik all based at the Pakistan Agricultural Research Council, Islamabad.

Sharif, Farooq, and Malik 674
incentives for the farmers to increase production remained depressed. This also implies that domestic citrus market is not generating signals for encouraging investment in citrus production. It is, therefore, imperative to examine the citrus marketing system in the country along with the constraints faced by various stakeholders, the underlying objective of the present study.
The specific objectives of the present study were:
• To identify the present citrus marketing channels and estimate the margins of different market intermediaries;
• To identify the socio-economic and technical constraints to citrus marketing functionaries; and
• To suggest recommendations for improvements in domestic marketing systems.
II. REVIEW OF LITERATURE
Kohls and Uhl (1980) defined marketing as “The series of activities involved in making available services and information which influence the desired level of production relative to market requirements, and the movement of product (or commodity) from the point of its production to the point of final consumption”. This includes physical handling and transport, initial processing and packing to simplify handling and reduce wastage, grading and quality control to simplify sales transactions and meet different consumers’ requirements and holding over time to match concentrated harvest seasons with the continuing demand of consumers.
Traditionally, market efficiency has been examined by applying the correlation coefficient technique [see Lale (1971)]. But this approach has been widely criticised on the grounds that a high correlation coefficient between two markets does not necessarily mean that these markets are well integrated in the sense that efficient performance of traders prevails, which ensures that agricultural products move between markets in a quick response to price differences that exceed transport costs. Alexander and Wyeth (1992) pointed out that correlation coefficient results would be misleading when the data include trends or cycle, but these problems can be resolved by use of a detrended data set.1 Concerns about using correlation analysis with poor data sets, however, are unavoidable no matter what technique is used [Khuskh (1997)].
The review of literature revealed that like other developing countries, in Pakistan, marketing functions are performed in a traditional way and markets for agricultural products may not function efficiently. There are generally great differences between prices paid by consumer and those received by producers [Toaha (1974); Qureshi (1974); Sattar, et al. (1976); Siddiqui (1977, 1979); Memon
1When detrended approach is used, testing stationarity of a variable is necessary, which can be done with the help of a unit root test [Charemza and Deadman (1993)].
Citrus Marketing in Punjab 675
(1978); Khan (1980); and Mohy-ud-din (1991)]. On the other hand, very little research has been done on domestic marketing of fruits and vegetables, therefore, highly inadequate to guide the policy-makers. What so ever is available is briefly summarised in Tables 1. It is generally perceived that marketing agents exploit producers and consumers by charging high margins on their investment [Ali (2000)]. However, these perceptions might be false because: (i) marketing margins in the off-season are lower than margins in the peak season; (ii) price variability is generally lower at the retail or wholesale level than at the farm gate; (iii) negative correlation between prices paid by agents and marketing margins implies that when agents pay higher prices, they have to reduce their margin, mainly by reducing their profit. However, no rigorous analysis is available on the rate of return on investment made by marketing agents.
Regarding the marketing margins (Rs/kg) of different intermediaries, producers earned a margin of 0.95-5.00, contractors as 1.55–8.75, commission agent as 0.09–1.37, wholesalers 0.82-2.5 and retailers as 1.3–6.25. The lowest margins were in banana and highest for mango. The lowest variation in marketing margins per unit quantity handled was at producers’ ends and highest at contractors. In case of vegetables, the producers were found earning a margin (Rs/kg) of 3.06–14.02, commission agents as 0.28–0.82, wholesalers as 0.73–1.75 and retailers as 1.06–2.93. The lowest margins were obtained in case of onion and highest for tomato (Table 1). This may be attributed to the element of high perishability in case of tomatoes.
III. METHODOLOGY
This paper is based on primary data collected from a survey of citrus producers, market intermediaries and fruit markets in citrus production and consumption areas. A purposive stratified random sampling approach was used. Since the scope of the study is countrywide, therefore, the universe becomes all the domestic markets of Pakistan. Punjab, being the main producer of citrus fruit is the population of this study. In Punjab citrus orchards are particularly located in Sargodha, R. Y. Khan and T. T. Singh Districts. Being the largest citrus growing district in the province and largest number of citrus exporters located in Sargodha, this district was selected. Following the same criteria, Sargodha and Bhalwal tehsils were further chosen for the formal survey. Three villages were randomly chosen from selected tehsils. Further, 10–12 citrus growers per village were randomly chosen for interview. Contractors, commission agents and wholesalers dealing in citrus and the retailers from different localities of the area were also interviewed.
Before conducting the formal survey, a weeklong informal survey was carried out for getting first hand information to prepare different sets of questionnaires. This exercise provided an opportunity to understand the existing production, marketing and export methods prevailing in the study area. During the informal survey, the interviews were conducted with group of producers, market intermediaries, and

Sharif, Farooq, and Malik 676
Table 1
Margins of Different Intermediaries in Fruits and Vegetables Marketing in Pakistan
Marketing Margins (Rs/kg)
Authors Province Commo-
dity Producer Contractor Comm.
Agent Whole-
saler Retailer
Fruits Lashari, et al. 1995 Sindh Mango 4.12 8.12 1.00 0.82 3.41 Khushk, et al. 1996 Sindh Mango 4.12 7.12 1.00 .082 3.41 Khushk, et al. 2003 Sindh Mango 3.18 4.88 0.88 1.29 3.12 Khushk, et al. 2000 Sindh Dates 5.00 8.75 1.37 2.12 2.75 Khushk, et al. 1998 Sindh Guava 3.53 5.41 1.00 1.06 2.82 Bashir, et al. 2001 Balochistan Apple 4.75 1.94 1.22 1.35 2.61 Mohy-ud-din, 1989 Punjab Kinnow
F.Early Malta Mitha Other Overall
– – – – – –
0.25 0.30 0.62 0.47 0.34
–
0.09 0.10 0.12 0.11 0.10 0.10
0.20 0.20 0.17 0.20 0.21 0.19
0.43 0.38 0.47 0.51 0.36 0.43
Khushk, et al. 2001 Sindh Mango Guava
5.00 3.53
8.64 5.41
1.21 1.00
1.00 1.06
4.14 2.82
Memon, et al. 2003 Sindh Dates 4.75 8.37 1.30 2.50 2.82 Khushk, et al. 2004 Punjab and
Sindh Mango Guava Dates Citrus
3.47 2.06 4.75 2.82
5.76 4.76 5.92 3.70
1.00 0.76 1.05 0.23
1.53 0.94 2.00 1.23
4.76 4.06 2.82 6.23
Mari, et al. 2002 Sindh Banana 0.94 1.55 0.09 0.96 1.30
Vegetables Lashari, et al. 2002 Sindh Onion 3.40 – 0.73 0.87 1.22 Khushk and Lashari, 1999 Sindh Tomato 5.76 – 0.82 1.70 1.82 Khushk, 2001 Sindh Onion
Tomato 3.06 5.76
– –
0.54 0.82
0.73 1.70
1.06 1.82
Lashari, et al. 2003 Sindh Tomato 5.29 2.88 0.59 0.82 2.06 Siddique, 1977 Sindh Potato
Onion Chillies Rice
0.81 0.70 3.38 0.66
– –
1.07 0.62
– – – –
0.50 0.41 1.13 0.49
0.57 0.22 2.24 0.29
Memon, 1978 Sindh Potato Onion Chillies Rice
1.11 0.49 6.61 039
– –
3.15 0.32
– – – –
0.90 1.01 0.80 0.35
0.38 0.70 2.23 0.21
Khan, 1980 Sindh Chillies Onion Potato
6.90 1.36 1.19
1.50 – –
– – –
1.60 0.30 .056
0.81 0.71 0.56
Khushk, et al. 2004 Punjab+ Sindh Sindh Punjab Punjab+ Sindh
Onion Chillies Potato Tomato
3.71 14.02 5.99 6.94
– 3.65
(Processor)
0.28 0.89 0.31 0.59
0.75 1.52 1.37 1.41
1.60 1.55 2.93 2.24

Citrus Marketing in Punjab 677
citrus exporters etc. Based on this preliminary information sampling frames for each category of sample respondents were prepared and questionnaires were refined. Formal interviews were conducted with the following samples: Producers 125; contractors 25; commission agents 20; wholesalers 44 and retailers 41. Regarding group of the data, the contractors were grouped into A, B and C types based on the investments made. The commission agents, wholesalers, retailers were classified into less and more experienced. Marketing margin analysis, deconstructing marketing margin, profitability and market integration analyses were conducted to analyse the data. For details of these analyses, [see Sharif (2004)].
IV. RESULTS AND DISCUSSION IV.1. Citrus Marketing System in Punjab
Citrus marketing system in Punjab contains marketing channels and citrus contracting system. The brief description of both categories is narrated below.
(a) Citrus Marketing Channels
Agricultural marketing channels are the routes followed by the agricultural commodities before reaching in the hands of final consumers. The Figure 1 depicts the existing citrus marketing channels in a typical fruit-marketing scenario. The existing citrus marketing channels have been identified and their contribution in citrus marketing is briefly discussed as under.
Majority of citrus producers (95 percent) sold the harvesting rights in their orchard at the flowering stage to the contractors. In contracting business, there are no fixed criteria for entry and exit into the business. However, contracting of citrus orchards is not an easy job. The established contractors possess a wide knowledge in orchard management and marketing practices. At the time of contracting an orchard, several factors like age and health of the orchard, flowering intensity, citrus variety, distance from metal road, road quality, availability of transport facilities and transport cost involved need to be contemplated. It was noticed that experienced contractors more accurately estimate orchard output based on appreciation of the natural environment and disease incidence. The sample citrus contractors were having more than 13 years experience in the business.
The commission agent is an important functionary in agricultural marketing. All the sample fruit commission agents (local and other markets of Pakistan) extended short-term loans to the contractors. With the onset of harvesting season, the contractors start bringing the produce for sale to them. The contractors do not receive all the sale revenues from the commission agents as he is already under debt, rather gradually settle the accounts. However, the commission agents do provides some money to them to meet the expenses like

Sharif, Farooq, and Malik 678
second and third installments for orchard owners, transport, payment to the labour and packing material, etc. At the end of the season, the contractors finally settle the season’s account with the commission agents and become eligible for making deals in the next season with the citrus producers. Local and other country markets’ commission agents found handling 51 percent and 40 percent of the total production, respectively (Figure 1). The sample commission agents had about 17 years of professional experience.
Fig. 1. Citrus Marketing System in Punjab
Citrus Producer(100%)
Contractor Kinnow Factories
Citrus Exporters
Local CommissionAgents
Inter-provincialCommission Agents
Local Wholesalers Inter-provincialWholesalers
Local Retailers Inter-provincialRetailers
Local ConsumersInter-provincial
Consumers
95%4%
5%
9%
40%
91%
51%
41% 30%10%10%
41%
51%
30%
40%
Source: Survey data (2001).
Citrus Marketing in Punjab 679
The wholesaler usually purchases fruit from the commission agents through open auction and sells to the retailers and consumers. After purchasing the produce, he brings the produce on his yard where some grading, standardisation, and cleaning is done. Local and other provinces’ wholesalers found handling 45 percent and 30 percent of the total production. The sample commission agents had 13 years of professional experience.
Two types of retailers (i.e., stallholders and hawkers) were found in citrus marketing. Hawkers sell the fruit in baskets or hand pushed carts and are usually mobile. The stallholders have shop in the consumer markets, colonies and roadside markets etc. Both local and other country market retailers bought 10 percent of the produce from commission agent (Figure 1). The sample retailers were having 12 years of professional experience. Consumers of the citrus fruits are industrial buyers and households. Industrial buyers include processing factories that purchase from contractors directly from citrus orchards.
(b) Citrus Contracting System
As already discussed, most of the citrus output is mainly marketed through contractors and majority of the citrus orchards have been contracted soon after the fruit formation. Just after the fruit formation completed, the contractors visit the area and make contract with the orchard owners (both with whom they have business in the past and new ones). The contract price is decided on the basis of age, health and past performance of the orchard, availability of canal water, fruit formation, variety, transport cost involved and the past dealing record of both owner and contractor.
Finally, the producer also has his own rough estimates and its value in the market. Citrus growers normally decide on a contract after meeting 6 to 7 contractors. Majority (89 percent) of growers selected the contractor who offered the highest price for their orchard and (42 percent) selected contractors who have a good reputation in respect of timely payment. This provides evidence that both price and non-price factor plays role in selecting a contractor. Many factors lead citrus growers to contract out citrus harvesting rights. The most important reason reported was lack of marketing knowledge. This needs to be interpreted broadly. It was observed that commission agents do not extend short-term loans to growers to enable them to manage their orchard and to buy inputs and packing material in time, which is mainly because majority of the pre-harvest contractors directly take output to other markets of the country. The second most important reason reported that commission agents do not want to transfer market price information to producers and provide other facilities such as, accommodation and telephone access at the market place. Therefore, producers have very little information about the marketing of their produce, and face a number of barriers to active participation in the process. The third reason reported by the growers is that they are growing other crops, at the time of harvesting of citrus. The sowing and harvesting operations of other rabi and kharif crops entail enough of their time,

Sharif, Farooq, and Malik 680
therefore, they do not have much time to manage all these activities, and prefer to sell an orchard to a contractor. Only 10 percent of citrus growers reported urgent cash needs as a reason to contract the orchard (Table 2).
Table 2
Reasons Reported by the Citrus Growers for Using Contract Marketing Reasons Frequency Percent No Marketing Knowledge 49 43 Exploitation of Commission Agents 23 20 Growing of other Crops 17 15 Risk in Marketing Process 11 10 Marketing Requires Investment 12 10 Time Constraint 16 14 Need of Cash 16 10 Transportation Problem 8 7
Source: Survey data (2001). IV.2. Marking Marginal Analysis
The marketing margin analysis revealed that overall citrus prices at retail level are almost three times higher than what is received by the producer. The major jumps in citrus prices were observed from producer to contractor and from wholesaler to retailer (Table 3). The earlier intermediary brings produce from farm to market and later carries it from market to at/near the door-step of the consumer.
(i) Absolute Cash Margin Analysis
The absolute cash margin analysis shows that contractors receive the largest margin (89 percent) (Table 3). This may be because they bear the highest costs and most risk among all marketing agencies. Contractors lease the citrus orchards at the time of flowering. If we consider the risk factors like high product variation, bad weather, insect attack and disease incidence, high transport costs, output spoilage during transportation, then this margin may not be very high. The losses occurred at farm as 9 percent, contractor as 5.35 percent (i.e. picking 3 percent, packing 2 percent, and transportation 0.35 percent) [Sharif (2004)]. The second intermediary earning highest profit (25 percent of purchase price) is the retailer. The retailer normally buys a quantity easily disposed in one day. The investment is relatively low but there is a risk that it may be impossible to sell the whole quantity. The retailer also has no proper opportunity to ascertain the quality, quantity, size, and colour of layers filled in the crates by the wholesaler. The absolute cash margins of all intermediaries found increasing as the citrus production season proceeds towards its end.

Citrus Marketing in Punjab 681
Table 3
Absolute Cash Margin of Producers and Market Intermediaries (Rs/kg) Market Intermediaries Early Season Mid Season Late Season Whole Season Producer Price 3.94 3.94 3.94 3.94 Contractor 2.67 (67.8) 3.21 (81.5) 4.67 (118.5) 3.52 (89.3) Commission Agent 0.48 (7.3) 0.55 (7.7) 0.67 (7.8) 0.55 (7.37) Wholesaler 0.79 (11.1) 0.91 (11.8) 1.09 (11.8) 0.91 (11.36) Retailer 1.09 (13.8) 1.45 (16.8) 4.24 (40.9) 2.24 (25.11) Retailer Price 8.97 10.06 14.61 11.15
Source: Survey data (2001). Figures in parenthesis are absolute cash margins in percentage terms.
(ii) Share in Consumer’s Rupee
In this analysis, the consumer’s one rupee expenditure on a particular commodity is divided between the producer and other marketing agencies in percentage terms. Overall, the producers’ share was 35 percent followed by contractors and retailers obtaining 32 percent and 20 percent, respectively. The producers’ share in early season was estimated as 44 percent and 27 percent at the end of the season. The percent share of commission agents and wholesalers was also declining. For the rest of the intermediaries, it was increasing towards the end of the season. The percent share of retailers in consumer rupee was more than double during late season than the mid-season (Table 4). This is perhaps because of high probability of quality deterioration due to high temperature in late season particularly. The results are similar to the results reported by Khushk and Smith (1996) in mango marketing in Sindh province of Pakistan.
Table 4
Percent Share in Consumer Rupees of Citrus Market Intermediaries Market Intermediaries Early Season Mid Season Late Season Whole Season Producer 43.9 39.2 27.0 35.3 Contractor 29.7 31.9 31.9 31.5 Commission Agent 5.4 5.4 4.6 4.9 Wholesaler 8.8 9.0 7.5 8.2 Retailer 12.2 14.5 29.1 20.1 Consumer Rupees 100.0 100.0 100.0 100.0
Source: Survey data (2001).
(iii) Marketing Costs
The marketing costs using the actual expenses incurred were computed at each stage of the marketing chain. Overall, the marketing costs of the contractors were the highest and of commission agents as the lowest (Table 5).

Sharif, Farooq, and Malik 682
Table 5
Market Costs of Citrus Producers and Market Intermediaries (Rs/kg) Market Intermediaries Early Season Mid Season Late Season Whole Season Producer 1.15 1.15 1.15 1.15 Contractor 1.94 2.18 2.42 2.18 Commission Agent 0.24 0.30 0.30 0.30 Wholesaler 0.48 0.48 0.48 0.48 Retailer 0.73 0.85 0.97 0.85
Source: Survey data (2001).
The researcher in collecting the marketing costs from the market agencies encountered a few problems. These problems are: (a) lack of available written records with the growers and other market intermediaries. If available, it was out of reach from the research workers. Therefore, crosschecking was applied in order to reduce the margin of error; (b) the respondents were hesitant answering many questions related to costs and profit margins in their business. Hence, it involved a lot of time and effort on the part of the research worker to gain a fair degree of confidence of respondents and hence to obtain from them the required information.
(iv) Profit Margins
A further indicator calculated is the percentage profit margin defined for each intermediary as the net profit margin divided by the absolute cash margin expressed as a percentage. The absolute cash margin was already calculated by subtracting the price paid by a specific agent from the price received by the same agency. The estimated percentage profit margins of each marketing intermediary are presented in (Table 6). The grower received highest profit margin (71 percent) followed by retailer (62 percent). The other marketing agencies including contractors, commission agents and wholesalers received 38 percent, 44 percent and 47 percent respectively. Assessment of whether or not the values found for the indicators presented here show that citrus marketing system is fair and efficient is difficult to judge.
Table 6
Percent Profit Margin of Citrus Market Intermediaries Market Intermediaries Early Season Mid Season Late Season Whole Season Producer 70.8 70.8 70.8 70.8
Contractor 27.3 32.1 48.1 37.9
Commission Agent 50.0 44.4 54.6 44.4
Wholesaler 38.5 46.7 55.6 46.7
Retailer 33.3 41.7 77.1 62.2
Source: Survey data (2001).

Citrus Marketing in Punjab 683
IV.3. Deconstructing Marketing Margin Analysis
The purpose of deconstructing marketing margin is to know what component of marketing activity is important or absorbing the greater share of consumer rupee (Table 7). It was found that at contractor level, the profit margin, marketing costs and transport costs are the major elements of the gross margin earned. At commission agent level, expenses on business management and profit are major components. At wholesaler level, the profit margin and material cost constitute major part of the price difference. At retailer level, the profit margin, opportunity value of labour and transport cost are the main elements in the distribution of gross margins earned. It can be concluded that the highest profit margins are fixed/earned by the contractors and retailers. Their transport expenditures are also very high.
It can be concluded that (i) profit absorbed most of the marketing margin; (ii) retailers receives the highest gross returns and rate of return are highest in comparison with other marketing agents; (iii) the highest rate of wastage occurs at the level of contractor. Efforts are required to control the post harvest losses through making improvements in packing material.
Table 7
Itemised Marketing Margin (% of the Total Margin) by Type of Intermediaries Cont. C. Agent Wholesaler Retailer Overall Cost Items/
Operations …(%)… Rs/kg % Margin (Rs) 3.5 0.6 0.9 2.2 7.21
Transport 6.6 0.0 1.3 3.2 0.80 11.0 Marketing Cost 12.6 0.4 2.7 1.0 1.20 16.6 Output Loss 5.4 0.0 0.0 1.9 0.52 7.2 Management 2.1 3.6 1.2 1.1 0.58 8.0 Labour 3.7 0.2 1.5 4.7 0.73 10.1 Profit 18.5 3.4 5.9 19.3 3.39 47.1 Total 48.7 7.6 12.6 31.1 100.0
Source: Survey data (2001). IV.4. Profitability Analysis
The profitability analysis is carried out for different market intermediaries and presented in the following subsections.
(i) Profitability of Citrus Contractors
The summary of contractors’ costs indicates that the net profits of “A” type contractors are considerably higher than of “B” and “C” types.2 “A” type
2Contractors having contracts higher than Rs 2 million were classified as A type contractors, those having contracts below Rs 1 million were put under category C, and the remaining ones were placed in category B.

Sharif, Farooq, and Malik 684
contractors have higher market share due to large capital investment, strong bargaining position and low operating costs. Comparable with the one available example from literature in Pakistan, the returns earn by mango contractors appear quite high, but not exceptionally high as fairly high level of risks are also involved. An average Return On Capital Employed (ROCE) was 16 percent for nine months, or 1.78 percent per month, also appears attractive compared to interest earn on bank deposit accounts, currently within the range of 12-14 percent per annum in Pakistan. The results indicate that on average, citrus contractors earned about Rs 50,000/month (Table 8), which is reasonably good for the services provided.
Table 8
Profitability of Citrus Contractors During 2001-02 A B C Average
Total Sample Size 6 6 13 25
Total Fixed Costs 2560000 1635167 944076 1809960
Operating Costs 2078462 893052 530135 1002439
Total Costs 4638462 2528219 1474211 2812399
Gross Revenue 5456169 2965941 1686265 3257928
Net Profit/Season 817707 437722 212054 445529
Net Profit/Month 90856 48636 23562 49503
ROCE/Season (%) 18% 17% 14% 16%
Source: Survey data (2001). (ii) Profitability of Commission Agents
Overall the ROCE was higher than the rate estimated for the contractors. It was found that net profit is directly associated with the duration of experience. This implies that more experienced commission agent perform business in a highly profitable manner as compared with their counterpart as their ROCE was 23 percent higher (Table 9). Compared to other studies, Sial and Anjum (1990) found that returns to capital for commission agents ranged between 64 percent and 104 percent in Rawalpindi market. They concluded that commission agent is the most established intermediary in the marketing chain.

Citrus Marketing in Punjab 685
Table 9
Profitability of Commission Agents Dealing in Citrus Fruits for 2001-02 Less Experience More Experience Overall Sample Size 12.0 8.0 20.0 Total kgs/Season 1391742.0 1760764.5 1613155.5 Average Price/kg (Rs) 7.7 8.1 7.9 Gross Revenue/kg (Rs) 0.5 0.6 0.6 Gross Revenue/Season (Rs) 759132.0 1003102.2 889679.7 Total Cost/kg (Rs) 0.3 0.3 0.3 Total Costs (Rs) 438609.6 512222.4 488835.0 Net Profit/Season 320522.4 490879.8 400844.7 Net Profit/Month 80130.6 122720.0 100211.2 ROCE/Season (%) 73.1 95.8 82.0
Source: Survey data, 2001. (iii) Profitability of Wholesalers
Their profit margin varies with the quality of the fruit and price prevailing. Overall the return on capital employed was estimated as 86 percent. In early and late seasons, the amount of profit per kg is relatively higher as compared with the mid-season. It was found that the operational costs of wholesalers are relatively higher as compared with other market intermediaries. This is mainly because the volume of business involved is relatively smaller in size and they also have to face some losses due to commodity deterioration. The more experienced wholesalers were earning relatively higher profit (Table 10).
Table 10
Profitability of Wholesalers Dealing in Citrus Fruits for 2001-02 Less Experience More Experience Overall Sample Size 25.0 19.0 44.0 Volume Trade/Day (kg) 1171.5 1666.5 1336.5 Volume Trade/Season (kg) 140580.0 199980.0 160380.0 Gross Revenue/Season 119211.8 193980.6 145945.8 Fixed Costs 15773.1 20677.9 17289.0 Operational Costs 55922.7 73312.7 61297.2 Total Costs 71695.8 93990.6 78586.2 Net Profit/Season 47516.0 99990.0 67359.6 Net Profit/Month 11879.0 24997.5 16839.9 ROCE/Season (%) 66.3% 106.4% 85.7%

Sharif, Farooq, and Malik 686
(iv) Profitability of Retailers
It was found that retailers had lower variable costs than the wholesalers and commission agents. The returns on capital invested were highest for retailers than all market intermediaries. Like wholesalers and commission agents, the percent returns on capital found positively associated with the duration of professional experience. It was also found that except their own labour, they hardly employ any other labour for assistance in business activities (Table 11).
Table 11
Profitability of Retailers Dealing in Citrus Fruits for 2001-02 Less Experience More Experience Overall
Sample Size 25.0 19.0 44.0 Volume Traded/Day (kg) 74.3 81.7 80.0 Volume Traded/Season (kg) 8910.0 9801.0 9603.0 Margin/kg 2.2 2.3 2.2 Gross Revenue/Season 19423.8 22542.3 21510.7 Fixed Costs/kg 0.3 0.3 0.3 Operational Costs/kg 0.6 0.5 0.6 Total Costs/kg 0.9 0.8 0.8 Total Costs/Season 8100.0 8019.0 8148.0 Net Profit/Season 11323.8 14523.3 13362.7 Net Profit/Month 2831.0 3630.8 3340.7 ROCE/Season (%) 139.8% 181.1% 164.0% Source: Survey data (2001). IV.5. Market Integration Analysis
To assess the market efficiency, analysis of correlation coefficient of wholesale prices of citrus in the selected markets of Punjab has been carried out. Initially, an autoregressive process has been used to see the dynamic process of price changes in two spatially separated markets, then, first differences of logarithms of raw price data are undertaken. After that log price data were smoothed and difference smoothed because, this offers an immediate interpretation of the data. In this analysis only one lag has been used, because one lag is sufficient to understand the behaviour of price changes in the markets. Then we look at the coefficients of the autoregressive process to understand how price changes in one market are related to the price changes in another market.
The correlation coefficients of citrus price level (raw and smoothed) and price difference (raw) of selected markets of Punjab under study are presented in (Table 12). The correlation coefficients of price level are quite high, for the inter- and intra-

Citrus Marketing in Punjab 687
Table 12
Correlations Coefficient of Wholesale Prices in Different Markets of Punjab
Markets Sargodha Faisalabad Lahore Multan Level Raw
Sargodha 1.000 Faisalabad 0.975 1.000 Lahore 0.975 0.981 1.000 Multan 0.963 0.974 0.973 1.000
Level Smooth Sargodha 1.000 Faisalabad 0.872 1.000 Lahore 0.898 0.913 1.000 Multan 0.819 0.862 0.843 1.000
Note: Weekly price data used in this analysis (1983 to 2003), collected by the Department of Agricultural Economics and Marketing, Lahore.
market relationship. According to the rating system proposed by Kinnear and Taylor (1987), correlation values of r>0.80 indicate that there is a strong degree of association of price between markets3; if r is <0.80 and >0.05, price relationship between markets is moderate to strong; and if r is below 0.4; the price relationship between markets is week. The correlation coefficients are tested for significance with the help of t-tests. The results of correlation coefficients based on price from citrus producing markets are integrated and prices are completely transmitted from source market to citrus consumption markets.
Alternatively, results for the second measure based on price difference (smooth) indicate that citrus markets are partially integrated and price changes in citrus producing market are not fully and immediately transmitted to citrus consumption markets of the country but correlation coefficients are still greater than 0.8, meaning they are still fully integrated.
(i) Market Integration Tests
The conclusion based on correlation coefficient of price level alone will be misleading therefore, more advanced integration tests have been carried out, which has the ability to explore various aspects of the price movement between the regional markets. As mentioned earlier correlation coefficient analysis itself is not sufficient to conclude that markets are integrated. Further investigation is needed to assess the
3For example, a high and significant correlation coefficient of 0.9 (r = 0.9) indicates that 0.9 percent [why 0.81 when the coefficient is 0.9] of price variation in one market is associated with price variation in another market.
Sharif, Farooq, and Malik 688
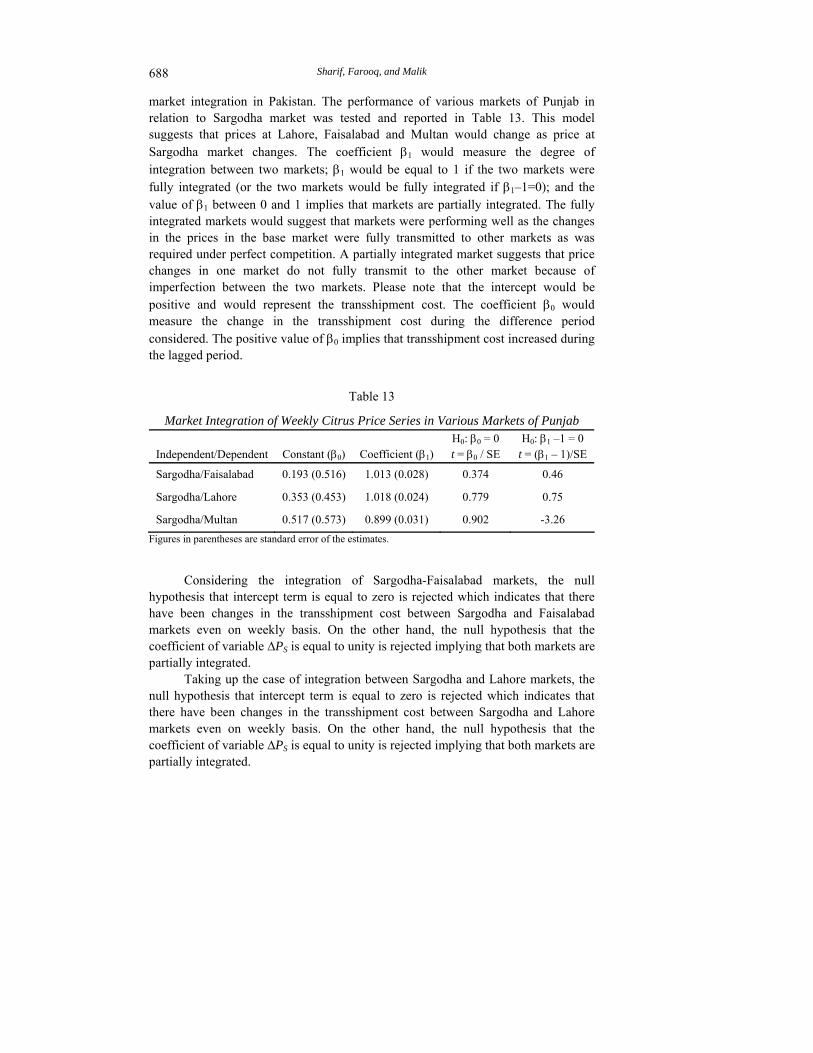
market integration in Pakistan. The performance of various markets of Punjab in relation to Sargodha market was tested and reported in Table 13. This model suggests that prices at Lahore, Faisalabad and Multan would change as price at Sargodha market changes. The coefficient β1 would measure the degree of integration between two markets; β1 would be equal to 1 if the two markets were fully integrated (or the two markets would be fully integrated if β1–1=0); and the value of β1 between 0 and 1 implies that markets are partially integrated. The fully integrated markets would suggest that markets were performing well as the changes in the prices in the base market were fully transmitted to other markets as was required under perfect competition. A partially integrated market suggests that price changes in one market do not fully transmit to the other market because of imperfection between the two markets. Please note that the intercept would be positive and would represent the transshipment cost. The coefficient β0 would measure the change in the transshipment cost during the difference period considered. The positive value of β0 implies that transshipment cost increased during the lagged period.
Table 13
Market Integration of Weekly Citrus Price Series in Various Markets of Punjab
Independent/Dependent Constant (β0) Coefficient (β1) H0: β0 = 0 t = β0 / SE
H0: β1 –1 = 0 t = (β1 – 1)/SE
Sargodha/Faisalabad 0.193 (0.516) 1.013 (0.028) 0.374 0.46
Sargodha/Lahore 0.353 (0.453) 1.018 (0.024) 0.779 0.75
Sargodha/Multan 0.517 (0.573) 0.899 (0.031) 0.902 -3.26 Figures in parentheses are standard error of the estimates.
Considering the integration of Sargodha-Faisalabad markets, the null
hypothesis that intercept term is equal to zero is rejected which indicates that there have been changes in the transshipment cost between Sargodha and Faisalabad markets even on weekly basis. On the other hand, the null hypothesis that the coefficient of variable ∆PS is equal to unity is rejected implying that both markets are partially integrated.
Taking up the case of integration between Sargodha and Lahore markets, the null hypothesis that intercept term is equal to zero is rejected which indicates that there have been changes in the transshipment cost between Sargodha and Lahore markets even on weekly basis. On the other hand, the null hypothesis that the coefficient of variable ∆PS is equal to unity is rejected implying that both markets are partially integrated.

Citrus Marketing in Punjab 689
Regarding the integration of Sargodha-Multan markets, the null hypothesis that intercept term is equal to zero is rejected which indicates that there have been changes in the transshipment cost between Sargodha and Multan markets even on weekly basis. On the other hand, the null hypothesis that the coefficient of variable ∆PS is equal to unity is accepted implying that both markets are fully integrated.
IV.6. Socioeconomic and Technical Constraints to Citrus Marketing
It is observed that most of the contractors have no information about trade situation in various markets. They either relies on the traditional sources like fellow contractors or the prices told to them by the commission agents of various markets on telephone. Such information is always partial and sketchy. In citrus, pricing mechanism depends upon the time, type and location of the market under consideration. The producers have no information about prices in markets other than their local market. For the prices, contractors totally rely on their lending commission agents. During auction, since very little grading4 has been made by the contractor before presenting the output in the market for auction, therefore, the level of auction price received depend upon the proportions of best and worst quality fruit (in terms of freshness, size and appearance) present in the lot. Hence, the lack of finance is one of the major constraints on the part of the producers and contractors.
Secondly, in the marketing chain the deconstruction of marketing margin analysis revealed that retailers are receiving highest gross returns and the returns on capital invested are also highest in comparison with other marketing agents. This is mainly attributed to the grading performed by him before selling to the consumers. His percent profit margin is also considerably increases in the late season because the proportion of good quality mature fruit in the purchased lot increases during late season, although prices are also high during this period.
Thirdly, the supply of citrus (Kinnow) is relatively high in the months of January-February. The cold store facilities are least used in domestic citrus marketing because cold weather is prevailing during these months. The contractors try to obtain higher prices by delayed plucking of fruit while on the other hand, this late plucking affects flowering for the following season. On the other hand, producers are interested in vacating their orchard as soon as possible. This creates clashes of interests between producers and contractors. The lack of cold store facilities also an underlying cause of high post harvest losses at contractor level as incidence of frost and some other disease may result huge financial loss. In the study area, the cold storage facilities for citrus fruits are only available with the citrus processing factories, which use it for chilling purposes before shipping it for export.
4The export quality citrus fruits are usually separated and supplied to Kinnow processing factories in the area, however, no reliable evidence was available on the proportion of such fruit is taken out before shipping to domestic markets.

Sharif, Farooq, and Malik 690
V. CONCLUSIONS AND RECOMMENDATIONS
In citrus, the duration of contract is almost one year. More than 90 percent citrus producers sold harvesting rights of their orchards to contracts. The producer share in consumer rupee was 35 percent, followed by contractor as 32 percent and retailers as 20 percent. The deconstructing marketing margin analysis shows that profit absorbed most of the marketing margin. The estimates on the returns to capital invested (ROCE) came to be 16 percent for contractors, 82 percent for commission agents, 86 percent for wholesalers, and 164 percent for retailers. In this way, retailers received the highest gross return and rate of return was highest than other marketing agents. The highest rate of wastage occurs at the level of contractors. The market integration analysis using the weekly price data for last two decades shows that Sargodha market is relatively better integrated with Faisalabad and Lahore than Multan as the coefficient for price at source market was greater than unity. However, the statistical test of integration revealed that the Lahore and Faisalabad markets are poorly integrated with Sargodha.
(i) Potential for Improvement in Domestic Citrus Marketing
From the analysis of domestic citrus marketing and the problems faced by various market intermediaries, it is clear that the major obstacle in the smooth functioning of domestic marketing process is the lack of practicing grading and standardisation. Due to lack of this grading and standardisation, various intermediaries are getting more than their due margins. The undue share is because of monopoly in the market by commission agent, and small scale of market retailers are operating with him. The improvements in the marketing infrastructure (e.g. roads, availability of transport and cold stores, uniform standardised grades etc.) will make the marketing of citrus more competitive by ensuring due shares of the intermediaries for the services rendered.
The contractors also have some clash of interest. For example, contractors will not invest on land improvement because it will generate benefits in the long run when he might not be there. This signifies the need for educating citrus contractors on management practices, so that no friction should arise in their relations with the orchard owners. This will lead to joint effort in increasing productivity and quality of the output produced. Another underlying reason is the lack of competition among commission agents. The commission agents are sitting in the markets since ages. This is because few new fruits and vegetable markets are opened in the country over the past three decades. These commission agents have their own contractors with whom they perform business by extending informal loan to them for booking the orchard with the producer. In this way, the commission agents can have crude idea about the volume of business that would definitely take place through them.

Citrus Marketing in Punjab 691
(ii) Recommendations
After summarising the findings and discussing the potentials for improvement, it seems appropriate to suggest various recommendations for the overall development of citrus marketing in the country.
• Efforts are required to control post harvest losses through making improvement in packing material during citrus marketing and provision of incentives for establishing cold stores in the area.
• The financial institutions are desired to reformulate the laws and regulations to ease out the loaning process in order to alleviate the financial constraints of producers particularly.
• The Department of Agricultural and Livestock Products Marketing and Grading (DALPMG) is suggested to disseminate the marketing related information to all stakeholders in more effective manner by establishing an MIS.
REFERENCES
Alexander, C., and J. Wyeth (1994) Co-integration and Market Integration: An Application to the Indonesian Rice Market. The Journal of Development Studies 30:2, 303–328.
Ali (2000) Requirements and Conditions for Perishable Products for Domestic and Export Markets: View of a Trader. Quetta: Universal Traders (Importers and Exporters). Balochistan, Pakistan.
Bashir, M., J. Iqbal, and S. M. Khair (2001) Marketing Margins for Tor Kulu Apple Produced in Pishin: A Case Study. Pakistan Journal of Agricultural Economics. Agricultural Prices Commission, Islamabad. 4, 77–88.
Charemza, W. W., and D. F. Deadman (1993) New Directions in Econometric Practices: General to Specific Modelling, Cointegration and Vector Autoregression. University of Lecester.
Khan, Abid M. Sami (1980) Marketing Infrastructure, Margins and Seasonal Price Variation of Selected Agricultural Commodities in Sindh Province of Pakistan. Tandojam: Department of Agricultural Economics and Rural Sociology, Sindh Agriculture University.
Khushk, A. M. (1997) The Mango Production and Marketing System in Sindh Pakistan: Constraints and Opportunities. PhD Thesis, Wye College, University of London, UK, October.
Khushk, A. M. (2001) Marketing of Fruits and Vegetables in Pakistan. In Marketing of Fruits and Vegetables in Asia and the Pacific. Asian Productivity Organisation, Tokyo, Japan. 81–97.
Khushk, A. M., and A. D. Sheikh (2004) Structure, Conduct and Performance of the Marketing System, Margins and Seasonal Price Variation of Selected Fruits and Vegetables in Pakistan. Tandojam: Technology Transfer Institute, Sindh.

Sharif, Farooq, and Malik 692
Khushk, A. M., and L. E. D. Smith (1996) A Preliminary Analysis of the Marketing of Mango in Sindh Province, Pakistan. The Pakistan Development Review 35:3, 241–255.
Khushk, A. M., and M. I. Lashari (1999) Marketing Margins Analysis of Tomato in Sindh. Industrial Times (Section on Agriculture), September-October. 19–22.
Khushk, A. M., and M. Ibrahim Lashari (2002) Improving Marketing System of Cut-flowers in Sindh: A Preliminary Analysis. Sarhad Journal Agriculture 18:1.
Khushk, A. M., J. A. Lund, and M. U. Shar (1998) Guava Marketing System and Margins in Sindh Province of Pakistan. Tandojam: Agricultural Economics Research Unit, Sindh.
Khushk, A. M., M. I. Lashari, and A. Memon (2004) Marketing System of Selected Vegetables in Pakistan. Paper Submitted to Pakistan Journal of Agricultural Social Sciences. (Draft paper).
Khushk, A. M., M. I. Lashari, and M. Aslam (2003) Constraints and Opportunities in Mango Production and Marketing in Sindh. Socioeconomic Research Studies 2002-03. Tandojam: Technology Transfer Institute, Sindh. 1–54.
Kinnear, J., and J. Taylor (1987) Market Research: An Applied Approach. Singapore: McGraw Hill Book Co.
Kohls, R., and J. Uhl (1980) Marketing of Agricultural Products. New York: McMillan Publishing Company.
Lale, U. (1971) Food Grain Marketing in India: Private Performance and Public Policy. Ithaca, New York: Cornell University Press.
Lashari, M. I., A. M. Khushk, and M. A. Ansari (2003) A Preliminary Analysis of the Marketing of Vegetables in Sindh. Indus Journal of Plant Sciences 2:4, October, 367–375.
Lashari, M. I., A. M. Manganhar, S. K. Ali, and M. U. Shar (1995) Marketing of Mango in Sindh. In Ch. M. Manzoor Ali (ed.) Agricultural Economics Research Unit of Pakistan. Tandojam: Agricultural Research Council, ARI, Sindh.
Lashari, M. I., J. A. Lund, A. M. Khushk, and M. A. Memon (2002) Production and Marketing of Onion in Sindh. Socioeconomic Research Studies 2001-02. Tandojam: Technology Transfer Institute, Sindh. 195–218.
Mari, F. M., A. M. Khushk, and K. S. Memon (2002) Socio-economic Aspects of Banana Production and Marketing in Sindh. In K. M. Aujla, W. Malik and M. Sharif (eds.) Socio-Economic Research Studies 2001-02. Tandojam: TTI, ARI, Pakistan Agricultural Research Council.
Memon, M. A., A. M. Khushk, M. Aslam, and M. I. Lashari (2003) Structure, Conduct and Performance of the Marketing System, Margins and Seasonal Price Variation of Date Palm in Sindh. Socioeconomic Research Studies 2002-03. Tandojam: Technology Transfer Institute, Sindh. 97–132.
Memon, R. A. (1978) Marketing Infrastructure, Margins and Seasonal Price Variation of Selected Agricultural Commodities in Sindh Province of Pakistan.

Citrus Marketing in Punjab 693
Tandojam: Department of Agricultural Economics and Rural Sociology, Sindh Agricultural University, Pakistan.
Misztal, B. A. (1996) Trust. Cambridge: Polity Press. 296 pages. Mohy-ud-din, Q. (1989) Marketing of Major Fruits (Citrus and Mango) in Punjab.
Faisalabad: Department of Agricultural Marketing, Faculty of Agricultural Economics and Rural Sociology, University of Agriculture.
Mohy-ud-din, Q. (1991) Improving Marketing System of Citrus Fruit in Punjab Province. Pakistan Agricultural Development Review 1:2, 35–44.
Pakistan, Government of (2004) Agricultural Statistics of Pakistan 2002-03. Islamabad: Government of Pakistan, Ministry of Food, Agriculture and Livestock (Economic Wing).
Qureshi, S. K. (1974) The Performance of Village Markets for Agricultural Produce: A Case Study of Pakistan. The Pakistan Development Review 13:3, 280–307.
Sattar, et al. (1976) Marketing of Agricultural Products in Pakistan. Lahore: Punjab Board of Economic Enquiry, Pakistan.
Sharif, M. (2004) Opportunities and Constraints in the Production, Marketing and Export of Citrus in Punjab. PhD Thesis, Department of Farm Management, Faculty of Agricultural Economics and Rural Sociology, University of Agriculture, Faisalabad, Pakistan.
Sial, M. H., and M. S. Anjum (1990) Returns to Investment in Market Intermediaries in Rawalpindi—Islamabad Market. Pakistan Journal of Agricultural Social Sciences 3&4:1&2, 43–54.
Siddiqui, S. A. (1977) Marketing Infrastructure, Margins and Seasonal Price Variation of Selected Agricultural Commodities in Sindh Province of Pakistan. Tandojam: Department of Agricultural Economics and Rural Sociology, Sindh Agricultural University, Pakistan.
Siddiqui, S. A. (1979) Marketing of Agricultural Products in Sindh. Tandojam: Department of Agricultural Economics and Rural Sociology, Sindh Agricultural University, Pakistan.
Smith, L. E. D., and M. Stockbridge (1997) Report on the Study of the Cotton and Wheat Marketing System and the Provision of Pre Harvest Services in Sindh Province, Pakistan. Department of Agricultural Economics and Business Management, Wye College University of London.
Toaha, M. (1974) Estimation of Marketing Margins and Measurement of Seasonal Variation of Selected Agricultural Commodities in Sindh Province of Pakistan. Tandojam: Sindh Agricultural College, Pakistan.

Comments The study on “Domestic Citrus Marketing System: Constraints and Potential for Improvement” is an effort towards searching ways for increasing net income of farmers and decreasing per unit cost. It synchronizes with the advice of various agricultural experts who, in the light of AoA’s of WTO, have been advocating for the last several years, for becoming efficient in order to compete in the international markets. Citrus is the largest grown fruit Pakistan with annual market value over Rs 10 billion. Thirst of the study is on marketing channels, marketing margins and some socio-economic and technical constraints in marketing of citrus fruit. The study was directed in the citrus growing area of Punjab. Sample size of 125 respondents is large enough to draw logical conclusion. Results of the study indicate that in case citrus, growers are being robed by marketing intermediaries. Farmers share in consumer rupees is only 35 percent. The study has not explicitly mentioned the universe of the study and description of the universe also need elaboration so that readers can better appreciate the results of the study in the backdrop of the universe of the study. The study is silent about the review of literature. In the past several studies have been taken with similar objectives on fruits and vegetables. Their results are more less in the same range. Authors need to clearly pinpoint if there is anything new in their methodology.
The study has given the sample size but sampling procedure and sampling design are missing. Authors may like to add a few more sentences about this.
The study has rightly pointed out that marketing intermediaries are getting the lion’s share from farmer’s earning. The same has been pointed out times gain by various studies over the past four decades but market intermediaries are still lingering on. In fact, they are also playing some use role, e.g. providing of credit facilities, logistic facilities and bearing of risks. If we realy want to displace them we need create viable alternative arrangements.
The title of the study—Marketing System is very broad but the objectives have been narrowed down to a couple of points. Marketing system also covers storage, packing and packages, grading, transporting and marketing intelligence, etc. These have not been touched in the study. Authors may like to refine their title in light of objectives of the study.
On the whole the study has been directed towards a crucial researchable issue. It is rich and comprehensive. Methodology is good, and results are logical and convincing. Authors deserve appreciation.
Muhammad Bashir NWFP Agricultural University, Peshawar.