city momentum index - jll.com.br filehowever, city momentum involves far more than just raw gdp...
TRANSCRIPT
City Momentum Index
Cities Research Centre | Q1 2014
City Momentum Index | First Quarter 2014 | 2
COPYRIGHT © JONES LANG LASALLE IP, INC. 2014. All Rights Reserved
City Momentum Index
A New Perspective on Cities and Real Estate
The combined forces of urbanisation, globalisation and technology are recasting the commercial geography of
real estate – offering new opportunities and challenges in a fast-changing hierarchy of cities.
In this world of rapid transformation, Jones Lang LaSalle has launched this new City Momentum Index (CMI)
which tracks the speed of change of a city’s economic base and its commercial real estate market.
Covering 111 major established and emerging business hubs across the globe, the Index measures a city’s
short-term socio-economic and commercial real estate momentum (over a three-year horizon), and also
combines measures of ‘future-proofing’ – whether a city has the essential ingredients (the ‘high-value
incubators’) to ensure longer-term sustainable momentum in the smart, digitally-enabled knowledge economy.
However, city momentum involves far more than just raw GDP growth – it is also about speed of adaptation,
the speed of innovation and the creation of cutting-edge new businesses. And it further entails capturing the
dynamics of a city’s real estate market – rates of construction and absorption, price movement and the
attraction of a city’s built environment for cross-border capital and corporations.
City rankings and indices are an increasingly common method of benchmarking cities – at the last count there
were more than 150 city indices1. But rankings can often be a blunt instrument for understanding a city’s
potential, and most indices provide only a static picture of city competitiveness. Our new City Momentum
Index, we believe, offers a fresh perspective by looking beyond the static rankings and delving into underlying
city dynamics, adaptability and real estate market characteristics.
In this paper, we identify and review those cities that appear at the top of the City Momentum Index, and
extract a watch list of characteristics of ‘cities in ascendancy’. We also explore some of the cities that haven’t
quite ‘made the cut’, that have lower rates of momentum, but which have the foundations for long-term
success.
In producing this Index, our intention is to alert the market to signals of change and to highlight the
characteristics of city success. It does not necessarily hold that those cities at the top of the CMI will show the
strongest future performance of commercial real estate, or the most immediately attractive real estate
investment environments, but rather that they are the cities where change is occurring fastest and are the
ones to be closely monitored. Strong momentum can pose both opportunity and risk.
We plan to update the CMI on an annual basis, forming part of a broader cities toolkit that Jones Lang
LaSalle’s Cities Research Centre is developing to provide new insights into city competitiveness and the role
of real estate.
1 The Business of Cities, 2013
City Momentum Index | First Quarter 2014 | 3
COPYRIGHT © JONES LANG LASALLE IP, INC. 2014. All Rights Reserved
Why a City Momentum Index?
In over a decade of analysing cities and what makes them competitive, we have documented many different
perspectives and observed many diverse models of city performance. Until recently the main investor focus has been on
only 30 cities and that of corporates on 300. These two city universes, the 30 and the 300, have met the different
objectives of the investor and the corporate, but signs of a stronger and common link creating mutual interest in a new
set of cities are becoming evident, it is that of ‘momentum’.
As the world’s hierarchy of cities continues to reorder, it is in activity and, increasingly, in change that we find a growing
coincidence of interests between those creating businesses and those investing in the real estate that houses them.
Unquestionably there are many very successful and established cities where the existing depth of economies continues
to underpin performance, but what is emerging are sets of cities that are transforming with new energies brought about
through urbanisation, modernisation and globalisation, and it is the speed and direction of development of such cities
that is opening up opportunities with greater synchronicity for corporates, investors and developers.
The City Momentum Index has been designed to capture evolution, to measure change and to identify which specific
attributes will bring new visibility to some cities and reinforce the dynamism of others. The Index is not a measure of pure
economic growth and performance, and therefore some powerful and successful cities such as Paris, Moscow, Seoul
and Chicago do not appear in the Top 20, while rapidly-changing cities such as Shenzhen, Lima and Dubai do.
The City Momentum Index begins to build bridges for the real estate market between those top real estate investment
destinations that have an ease of attraction due to their many traditional strengths, and those cities with vision, hard
work and energy that have the potential to ascend to new heights.
City Momentum Index | First Quarter 2014 | 4
COPYRIGHT © JONES LANG LASALLE IP, INC. 2014. All Rights Reserved
Cities in Ascendancy
The cities that sit at the top of this first issue of the City Momentum Index (CMI) reveal a telling mix of legacy cities,
transitional cities that are fast-tracking to maturity, and a number of high-growth emerging cities:
1. The Rise and Rise of Elite Cities
Most strikingly, the CMI Top 20 includes many of the most internationalised elite cities that are well established on the
world stage, namely:
The heavyweight super cities of London, New York and Tokyo
The major global gateways and trading hubs like Hong Kong, Singapore and Dubai
And cities with soft global power and influence, such as San Francisco and Los Angeles.
The strong showing of these leading global cities underlines their rising power and influence; they are wielding ever
greater economic might and are the clear beneficiaries of globalisation. Such cities are magnets for top talent from the
world’s highly mobile creative classes; they have the largest concentrations of high net worth individuals and, as a group,
attract significant levels of foreign direct investment. They are also dominant in terms of high-value business and
financial services. Their weight and influence is even more apparent within the real estate sector – these eight cities
alone account for one-quarter of the world’s direct commercial real estate investment activity (2012-2013), as well as
significant foreign investment in residential property.
2. Technology and Urbanisation
Technology-rich cities are also well represented in the CMI Top 20, particularly those in the U.S. that took early
advantage of technology trends, namely San Francisco, San Jose, Austin, Boston and Seattle:
The tech-heavy San Francisco Bay Area is the undoubted winner of our first City Momentum Index, with San
Francisco (1st) and San Jose (9th) providing a unique and unrivalled reputation for innovation, venture capital and
start-ups. Indicative of the metro area’s current dynamism, San Francisco is expected to show the strongest rate of
office rental growth in North America during 2014.
3. Smaller Cities achieving a Global Position
While globalisation and technology are helping the world’s elite cities to acquire greater power and influence, it is also
enabling some smaller cities to gain rapid momentum and achieve a global position by developing environments
conducive to innovative and creative activity:
Austin, Texas (7th), the smallest city in the CMI Top 20, is one of the most successful small- to mid-sized cities
among the advanced nations. Its young and highly-skilled population, favourable business environment and low
costs are supporting strong city momentum, particularly in Austin’s high-tech sectors. A reputation for cultural
vibrancy is also helping the city to retain and attract new talent.
COPYRIGHT © JONES LANG LASALLE IP, INC. 2014. All Rights Reserved
City Momentum Index | First Quarter 2014 | 5
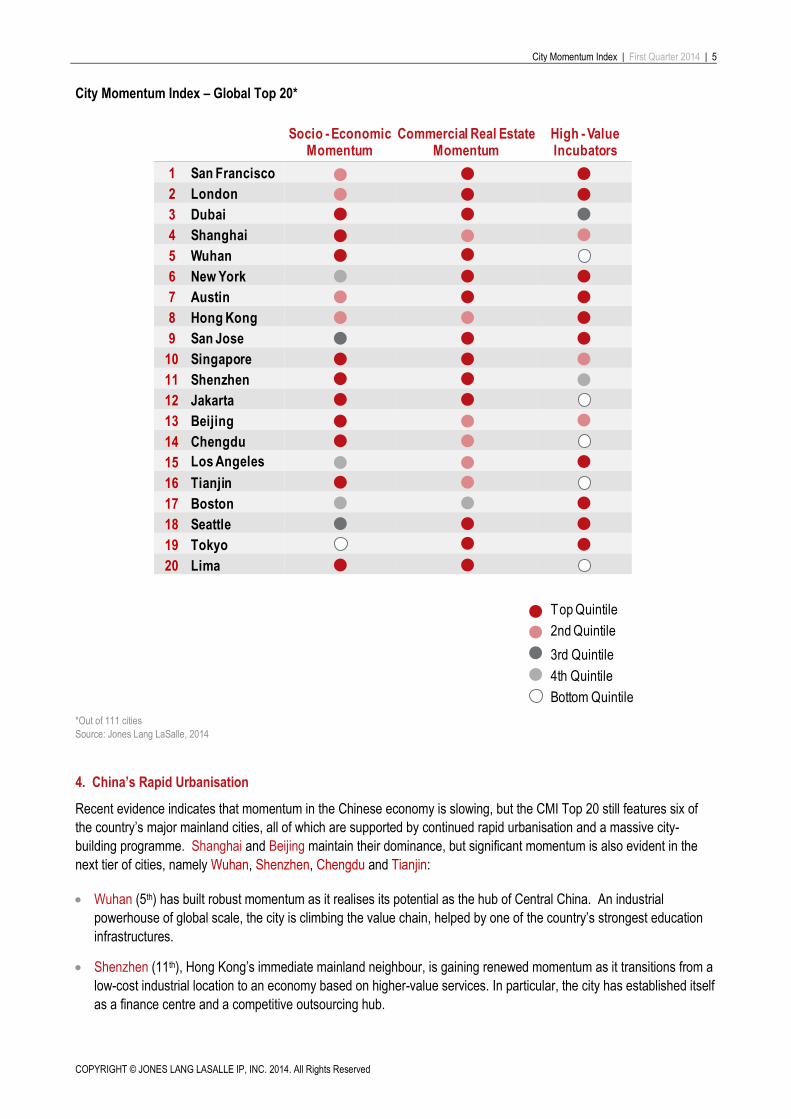
City Momentum Index – Global Top 20*
*Out of 111 cities
Source: Jones Lang LaSalle, 2014
4. China’s Rapid Urbanisation
Recent evidence indicates that momentum in the Chinese economy is slowing, but the CMI Top 20 still features six of
the country’s major mainland cities, all of which are supported by continued rapid urbanisation and a massive city-
building programme. Shanghai and Beijing maintain their dominance, but significant momentum is also evident in the
next tier of cities, namely Wuhan, Shenzhen, Chengdu and Tianjin:
Wuhan (5th) has built robust momentum as it realises its potential as the hub of Central China. An industrial
powerhouse of global scale, the city is climbing the value chain, helped by one of the country’s strongest education
infrastructures.
Shenzhen (11th), Hong Kong’s immediate mainland neighbour, is gaining renewed momentum as it transitions from a
low-cost industrial location to an economy based on higher-value services. In particular, the city has established itself
as a finance centre and a competitive outsourcing hub.
Top Quintile
2nd Quintile
3rd Quintile
4th Quintile
Bottom Quintile
Socio - Economic Momentum
Commercial Real Estate Momentum
High - Value Incubators
1 San Francisco
2 London
3 Dubai
4 Shanghai
5 Wuhan
6 New York
7 Austin
8 Hong Kong
9 San Jose
10 Singapore
11 Shenzhen
12 Jakarta
13 Beijing
14 Chengdu
15 Los Angeles
16 Tianjin
17 Boston
18 Seattle
19 Tokyo
20 Lima
City Momentum Index | First Quarter 2014 | 6
COPYRIGHT © JONES LANG LASALLE IP, INC. 2014. All Rights Reserved
5. Beyond the BRICS - The Growth Hotspots
Significantly, other than the Chinese cities, there are no BRICS cities in the CMI Top 20. Some of the world’s strongest
momentum over the short term is found beyond the BRICS, as the enlargement of the urban consumer classes spreads
across other sizeable growth markets. The CMI highlights two high-growth cities in the Top 20:
Jakarta’s (12th) role as the gateway and service hub to the world’s fourth most populous nation is helping to drive
strong economic and real estate momentum. Robust demand from international corporations seeking to tap into
Indonesia’s growth opportunities has resulted in the city recording the world’s fastest rate of office rental uplift in
2013, and in 2014 it is likely to again be among the best performers.
Lima (20th) is the standout city in Latin America. The retail and office real estate markets of Peru’s capital have
moved to ‘lift-off’, buoyed by significant economic growth and pro-business policies. Commercial real estate
construction and absorption are running at record levels – the city’s office stock, for example, is forecast to expand
by nearly 40% over the next two years.
Even so, Jakarta and Lima epitomise the massive challenges of high-growth cities that have to balance rapid economic
momentum with increasing congestion, pollution, income inequality and urban sprawl. Tellingly, both cities are now
being run by populist city-leaders whose focus is on tackling corruption and poverty, and building sustainable
communities.
6. The Resurgent Cities gearing up for 2020
Two major cities that have, in recent years, struggled to build economic and real estate momentum, Tokyo and Dubai,
make an appearance in the CMI Top 20 that would have been surprising only 12 months ago. Both cities are showing
signs of renewed vigour and are gearing up for major events in 2020:
Tokyo (19th) had, until recently, been losing ground to its more dynamic regional competitors – Shanghai, Hong Kong
and Singapore. Nonetheless, Tokyo’s relatively strong showing in the CMI is testimony to its newfound energy,
aided by ‘Abenomics’ economic policies and boosted by securing the 2020 Olympics. The city’s office market is
expected to record one of the fastest rates of value growth in 2014, putting it back on track to once again compete
with London and New York as the world’s most active commercial real estate investment market.
Dubai (3rd) is bouncing back following a deep slump in its economy and real estate market since the Global Financial
Crisis. Property prices are rising, but growth appears to be on a sounder footing than in the pre-crash years of 2006-
2008, underpinned by the city’s strong global connectivity and its status as the service hub for the MENASCA2
region, as well as its position as a preferred staging point for an increasingly dynamic Sub-Saharan Africa.
Furthermore, winning the bid to host Expo 2020 has given the city renewed confidence and momentum.
2 MENASCA – Middle East, North Africa, South and Central Asia
COPYRIGHT © JONES LANG LASALLE IP, INC. 2014. All Rights Reserved
City Momentum Index | First Quarter 2014 | 7
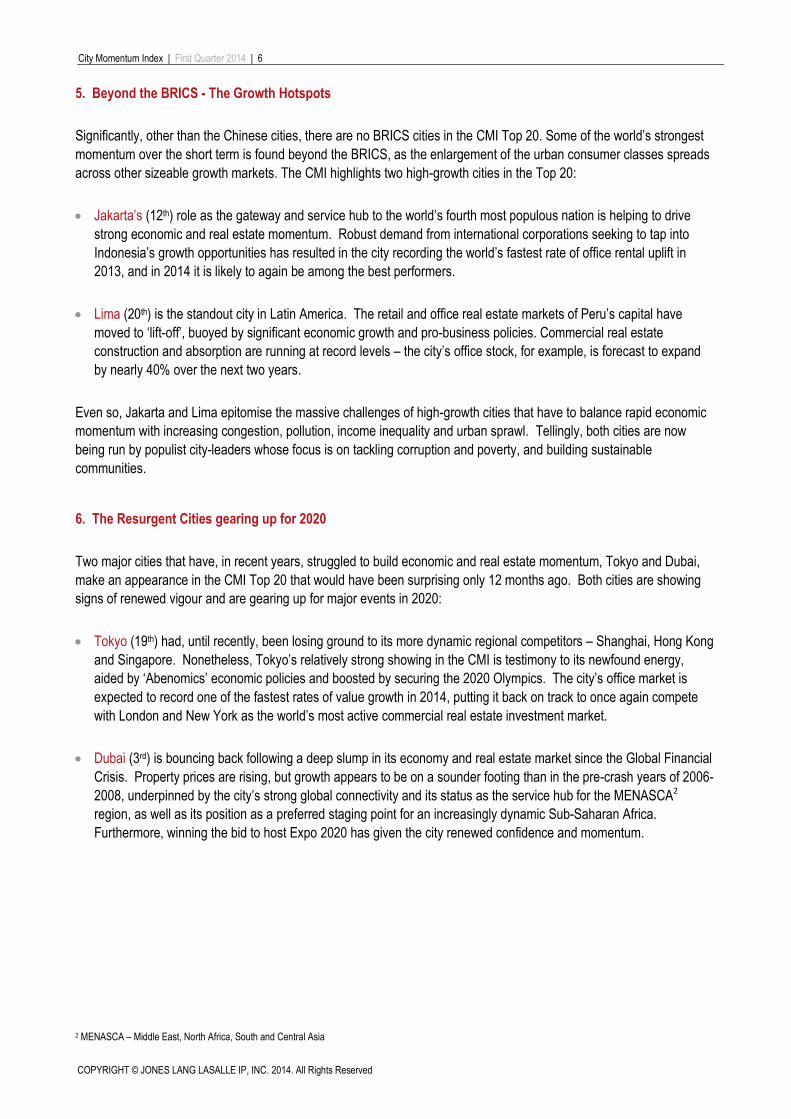
The CMI Global Top 20
Source: Jones Lang LaSalle, 2014
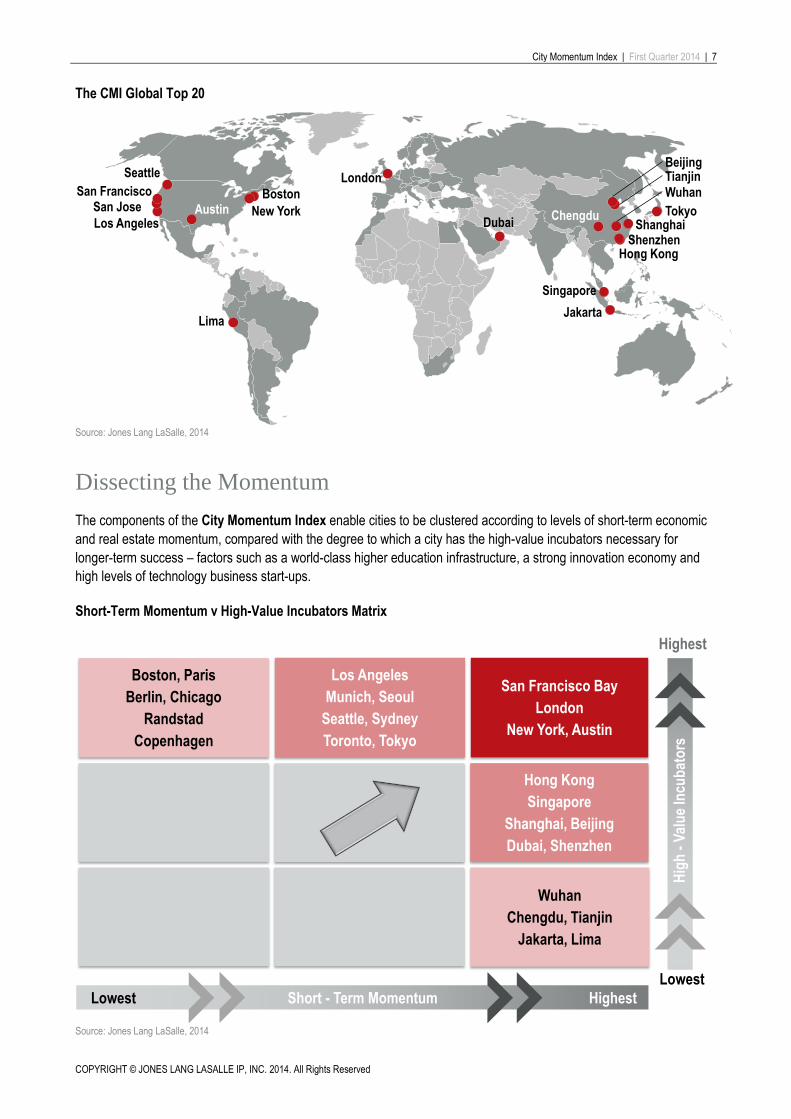
Dissecting the Momentum
The components of the City Momentum Index enable cities to be clustered according to levels of short-term economic
and real estate momentum, compared with the degree to which a city has the high-value incubators necessary for
longer-term success – factors such as a world-class higher education infrastructure, a strong innovation economy and
high levels of technology business start-ups.
Short-Term Momentum v High-Value Incubators Matrix
Source: Jones Lang LaSalle, 2014
Lima
San JoseBoston
Jakarta
Singapore
TokyoDubai
New YorkAustin
Seattle
San Francisco
Los Angeles
London
ShanghaiShenzhen
Hong Kong
Chengdu
Wuhan
BeijingTianjin
Wuhan
Chengdu, Tianjin
Jakarta, Lima
Hong Kong
Singapore
Shanghai, Beijing
Dubai, Shenzhen
San Francisco Bay
London
New York, Austin
Hig
h -
Val
ue
Incu
bat
ors
Highest
Lowest
Short - Term MomentumLowest Highest
Los Angeles
Munich, Seoul
Seattle, Sydney
Toronto, Tokyo
Boston, Paris
Berlin, Chicago
Randstad
Copenhagen
City Momentum Index | First Quarter 2014 | 8
COPYRIGHT © JONES LANG LASALLE IP, INC. 2014. All Rights Reserved
The ‘All-Rounders’
The CMI Matrix reveals that a remarkably limited number of cities meld both strong short-term momentum with a deep
innovation economy. Four metro areas fall into this select group – the San Francisco Bay Area (highlighted earlier),
London, New York and Austin:
London (2nd) is extending its position as Europe’s most dynamic major city, and continues to ride a wave of optimism
since the 2012 Olympics. The city’s momentum is being helped further by its growing status as a centre for
technology and innovation. A testimony to its broader attraction, London is still witnessing high levels of property
investment from overseas, and stands head and shoulders above any other global city in terms of cross-border real
estate investment (at US$64 billion over the past three years).
New York (6th) is North America’s most international hub for commerce, talent and investment by a significant margin.
The city is not only dominant in terms of scale, but also has a powerful technology sector and an unrivalled
international cultural offer.
Adaptability is critical
Our analysis also draws attention to several high-energy cities, such as Wuhan, Jakarta and Lima, which are riding the
wave of robust short-term economic and real estate momentum. Raw demographic and economic energy will continue
to propel these cities forward, but to ensure longer-term success they will need to adapt to the new economy in terms of
innovation and infrastructure. Cities further along this journey, like Dubai and Shenzhen, are already reaping the benefits
of a concerted effort to move up the value chain and improve global connectivity.
Cities to Watch
Where are Europe’s Cities?
Notable by their absence from the CMI Top 20, Continental European cities are going through a challenging period, but,
nonetheless, many have positive qualities relating to stability, education, innovation, culture, sustainability and
transparency that put some cities in good stead. This is demonstrated by the continued high capital inflows into
commercial real estate in Europe’s key cities. Economic restructuring will result in even greater divergence between the
city winners and losers – and the CMI Matrix identifies four European metropolitan areas that have recently
underperformed, but which possess the attributes conducive to longer-term success:
Paris has been negatively affected by the Eurozone weakness, which has resulted in a relatively poor showing on the
CMI. Nonetheless, the city has world-class intellectual, research and technological strengths; and the ambitious
‘Grand Paris’ project is likely to be transformational.
Berlin has, for a number of years, lagged other more successful German cities, such as Munich. While GDP growth
forecasts show a city struggling to gain momentum, there are on-the-ground signs of increasing momentum as the
city reaps the economic benefits from its ability to attract new talent and high-tech entrepreneurs. The German
capital’s ‘Silicon Allee’ is one of Europe’s fastest-growing urban-tech hubs.
Amsterdam has high concentrations of tech start-ups; it is extremely well connected and has a strong focus on
environmental sustainability through state-of-the-art technologies. The city is the economic hub of the ‘Randstad’
conurbation of seven million people – and greater co-operation between its main constituent cities (comprising
Amsterdam, Rotterdam, The Hague and Utrecht) could give the region the scalability to enhance its global reach.
COPYRIGHT © JONES LANG LASALLE IP, INC. 2014. All Rights Reserved
City Momentum Index | First Quarter 2014 | 9
Copenhagen, touted in many indices as one of the world’s greenest cities, has become increasingly integrated with
neighbouring Malmo in Sweden to form the pan-national Oresund region. World-class clusters of biotechnology
(‘Medicon Valley’) and clean technology firms are providing a solid base for the city’s future growth.
A U.S. City to Watch
U.S. cities, in general, are strongly represented in the CMI Top 20 and we have already highlighted several city
successes. Boston has just made it into the Top 20, and as the world’s top education hub and with a proven ability to
leverage talent for commercial innovation, it is a magnet for major international technology companies. The city has a
strong and diverse economy and is addressing key points around affordability and inclusion.
The Missing Commodity Cities?
Brisbane, Perth and Calgary have, of late, been among the most dynamic cities in the advanced world, underpinned by
their hinterlands’ resource assets and high commodity prices. However, these Australian and Canadian cities have lost
some economic momentum, and weaker real estate markets have pushed them down the City Momentum Index.
Significantly, the main commercial hubs of these two countries – Sydney, which is leading the world in sustainable real
estate development, and Toronto, which is building a global position in technology – are likely to show stronger short-
term momentum than their second-tier resource-led cities.
Asia’s Smart City
Seoul has historically punched below its economic weight in terms of global influence and commercial real estate
activity, and has in recent years been overshadowed by its more dynamic Chinese neighbours – Shanghai, Beijing and
Hong Kong. However, the city’s impressive technological capability, its smart urban development (such as Digital Media
City) and superior environmental credentials put it in a strong position to build long-term momentum as one of Asia’s elite
cities.
City Momentum Index | First Quarter 2014 | 10
COPYRIGHT © JONES LANG LASALLE IP, INC. 2014. All Rights Reserved
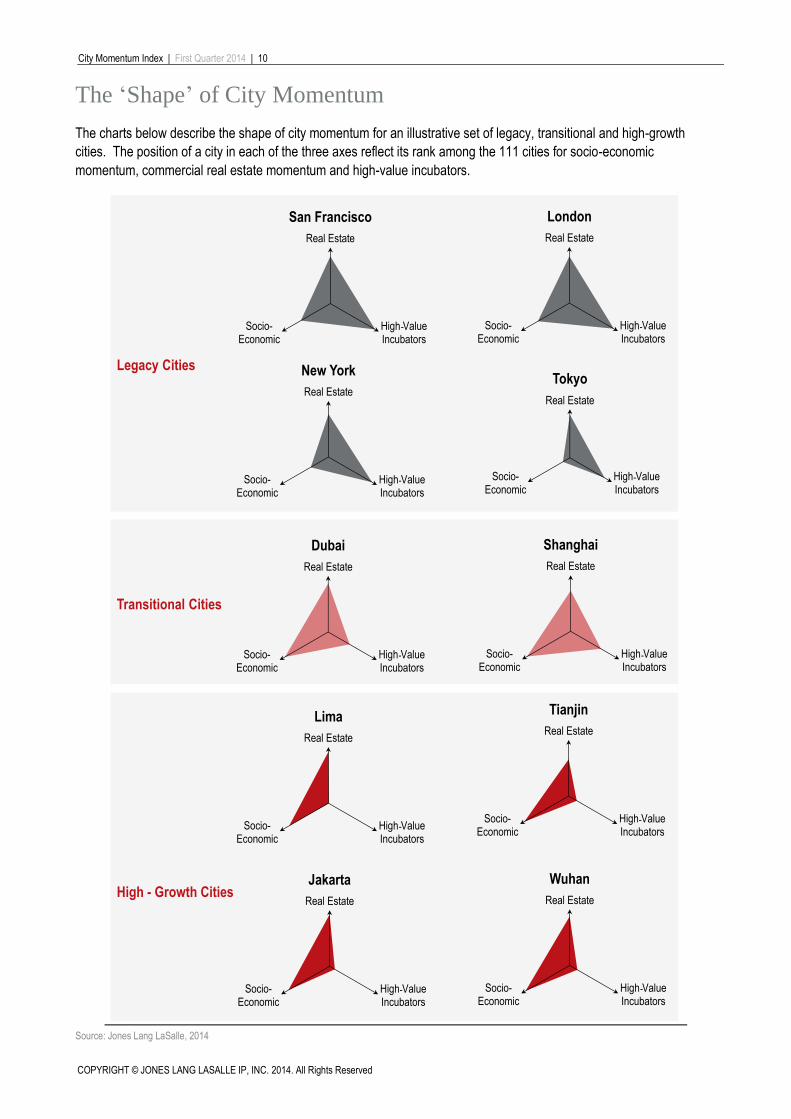
The ‘Shape’ of City Momentum
The charts below describe the shape of city momentum for an illustrative set of legacy, transitional and high-growth
cities. The position of a city in each of the three axes reflect its rank among the 111 cities for socio-economic
momentum, commercial real estate momentum and high-value incubators.
Source: Jones Lang LaSalle, 2014
Legacy Cities
Transitional Cities
High - Growth Cities
Real Estate
High ValueIncubators
Socio-Economic
San Francisco
Real Estate
High ValueIncubators
Socio-Economic
London
Real Estate
High ValueIncubators
Socio-Economic
Dubai
Real Estate
High ValueIncubators
Socio-Economic
New York
Real Estate
High ValueIncubators
Socio-Economic
Shanghai
Real Estate
High ValueIncubators
Socio-Economic
Jakarta
Real Estate
High ValueIncubators
Socio-Economic
Tianjin
Real Estate
High ValueIncubators
Socio-Economic
Tokyo
Real Estate
High ValueIncubators
Socio-Economic
Wuhan
Real Estate
High ValueIncubators
Socio-Economic
Lima
-
- -
-
--
--
--
COPYRIGHT © JONES LANG LASALLE IP, INC. 2014. All Rights Reserved
City Momentum Index | First Quarter 2014 | 11
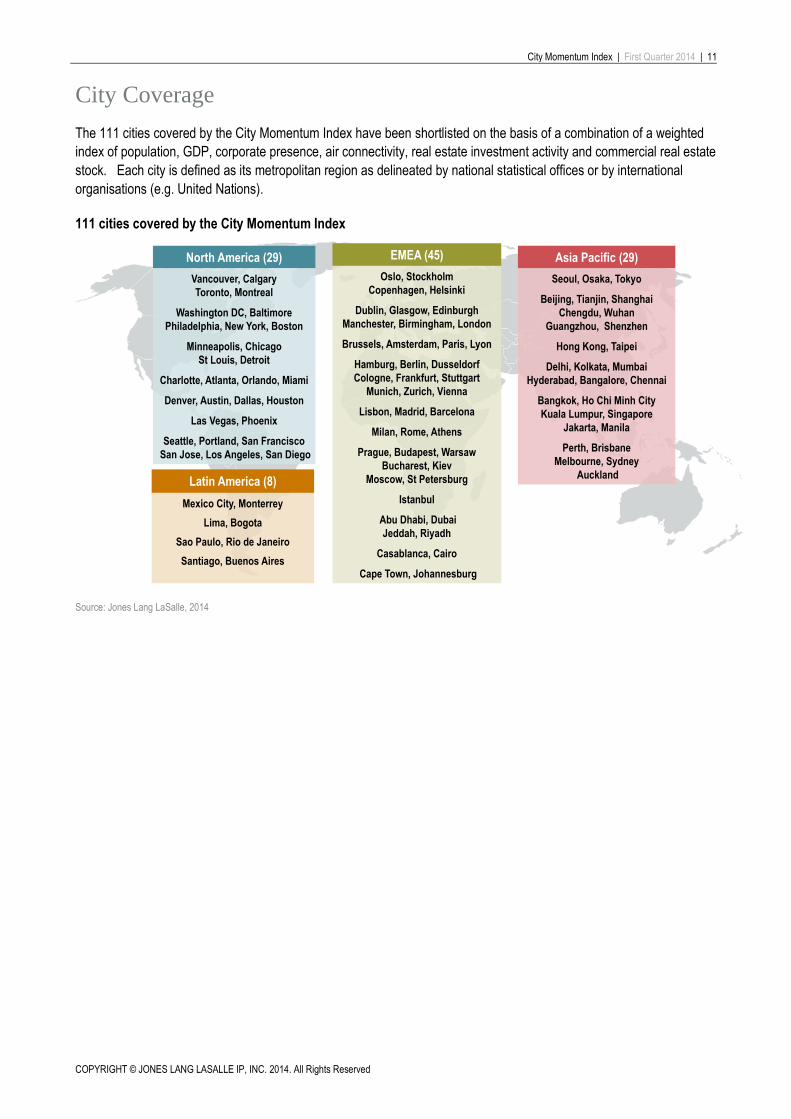
City Coverage
The 111 cities covered by the City Momentum Index have been shortlisted on the basis of a combination of a weighted
index of population, GDP, corporate presence, air connectivity, real estate investment activity and commercial real estate
stock. Each city is defined as its metropolitan region as delineated by national statistical offices or by international
organisations (e.g. United Nations).
111 cities covered by the City Momentum Index
Source: Jones Lang LaSalle, 2014
Asia Pacific (29)
Seoul, Osaka, Tokyo
Beijing, Tianjin, Shanghai
Chengdu, Wuhan
Guangzhou, Shenzhen
Hong Kong, Taipei
Delhi, Kolkata, Mumbai
Hyderabad, Bangalore, Chennai
Bangkok, Ho Chi Minh City
Kuala Lumpur, Singapore
Jakarta, Manila
Perth, Brisbane
Melbourne, Sydney
Auckland
EMEA (45)
Oslo, Stockholm
Copenhagen, Helsinki
Dublin, Glasgow, Edinburgh
Manchester, Birmingham, London
Brussels, Amsterdam, Paris, Lyon
Hamburg, Berlin, Dusseldorf
Cologne, Frankfurt, Stuttgart
Munich, Zurich, Vienna
Lisbon, Madrid, Barcelona
Milan, Rome, Athens
Prague, Budapest, Warsaw
Bucharest, Kiev
Moscow, St Petersburg
Istanbul
Abu Dhabi, Dubai
Jeddah, Riyadh
Casablanca, Cairo
Cape Town, Johannesburg
Latin America (8)
Mexico City, Monterrey
Lima, Bogota
Sao Paulo, Rio de Janeiro
Santiago, Buenos Aires
North America (29)
Vancouver, Calgary
Toronto, Montreal
Washington DC, Baltimore
Philadelphia, New York, Boston
Minneapolis, Chicago
St Louis, Detroit
Charlotte, Atlanta, Orlando, Miami
Denver, Austin, Dallas, Houston
Las Vegas, Phoenix
Seattle, Portland, San Francisco
San Jose, Los Angeles, San Diego
City Momentum Index | First Quarter 2014 | 12
COPYRIGHT © JONES LANG LASALLE IP, INC. 2014. All Rights Reserved
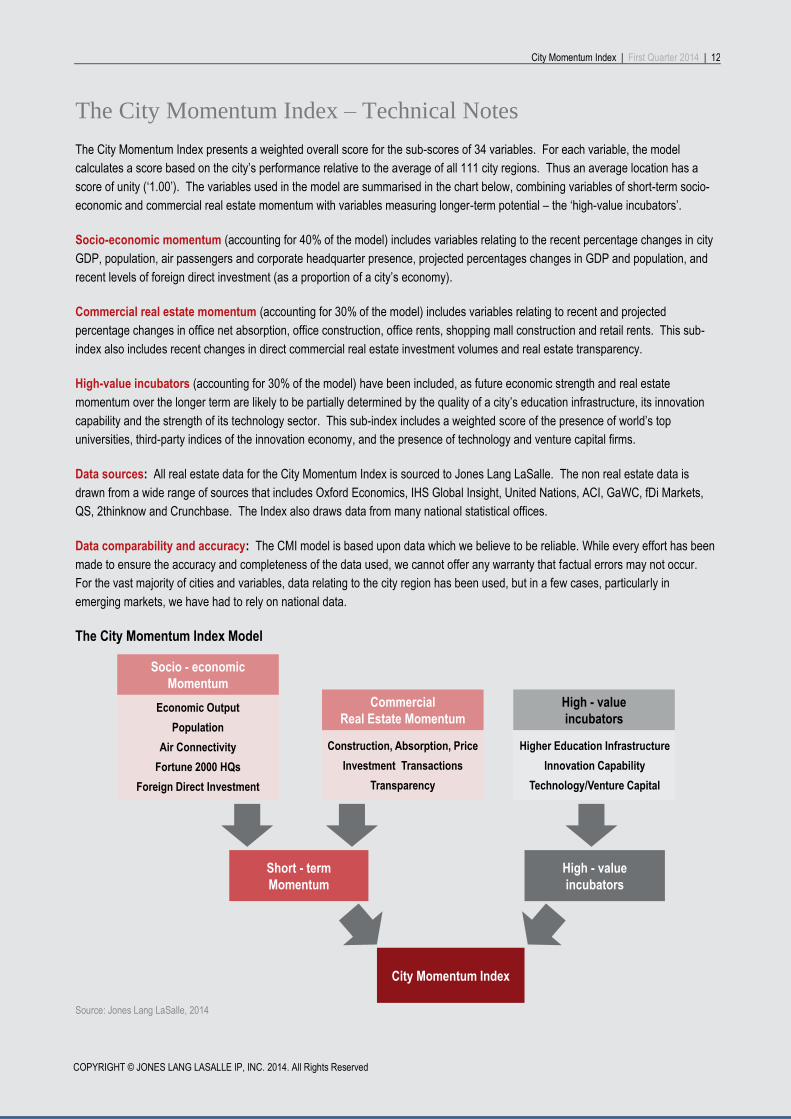
The City Momentum Index – Technical Notes
The City Momentum Index presents a weighted overall score for the sub-scores of 34 variables. For each variable, the model
calculates a score based on the city’s performance relative to the average of all 111 city regions. Thus an average location has a
score of unity (‘1.00’). The variables used in the model are summarised in the chart below, combining variables of short-term socio-
economic and commercial real estate momentum with variables measuring longer-term potential – the ‘high-value incubators’.
Socio-economic momentum (accounting for 40% of the model) includes variables relating to the recent percentage changes in city
GDP, population, air passengers and corporate headquarter presence, projected percentages changes in GDP and population, and
recent levels of foreign direct investment (as a proportion of a city’s economy).
Commercial real estate momentum (accounting for 30% of the model) includes variables relating to recent and projected
percentage changes in office net absorption, office construction, office rents, shopping mall construction and retail rents. This sub-
index also includes recent changes in direct commercial real estate investment volumes and real estate transparency.
High-value incubators (accounting for 30% of the model) have been included, as future economic strength and real estate
momentum over the longer term are likely to be partially determined by the quality of a city’s education infrastructure, its innovation
capability and the strength of its technology sector. This sub-index includes a weighted score of the presence of world’s top
universities, third-party indices of the innovation economy, and the presence of technology and venture capital firms.
Data sources: All real estate data for the City Momentum Index is sourced to Jones Lang LaSalle. The non real estate data is
drawn from a wide range of sources that includes Oxford Economics, IHS Global Insight, United Nations, ACI, GaWC, fDi Markets,
QS, 2thinknow and Crunchbase. The Index also draws data from many national statistical offices.
Data comparability and accuracy: The CMI model is based upon data which we believe to be reliable. While every effort has been
made to ensure the accuracy and completeness of the data used, we cannot offer any warranty that factual errors may not occur.
For the vast majority of cities and variables, data relating to the city region has been used, but in a few cases, particularly in
emerging markets, we have had to rely on national data.
The City Momentum Index Model
Source: Jones Lang LaSalle, 2014
Socio - economic
Momentum
Economic Output
Population
Air Connectivity
Fortune 2000 HQs
Foreign Direct Investment
City Momentum Index
Short - term
Momentum
High - value
incubators
Commercial
Real Estate Momentum
High - value
incubators
Construction, Absorption, Price
Investment Transactions
Transparency
Higher Education Infrastructure
Innovation Capability
Technology/Venture Capital
City Momentum Index | First Quarter 2014 | 13
Jones Lang LaSalle Regional Headquarters
Chicago London Singapore
200 East Randolph Drive
Chicago IL 60601
USA
tel +1 312 782 5800
22 Hanover Square
London W1S 1JA
United Kingdom
tel +44 20 7493 6040
9 Raffles Place
#39-00 Republic Plaza
Singapore 048619
tel +65 6220 3888
Author Contributing Authors
Jeremy Kelly
Ben Breslau
Andrew Burrell
Rosemary Feenan
Josh Gelormini
David Green-Morgan
Myles Huang
Oliver Kummerfeldt
Jane Murray
Craig Plumb
David Rees
Torsten Steiner
For further information, please contact Global Research: [email protected]
COPYRIGHT © JONES LANG LASALLE IP, INC. 2014.
This report has been prepared solely for information purposes and does not necessarily purport to be a complete analysis of the topics discussed, which are inherently unpredictable. It has been based on sources we believe to be reliable, but we have not independently verified those sources and we do not guarantee that the information in the report is accurate or complete. Any views expressed in the report reflect our judgment at this date and are subject to change without notice. Statements that are forward-looking involve known and unknown risks and uncertainties that may cause future realities to be materially different from those implied by such forward-looking statements. Advice we give to clients in particular situations may differ from
the views expressed in this report. No investment or other business decisions should be made based solely on the views expressed in this report