city of ann arbor stormwater model calibration and ... · city of ann arbor stormwater model...
TRANSCRIPT

City of Ann Arbor
Stormwater Model Calibration and Analysis
Project
Final Report
June 1, 2015

Stormwater Model Calibration and Analysis
Contents 1. Executive Summary ............................................................................................................................... 1
A. Purpose: ............................................................................................................................................ 1
B. Model Configuration: ........................................................................................................................ 1
C. Major Project Outcomes: .................................................................................................................. 2
2. Project Structure ................................................................................................................................... 4
A. Task 1 – Phase I Public Engagement ................................................................................................. 4
B. Task 2 – Preliminary Model Calibration and Validation .................................................................... 5
C. Task 3 – Data Collection .................................................................................................................... 6
D. Task 4 – Final Model Calibration and Validation............................................................................. 12
E. Task 5 – Phase I Documentation ..................................................................................................... 13
F. Task 6 – Procedures ........................................................................................................................ 14
G. Task 7 – Training ............................................................................................................................. 14
H. Task 8 – Phase II Public Engagement .............................................................................................. 14
I. Task 9 – Model Analysis and Recommendations ............................................................................ 14
J. Task 10 – Verify FEMA Mapping ..................................................................................................... 15
K. Task 11 – Documentation ............................................................................................................... 15
3. Stormwater Modeling ......................................................................................................................... 16
A. Model background and calibration ................................................................................................. 16
i. Storm Events for Calibration ....................................................................................................... 16
ii. Calibration Methods ................................................................................................................... 17
iii. Calibrated Model Parameters ..................................................................................................... 17
iv. Calibration Results ...................................................................................................................... 20
B. Model Validation ............................................................................................................................. 24
i. Validation Events ........................................................................................................................ 24
ii. Validation Results........................................................................................................................ 24
C. Existing conditions modeling .......................................................................................................... 26
4. Stormwater System Improvements .................................................................................................... 29
A. Study Area Selection ....................................................................................................................... 29
B. Improvements modeling ................................................................................................................. 31

Stormwater Model Calibration and Analysis
C. Site descriptions and recommendations ........................................................................................ 32
i. Lower Allen Creek ....................................................................................................................... 33
ii. Edgewood/Snyder ....................................................................................................................... 37
iii. Park Place Apartments ................................................................................................................ 40
iv. Churchill Downs .......................................................................................................................... 42
v. East University/South University ................................................................................................ 50
vi. Mulholland Avenue ..................................................................................................................... 55
vii. Scio Church / S. Seventh Street ............................................................................................... 58
viii. Glendale/Charlton ................................................................................................................... 62
ix. Glen Leven................................................................................................................................... 65
x. Church Street / Cambridge Road ................................................................................................ 66
xi. Village Oaks / Chaucer Court ...................................................................................................... 67
xii. Parkwood/Pittsfield Village ..................................................................................................... 68
xiii. Signature Drive ........................................................................................................................ 71
xiv. South Industrial/Packard Road Area ....................................................................................... 72
xv. Traver/Barton .......................................................................................................................... 75
xvi. Glendale Circle at Virginia Park ............................................................................................... 77
xvii. Westgate and Maple Village Redevelopment ........................................................................ 81
xviii. Plymouth and Green Road Redevelopment ........................................................................... 83
D. Stormwater Improvement Conclusions .......................................................................................... 83
5. Stormwater Management Scenarios .................................................................................................. 85
A. Citywide Stormwater Management Scenarios ............................................................................... 85
B. Future Conditions............................................................................................................................ 89
6. FEMA Floodplain Comparison ............................................................................................................. 91
7. Project Conclusions ............................................................................................................................. 95
Appendices
Appendix A - Existing Conditions System Capacity Analysis
Appendix B - Future Conditions Stormwater Management Analysis
Appendix C - Floodplain Comparison Maps

Stormwater Model Calibration and Analysis
Figures
Figure 1-1 – Stormwater System Components ............................................................................................. 2
Figure 2-1 – 2013 Flow Monitor Locations and Tributary Areas .................................................................. 6
Figure 2-2 – Conceptual Description of Manning’s Equation ....................................................................... 8
Figure 2-3 – Rain Gauges for Final Model Calibration .................................................................................. 9
Figure 2-4 – Large Event Data Gathering Sites ........................................................................................... 10
Figure 2-5 – Model Overland Flow Channels and 2D Surface Locations .................................................... 13
Figure 3-1 – Hydrologic Soil Groups (HSG) for stormwater model areas ................................................... 18
Figure 3-2a-d – Flow Hydrographs for Major Monitors for 6/27/13 Event ................................................ 23
Figure 3-3a-d – Flow Hydrographs for Major Monitors for 8/12/13 Event ................................................ 23
Figure 3-4a-d – Flow Hydrographs for Major Monitors for 6/13/13 Event ................................................ 24
Figure 3-5 – Design Storm Events ............................................................................................................... 26
Figure 3-6 – Cumulative Rainfall Distributions ........................................................................................... 27
Figure 3-7 – Example HGL Condition Map .................................................................................................. 28
Figure 4-1 – Allen Creek Stormwater System Overview ............................................................................. 34
Figure 4-2 – Stormwater Improvement Comparison for Allen Creek at Madison Avenue ........................ 35
Figure 4-3 – Stormwater Improvement Comparison for Allen Creek at Hill Street .................................... 36
Figure 4-4 – Existing conditions results for Edgewood/Snyder (10% AEP, 12-hour storm) ....................... 37
Figure 4-5 – Conceptual Layout of Green Streets Alternative for Edgewood/Snyder ................................ 38
Figure 4-6 – Conceptual Layout of Storage Alternative for Edgewood/Snyder.......................................... 38
Figure 4-7 – Conceptual Layout of Conveyance Alternative for Edgewood/Snyder .................................. 39
Figure 4-8 – Flow Hydrograph Comparison for Conveyance Alternative at Edgewood/Snyder ................ 39
Figure 4-9 – Existing conditions results for Park Place Apartments (10% AEP, 12-hour storm) ................. 41
Figure 4-10 – Conceptual Layout for Storage Alternative at Park Place Apartments ................................. 41
Figure 4-11 - Conceptual Layout for Conveyance Alternative at Park Place Apartments .......................... 42
Figure 4-12 – Flow Hydrograph Comparison for Conveyance Alternative at Park Place Apartments ....... 42
Figure 4-13 – Existing conditions results for Churchill Downs (10% AEP, 12-hour storm) ......................... 43
Figure 4-14 – Conceptual Layout for Green Streets Alternative for Churchill Downs ................................ 44
Figure 4-15 – Water Surface Elevation comparison for Green Streets Alternative for Churchill Downs ... 45
Figure 4-16 – Conceptual Layout for Storage Alternative for Churchill Downs .......................................... 47
Figure 4-17 – Conceptual Layout for Conveyance Alternative for Churchill Downs ................................... 48
Figure 4-18 – Water Surface Elevation Comparison for Conveyance Alternative at Churchill Downs ....... 49
Figure 4-19 – Existing conditions results for East University (10% AEP, 12-hour storm) ........................... 50
Figure 4-20 – Conceptual Layout for Green Streets Alternative for East University .................................. 51
Figure 4-21 – Flow Hydrograph Comparison for Green Streets Alternative for East University ................ 52
Figure 4-22 – Conceptual Layout for Green Streets/UM Detention Alternative for East University ......... 52
Figure 4-23 – Flow Hydrograph Comparison for UM Detention Alternative for East University ............... 53
Figure 4-24 – Conceptual Layout for Conveyance Alternative for East University ..................................... 54
Figure 4-25 – Flow Hydrograph for Conveyance Alternative for East University ....................................... 54
Figure 4-26 – Existing conditions results for Murray-Washington Drain at Mulholland Avenue ............... 56
Figure 4-27 – Conceptual Layout for Surface Storage Alternative for Mulholland Ave ............................. 56
Figure 4-28 – Flow Hydrograph for Surface Storage Alternative for Mulholland Avenue ......................... 57

Stormwater Model Calibration and Analysis
Figure 4-29 – Conceptual Layout for Conveyance Alternative for Mulholland Ave ................................... 57
Figure 4-30 – Existing conditions results for Scio Church / S. Seventh Street ............................................ 59
Figure 4-31 – Conceptual Layout for Storage Alternative for Scio Church / S. Seventh Street .................. 60
Figure 4-32 – Flow Hydrograph for Storage Alternative for Scio Church / S. Seventh Street .................... 60
Figure 4-33 – Conceptual Layout for Conveyance Alternative for Scio Church / S. Seventh Street ........... 61
Figure 4-34 – Flow Hydrograph for Conveyance Alternative for Scio Church / S. Seventh Street ............. 62
Figure 4-35 – Existing conditions results for Glendale/Charlton ................................................................ 63
Figure 4-36 – Conceptual Layout for Upstream Detention Alternative for Glendale/Charlton ................. 63
Figure 4-37 – Flow Hydrograph for Upstream Detention Alternative for Glendale/Charlton.................... 64
Figure 4-38 – Conceptual Layout for Conveyance Alternative for Glendale/Charlton ............................... 64
Figure 4-39 – Existing conditions results for Glen Leven ............................................................................ 66
Figure 4-40 – Existing conditions results for Church Street / Cambridge Road .......................................... 66
Figure 4-41 – Conceptual Stormwater Improvements Layout for Church Street / Cambridge Road......... 67
Figure 4-42 – Existing conditions results for Village Oaks / Chaucer Court ................................................ 67
Figure 4-43 – Conceptual Layout for Detention Alternative at Village Oaks/Chaucer Court ..................... 68
Figure 4-44 – Existing conditions results for Parkwood / Pittsfield ............................................................ 69
Figure 4-45 – Conceptual Layout for Pittsfield/Parkwood Storage/Conveyance ....................................... 69
Figure 4-46 – Flow Hydrograph for Conveyance/Storage Alternative at Pittsfield/Parkwood .................. 70
Figure 4-47 – Flow Hydrograph for Conveyance Alternative at Pittsfield/Parkwood ................................ 70
Figure 4-48 – Existing conditions results for Signature Drive ..................................................................... 71
Figure 4-49 – Signature Drive Alternative Configuration ............................................................................ 72
Figure 4-50 – Existing conditions results for South Industrial Area ............................................................ 73
Figure 4-51 – Conceptual Layout for Green Streets Alternative for S. Industrial Area............................... 74
Figure 4-52 – Green Streets Alternative Pipe Capacity Results for S. Industrial Area ................................ 75
Figure 4-53 – Existing conditions results for Traver/Barton ....................................................................... 76
Figure 4-54 – Conceptual Layout for Conveyance Improvement Alternative for Traver/Barton ............... 76
Figure 4-55 – Ponding at Wooded Area behind Glendale Circle ................................................................ 77
Figure 4-56 – Location of Underground Storage at Virginia Park ............................................................... 78
Figure 4-57 – Location of Upstream Surface Storage for Glendale Circle / Virginia Park ........................... 79
Figure 4-58 – Commercial and Multi-Family Residential Parcels with Redevelopment Potential ............. 80
Figure 4-59 – Existing conditions results for Westgate/Maple Village ....................................................... 82
Figure 4-60 – Model results for Redevelopment Scenario for Westgate/Maple Village............................ 82
Figure 4-61 – Existing conditions results for Plymouth and Green Road ................................................... 83
Figure 5-1 – Potential Infiltration for Green Street Application ................................................................. 86
Figure 5-2 – Residential Rain Gardens in the City of Ann Arbor ................................................................. 87
Figure 6-1 – Comparison of FEMA FIRM Effective and InfoSWMM Model Results .................................... 91
Stormwater Model Calibration and Analysis
Tables
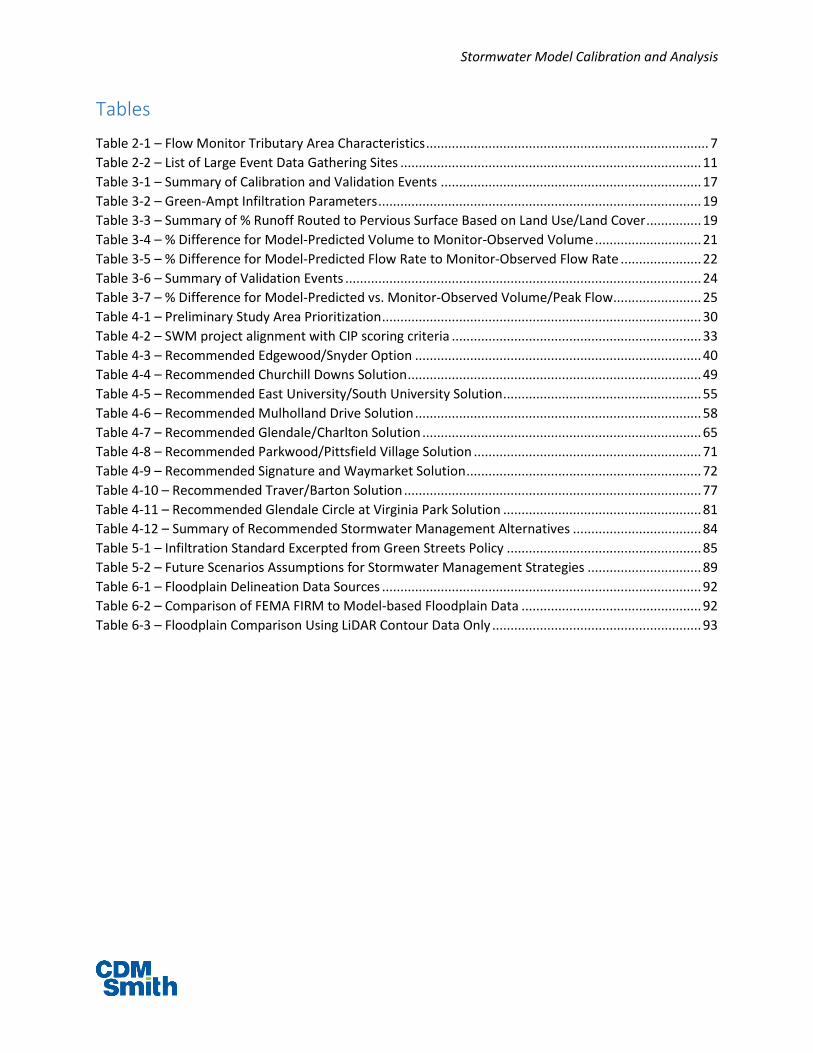
Table 2-1 – Flow Monitor Tributary Area Characteristics ............................................................................. 7
Table 2-2 – List of Large Event Data Gathering Sites .................................................................................. 11
Table 3-1 – Summary of Calibration and Validation Events ....................................................................... 17
Table 3-2 – Green-Ampt Infiltration Parameters ........................................................................................ 19
Table 3-3 – Summary of % Runoff Routed to Pervious Surface Based on Land Use/Land Cover ............... 19
Table 3-4 – % Difference for Model-Predicted Volume to Monitor-Observed Volume ............................. 21
Table 3-5 – % Difference for Model-Predicted Flow Rate to Monitor-Observed Flow Rate ...................... 22
Table 3-6 – Summary of Validation Events ................................................................................................. 24
Table 3-7 – % Difference for Model-Predicted vs. Monitor-Observed Volume/Peak Flow ........................ 25
Table 4-1 – Preliminary Study Area Prioritization ....................................................................................... 30
Table 4-2 – SWM project alignment with CIP scoring criteria .................................................................... 33
Table 4-3 – Recommended Edgewood/Snyder Option .............................................................................. 40
Table 4-4 – Recommended Churchill Downs Solution ................................................................................ 49
Table 4-5 – Recommended East University/South University Solution ...................................................... 55
Table 4-6 – Recommended Mulholland Drive Solution .............................................................................. 58
Table 4-7 – Recommended Glendale/Charlton Solution ............................................................................ 65
Table 4-8 – Recommended Parkwood/Pittsfield Village Solution .............................................................. 71
Table 4-9 – Recommended Signature and Waymarket Solution ................................................................ 72
Table 4-10 – Recommended Traver/Barton Solution ................................................................................. 77
Table 4-11 – Recommended Glendale Circle at Virginia Park Solution ...................................................... 81
Table 4-12 – Summary of Recommended Stormwater Management Alternatives ................................... 84
Table 5-1 – Infiltration Standard Excerpted from Green Streets Policy ..................................................... 85
Table 5-2 – Future Scenarios Assumptions for Stormwater Management Strategies ............................... 89
Table 6-1 – Floodplain Delineation Data Sources ....................................................................................... 92
Table 6-2 – Comparison of FEMA FIRM to Model-based Floodplain Data ................................................. 92
Table 6-3 – Floodplain Comparison Using LiDAR Contour Data Only ......................................................... 93

Stormwater Model Calibration and Analysis
Page 1
1. Executive Summary The stormwater model calibration and analysis project (SWM project) began in July 2012 with an
expected 2.5 - 3 year timeline. Preliminary model calibration was performed in 2012 using available data
sources, additional calibration data was collected in 2013, and final model calibration and analysis using
the collected information was completed in 2014. Project documentation, including this report, was
finalized in early 2015.
A. Purpose: The overall goal of the SWM project was to develop the computer model as a stormwater analysis tool
for the entire City of Ann Arbor drainage system and to provide answers to the City’s current
stormwater system management questions. Specifically, the project developed to address the following
objectives:
Provide an accurate stormwater model of the entire City of Ann Arbor conveyance system,
calibrated and validated using collected flow and rainfall data
Involve stakeholders and interested citizens in the project to build awareness of the stormwater
collection system and assist with the collection of stormwater system information for large
rainfall events.
Analyze existing stormwater system performance to determine the current level of service
provided to the residents of the City of Ann Arbor and to recommend improvements to the
stormwater system.
Evaluate the effectiveness of potential stormwater management strategies to determine the
return on these investments.
Utilize the results of the updated model to provide a comparison point for the existing FEMA
Flood Insurance Rate Map (FIRM) 100-year floodplain delineation.
Implement a modeling strategy that will allow for flexibility to address climate change and other
future changes with the stormwater system or with stormwater management policies.
B. Model Configuration: To accomplish these objectives, the stormwater model needed to include stormwater conveyance items
beyond just stormwater pipes and open channels. The elements included in the analysis are presented
in Figure 1-1 on the next page, and described below:
Catchment Areas – A detailed analysis of the areas tributary to the stormwater system inlets
was performed in a previous phase of stormwater model development. These catchment areas
and inlet locations were updated based on the stormwater data collection and analysis
activities.
Conveyance System – The stormwater computer model was developed using the available
information collected in a previous phase of stormwater model development for stormwater
inlets, pipes, manholes, open channels, 300 existing stormwater basins, and outfalls. The
engineering characteristics of these elements including sizes, slopes, and material of
construction were incorporated into the model setup to allow the stormwater conveyance
through this network.
Street Conveyance – Since the stormwater model was intended for simulation work for large
events, it explicitly incorporated the street system as conveyance elements where this takes

Stormwater Model Calibration and Analysis
Page 2
place in the system. This provided an accurate representation of the movement of water
throughout the City of Ann Arbor.
Surface Storage/Conveyance – For more detailed simulations of the movement and extent of
stored water, the surface storage and conveyance system in areas where stormwater was
known to accumulate was explicitly incorporated into the stormwater model.
Figure 1-1 – Stormwater System Components
C. Major Project Outcomes: The primary outcome of the SWM project is the delivery of the calibrated stormwater model itself. The
City’s investment in this project has allowed for the development of a tool for municipal stormwater
management that is highly complex and refined. The model is capable of providing valuable information
for various applications, from green infrastructure planning and stormwater system design, to floodplain
analysis and emergency management. Output from the model for each of these applications can be
relied upon confidently as the best information available. Most critically, the model can continue to be
utilized easily and efficiently by the City to help optimize the allocation of stormwater utility funding.
Following are the major findings that developed from the stormwater analysis work:
Model Pipes/Open Channel
1D Overland Flow Channel
2D Mesh Surface

Stormwater Model Calibration and Analysis
Page 3
Majority of City Meets the Design Standard Level of Service – The analysis work has determined
that the stormwater conveyance system is, in general, performing at a consistent design level of
service for most areas of the City. The current stormwater system design standard for the City of
Ann Arbor is the 10% annual exceedance probability (AEP), 12-hour storm. This storm is 2.9” of
rainfall using NOAA Atlas 14 rainfall volumes. However, in the Allen Creek watershed and in the
Malletts Creek watershed, there are areas where surface flooding is predicted during the 10%
AEP storm and in some cases during the 20% AEP storm. It is important to note that design
storm standards have increased periodically so that much of the City’s stormwater system was
designed and built to handle a smaller storm as compared to the current 10% AEP storm.
Recommended Improvements Developed to Address Level of Service Concerns – To address
these limitations in the level of service in these locations, a total of 16 study areas were
evaluated for potential stormwater system improvements and these improvements were
presented in a series of public meetings in November, 2014. The recommended improvements
will be considered as part of the City’s CIP Programming process. The total estimated capital
cost of the recommended stormwater improvements was determined to be approximately $34
million in year 2017 dollars. These recommended improvements do not include the cost of long-
term stormwater management strategies that were recommended specifically for the Allen
Creek watershed, which are estimated to be another $80 million to $120 million.
Green Streets and Rain Garden Policies Yield Expected Stormwater Benefits – The evaluation of
stormwater management strategies under future implementation timelines indicated that the
City should continue with incorporating the Green Streets Policy with street redesign projects
and promoting the residential rain garden programs. There should also be significant efforts put
into encouraging compliance with new development standards during redevelopment of
commercial, multi-family, and school or University properties.
FEMA Floodplain Comparison Developed – A floodplain delineation was performed using flow
and water level data generated by the new InfoSWMM model for the 1% annual exceedance
probability (AEP) storm. Using NOAA Atlas 14 rainfall volumes, this storm is a 5.11” rain event
over 24 hours. The 1% AEP floodplain delineation generated using the newer data was
compared with the existing FEMA Flood Insurance Rate Map (FIRM) floodplain contours.
Project Documentation will Allow Continued Stormwater Analysis – Project documentation is
being provided to the City, including archives of project files and model files. Training sessions
and written procedures for model updates and storm scenario updates have been prepared that
will allow City staff to continue to utilize the stormwater model as a system management tool.

Stormwater Model Calibration and Analysis
Page 4
2. Project Structure This project is the second element of the stormwater system management program which the City of
Ann Arbor (City) has implemented as follows:
Stormwater GIS and Model Project (SGM); 2006-2009: This project included review of as-built
drawings for stormwater system facilities, creation of a provisional geographic information
system (GIS), collection of flow and rainfall data for large tributary areas, and conversion of the
GIS to an InfoSWMM base hydraulic model. InfoSWMM is the hydraulic modeling software that
was selected by the City of Ann Arbor to integrate modeling activities with the ArcGIS software
which is used to manage the utility information. InfoSWMM software is constructed around the
Environmental Protection Agency Stormwater Management Model (EPA SWMM) dynamic
rainfall-runoff model.
Stormwater Model Calibration and Analysis Project (SWM); 2012-2015: This project included
two phases, with the first focused on calibration, and the second focused on analysis.
o Phase I – Preliminary calibration, data collection, final calibration of the stormwater
model
o Phase II – Use of the calibrated model to perform an analysis of the level of services,
review of the stormwater improvements needed to meet the level of service desired,
and modeling to allow a comparison of the floodplain defined by the separate FEMA
model analysis
This purpose of this report is to serve as a single source of project information, with a primary focus on
the Phase II analysis, results, and recommendations.
Individual task summaries developed for the SWM project are provided as a reference, and directions to
obtain more detailed versions of project documentation and output are included.
A. Task 1 – Phase I Public Engagement The objective of this task was to understand the community issues and concerns with the management
of stormwater that should be addressed throughout the project. It was also intended to gain an
understanding of the specific stormwater-related questions and concerns in different sections of the city
to help focus the modeling in these areas.
Work on Task 1 included development of a public engagement strategy, management of the City’s
project website, and the development of a stormwater advisory group (SWAG), which helped to plan
and implement the public engagement strategy. The primary public engagement work item in Phase I
was a series of seven public meetings held throughout the City during 2013 to gather information about
experiences of the residents in these different areas with stormwater and their expectations for the
City’s stormwater management programs. This information was also obtained via a community-wide
online stormwater survey that ran in parallel with the public outreach work. The Phase I public
engagement effort was summarized in a Phase I Technical Memorandum, which can be found as part of
the project file archive.

Stormwater Model Calibration and Analysis
Page 5
Another aspect of the Task 1 work was initial engagement with the City’s Technical Oversight and
Advisory Group (TOAG) for wet-weather projects. At interim steps during the project, City staff and/or
CDM Smith staff presented project updates. Formal project presentations were made to the TOAG on
March 20, 2014 at the end of final model calibration and on December 11, 2014, following the public
meeting presentations. The TOAG group will also be assisting with review of the final project report in
spring 2015.
B. Task 2 – Preliminary Model Calibration and Validation The objective of this task was to utilize the stormwater model assembled under the prior project and
utilize previously collected rainfall, flow, and level data to perform a preliminary calibration of the
stormwater model. This version of the model was also validated using independent storm events to
evaluate the stormwater model performance and to generate recommendations for model
improvements.
During this task, model updates were made to incorporate recent changes in infrastructure or
hydrology. A field verification task was utilized to perform additional field investigation to verify key
topographic or hydraulic elevations. The model was also updated to account for physical inlet
restrictions and for sump pump flows generated by the Footing Drain Disconnect (FDD) Program.
A preliminary model calibration effort was performed using stormwater flow and level data collected
during the 2007 Stormwater GIS and Model (SGM) project. The 2007 data set was supplemented with
records from long term USGS gauges located at the outlets of Allen Creek and Malletts Creek. Model
simulation output was compared to the flow data, and the model parameters were iteratively adjusted
to align model performance to be reflective of the measured data. Validation storms were used to
evaluate model performance after calibration, which helped to understand locations where additional
flow and rainfall data would be helpful to prepare a better model.
The preliminary calibration task was summarized in a preliminary calibration technical memorandum,
which was provided to the City of Ann Arbor in 2013. The preliminary calibration report concluded that
additional data collection and calibration should be performed for the following reasons:
The dormant season model calibration was limited due by the lack of dormant season
calibration events. Additional soil parameter calibration was needed to improve dormant
season calibration.
Provide additional support for upstream boundary conditions for locations where
stormwater flows enter the City. The City’s stormwater system does not extend into these
areas but the stormwater behavior in these areas directly affects the City system and must
be included in the model. These selected locations included Traver Creek at M-14 and
Malletts Creek at I-94.
Collect data for better model refinement in selected study locations. Since the 2007 data
collection effort, large storms had highlighted collection system performance and level of
service concerns in Malletts Creek and along lower Allen Creek. Additional monitoring of
major branches of these creeksheds was recommended.
Improve calibration and validation to meet percent difference goals of 15% on volume and
20% on peak flow, when comparing model-predicted values to monitored values.
Stormwater Model Calibration and Analysis
Page 6
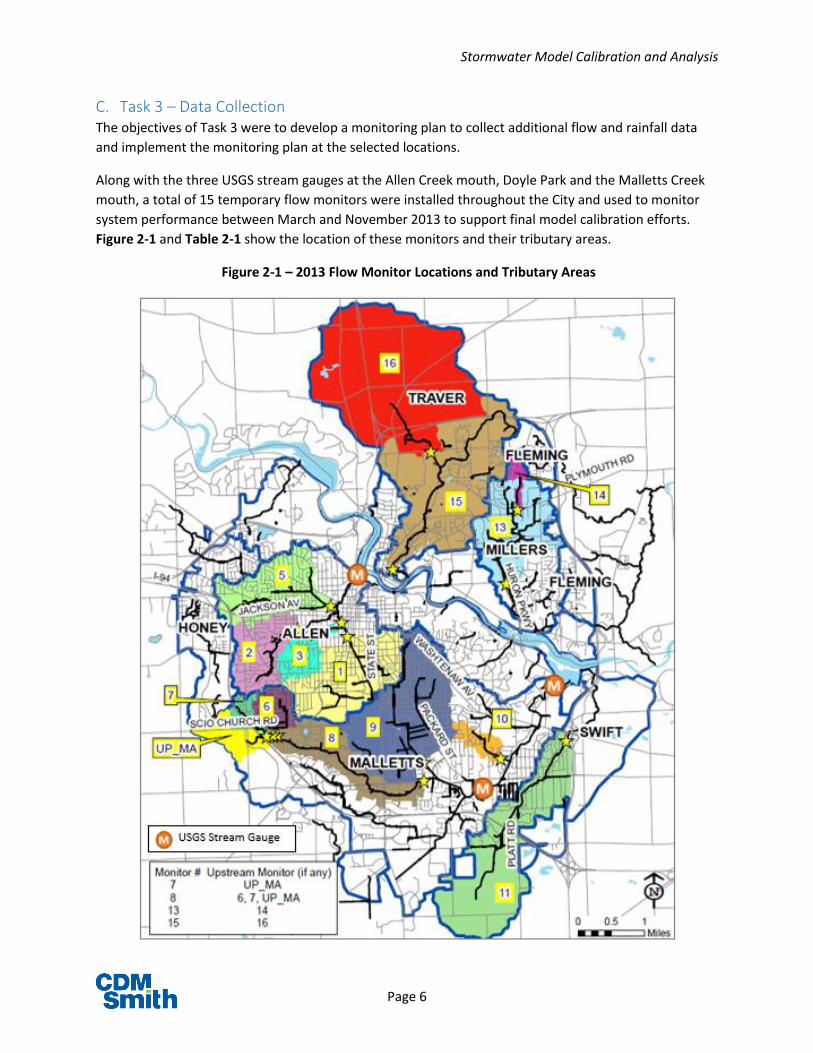
C. Task 3 – Data Collection The objectives of Task 3 were to develop a monitoring plan to collect additional flow and rainfall data
and implement the monitoring plan at the selected locations.
Along with the three USGS stream gauges at the Allen Creek mouth, Doyle Park and the Malletts Creek
mouth, a total of 15 temporary flow monitors were installed throughout the City and used to monitor
system performance between March and November 2013 to support final model calibration efforts.
Figure 2-1 and Table 2-1 show the location of these monitors and their tributary areas.
Figure 2-1 – 2013 Flow Monitor Locations and Tributary Areas
Stormwater Model Calibration and Analysis
Page 7
Table 2-1 – Flow Monitor Tributary Area Characteristics
Watershed Site
#
Area
(acre)
Impervious
%
Structure
ID Notes
Dates
Installed
(all 2013)
Allen
1* 1,003 55 92-61836
Upstream 30% of Allen Creek
tributary area (south)
In FEMA floodplain
3/29 – 11/26 2* 557 48 92-60256 Murray-Washington Drain
3 244 41 92-60016 Eberwhite Drain
2007 Monitor Site #3
4 Number not used
5* 812 42 92-
063256
Immediate downstream of 2007
Monitor Site #2. Monitor both
branches west of West Park
3/29 – 6/22,
7/10 – 11/26
Malletts
6* 222 45 92-52016 2007 Monitor Site #6
Upstream of Lansdowne area 4/10 – 11/26
7* 392 33 92-52033 Upstream of Lansdowne area
(west of I-94)
8* 1,283 42 92-51565 Lansdowne + Eisenhower 3/29 – 11/26
9* 1,459 45 92-50565
Portion of Malletts Creek
tributary area with no in-line
detention ponds
4/12 – 11/26
10* 152 31 92-50865 2007 Monitor Site #10 4/10 – 11/26
UP_
MA* 228 30 92-52034
For Upper Malletts Creek
project
Township area bounded by I-94,
Oak Valley Blvd, AA District
Library and Scio Church Rd
5/10 – 11/26
Swift Run 11* 1,631 18 91-51339
Swift Run before exiting Ann
Arbor (level-only gauge)
4/30 – 6/23,
7/25 – 11/26
12 Number not used
Millers 13 969 38 91-51591 Downstream monitoring 4/12 – 11/26

Stormwater Model Calibration and Analysis
Page 8
Watershed Site
#
Area
(acre)
Impervious
%
Structure
ID Notes
Dates
Installed
(all 2013)
14 90 40 92-54857 Georgetown area 3/29 – 11/26
Traver
15* 4,466 13 91-50318
Flow meter at the box culvert
immediate downstream of
HRWC level gauge 4/10 – 11/26
16* 2,648 5 91-50193 Monitor runoff response from
rural areas outside Ann Arbor
* Located in County Drain
For each location the area, imperviousness, structure identification number, and various comments are
provided in the table. Except for the Swift Run site where only a level probe was installed, Teledyne ISCO
2150 area-velocity flow modules were deployed to measure level, velocity and flows at each site. Data
were downloaded on-site and reviewed on a monthly basis. The collected information was corrected
when data quality was deemed poor. Typically this was due to velocity sensor errors, but level data were
generally available and consistent. Calculations based on the Manning’s equation (see below) and stage-
discharge relationships were developed for most of the sites to allow for correction of flow data using
level only.
Figure 2-2 – Conceptual Description of Manning’s Equation
Data from 12 ground-based rain gauges from different sources were collected to support the model
calibration efforts. New rain gauges were installed at North Campus and at City Hall as part of this
project. The gauges used during calibration included the following locations:
Permanent City-maintained rain gauges: Barton Dam, Jackson Road, South Industrial, North
Campus, City Hall
Temporary rain gauges installed for the Sanitary Sewer Wet Weather Evaluation Project:
Glen Leven, Morehead, Bromley, Dartmoor, Orchard Hills
Rain gauges from National Oceanic and Atmospheric Administration (NOAA) / National
Weather Service (NWS): KARB (located at Ann Arbor Airport)
Carpenter Elementary School gauge (KMIANNAR38) available on Weather Underground

Stormwater Model Calibration and Analysis
Page 9
Figure 2-2 shows the location of rain gauges. These gauges were used to calibrate radar rainfall data and
compute rainfall volume for each model subcatchment. Issues with the power supply and with gauge
operation were frequently noted for the South Industrial gauge during the data collection period. As a
result, this site was not used for analysis for some of the calibration and validation events. The South
Industrial gauge was later relocated as part of this project and the power supply issues have also been
resolved.
Figure 2-3 – Rain Gauges for Final Model Calibration
To supplement the flow and rainfall data, a program was established to gather observational data of
surface flooding and other stormwater behavior at targeted sites throughout the City. With input from
City staff and neighborhood groups, a total of 42 locations were identified for Large Event Data
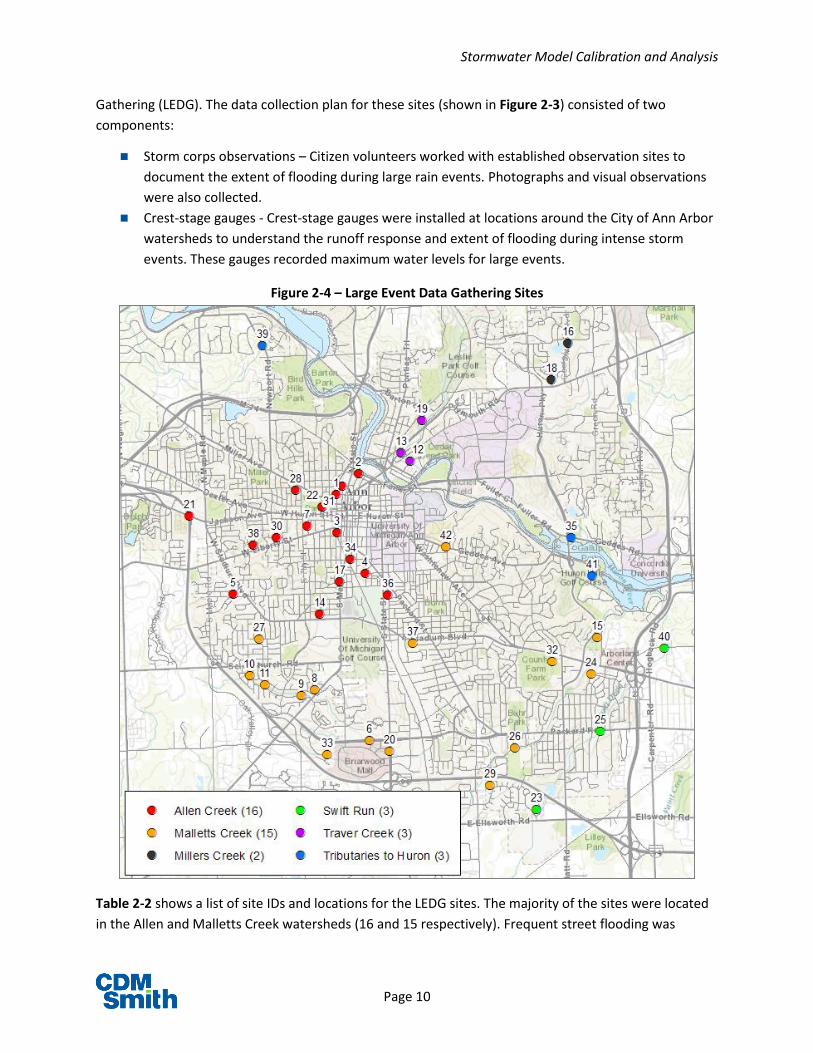
Stormwater Model Calibration and Analysis
Page 10
Gathering (LEDG). The data collection plan for these sites (shown in Figure 2-3) consisted of two
components:
Storm corps observations – Citizen volunteers worked with established observation sites to
document the extent of flooding during large rain events. Photographs and visual observations
were also collected.
Crest-stage gauges - Crest-stage gauges were installed at locations around the City of Ann Arbor
watersheds to understand the runoff response and extent of flooding during intense storm
events. These gauges recorded maximum water levels for large events.
Figure 2-4 – Large Event Data Gathering Sites
Table 2-2 shows a list of site IDs and locations for the LEDG sites. The majority of the sites were located
in the Allen and Malletts Creek watersheds (16 and 15 respectively). Frequent street flooding was

Stormwater Model Calibration and Analysis
Page 11
reported at these sites during intense storm events in the past and the locations were refined using
citizen reports gathered at neighborhood stormwater meetings in January through March of 2013.
Table 2-2 – List of Large Event Data Gathering Sites
Allen Creek Malletts Creek
ID Location ID Location
1 1st and Kingsley 6 Eisenhower and Plaza Dr
2 Depot/4th/Summit 8 2295 Chaucer Ct
3 First and William 9 1115 Morehead Ct
4 Hill and Division 10 Churchill/Wiltshire Intersection
5 Park Place Apartments 11 2279 Mershon
7 306 Mulholland 15 Brentwood Sq.
14 Edgewood and Snyder 20 State and Mall Dr
17 Davis and S Main 24 Parkwood and Fernwood
21 I-94 and Jackson 26 Doyle Park dam
22 West Park 27 Avondale and Catalina
28 504 Maple Ridge (south of
Arborview) 29 Englewood and Manitou
30 Bemidji and Montgomery 32 Meri Lou Murray Recreation Center
31 Felch/N. Ashley intersection 33 Signature and Waymarket
34 Madison and 4th (Fingerle) 37 Iroquois south of Stadium
36 1128 White St 42 Geddes and Linden
38 Behind Glendale Circle (west of
Virginia Park)
Millers Creek Swift Run
ID Location ID Location
16 2369 Georgetown (south of Bluett) 23 University Townhouses
18 Prairie and Briarcliff 25 Packard and Pittsfield
40 Swift Run at Clark Rd
Traver Creek Tributary to Huron River
ID Location ID Location
12 Traver Creek at Nielsen Ct 35 Geddes/Fuller/Huron Pkwy
13
Plymouth Park adjacent to Manna
Market 39 Newport Creek at Newport Rd
19 Traver Creek at Barton Dr 41 Huron Hills Golf Course
LEDG data was used during calibration to validate flooding predictions. It was also used during the
existing conditions modeling to assist in the delineation of localized flooding areas.
Data collected from rainfall and flow monitoring, as well as from the LEDG program, has been provided
to the City as part of the final data files for the project.

Stormwater Model Calibration and Analysis
Page 12
D. Task 4 – Final Model Calibration and Validation The objective of Task 4 was to utilize the preliminary calibrated model and newly collected flow and
rainfall data to provide final model calibration and validation.
Prior to final calibration, the model hydrology and hydraulics were updated to 2013 conditions.
Significant changes are described as follows:
New or modified stormwater facilities were included for West Park, County Farm Park, and for
the Traver Creek improvements in Leslie Park Golf Course.
FDD flows were added to the model and represented as Rainfall Dependent Inflow/Infiltration
(RDII) hydrographs. This allowed for analysis of different FDD Program scenarios without having
to manually adjust hydrologic parameters. The FDD scenario evaluations were presented in an
FDD Flows Technical Memorandum, dated November 20, 2013. This tech memo can be found in
the final project documentation.
1D and 2D overland flow channels were also incorporated into the model for calibration. 1D
refers to one-dimensional modeling, where overland flow is represented by a secondary model
link between the two manholes. In 2D, or two-dimensional modeling, overland flows is
represented by surface polygons that are based on elevation contour data. Figure 2-4 shows the
areas with 1D and 2D overland flow surfaces. The 2D surface occupies more than 10% of the
model area, mostly located within Federal Emergency Management Agency (FEMA) 100-year
floodplain and flood-prone areas.

Stormwater Model Calibration and Analysis
Page 13
Figure 2-5 – Model Overland Flow Channels and 2D Surface Locations
In general, the model updates were made to align the model framework with the actual system
conditions present during the 2013 monitoring period.
Final calibration was performed to refine and improve the model parameters established in preliminary
calibration. The detailed process and results of calibration are presented in Section 3 of this report, and
in the Final Calibration Report.
E. Task 5 – Phase I Documentation The objective of Task 5 was to provide comprehensive documentation of the model update and
calibration processes for future reference. This was accomplished primarily in the delivery of the project
model, which includes all calibration scenarios as part of the InfoSWMM scenario manager.
This task also included delivery of an archive of project data files and documentation, including the flow
and rainfall data, GIS data files generated throughout the project, and other administrative
documentation.
Model Pipes/Open Channel
1D Overland Flow Channel
2D Mesh Surface

Stormwater Model Calibration and Analysis
Page 14
Phase I work was summarized in the final calibration report, which can be found in the project data file
archive.
F. Task 6 – Procedures The objective of Task 6 was to provide written support to City of Ann Arbor staff that will routinely use
or update the model with new stormwater management features, infrastructure changes, or with new
design storm information.
The model procedures were developed in conjunction with the model training sessions described in Task
7. These written procedure documents cover the steps needed to incorporate new BMPs or other
stormwater improvements into the model. A separate procedure document was created to explain
storm update procedures, which could be used to modify design storm information or to create a new
storm scenario altogether.
G. Task 7 – Training The objective of Task 7 was to develop training materials and provide both general and detailed training
for the newly developed modeling tools. Detailed training sessions were held on March 2-3, 2015 with
City staff who will be the primary model users. General training to explain the model development and
model applications was held on March 24, 2015. The training presentations were included as handouts
in each session and copies are also included in the project file archives.
H. Task 8 – Phase II Public Engagement The objective of Task 8 was to continue the information sharing and public education processes that
were established in Phase I, while adding new activities to disseminate project results and
recommendations.
Three public meetings were held in November 2014, with dates and times selected to enable maximum
community participation:
Wednesday, November 5 – 6:30 p.m. Ann Arbor District Library – Downtown
Thursday, November 6 – 10:00 a.m. Ann Arbor District Library – Downtown
Sunday, November 9 – 2:30 p.m. Ann Arbor District Library – Malletts Creek
The purpose of these meetings was to share the project’s findings, including proposed
recommendations and the rationale behind each. Meeting attendees were invited to indicate their level
of interest among all the geographic areas in which recommended system improvements were
proposed, in order to properly prioritize the contents of the presentation.
The other new public engagement activity in Phase II was the development of a stormwater video that
would help to draw attention to the project and to stormwater management issues facing the City of
Ann Arbor. The stormwater video entered production in March 2015 and will be released near the end
of the project schedule.
I. Task 9 – Model Analysis and Recommendations The objective of Task 9 was to utilize the final calibrated model to evaluate the performance of the
stormwater drainage system throughout the City of Ann Arbor and to identify and analyze proposed
improvements.

Stormwater Model Calibration and Analysis
Page 15
The basis for evaluating the existing conditions performance of the stormwater system performance
was a series of design storm scenarios, that include different volumes and rainfall distributions based on
the annual exceedance probability (AEP) standards established in NOAA Atlas 14. A range of storms was
analyzed from 100% AEP to 0.2% AEP. In general, the 10% AEP, 12-hour duration storm and the 20%
AEP, 1-hour duration storm were used to evaluate the level of service being provided by the stormwater
system. The 10% AEP storm is the current stormwater design standard, but most areas of the City were
constructed to a smaller storm recurrence standard and at a time when the storm volumes associated
with the standards were smaller. Analysis of the 20% storm allowed for identification of areas that
would first begin to have capacity problems as the storm size increases.
Locations were identified where the current pipe capacity cannot convey the flows generated by these
storms, and where surface flooding occurs as a result of the capacity shortfall. A list of study locations
was developed and potential stormwater improvement alternatives were considered for each location.
These included alternatives for stormwater Best Management Practices (BMPs), local and regional
stormwater storage, and conveyance improvements.
The calibrated model was also used to analyze stormwater management impacts. For future condition
scenarios, the model was used to predict the impacts of broad stormwater management initiatives, such
as residential rain gardens, commercial property redevelopment, and the City’s Green Streets program
for stormwater management in right-of-way (ROW) areas.
Details on the model analysis work and stormwater improvement recommendations are included in
Sections 4 and 5 of this report.
J. Task 10 – Verify FEMA Mapping The objective of Task 10 was to compare the calibrated model results to existing FEMA Flood Insurance
Rate Map (FIRM) flood mapping to provide the City with an additional source of flood level data that
could be used for future floodplain analysis and management.
The InfoSWMM model was used with a 1% AEP, 24-hour storm, and peak flows and peak water surface
elevation (WSEL) data were generated. The water surface elevations from the model were then used to
delineate floodplain contours using the latest Light Detection and Ranging (LiDAR)-based topographic
data and differences between the model-based contours and the FEMA FIRM floodplain contours were
compiled. The comparison data was provided to the City of Ann Arbor to support future floodplain
management decisions.
K. Task 11 – Documentation Final documentation for the project includes this final report, along with project model files and data
files generated during Phase II activities.

Stormwater Model Calibration and Analysis
Page 16
3. Stormwater Modeling
A. Model background and calibration Preliminary calibration of the stormwater model was performed using available flow monitoring data
collected by CDM Smith as part of the Stormwater GIS and Model development (SGM) project. The SGM
flow data from 2007 was supplemented with United States Geologic Service (USGS) flow data from long
term flow gauges. In total, nine (9) storm events from May 2007 to March 2012 were selected for the
preliminary calibration effort. It was found that during the growth-season events, model results were
generally within 15% of volumes and 20% of peak flows observed at the monitors and USGS gauges.
A percent difference of 15% for volume and of 20% for peak flows were the initial targets used by CDM
Smith to evaluate the effectiveness of calibration, based on experience with other stormwater models
of similar size and level detail. The model was validated using three (3) storm events from 2007 and was
generally within 20% of volumes for monitored flows. The peak flow comparison was also within 20% for
most meter areas, but there were some areas with wider variability (in the range of 50% difference)
between model-predicted and monitor-observed flows.
The preliminary calibration report concluded that additional data collection and calibration should be
performed for the following reasons:
The dormant season model calibration was limited due by the lack of dormant season
calibration events. Additional soil parameter calibration will be needed to improve dormant
season calibration.
Provide additional support for upstream boundary conditions for locations where
stormwater flows enter the City. These include Traver Creek at M-14 and Malletts Creek at I-
94
Collect data for better model refinement in expected study locations. Since the 2007 data
collection effort, large storms have highlighted collection system performance and level of
service concerns in Malletts Creek and along lower Allen Creek. Additional monitoring of
major branches of these creeksheds was recommended.
Improve calibration and validation to meet percent difference goals of 15% on volume and
20% on peak flow, when comparing model-predicted values to monitored values.
The preliminary calibration report, submitted in 2013, included the conclusions above and
recommended additional flow and rainfall monitoring in 2013 to be used for a final model calibration.
Final calibration and validation were performed in early 2014, using the flow and rainfall data collected
during 2013.
i. Storm Events for Calibration Unlike 2007, the monitoring period between March and November 2013 yielded a few large events that
significantly tested the performance of the storm drainage system. That includes the June 27th 2013
event that caused surface flooding in parts of the Allen Creek and Malletts Creek watersheds. A total of
seven 2013 storm events of various volumes were selected for calibration (Table 3-1).

Stormwater Model Calibration and Analysis
Page 17
Table 3-1 – Summary of Calibration and Validation Events
# Date Precip Total
(in) Sources Season
1 6/27/2013 1.1 – 3.0 calibrated radar rain data growth
2 8/12/2013 1.7 – 2.9 calibrated radar rain data growth
3 10/31/2013 1.5 – 1.9 calibrated radar rain data growth*
4 6/13/2013 1.3 – 1.8 calibrated radar rain data growth
5 4/17/2013 1.3 – 1.6 ground gauges dormant/growth
transition
6 7/9/2013 0.1 – 1.2 ground gauges growth
7 8/27/2013 0.3 – 0.6 ground gauges growth * This low-intensity long-duration event was observed to behave like growth season event after calibration
The total precipitation (measured at individual gauges) of these events ranged from 0.1 inches to 3.0
inches. 5-minute calibrated radar rainfall data in 1km x 1km resolution were purchased from Vieux Inc.
for the four largest events. For the other events, precipitation at each subcatchment was computed with
ground gauge records with inverse-distance-weighted interpolation, which assigns precipitation to each
subcatchment using a weighted calculation based on the nearest ground gauges.
ii. Calibration Methods The model calibration was performed using an iterative approach by refining the following model
parameters to match model-simulated hydrographs with flow monitoring data:
Green-Ampt infiltration parameters
Percent of runoff routed from impervious to pervious surface (related to % of directly-
connected impervious surface)
Subcatchment width (overland flow length)
Manning’s n (roughness coefficient) for impervious and pervious surface
Depression storage for impervious and pervious surface (negligible on larger storms)
Due to the model’s large scale, the calibration first started by matching flow hydrographs at
downstream gauges (USGS stream gauges at Allen Creek, Doyle Park and Malletts Creek mouth, Swift
Run (#11), Millers Creek (#13) and Traver Creek (#15)). This first calibration step was then followed by
matching the flow hydrographs for the upstream temporary monitors. In addition, there was an
emphasis placed on matching flow hydrographs for the larger storms rather than the smaller storms.
iii. Calibrated Model Parameters During the final round of model calibration, model parameters were fine-tuned to reflect the new
hydrologic conditions as discussed below:
Soil Parameters
The soil parameters in the model affect the amount of rainfall that is predicted to infiltrate into the
ground. Originally, four different soil types were set up in model setting based on the Hydrologic Soil
Group (HSG) Soil Group (A, B, C and D). After going through the iterative calibration process and upon
further review of the United States Department of Agriculture (USDA) Soil Map and potential soil

Stormwater Model Calibration and Analysis
Page 18
infiltration rates, an additional soil parameter group (B1) was added. The monitor #14 (Georgetown)
area has primarily type B soil according to the USDA Soils Map, but the model continued to over-
estimate runoff peak and volume. A better match was obtained when the B1 soil parameter was used,
which included increasing the soil infiltration rate from 1 in/hr to 1.8 in/hr.
The Malletts Creek area upstream of the Mary Beth Doyle Park pond is primarily of type C soil, but the
USDA Soil Map showed that the soil infiltration rates of the first foot of soil more closely resemble type
B soil. To better match the storm sewer hydrographs for these storm events, these areas were assigned
to have type B soil. Soil classification data is shown in Figure 3-1.
Figure 3-1 – Hydrologic Soil Groups (HSG) for stormwater model areas
The dormant season soil parameters were not adjusted from the 2007 parameters because there were
no large storm events during the dormant season in 2013.
Stormwater Model Calibration and Analysis
Page 19
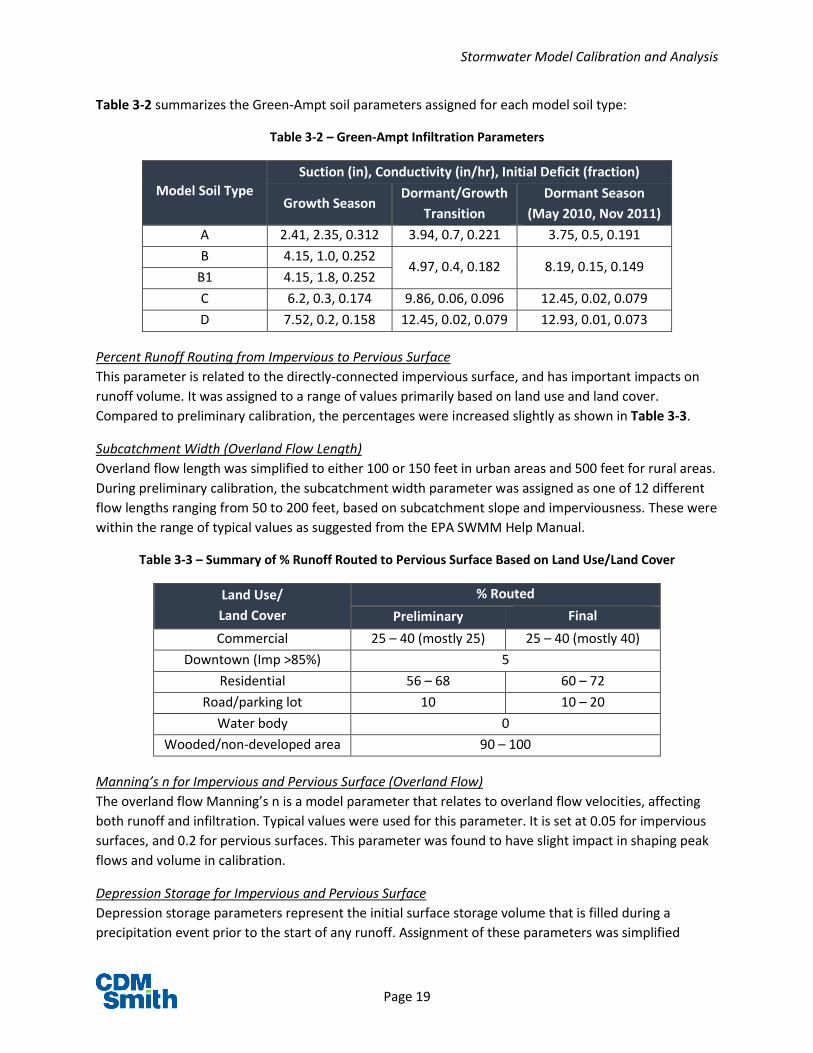
Table 3-2 summarizes the Green-Ampt soil parameters assigned for each model soil type:
Table 3-2 – Green-Ampt Infiltration Parameters
Model Soil Type
Suction (in), Conductivity (in/hr), Initial Deficit (fraction)
Growth Season Dormant/Growth
Transition
Dormant Season
(May 2010, Nov 2011)
A 2.41, 2.35, 0.312 3.94, 0.7, 0.221 3.75, 0.5, 0.191
B 4.15, 1.0, 0.252 4.97, 0.4, 0.182 8.19, 0.15, 0.149
B1 4.15, 1.8, 0.252
C 6.2, 0.3, 0.174 9.86, 0.06, 0.096 12.45, 0.02, 0.079
D 7.52, 0.2, 0.158 12.45, 0.02, 0.079 12.93, 0.01, 0.073
Percent Runoff Routing from Impervious to Pervious Surface
This parameter is related to the directly-connected impervious surface, and has important impacts on
runoff volume. It was assigned to a range of values primarily based on land use and land cover.
Compared to preliminary calibration, the percentages were increased slightly as shown in Table 3-3.
Subcatchment Width (Overland Flow Length)
Overland flow length was simplified to either 100 or 150 feet in urban areas and 500 feet for rural areas.
During preliminary calibration, the subcatchment width parameter was assigned as one of 12 different
flow lengths ranging from 50 to 200 feet, based on subcatchment slope and imperviousness. These were
within the range of typical values as suggested from the EPA SWMM Help Manual.
Table 3-3 – Summary of % Runoff Routed to Pervious Surface Based on Land Use/Land Cover
Land Use/
Land Cover
% Routed
Preliminary Final
Commercial 25 – 40 (mostly 25) 25 – 40 (mostly 40)
Downtown (Imp >85%) 5
Residential 56 – 68 60 – 72
Road/parking lot 10 10 – 20
Water body 0
Wooded/non-developed area 90 – 100
Manning’s n for Impervious and Pervious Surface (Overland Flow)
The overland flow Manning’s n is a model parameter that relates to overland flow velocities, affecting
both runoff and infiltration. Typical values were used for this parameter. It is set at 0.05 for impervious
surfaces, and 0.2 for pervious surfaces. This parameter was found to have slight impact in shaping peak
flows and volume in calibration.
Depression Storage for Impervious and Pervious Surface
Depression storage parameters represent the initial surface storage volume that is filled during a
precipitation event prior to the start of any runoff. Assignment of these parameters was simplified

Stormwater Model Calibration and Analysis
Page 20
compared to preliminary calibration. Typical values were used: 0.08 inch for impervious surfaces, 0.16
inch for grass areas, and 0.2 inch for wooded areas.
iv. Calibration Results In general, the model was able to replicate the hydrographs at the USGS stream gauges and temporary
flow monitors. The results were generally within 15% for volumes and 20% for peak flows, which match
with calibration goals for a stormwater model of this size and complexity.
Tables 3-4 and 3-5 show the event-specific percent difference in volume and peak flow for each monitor
location. The percent difference in each case is calculated using the following formula:
% 𝑫𝒊𝒇𝒇𝒆𝒓𝒆𝒏𝒄𝒆 = (𝑴𝒐𝒅𝒆𝒍 𝒑𝒓𝒆𝒅𝒊𝒄𝒕𝒆𝒅 𝒗𝒂𝒍𝒖𝒆 − 𝑴𝒐𝒏𝒊𝒕𝒐𝒓 𝒐𝒃𝒔𝒆𝒓𝒗𝒆𝒅 𝒗𝒂𝒍𝒖𝒆)
(𝑴𝒐𝒏𝒊𝒕𝒐𝒓 𝒐𝒃𝒔𝒆𝒓𝒗𝒆𝒅 𝒗𝒂𝒍𝒖𝒆) 𝒙 𝟏𝟎𝟎%
Figures 3-3 to 3-4 show hydrographs for some of the major monitors while the full version of the final
calibration report includes all the hydrographs at these monitors and gauges for reference.
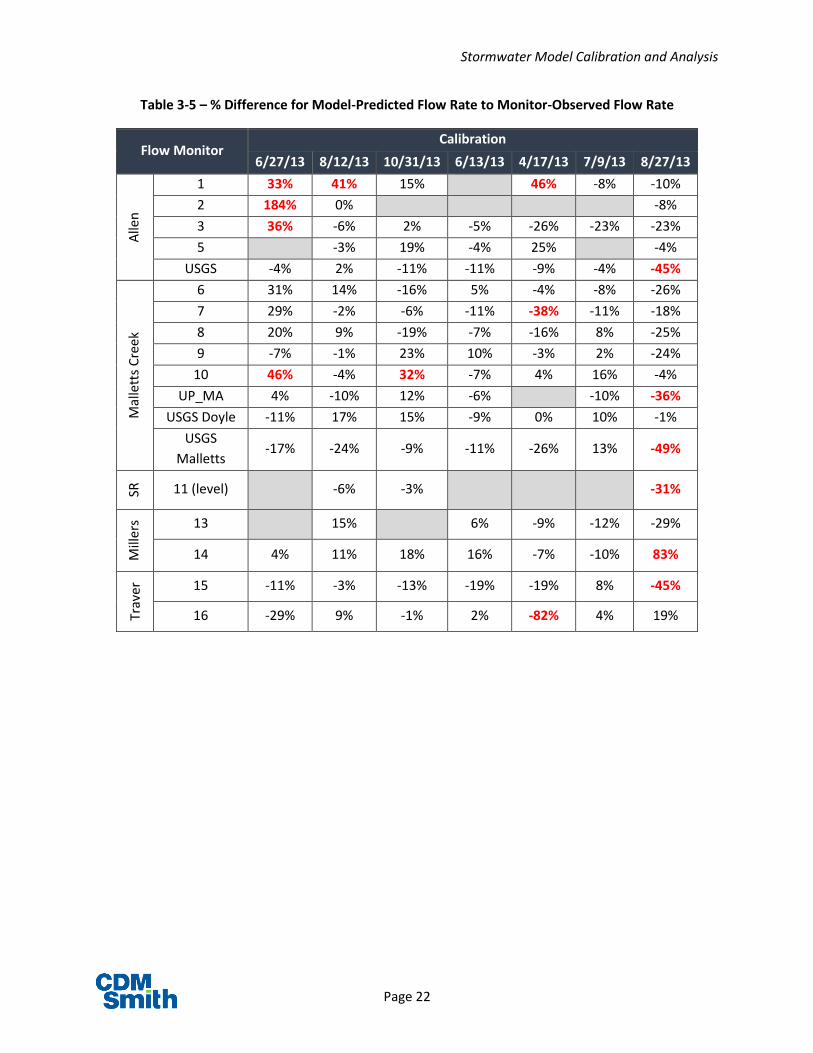
Discussions of some of the outliers are as follows:
Monitor Sites #1 and #2 were surcharged/flooded during 6/27/13 storm. Flows were likely
under-reported by the monitors at these sites during peak flow.
The model under-predicted flows for Traver Creek sites for 4/17 (#15 and #16), and 6/13
(#15) storms by at least 30%. There seemed to be an unaccounted flow source from outside
the city limits after those storm events. Review of nearby rain gauge data did not reveal
additional precipitation in the vicinity. Additional field investigation work in Ann Arbor
Township would be required to determine why the response for these storms varied from
other storms for which the calibration was better matched.
Monitor #10 in the Malletts Creek watershed had good agreement on hydrologic response
pattern but poor volume agreement for the 10/31/2013 event. Because other events for
this monitor had more consistent agreement, this was likely due to monitor error, possibly
from fall leaf debris. This was also the smallest monitored tributary area, with the lowest
flows, making it more subject to this type of problem.
For the Swift Run monitoring site, the culvert configuration did not allow for installation of
an ultrasonic flow meter. Instead, a continuous level monitor was installed, and a rating
curve that had been developed in 2007 was used to calculate flow. The rating curve provides
a correlation between the level monitor reading and a predicted flow rate. However, the
measured flow rate values were much lower than model predictions, suggesting that the
rating curve may not have been representative in 2013 (potentially due to changes in
sediment levels in the culverts or changes in streambank characteristics). As a result, the
model parameters were refined to match model-predicted levels with recorded levels for
this site (#11)

Stormwater Model Calibration and Analysis
Page 21
Table 3-4 – % Difference for Model-Predicted Volume to Monitor-Observed Volume
Flow Monitor Calibration
6/27/13 8/12/13 10/31/13 6/13/13 4/17/13 7/9/13 8/27/13
Alle
n
1 66% 43% 18% 15% 1% 9%
2 269% 9% 4%
3 23% 16% -12% 12% -41% 22% 21%
5 9% -3% 5% -1% 6%
USGS 3% -1% 10% 4% -8% -7% -4%
Mal
lett
s C
ree
k
6 -7% 6% 12% 3% -13% 11% 13%
7 -15% -5% -6% -13% -21% -13% -2%
8 8% 9% -7% -3% -11% 4% -27%
9 19% 4% 12% -5% -15% 17% 33%
10 4% 10% 107% 1% -15% 5% 11%
UP_MA -10% 7% 14% -6% 7% 7%
USGS Doyle 1% 2% -7% -3% -4% 2% 3%
USGS
Malletts 1% -9% -8% 4% -12% -7% 6%
SR
11 (level) 2% 0% -3%
Mill
ers 13 8% -13% -25% 14% 17%
14 -16% 9% 30% -2% -6% 19% 113%
Trav
er
15 -4% -5% -3% -30% -32% -6% 1%
16 -4% -5% 4% -4% -71% -2% 4%
For areas with open channels, there seemed to be a prolonged runoff response not
effectively represented by the Green-Ampt infiltration model. This was apparent when
monitored flows dropped off more slowly than the model prediction, lasting for many hours
after the 4/17 event. This prolonged runoff response was represented by adding response
hydrographs based on the Rainfall Dependent Inflow/Infiltration RTK method (RDII RTK)
along the open channel reaches in Malletts Creek, Swift Run and Traver Creek.
The distance-weighted average of ground rain gauge data did not seem to be representative
enough for the 8/27 event. Although the runoff volumes were matched within 15% for most
of the sites, the model missed the first runoff peak as recorded by the flow monitors.
Stormwater Model Calibration and Analysis
Page 22
Table 3-5 – % Difference for Model-Predicted Flow Rate to Monitor-Observed Flow Rate
Flow Monitor Calibration
6/27/13 8/12/13 10/31/13 6/13/13 4/17/13 7/9/13 8/27/13
Alle
n
1 33% 41% 15% 46% -8% -10%
2 184% 0% -8%
3 36% -6% 2% -5% -26% -23% -23%
5 -3% 19% -4% 25% -4%
USGS -4% 2% -11% -11% -9% -4% -45%
Mal
lett
s C
ree
k
6 31% 14% -16% 5% -4% -8% -26%
7 29% -2% -6% -11% -38% -11% -18%
8 20% 9% -19% -7% -16% 8% -25%
9 -7% -1% 23% 10% -3% 2% -24%
10 46% -4% 32% -7% 4% 16% -4%
UP_MA 4% -10% 12% -6% -10% -36%
USGS Doyle -11% 17% 15% -9% 0% 10% -1%
USGS
Malletts -17% -24% -9% -11% -26% 13% -49%
SR
11 (level) -6% -3% -31%
Mill
ers 13 15% 6% -9% -12% -29%
14 4% 11% 18% 16% -7% -10% 83%
Trav
er
15 -11% -3% -13% -19% -19% 8% -45%
16 -29% 9% -1% 2% -82% 4% 19%

Stormwater Model Calibration and Analysis
Page 23
Figure 3-2a-d – Flow Hydrographs for Major Monitors for 6/27/13 Event
Figure 3-3a-d – Flow Hydrographs for Major Monitors for 8/12/13 Event

Stormwater Model Calibration and Analysis
Page 24
Figure 3-4a-d – Flow Hydrographs for Major Monitors for 6/13/13 Event
B. Model Validation
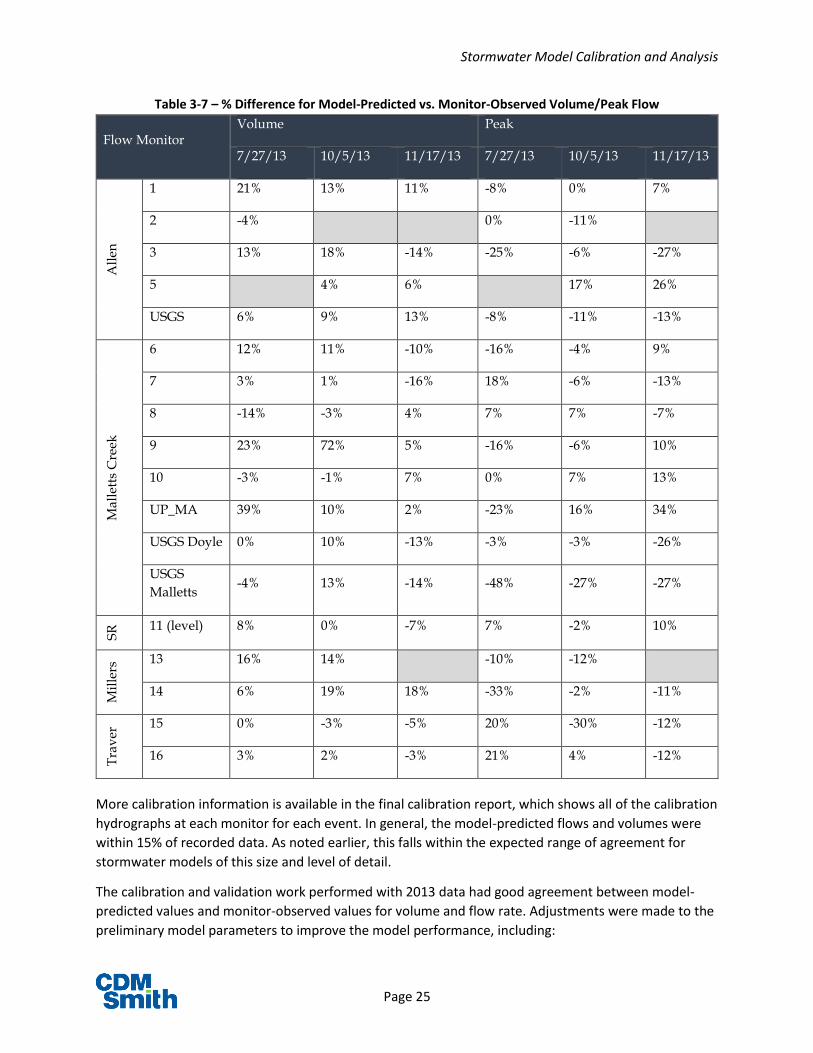
i. Validation Events Three (3) storm events in 2013 were selected for model validation. The total precipitation for these
events ranged from 0.1 inches for the 7/27 event to 1.6 inches for the 10/5/2013 event. Table 3-6
summarizes the range of precipitation computed for the monitoring districts for each of the validation
events.
Table 3-6 – Summary of Validation Events
# Date Precip Total
(in) Sources Season
1 10/5/2013 1.3 – 1.6 ground gauges growth
2 11/17/2013 0.6 – 0.8 ground gauges dormant
3 7/27/2013 0.1 – 0.5 ground gauges growth
ii. Validation Results Table 3-7 summarizes the comparison of runoff volume and peak flow values between the model-
predicted and monitor-observed data. As with the calibration comparison, the validation results are
presented in terms of a % difference. The comparison was made at all gauges with available data,
including the USGS gauges.
Stormwater Model Calibration and Analysis
Page 25
Table 3-7 – % Difference for Model-Predicted vs. Monitor-Observed Volume/Peak Flow
More calibration information is available in the final calibration report, which shows all of the calibration
hydrographs at each monitor for each event. In general, the model-predicted flows and volumes were
within 15% of recorded data. As noted earlier, this falls within the expected range of agreement for
stormwater models of this size and level of detail.
The calibration and validation work performed with 2013 data had good agreement between model-
predicted values and monitor-observed values for volume and flow rate. Adjustments were made to the
preliminary model parameters to improve the model performance, including:
Flow Monitor Volume Peak
7/27/13 10/5/13 11/17/13 7/27/13 10/5/13 11/17/13
All
en
1 21% 13% 11% -8% 0% 7%
2 -4% 0% -11%
3 13% 18% -14% -25% -6% -27%
5 4% 6% 17% 26%
USGS 6% 9% 13% -8% -11% -13%
Ma
llet
ts C
reek
6 12% 11% -10% -16% -4% 9%
7 3% 1% -16% 18% -6% -13%
8 -14% -3% 4% 7% 7% -7%
9 23% 72% 5% -16% -6% 10%
10 -3% -1% 7% 0% 7% 13%
UP_MA 39% 10% 2% -23% 16% 34%
USGS Doyle 0% 10% -13% -3% -3% -26%
USGS
Malletts -4% 13% -14% -48% -27% -27%
SR
11 (level) 8% 0% -7% 7% -2% 10%
Mil
lers
13 16% 14% -10% -12%
14 6% 19% 18% -33% -2% -11%
Tra
ver
15 0% -3% -5% 20% -30% -12%
16 3% 2% -3% 21% 4% -12%

Stormwater Model Calibration and Analysis
Page 26
Establishment of a B1 soil classification
Runoff parameter refinement for more sensitive parameters, specifically with % routing
Simplification of parameter assignments for subcatchment width and depression storage, which
have less impact on model results
C. Existing conditions modeling The final calibrated model was used to determine the level of service provided by the existing storm
drainage system and to help identify priority areas for improvements. Eight (8) design storm simulations,
as shown in Figure 3-5, were prepared to identify capacity constraints and flooding locations in the
system. The range of design storms include:
100% annual exceedance probability (AEP) 1-Hour: 0.97” (could serve as baseline for BMP
evaluation)
50% AEP 24-Hour: 2.35” (could serve as baseline for BMP evaluation)
20% AEP 1-Hour: 1.44” (Older part of the system were designed for old 20% storm volume)
10% AEP 12-Hour: 2.90” (Represents current design standard)
4% AEP 24-Hour: 3.93”
2% AEP 24-Hour: 4.5”
1% AEP 24-Hour: 5.11” (Design standard for detention storage, used for FEMA map comparison)
0.2% AEP 24-Hour: 6.74” (new probability from Atlas 14, also used in FEMA flood analysis)
Rainfall volumes were obtained from NOAA Rainfall Atlas 14 Volume 8 (version 2). They were 8% to 28%
higher compared to Bulletin 71 (Please refer to Design Storm Tech Memo for detailed discussion).
Figure 3-5 – Design Storm Events

Stormwater Model Calibration and Analysis
Page 27
The Huff 1st quartile, alternating block, and SCS Type II distributions were used for 1-hour, 12-hour and
24-hour duration storms, respectively. An alternating block distribution is similar to SCS Type II except it
is not limited to 24-hour duration storms. Both of these distributions represent an intense rainfall
pattern that is commonly associated with thunderstorm activity likely to occur during summer. These
rainfall distributions are shown in Figure 3-6.
Climate change was a frequent point of discussion during the project. The use of newer rainfall volume
standards from NOAA Rainfall Atlas 14 for design storms was one consideration. As noted in the
previous paragraph, use of the SCS Type II distribution was another decision made so that the project
was considering not only the most intense type of storm event, but potentially accounting for more
frequent storms of this type in the future.
Figure 3-6 – Cumulative Rainfall Distributions
Appendix A contains two series of sewer system maps showing the level of service provided by the
existing storm drainage system in different parts of the City: Capacity Exceedance maps and Peak flow
condition maps. For the capacity exceedance map, pipes were color-coded based on the smallest design
storms that pipe capacity was exceeded. For the peak flow condition maps (one map per design storm),
pipes were shown in green if capacity is not exceeded, yellow if backwater condition occurred, and red if
capacity is exceeded during storms. Figure 3-7 below shows an example peak flow condition map.

Stormwater Model Calibration and Analysis
Page 28
Figure 3-7 – Example HGL Condition Map
In addition to the pipe capacity, the maps also show locations where flooding would occur during
different design storm events. Surface flooding locations were categorized into either street overland
flow (usually with less than 6 inch of water) or ponding (more than 6 inches of water), and their
boundaries were delineated using LiDAR data provided by Washtenaw County.
With higher precipitation estimates from Atlas 14, most of the current drainage system had pipe
capacities that were more in line with the 20% AEP storm instead of the 10% AEP storm, which is the
current standard. While it was not unexpected that newer parts of the system and open channels can
usually handle larger storm events better than older parts of the system, most areas of the stormwater
system are still able to convey the 10% AEP, 12-hour storm without significant flooding. This includes
almost the entire creekshed areas for Traver Creek, Millers Creek, Swift Run, Newport Creek, and areas
that drain directly to the Huron River, where only a few isolated surface flooding areas were identified
for additional study during review of existing conditions model data.
The Allen Creek and the Malletts Creek watersheds include more impervious surface area and in general
have older stormwater infrastructure. Therefore, most of the capacity issues and surface flooding areas
are located in these two creeksheds. Further information on the process used to identify priority areas
for improvement and the associated recommendations are discussed in Section 4.

Stormwater Model Calibration and Analysis
Page 29
4. Stormwater System Improvements
A. Study Area Selection Existing conditions modeling results were reviewed in a series of progress meetings and workshops with
City Staff in the spring and summer of 2014. Sewer system maps were generated showing the pipe
segments that were within design capacity for flow and those that had model-predicted flows that
would exceed the design capacity. The maps also showed model nodes where surcharging to ground
was predicted (where the water surface elevation would exceed the manhole rim elevation).
Existing conditions results are included in the maps in Appendix A. For the initial review, the current
stormwater system design standard storm was used. This design storm has a 10% Annual Exceedance
Probability (AEP), and a duration of 12 hours, with a rainfall volume of 2.9 inches. The initial review of
the system performance under this storm event showed that the many areas of the system were unable
to convey this storm. This has primarily been due to recent changes in the design storm standard, so
that the current 10% AEP storm is larger than it was when these pipes were designed and constructed.
As a result, a smaller design storm was also evaluated to identify potential locations for stormwater
improvements. When the 20% AEP, 1-hour duration storm, with a volume of 1.44”, was reviewed with
the model, more distinct areas with performance issues were revealed.
For both the 10% AEP, 12-hour storm and the 20% AEP, 1-hour storm, preliminary screening locations
were identified by comparing model-predicted flow to design capacity and by identifying locations with
predicted surface flooding. The preliminary screening list was also compared with LEDG sites and with
public input about flooding locations that was gathered in Phase I public meetings and surveys.
Once preliminary screening was complete, the sites were prioritized using two risk metrics:
The probability metric considered the frequency of flooding occurrence, with the following
ratings of 1, 2, or 3:
1. Model predicts flooding in 10% AEP storm, but no reports
2. Model predicts flooding in 20% AEP storm and/or frequent public reports
3. Model predicts flooding in 50% AEP storm and/or frequent public reports
The impact metric considered the extent or severity of flooding with the following ratings:
1. Flooding limited to streets and parking areas with a depth of 6” or less
2. Flooding affects private properties, typically with predicted depths of 6” - 12”
3. Flooding affects structures, typically with predicted depths greater than 12”
These two metrics were multiplied together to generate an overall flooding risk rating, with a higher
value indicating a higher risk of flood damage. The assigned values and prioritization are shown in Table
4-1:

Stormwater Model Calibration and Analysis
Page 30
Table 4-1 – Preliminary Study Area Prioritization
Additional sites were identified during the public meeting series that either had not been selected for
study or had been eliminated during the preliminary screening process. To address the questions about
these sites, they have been included in the comments below:
Glendale Circle / Virginia Park – This location is predicted to have flooding affecting private
properties during the 10% AEP, 12-hour storm, so it should have been included in the original
screening, with a probability metric of 1 and an impact metric of 2. A full evaluation of
stormwater improvements for this site is included in section 4C.
Geddes Road at Huron Parkway – This reported flooding may have been related to a culvert
problem that was repaired in the past couple years. The model does not predict flooding that
would impact any roadways or private properties for the 10% AEP, 12-hour storm.
Newport Road at Westport – The model predicts some surface flooding in the 10% AEP, 12-hour
storm, but overland conveyance allows flow into the wooded area to the east along an existing
drainage easement. This site would have probability and impact metrics of 1, so it was not
included in screening for evaluation of stormwater improvements.
Washtenaw Avenue at South University Avenue – Attendees at the public meetings mentioned
some surface drainage issues affecting properties on Washtenaw Avenue. The model predicts
Stormwater Model Calibration and Analysis
Page 31
some overland flow in the areas of Wilmot Street and South University, but no extensive surface
flooding to the south along Washtenaw Avenue. It is likely that the affected property, which sits
lower than the roadway, receives roadway runoff during intense rainfall events due to catch
basin limitations and/or curb, gutter, and roadway grading issues. Washtenaw Avenue is an
MDOT business route so any improvements to the stormwater system would most likely be
initiated as part of an MDOT roadway improvement project.
B. Improvements modeling Three conceptual approaches were considered for stormwater improvement alternatives. These
approaches were constructed in the model to represent how these stormwater improvements would
function at each study location and how they would impact the stormwater system performance. While
the screening process used surface flooding and property impacts as screening criteria, the
improvements modeling used the current stormwater design standard (handling the 10% AEP, 12-hour
storm with water surface elevations at least 2’ below the ground surface) as a design performance goal.
1. Green Streets / Localized BMPs:
The Green Streets improvement concept aims to minimize runoff volume through localized
storage and infiltration within the City right-of-way (ROW).
The City’s Green Streets policy includes on-site infiltration standards for public roadway and
right-of-way (ROW) construction and reconstruction projects. The policy calls for infiltration of 1
inch (1st flush), 2.35 inches (50% annual chance 24-hour storm) or 3.26 inches (10% annual
chance 24-hour storm) of total precipitation volume that falls on the ROW, depending on site
soil conditions, slope and proximity to floodplain. It was assumed that on-site infiltration is not
practical in areas that have historically had groundwater levels within 5 feet of the ground
surface.
To represent the Green Streets BMPs, the “depression storage” parameter for the relevant sub-
catchments was increased accordingly to represent additional storage of runoff and the
subsequent infiltration within ROW. The additional depression storage volume was calculated as
the area-weighted average between storage in the ROW area (1 to 3.26 in) and non-ROW area
(0.08 in for impervious area and 0.16 inch for pervious area).
2. Engineered Storage:
This concept aims to reduce peak flow rates by detaining runoff flows with designated
underground or surface storage locations.
Large underground or surface detention facilities were considered based on availability of large
open space. It is assumed that the facilities would be drained by gravity so their depths would
be limited by the invert elevations of the adjacent storm drainage system. Some realignment of
existing storm sewers would usually be involved to re-route runoff to the desired engineered
storage location. Siting involves initial assessment of utility conflicts based on GIS data, but
further evaluation would be required upon moving to the preliminary design phase for any of
these locations.

Stormwater Model Calibration and Analysis
Page 32
When evaluating the storage elements in the stormwater model, these facilities were either
represented as a rectangular storage node or as a large conduit link. The storage volume for
each location was determined by storing enough 10% AEP storm runoff to minimize flooding at
the study location, while limiting outflow from the storage feature(s) to the pre-development
release rate standard of 0.15 cfs/acre.
3. Conveyance Improvement:
This conceptual improvement approach is intended to move runoff offsite from the study
location by providing additional capacity in the pipe system.
This concept looks at increasing the capacity of the existing drainage system to convey more
runoff downstream from the study area and reduce the peak hydraulic grade line (HGL) to be at
least 2 feet below ground during the 10% AEP, 12-hour storm. This is an iterative approach that
could include increasing the size of existing storm pipes or installing new storm relief pipes.
Improvements were all evaluated using the 10% AEP, 12-hour design storm (2.9 inch). Improvement
scenarios for each site were based on one of the concepts or a combination, if improvements could not
be achieved by one concept alone. Not all of the conceptual approaches were considered for each site,
since their application at some sites would not be feasible or practical.
It is noted that the scope of this project was focused on using the model to evaluate stormwater system
changes but other approaches should also be considered for addressing the study areas. Alternative
approaches could include the purchase and/or modification of affected properties so that predicted
surface flooding does not affect private property. This approach would not improve the system to the
current stormwater design standard, but it may be significantly less costly. Model output showing the
number of parcels and structures affected by predicted surface flooding could be used for further
consideration of this approach.
C. Site descriptions and recommendations The stormwater improvements evaluations are presented in this section following a similar format to
the public meeting presentations. For each study area, the following items are described:
Problem Definition
Alternatives analysis
Evaluation summary and recommendation
The evaluation summary was developed to support the prioritization of each recommended project as
part of the City’s Capital Improvements Programming (CIP). The stormwater model and improvements
evaluation were used to generate output that would align with City’s established scoring criteria, as
shown in Table 4-2:

Stormwater Model Calibration and Analysis
Page 33
Table 4-2 – SWM project alignment with CIP scoring criteria
Where cost estimates are presented, these have been developed using unit costs from current City
construction projects with cost escalation to year 2017. The Springwater Subdivision Improvements
Project was used for direct unit costs for storm sewer pipe, and multipliers were added to account for
design/engineering, other structures and utilities, and construction contingencies to develop the overall
project costs presented. A similar approach was taken for project cost estimates for infiltration BMPs,
underground storage, and surface storage. Upper end cost estimates from more complex projects were
used to estimate costs for areas where construction would be more difficult.
i. Lower Allen Creek The Allen Creek tributary area has a much higher proportion of impervious surfaces compared to other
areas of Ann Arbor. The Allen Creek watershed includes downtown Ann Arbor, as well as the majority of
the University of Michigan Central Campus and South Campus areas. Major branches of Allen Creek
extend to the west, collecting drainage from the west side of Ann Arbor.
Almost the entire length of the creek has been enclosed in storm sewers that are owned by either the
City of Ann Arbor or the Washtenaw County Water Resources Commissioner. The lower sections of the
enclosed creek were built in the early 1900’s and only have capacity to convey the 50% AEP storm.
Surface flooding occurs frequently in lower areas and extensive surface flooding is predicted in the 1%
AEP storm, as shown in Figure 4-1.

Stormwater Model Calibration and Analysis
Page 34
Figure 4-1 – Allen Creek Stormwater System Overview
The 1997 stormwater master plan for the City of Ann Arbor evaluated conveyance improvements, and it
was estimated that increasing the pipe size to accommodate the 10% AEP design storm at that time
would cost around $40 million. A similar evaluation was prepared as part of this project and an overall
estimate range of $150M - $200M was established for conveyance of the 10% AEP design storm. This
cost estimate includes land acquisition of properties that would be substantially impacted by the
expanded pipe footprint, but a complete engineering analysis to evaluate the feasibility of construction
and land acquisition was beyond the scope of this project.
Because of the scale of the Allen Creek flooding problems, the project team recognized that a single
improvement strategy, such as the conveyance improvements noted above, would be very difficult to
implement and would have a high construction cost. Therefore, the model evaluation process for the
Lower Allen Creek was designed to provide comparative information on different improvement
strategies so that long term programs could be put in place to reduce or manage stormwater flows as
effectively and efficiently as possible. The major sources of stormwater runoff are from impervious
surfaces and management of these sources was considered in the following strategies:
Right-of-Way areas - Green Streets Policy - Infiltration criteria based on Green Street Policy
Residential properties - Rain gardens for single family homes- Capture the runoff from first 1” of
precipitation
University of Michigan properties - 1% AEP storm detention for all UM properties
Commercial/Multi-family Residential properties - Storm detention for all commercial / multi-
family properties per current development standards

Stormwater Model Calibration and Analysis
Page 35
As a reference, the results for these different strategies are shown in comparison to the 1997 master
plan conveyance improvement strategy. Figure 4-2 below shows the predicted water surface elevation
for baseline conditions (blue) and for the other stormwater improvement strategies for Allen Creek at
Madison near the Fingerle Lumber property.
Figure 4-2 – Stormwater Improvement Comparison for Allen Creek at Madison Avenue
The top graphic shows the water surface elevation (WSEL) for the 20% AEP, 1-hour storm. While the
model predicts surface flooding under baseline conditions, each of the individual improvement
strategies would bring water levels below the ground surface at this location. For the 10% AEP, 12-hour
storm, however, the individual stormwater management strategies have minimal impacts on peak water
levels.
Similar results are seen at Hill Street in Figure 4-3, although it is notable that the impacts of University of
Michigan properties are more significant since they make up a larger portion of the tributary area to this
location.

Stormwater Model Calibration and Analysis
Page 36
Figure 4-3 – Stormwater Improvement Comparison for Allen Creek at Hill Street
Recommendation
The individual stormwater management strategies are not sufficient to eliminate flooding in the 10%
AEP, 12-hour design storm as the pipe capacity along most of the lower sections of Allen Creek would
still be exceeded. However, each strategy can be effective at reducing the frequency of flooding, and are
especially effective during smaller storm events. University of Michigan properties are significant for the
local stormwater system and for Allen Creek in the Hoover to Hill Street area. Our recommendation is to
continue work on all of the studied stormwater management strategies to achieve incremental
improvements in reducing peak stormwater flows over time.
Application of the Green Streets policy throughout the Allen Creek watershed, would require an
investment of $80 million to $120 million (in 2017 dollars to match other project cost information).
Other stormwater management alternatives would generally be funded by private property owners as
part of redevelopment or as part of future stormwater management policies, so these costs have not

Stormwater Model Calibration and Analysis
Page 37
been included. The cost of Green Streets implementation, which would be spread over many decades as
roadways are reconstructed, compares favorably to a conveyance improvement for Allen Creek, which
was estimated to cost up $150 million to $200 million, and which would require significant property
acquisition in areas that would impacted by installation of a large pipeline.
For stormwater management on private property, the City should be proactive in creating and enacting
policies that require property owners to manage stormwater on site. Requiring stormwater
management during redevelopment would be a good next step, but incentivizing the implementation of
stormwater management should also be considered. This approach could be similar to the current
residential stormwater credit programs for becoming a RiverSafe Home partner, or building a rain
garden or installing rain barrels.
Additional information about model analysis of stormwater management options for both Allen Creek
and other creeksheds is included in section 5 of this report. Section 5 presents the options in different
levels of combination in terms of the projected level of completion under future scenarios.
ii. Edgewood/Snyder This location is characterized by street flooding in the low area at the intersection of Edgewood and
Snyder. While the stormwater drainage system travels south across W. Stadium, the surface grade of W.
Stadium is higher than the Edgewood/Snyder intersection, preventing a surface outflow pathway as
shown in Figure 4-4. The upstream pipe system along Martha Avenue and Snyder does not have
sufficient capacity to convey the 10% AEP design storm, so overland street flow is predicted.
Figure 4-4 – Existing conditions results for Edgewood/Snyder (10% AEP, 12-hour storm)
Alternative 1: Green Streets and Storage
Soil conditions in this area are expected to be suitable for infiltration so a significant infiltration capacity
was assumed for the right of way (ROW) areas. The modeling assumed 3.26” of infiltration for the full
extent of the upstream ROW, as shown in Figure 4-5. This would provide a total infiltration volume of
2.22 million gallons (MG). Even with this level of infiltration, pipe upsizing would be required along
Edgewood and 0.22 MG of underground storage would still be required.

Stormwater Model Calibration and Analysis
Page 38
Figure 4-5 – Conceptual Layout of Green Streets Alternative for Edgewood/Snyder
Alternative 2: Conveyance Improvement and Storage
The model was used to evaluate a storage improvement alternative, as shown in Figure 4-6. Pipe
upsizing would be provided along Martha Avenue, Snyder, and Edgewood to address the street flow,
and 0.64 MG of storage volume would be required. Siting for a specific storage location was beyond the
scope of this evaluation, but the open area between Stadium Blvd. and the existing Pioneer High School
retention basin is shown as the general location assumed for the modeling analysis.
Figure 4-6 – Conceptual Layout of Storage Alternative for Edgewood/Snyder
Alternative 3: Conveyance Improvement and Relief
In this alternative, the conveyance improvements are made in the neighborhood and the increased
flows are bypassed around the Pioneer High retention basin, since this facility is already at its capacity.
This option is shown in Figure 4-7.

Stormwater Model Calibration and Analysis
Page 39
Figure 4-7 – Conceptual Layout of Conveyance Alternative for Edgewood/Snyder
During the 10% AEP storm, the conveyance improvements would primarily move street overland flow
into the expanded pipe system. Moving these flows downstream more quickly would nearly double the
peak flows and would impact the performance of the stormwater ponds on the University of Michigan
golf course, as shown in Figure 4-8. A 54” diameter relief pipe would be needed for this option and the
total length of pipe upsizing would be 6,900 LF.
Figure 4-8 – Flow Hydrograph Comparison for Conveyance Alternative at Edgewood/Snyder
Recommendation
The recommended solution for Edgewood/Snyder is the local conveyance and storage alternative as
shown in Table 4-3. This approach would reduce properties affected by flooding in the 10% AEP storm
by 15 properties and would reduce the risk of structure impacts by 6.

Stormwater Model Calibration and Analysis
Page 40
Table 4-3 – Recommended Edgewood/Snyder Option
Other considerations for this recommended alternative include coordination with the upcoming West
Stadium improvements project and potential local storage at the Edgewood/Snyder intersection,
especially if the church parking lot at the southeast corner could be utilized.
The City should also consider a long term phasing approach where the local flooding issue at
Edgewood/Snyder is addressed first, with other neighborhood improvements addressed in the future.
While it would not immediately address the 10% AEP storm, this approach may be the most feasible and
cost-efficient. This approach would likely include the following steps:
1. Upsize pipe across W. Stadium at Edgewood to provide outlet capacity
2. Provide local storage at Edgewood/Snyder intersection or south of Stadium Blvd. to reduce peak
flows through storage and infiltration.
3. Evaluate street flooding impacts versus Green Streets impacts as road reconstruction projects
are completed in the future.
iii. Park Place Apartments The stormwater system problem at this location is caused by both the pipe size and the surface grading,
which prevents an overland flow pathway. Under existing conditions, the pipe capacity is reached during
the 50% AEP storm, and surface flooding begins to appear at the 20% AEP storm or larger. Surface
flooding affects the lower level units of the apartment building located at the eastern edge of the
property, as shown in Figure 4-9.
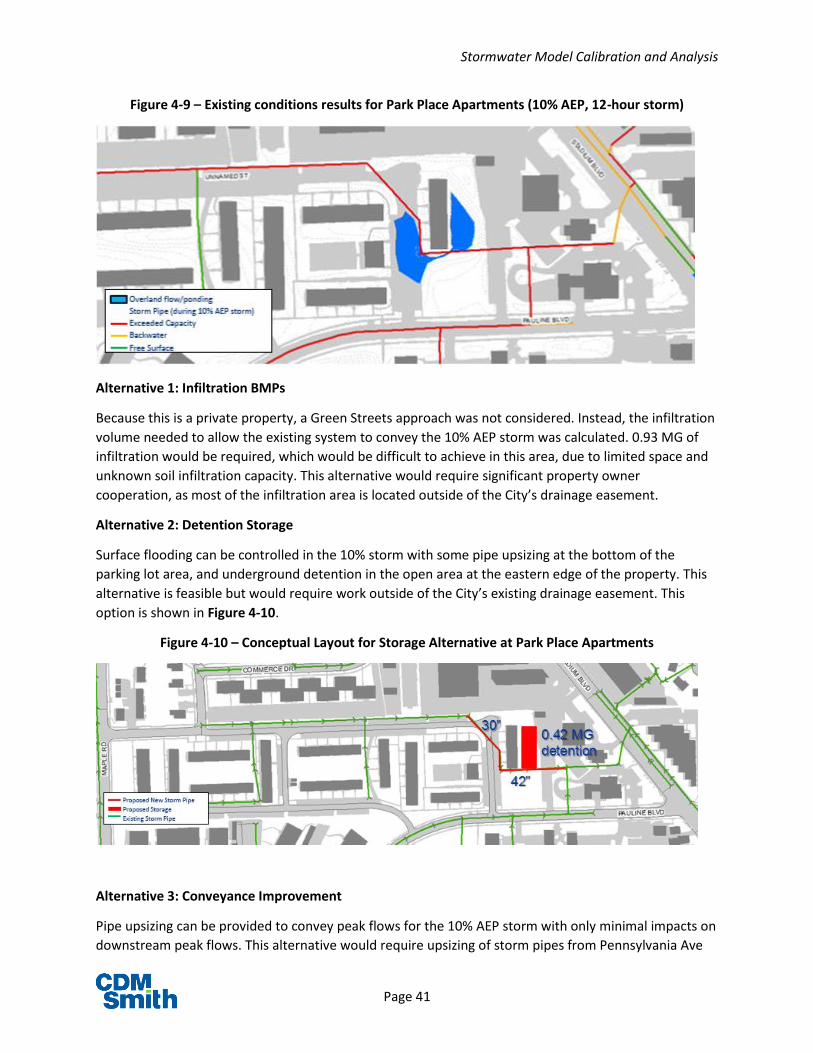
Stormwater Model Calibration and Analysis
Page 41
Figure 4-9 – Existing conditions results for Park Place Apartments (10% AEP, 12-hour storm)
Alternative 1: Infiltration BMPs
Because this is a private property, a Green Streets approach was not considered. Instead, the infiltration
volume needed to allow the existing system to convey the 10% AEP storm was calculated. 0.93 MG of
infiltration would be required, which would be difficult to achieve in this area, due to limited space and
unknown soil infiltration capacity. This alternative would require significant property owner
cooperation, as most of the infiltration area is located outside of the City’s drainage easement.
Alternative 2: Detention Storage
Surface flooding can be controlled in the 10% storm with some pipe upsizing at the bottom of the
parking lot area, and underground detention in the open area at the eastern edge of the property. This
alternative is feasible but would require work outside of the City’s existing drainage easement. This
option is shown in Figure 4-10.
Figure 4-10 – Conceptual Layout for Storage Alternative at Park Place Apartments
Alternative 3: Conveyance Improvement
Pipe upsizing can be provided to convey peak flows for the 10% AEP storm with only minimal impacts on
downstream peak flows. This alternative would require upsizing of storm pipes from Pennsylvania Ave

Stormwater Model Calibration and Analysis
Page 42
to W. Stadium Blvd, as shown in Figure 4-11. By conveying the larger storm, the basement apartment
units would be protected up to the 4% AEP 24-hour storm.
Figure 4-11 - Conceptual Layout for Conveyance Alternative at Park Place Apartments
Downstream peak flows at W. Stadium would increase by approximately 10% as shown in Figure 4-12.
This increase could be mitigated using local storage or BMPs at available locations on the property.
Figure 4-12 – Flow Hydrograph Comparison for Conveyance Alternative at Park Place Apartments
Recommendation
The recommended approach for improvements for the Park Place Apartments would be to provide
conveyance improvements, which can be provided within the City’s existing drainage easement at a
reasonable cost and without any major property impacts. To mitigate peak flow increases downstream,
the City should seek a cooperative solution with the property owners to provide infiltration within the
property.
iv. Churchill Downs The Churchill Downs subdivision is located in the upper portion of the Malletts Creek watershed. The
creek itself is a County Drain from Ann Arbor-Saline Road up to I-94. Local Ann Arbor stormwater pipes
collect stormwater flows from the local streets, as well as the Glen Leven neighborhood, which is

Stormwater Model Calibration and Analysis
Page 43
located north of Scio Church Road. Portions of Pittsfield Township, located west of I-94, also drain into
this area.
The County Drain sections of the stormwater system, along with other local pipes, reach their capacity
during the 50% AEP storm and surface flooding is predicted in the 10% AEP storm. Stormwater drainage
issues in this area were highlighted during the March 15, 2012 event, when surface flooding affected
numerous properties and streets.
The Upper Malletts Stormwater Conveyance Study, completed in early 2014, considered potential
stormwater improvements to control flooding under a storm equivalent to the March 15, 2012 event. It
should be noted that the 10%, 12-hour design standard has a much greater volume than the March 15,
2012 event, which was a shorter duration event, with a peak rainfall duration of only 75 minutes and a
total storm duration of less than 3 hours.
Figure 4-13 below shows the existing conditions modeling results for the 10% AEP storm for the
Churchill Downs and Lansdowne neighborhoods. Pipe capacity is exceeded for most of the stormwater
system and surface flooding is predicted in many locations.
Figure 4-13 – Existing conditions results for Churchill Downs (10% AEP, 12-hour storm)
Alternative 1: Green Streets Improvements
Alternative 1 was built around the City’s Green Streets policy for runoff control in right of way (ROW)
areas. Because of poor soils for infiltration, BMPs were assumed to provide capture and storage of the

Stormwater Model Calibration and Analysis
Page 44
first flush 1” of ROW runoff. These measures alone were not sufficient to achieve current stormwater
design standards, so some conveyance and storage improvements are also included in this alternative.
The alternative 1 conceptual layout is shown in Figure 4-14. More details on the individual stormwater
improvement features are included in alternative 2, which was developed with a focus on stormwater
storage.
Figure 4-14 – Conceptual Layout for Green Streets Alternative for Churchill Downs

Stormwater Model Calibration and Analysis
Page 45
Using this alternative, the model predicts that the stormwater system would be within capacity during
the 10% AEP storm, and the neighborhood outlet pipe at Ann Arbor – Saline Road would have a lower
peak water surface elevation, as shown in Figure 4-15.
Figure 4-15 – Water Surface Elevation comparison for Green Streets Alternative for Churchill Downs
Alternative 2: Local and Regional Storage
Because of the limited infiltration soils, some conveyance improvements and storage would be required
to supplement a BMP-focused alternative, as described in Alternative 1. Taking away the BMPs for ROW
runoff, more stormwater flows would need to be conveyed and stored but the overall nature of the
pipes and storage facilities would not need to change. As shown in Figure 4-16, the same locations are
utilized for conveyance and storage improvements, although the sizing does increase.
Notable features of this alternative are as follows:
Underground storage at Las Vegas Park – Storm drain pipes along Runnymede and Granada
would be upsized to convey 10% AEP design flows. These increased flows would be mitigated at
Las Vegas Park, where underground storage could be provided without significant impacts on
trees or park uses.
Winsted Blvd. diversion and Lawton Park underground storage – The current drainage pathway
for the tributary area north of Winsted Blvd. (including Weldon Blvd., Avondale Ave, and
connecting streets to the north) is west along Scio Church Road to the County Drain behind
properties on the west side of Churchill Drive. This alternative would divert flows from Winsted
Blvd. into a new storm drain pipe that would convey flows to a new underground storage basin
at Lawton Park.
Surface storage pond at Eisenhower Park – Stormwater flows from Maple Road, Tudor Drive,
and Dicken Drive are conveyed across Scio Church Road through an open channel pathway in
Eisenhower Park and then into the County Drain at Churchill Downs Park. Storage of these flows
is recommended in Eisenhower Park in a surface storage pond. Other options for storage could
be explored to the north along Maple Road or the I-94 corridor, but Eisenhower Park was
10% AEP Water Surface Elevation at Ann Arbor-Saline Road
WSE
L

Stormwater Model Calibration and Analysis
Page 46
assumed for the purposes of evaluating flow impacts in this study. The small storage area under
Scio Church Road west of Churchill could also be eliminated if stormwater flows from Covington
were diverted to Eisenhower Park. Under this scenario, the size of the Eisenhower basin would
need to be expanded to accommodate additional volume.
Upstream detention for areas west of I-94 – Currently, a 54” diameter pipe brings flow from I-94
and Oak Valley Drive under the freeway and into the Churchill Downs neighborhood at Churchill
Downs Park. While some properties in Pittsfield Township have stormwater controls, a control
basin at the freeway culvert would reduce peak flows into the county drain. This area is outside
of the City of Ann Arbor so any infrastructure improvements would have to be designed and
constructed in cooperation with the Washtenaw County Water Resources Commissioner, the
Michigan Department of Transportation (MDOT), and Pittsfield Township.
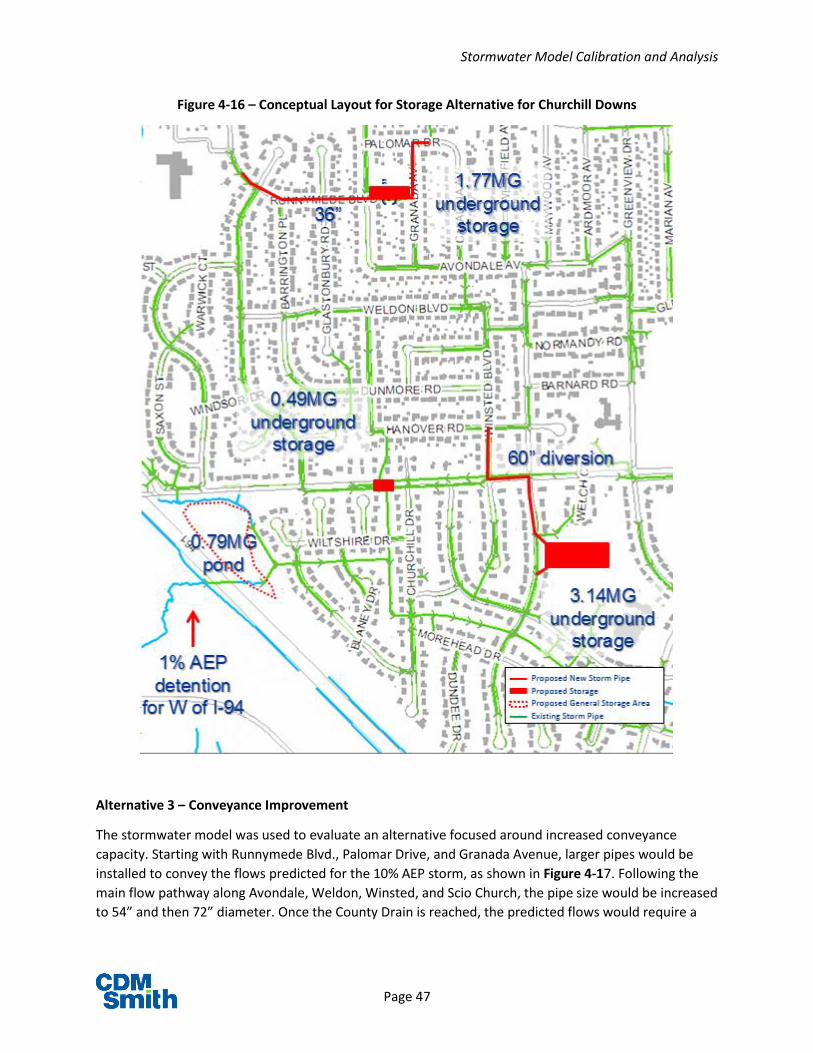
Stormwater Model Calibration and Analysis
Page 47
Figure 4-16 – Conceptual Layout for Storage Alternative for Churchill Downs
Alternative 3 – Conveyance Improvement
The stormwater model was used to evaluate an alternative focused around increased conveyance
capacity. Starting with Runnymede Blvd., Palomar Drive, and Granada Avenue, larger pipes would be
installed to convey the flows predicted for the 10% AEP storm, as shown in Figure 4-17. Following the
main flow pathway along Avondale, Weldon, Winsted, and Scio Church, the pipe size would be increased
to 54” and then 72” diameter. Once the County Drain is reached, the predicted flows would require a

Stormwater Model Calibration and Analysis
Page 48
parallel relief storm pipe of 72” to 84” in diameter. With limited space in the backyard areas, the relief
pipe would likely need to be installed along Churchill Drive, Delaware Drive or Morehead Drive.
Figure 4-17 – Conceptual Layout for Conveyance Alternative for Churchill Downs
With the increased conveyance capacity along the primary drainage pathway, peak flows during the 10%
AEP storm would be increased by nearly 100% and the peak water surface elevation at the
neighborhood outlet at Ann Arbor – Saline road would increase by 2 feet, as shown in Figure 4-18
below.

Stormwater Model Calibration and Analysis
Page 49
Figure 4-18 – Water Surface Elevation Comparison for Conveyance Alternative at Churchill Downs
Recommendation
Because of the soil characteristics in this area, a BMP-focused alternative cannot achieve 10% AEP
stormwater management without some conveyance and storage facilities. The incremental cost of
increasing the sizes of these facilities to handle the stormwater makes the storage-focused alternative
the best solution for this study area, as shown in Table 4-4.
Table 4-4 – Recommended Churchill Downs Solution
While the total cost of the improvements is high, the different features can be implemented selectively
to achieve improved stormwater system performance. The recommended improvements should be
10% AEP Water Surface Elevation at Ann Arbor-Saline Road
WSE
L

Stormwater Model Calibration and Analysis
Page 50
prioritized as follows to provide the greatest impacts on flows and on locations with predicted surface
flooding:
1. Winsted Blvd. diversion and Lawton Park underground storage - This storage basin and the
associated flow diversions and conveyance upgrades would have the greatest impact on
flooding locations south of Scio Church Road. However, it would also be the most costly ($7M -
$8M) due to the size of the underground storage required.
2. Surface storage pond at Eisenhower Park – Taken by itself, this storage feature has a less
significant impact on stormwater system performance and flooding because of its smaller
volume, but it would be much less costly, and would be necessary to eliminate flooding in
Churchill Downs. Depending on how flows from Covington Drive and from west of I-94 are
handled, this feature is estimated to cost $1.5M - $2M.
3. Underground storage at Las Vegas Park – This feature would primarily reduce street flooding
and overland conveyance along Runnymede and Avondale and would not significantly reduce
flooding in the Churchill Downs area. With an estimated cost of $5.5M - $6M, this element of
the storage alternative is only recommended in order to bring the entire study area to a
consistent design standard.
v. East University/South University Street flooding is predicted along East University Avenue and South University Avenue during the 10%
AEP storm as shown in Figure 4-19 below. This surface flooding was verified during the June 2013 storm.
Figure 4-19 – Existing conditions results for East University (10% AEP, 12-hour storm)
The stormwater pipe size along East University Avenue between South University and Willard is
particularly undersized, causing a bottleneck that reaches its capacity during the 50% AEP storm. In
addition to the predicted street flooding, below-grade loading docks and building entrances at the
University of Michigan’s School of Social Work Building are affected.
Alternative 1A – Engineered Storage and Green Streets

Stormwater Model Calibration and Analysis
Page 51
To complement streets that have already been reconstructed according to the Green Streets policy, this
alternative considered implementation of the policy along similar streets in the tributary area to this
study location. Washtenaw Avenue was not included because it is an MDOT roadway. Streets east of
Washtenaw were not included because they are not likely to be on the same reconstruction schedule as
the streets west of Washtenaw. With these assumptions for BMP implementation, some localized
stormwater storage along the Monroe Pedestrian Mall and under East University north of Hill would be
required to meet the 10% AEP design standard. This conceptual layout is shown in Figure 4-20.
Figure 4-20 – Conceptual Layout for Green Streets Alternative for East University
The model evaluation of this alternative indicates that flows would be reduced significantly at the
neighborhood outlet where East University meets Packard Road, as shown in Figure 4-21.

Stormwater Model Calibration and Analysis
Page 52
Figure 4-21 – Flow Hydrograph Comparison for Green Streets Alternative for East University
Alternative 1B – Engineered Storage and Green Streets with UM 1% AEP Detention
As a point of comparison for the relative impacts of ROW stormwater runoff and University property
runoff, this alternative includes the same ROW improvements as Alternative 1A, but also includes 1%
storm detention for University of Michigan properties located in the tributary area to this study location,
as shown in Figure 4-22. This detention requirement would be consistent with the requirements for a
new development in Washtenaw County.
Figure 4-22 – Conceptual Layout for Green Streets/UM Detention Alternative for East University
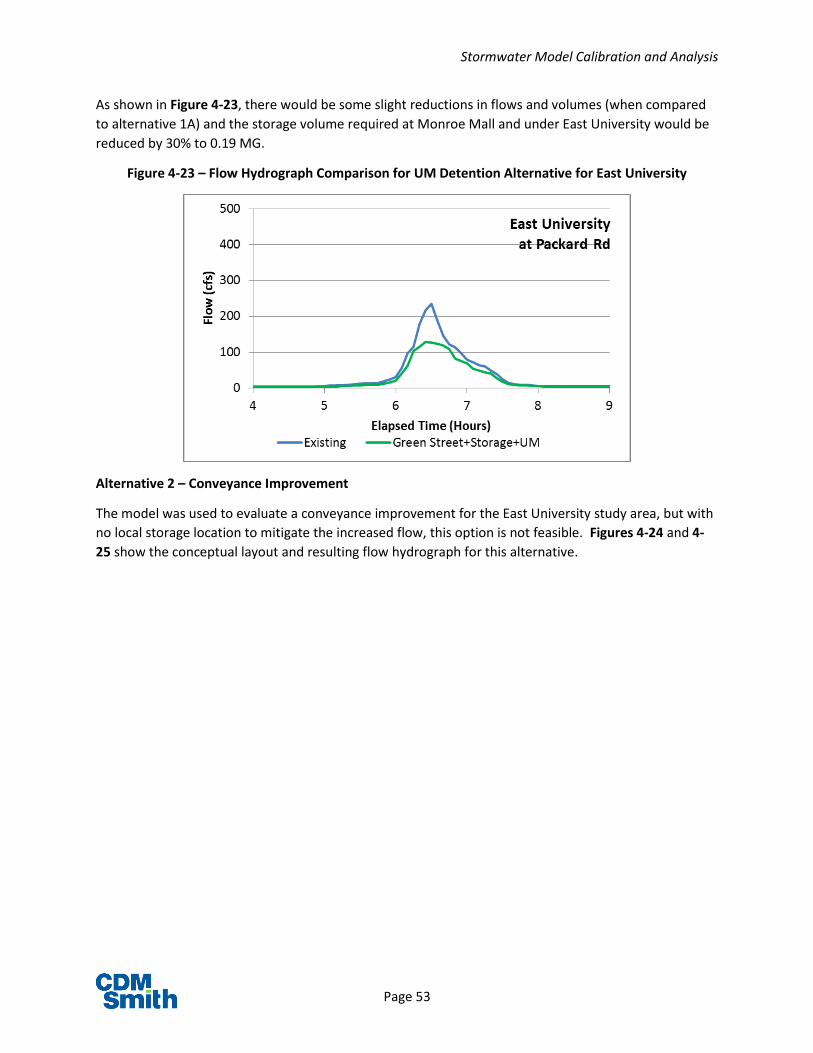
Stormwater Model Calibration and Analysis
Page 53
As shown in Figure 4-23, there would be some slight reductions in flows and volumes (when compared
to alternative 1A) and the storage volume required at Monroe Mall and under East University would be
reduced by 30% to 0.19 MG.
Figure 4-23 – Flow Hydrograph Comparison for UM Detention Alternative for East University
Alternative 2 – Conveyance Improvement
The model was used to evaluate a conveyance improvement for the East University study area, but with
no local storage location to mitigate the increased flow, this option is not feasible. Figures 4-24 and 4-
25 show the conceptual layout and resulting flow hydrograph for this alternative.

Stormwater Model Calibration and Analysis
Page 54
Figure 4-24 – Conceptual Layout for Conveyance Alternative for East University
Figure 4-25 – Flow Hydrograph for Conveyance Alternative for East University
Recommendation
The Green Streets improvements in combination with local storage are recommended for this study
area. Partnering with the University of Michigan to further reduce flows through local stormwater
management initiatives would reduce the storage volume requirements and should be pursued.

Stormwater Model Calibration and Analysis
Page 55
Table 4-5 – Recommended East University/South University Solution
vi. Mulholland Avenue This study location reviewed the Murray-Washington branch of Allen Creek between S. Seventh Street
and W. Washington. Surface flooding has been reported historically at Mulholland Avenue and at
Murray Avenue, with surcharging through the manhole on Mulholland reported most frequently. The
model analysis of existing conditions showed that the pipe capacity in this area is reached during the
50% AEP storm, with a flat pipe between Murray and Washington causing the worst bottleneck. Once
surface flooding begins at either Mulholland or Murray, overland flow is predicted between houses and
in backyards. This is shown in Figure 4-26.

Stormwater Model Calibration and Analysis
Page 56
Figure 4-26 – Existing conditions results for Murray-Washington Drain at Mulholland Avenue
Alternative 1A – Surface Storage at Slauson Field
Reduction of peak flows with upstream storage was evaluated for this location. In alternative 1A, a
shallow surface storage basin would be constructed in the open field adjacent to Slauson Middle School,
between Eighth Street and Crest Avenue, as shown in Figure 4-27. A control structure would be required
to restrict flows at this location and direct flow into the surface storage, and a low berm would be
required along Eighth Street to retain the flows in the field area. Other considerations to limit the
duration of flooding and to allow for proper post-event drainage would also be needed.
Figure 4-27 – Conceptual Layout for Surface Storage Alternative for Mulholland Ave
The location would allow for up to 2.2 MG of storage with an average depth of 2 feet. This volume
would delay the downstream peak by approximately 2 hours, reducing peak flows by 15%, as shown in
Figure 4-28.

Stormwater Model Calibration and Analysis
Page 57
Figure 4-28 – Flow Hydrograph for Surface Storage Alternative for Mulholland Avenue
Alternative 1B – Above Grade Storage Tank
This alternative would be similar to Alternative 1A, but it would put the storage volume into an above
grade storage tank near Crest Avenue. This would avoid issues with open surface storage but would take
up space that is currently used for soccer, sledding, and other recreational activities. Impacts on flows
would be similar to what is shown for Alternative 1A.
Alternative 2 – Conveyance Improvements
To address the localized flow restrictions, pipe upsizing could be performed between Mulholland and
Washington to meet the 10% design storm flow rates. As shown in Figure 4-29, this would require
construction in an older neighborhood, without much room to work, and large-diameter pipes. An
alternative routing along Murray to Washington could be considered but would also likely have conflicts
with other existing utilities, including sanitary sewer mains.
Figure 4-29 – Conceptual Layout for Conveyance Alternative for Mulholland Ave

Stormwater Model Calibration and Analysis
Page 58
The conveyance alternative would provide a significant improvement in reducing the frequency of
surface flooding, from the 20% storm to the 2% AEP storm. However, peak flows would increase
downstream in the Allen Creek watershed so mitigation of the peak flows would be recommended. This
could potentially be accomplished with a storage basin at the University of Michigan Parking lot at the
end of Krause Street but the proximity to the 100-year floodplain, and potentially high groundwater
levels, could limit the capabilities of this site. A storage volume of 1.6 MG would be needed for the 10%
AEP storm, which would be difficult to achieve.
Recommendation
Despite the potential difficulties of establishing an agreement to utilize an Ann Arbor Public Schools
property, the location characteristics and available space at Slauson Middle School make the surface
storage alternative the recommended solution. The probable cost for this location is potentially lower
than what is shown in Table 4-6 below since the engineering work and construciton required would be
minimal, but there would also be significant unknowns with requirements for safely and sustainably
storing stormwater at the site and for providing operations and maintenance support.
Table 4-6 – Recommended Mulholland Drive Solution
vii. Scio Church / S. Seventh Street Although this study location is also part of the Upper Malletts Creek area (along with the Churchill
Downs area described in section 4-C.4), the stormwater system is impacted by a separate tributary area
so it was analyzed separately. The existing stormwater conveyance system reaches capacity during the
50% AEP storm and surface flooding is predicted for the 10% AEP storm, for which overland flow is

Stormwater Model Calibration and Analysis
Page 59
predicted along Scio Church Road, Ascot Road, and Chaucer Court. These model findings were validated
during storms in 2010 and 2012, when surface flooding was experienced along Scio Church Road, Ascot,
and Chaucer, as shown in Figure 4-30. Some of these issues are also inter-related with overland flow in
the Village Oaks-Chaucer drain that can be affected by overland flow down Lambeth Drive.
Figure 4-30 – Existing conditions results for Scio Church / S. Seventh Street
Alternative 1 – BMPs / Engineered Storage
Because the soils in this area are not expected to be favorable for infiltration, any ROW stormwater
BMPs would function like local storage features. Specific locations were not identified for this study as
the impacts on the stormwater conveyance system would be similar and the most efficient locations
could be determined based on soil investigations and with input from the public. Potential storage
locations are shown in Figure 4-31, and these could be located under the pavement, in the ROW, or in
adjacent properties depending on all design considerations. Portions of the storage volume could also
be moved to other portions of the tributary area as roadway reconstruction projects are implemented.

Stormwater Model Calibration and Analysis
Page 60
Figure 4-31 – Conceptual Layout for Storage Alternative for Scio Church / S. Seventh Street
The impacts of this alternative on flow rates were evaluated at the outlet of the Lans Way storm sewer
into Malletts Creek. As shown in Figure 4-32, the peak flow is reduced by almost 50% and the volume is
released much more slowly over time.
Figure 4-32 – Flow Hydrograph for Storage Alternative for Scio Church / S. Seventh Street

Stormwater Model Calibration and Analysis
Page 61
Alternative 2 – Conveyance Improvements
For comparison with the local storage option presented in alternative 1, pipe upsizing would be required
along South Seventh, and all of Lans Way and all of Ascot Road to meet 10% AEP storm design
standards, as shown in Figure 4-33.
Figure 4-33 – Conceptual Layout for Conveyance Alternative for Scio Church / S. Seventh Street
While the cost of this alternative would be lower, it would increase peak flows to Malletts Creek by
nearly 100%, as shown in Figure 4-34.

Stormwater Model Calibration and Analysis
Page 62
Figure 4-34 – Flow Hydrograph for Conveyance Alternative for Scio Church / S. Seventh Street
Recommendation
To bring this study area to current stormwater design standards, a combination of engineered localized
storage and BMPs could be provided. While this approach is more costly than a pipe upsizing approach,
it would have the advantages of reducing peak flows to Malletts Creek, which better aligns with the
watershed’s Total Maximum Daily Load (TMDL) requirements and with the City’s goals for sustainability.
viii. Glendale/Charlton This study area was identified by local residents during the Phase I public meeting series, where it was
noted that street flooding and other stormwater and sanitary sewer issues have been experienced
during large storms. The existing conditions modeling for the area shows that the stormwater pipes are
at capacity during the 50% to 100% AEP storms, but surface flooding is generally limited to street
overland flow along Charlton Avenue, where there is no storm sewer currently, and street ponding at
low spots on Orchard Street and Glendale Drive. This is shown in Figure 4-35.

Stormwater Model Calibration and Analysis
Page 63
Figure 4-35 – Existing conditions results for Glendale/Charlton
Alternative 1 – Detention for upstream multi-family properties
Because the upstream area has a very small ROW area, when compared to the size of multi-family
properties, a ROW BMP option was not considered for this study area. Instead, a redevelopment
scenario was considered for the Charlton Apartments and Hillside Terrace properties. This alternative
assumes that 1% AEP storm detention would be provided for these two properties, which would align
with new development requirements. For the total area of approximately 8 acres as shown in Figure 4-
36, a storage volume of 0.44 MG would be required.
Figure 4-36 – Conceptual Layout for Upstream Detention Alternative for Glendale/Charlton
The impacts on flows in the downstream stormwater system would be dramatic for this alternative. As
shown in Figure 4-37 below, the detention storage reduces peak flows from 45 cubic feet per second
(cfs) to 15 cfs at Glendale Drive. This decrease in peak flows would eliminate street flooding for the
study area for the 10% AEP storm.

Stormwater Model Calibration and Analysis
Page 64
Figure 4-37 – Flow Hydrograph for Upstream Detention Alternative for Glendale/Charlton
Alternative 2 – Conveyance Improvement
This alternative considered an increase in system conveyance capacity by upsizing the existing storm
sewer from Pleasant Place to Glendale Drive, bulkheading the current connection to the Glendale Drive
storm sewer, and constructing a new storm pipe along Charlton to Virginia Avenue. Pipe upsizing would
also be needed along Virginia to Bemidji Drive. This conceptual layout is shown in Figure 4-38.
Figure 4-38 – Conceptual Layout for Conveyance Alternative for Glendale/Charlton
The conveyance improvement would generally be re-routing overland flow into a storm pipe so there is
no significant change in peak flow in the Murray-Washington Drain.

Stormwater Model Calibration and Analysis
Page 65
Recommendation
Either alternative would be feasible and effective at improving the stormwater system performance for
the Glendale/Charlton study area. The upstream detention storage would be consistent with the City’s
sustainability goals and the cost would be the responsibility of the property owners if the improvements
can be required as part of property redevelopment. However, to allow comparison with other
alternatives and study areas, the overall project cost is shown in Table 4-7.
Table 4-7 – Recommended Glendale/Charlton Solution
ix. Glen Leven Existing conditions modeling for the Glen Leven area predicts storm pipe capacity issues for the 50% AEP
storm and greater. Surface flooding is predicted for the 10% AEP storm, although the flows are generally
confined to the streets and Pioneer Woods as shown in Figure 4-39.
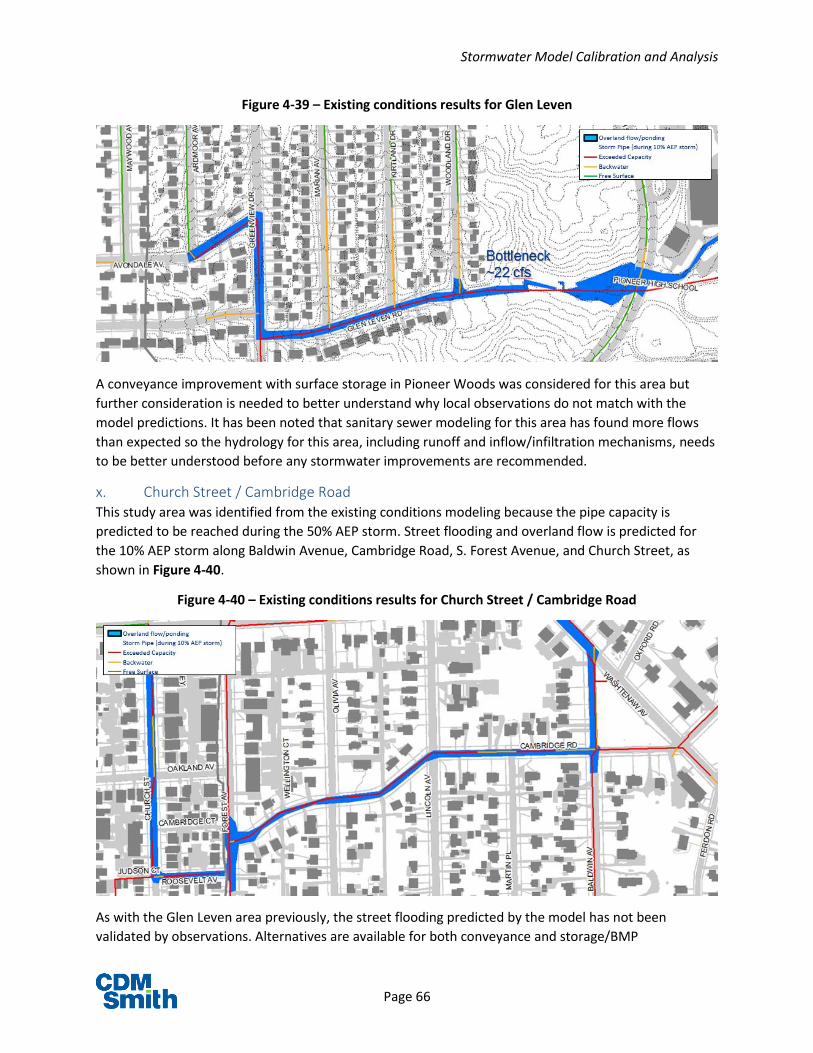
Stormwater Model Calibration and Analysis
Page 66
Figure 4-39 – Existing conditions results for Glen Leven
A conveyance improvement with surface storage in Pioneer Woods was considered for this area but
further consideration is needed to better understand why local observations do not match with the
model predictions. It has been noted that sanitary sewer modeling for this area has found more flows
than expected so the hydrology for this area, including runoff and inflow/infiltration mechanisms, needs
to be better understood before any stormwater improvements are recommended.
x. Church Street / Cambridge Road This study area was identified from the existing conditions modeling because the pipe capacity is
predicted to be reached during the 50% AEP storm. Street flooding and overland flow is predicted for
the 10% AEP storm along Baldwin Avenue, Cambridge Road, S. Forest Avenue, and Church Street, as
shown in Figure 4-40.
Figure 4-40 – Existing conditions results for Church Street / Cambridge Road
As with the Glen Leven area previously, the street flooding predicted by the model has not been
validated by observations. Alternatives are available for both conveyance and storage/BMP

Stormwater Model Calibration and Analysis
Page 67
improvements (see Figure 4-41 below) but they would require a significant capital cost and would be
addressing a problem that has not been shown to significantly impact properties. No stormwater
improvements are recommended for this study area.
Figure 4-41 – Conceptual Stormwater Improvements Layout for Church Street / Cambridge Road
xi. Village Oaks / Chaucer Court This location was identified from existing conditions modeling because the pipe capacity is reached
during the 50% AEP storm. Backyard flooding between Village Oaks Court and Chaucer Court is
predicted during the 10% AEP storm, along with street flooding in the cul-de-sac of Village Oaks Court,
as shown in Figure 4-42.
Figure 4-42 – Existing conditions results for Village Oaks / Chaucer Court

Stormwater Model Calibration and Analysis
Page 68
A detailed study of this area was performed in 2013 and a regional detention basin was recommended
for the area north of Village Oaks Court. The alternatives analysis for this area consisted of verifying the
performance of the proposed basin using the current version of the stormwater mode, as shown in
Figure 4-43.
Under the proposed alternative, the peak flow coming from the basin would be reduced from 40 cfs to 1
cfs. The flows from Village Oaks Court would not be affected but the backyard flooding would be
reduced in frequency from the 10% AEP storm to the 2% AEP storm.
Figure 4-43 – Conceptual Layout for Detention Alternative at Village Oaks/Chaucer Court
xii. Parkwood/Pittsfield Village This study area was identified during the public meetings in Phase I of the project. Residents reported
street flooding during large storms and overland flow into the open space between buildings between
Fernwood and Parkwood. The existing conditions modeling showed a pipe along Parkwood with a
capacity of less than 3 cfs, which is not sufficient to convey the 100% AEP storm. The model predicts that
flooding would be confined to the street area as shown in Figure 4-44, but other factors such as inlet
blockages could lead to more extensive surface flooding.

Stormwater Model Calibration and Analysis
Page 69
Figure 4-44 – Existing conditions results for Parkwood / Pittsfield
Alternative 1 – Conveyance and Storage
Because of the relatively small tributary area, and the capacity issue with the existing pipe, some
conveyance improvements are recommended along Pittsfield and Parkwood. Alternative 1 includes the
recommended pipe upsizing as shown in Figure 4-45, but it also includes a new connection to the
surface depression area off of Parkwood Avenue to store excess runoff so flows are not increased to
Malletts Creek. The predicted outflow hydrograph is shown in Figure 4-46.
Figure 4-45 – Conceptual Layout for Pittsfield/Parkwood Storage/Conveyance

Stormwater Model Calibration and Analysis
Page 70
Figure 4-46 – Flow Hydrograph for Conveyance/Storage Alternative at Pittsfield/Parkwood
Alternative 2 – Conveyance Improvement
Alternative 2 would include the pipe upsizing only. This would result in a 50% increase in peak flows to
Malletts Creek, although there would be no change in the predicted water surface elevation. This result
is shown in Figure 4-47.
Figure 4-47 – Flow Hydrograph for Conveyance Alternative at Pittsfield/Parkwood
Recommendation
The property on Washtenaw Avenue between Pittsfield Blvd. and Yost Blvd. contributes approximately
25% of the runoff to this study area so redevelopment of that property with stormwater controls should
be a priority. Even with detention at that site, however, pipe upsizing would be necessary along
Pittsfield and Parkwood to convey the 10% AEP storm. Either of the proposed alternatives would be
effective at addressing the stormwater system performance issues and selection should be made based
on the willingness of Pittsfield Village property management to allow surface storage. The surface
storage solution in the lawn areas between units could be adapted to other portions of the property to
address other stormwater issues. This is presented in Table 4-8.
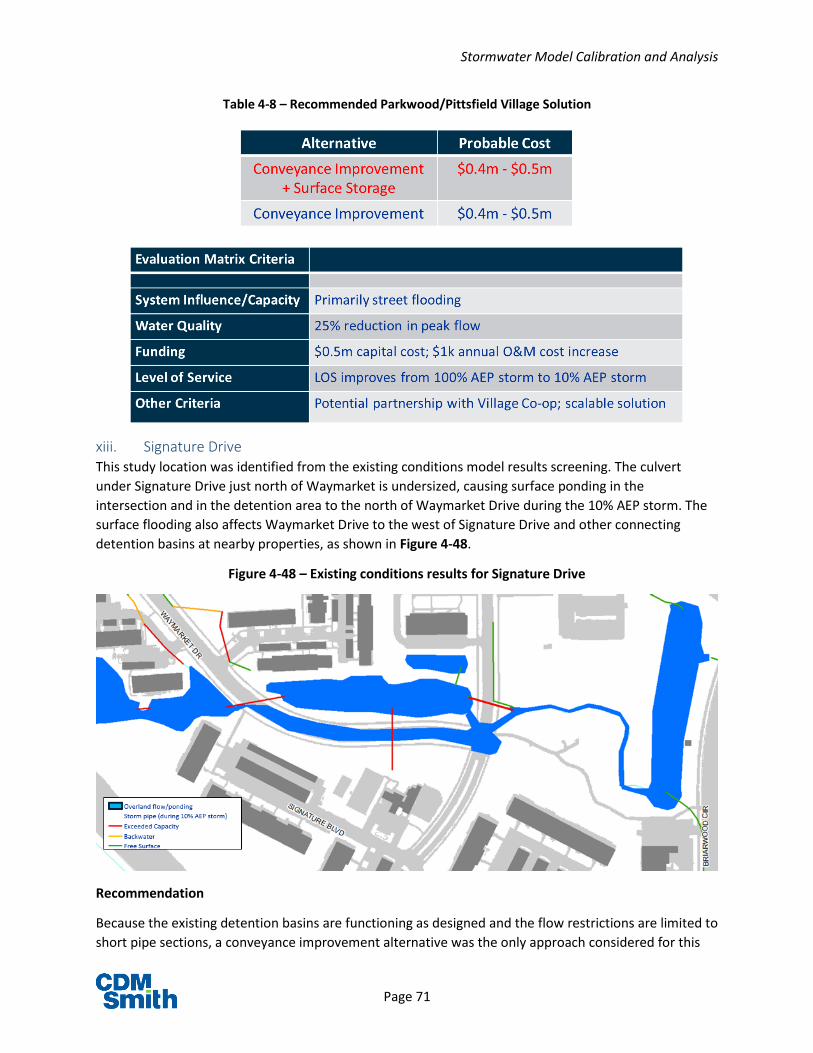
Stormwater Model Calibration and Analysis
Page 71
Table 4-8 – Recommended Parkwood/Pittsfield Village Solution
xiii. Signature Drive This study location was identified from the existing conditions model results screening. The culvert
under Signature Drive just north of Waymarket is undersized, causing surface ponding in the
intersection and in the detention area to the north of Waymarket Drive during the 10% AEP storm. The
surface flooding also affects Waymarket Drive to the west of Signature Drive and other connecting
detention basins at nearby properties, as shown in Figure 4-48.
Figure 4-48 – Existing conditions results for Signature Drive
Recommendation
Because the existing detention basins are functioning as designed and the flow restrictions are limited to
short pipe sections, a conveyance improvement alternative was the only approach considered for this
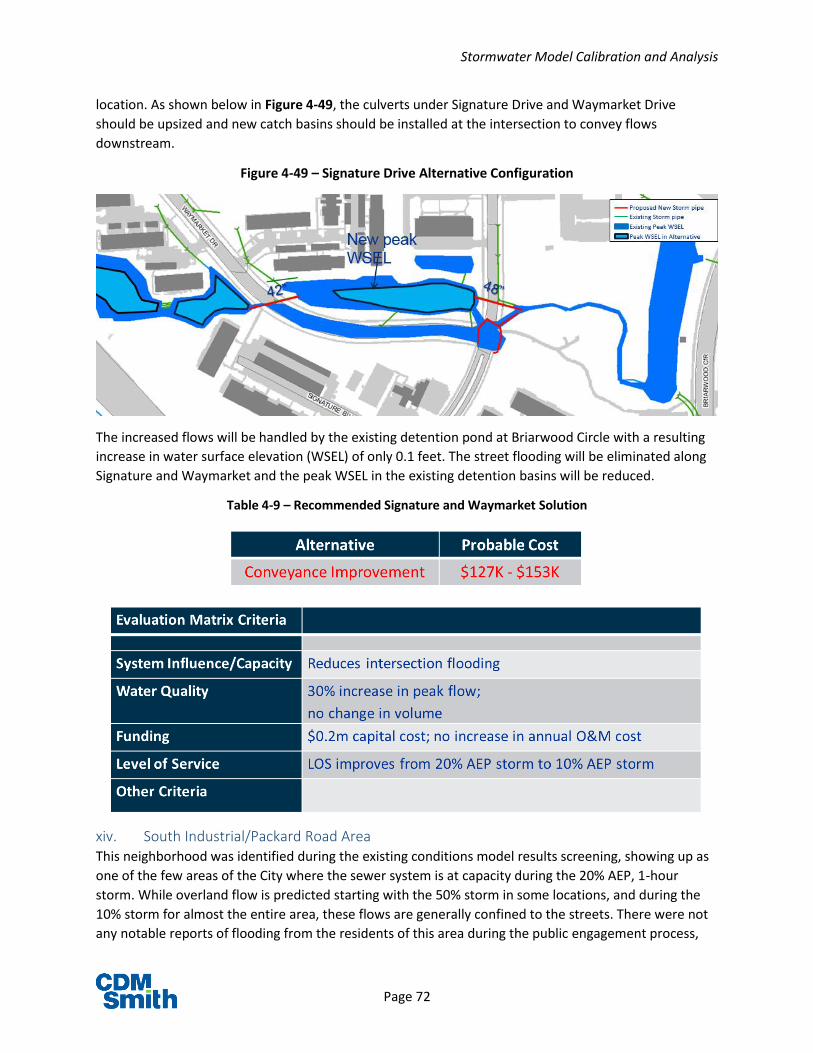
Stormwater Model Calibration and Analysis
Page 72
location. As shown below in Figure 4-49, the culverts under Signature Drive and Waymarket Drive
should be upsized and new catch basins should be installed at the intersection to convey flows
downstream.
Figure 4-49 – Signature Drive Alternative Configuration
The increased flows will be handled by the existing detention pond at Briarwood Circle with a resulting
increase in water surface elevation (WSEL) of only 0.1 feet. The street flooding will be eliminated along
Signature and Waymarket and the peak WSEL in the existing detention basins will be reduced.
Table 4-9 – Recommended Signature and Waymarket Solution
xiv. South Industrial/Packard Road Area This neighborhood was identified during the existing conditions model results screening, showing up as
one of the few areas of the City where the sewer system is at capacity during the 20% AEP, 1-hour
storm. While overland flow is predicted starting with the 50% storm in some locations, and during the
10% storm for almost the entire area, these flows are generally confined to the streets. There were not
any notable reports of flooding from the residents of this area during the public engagement process,
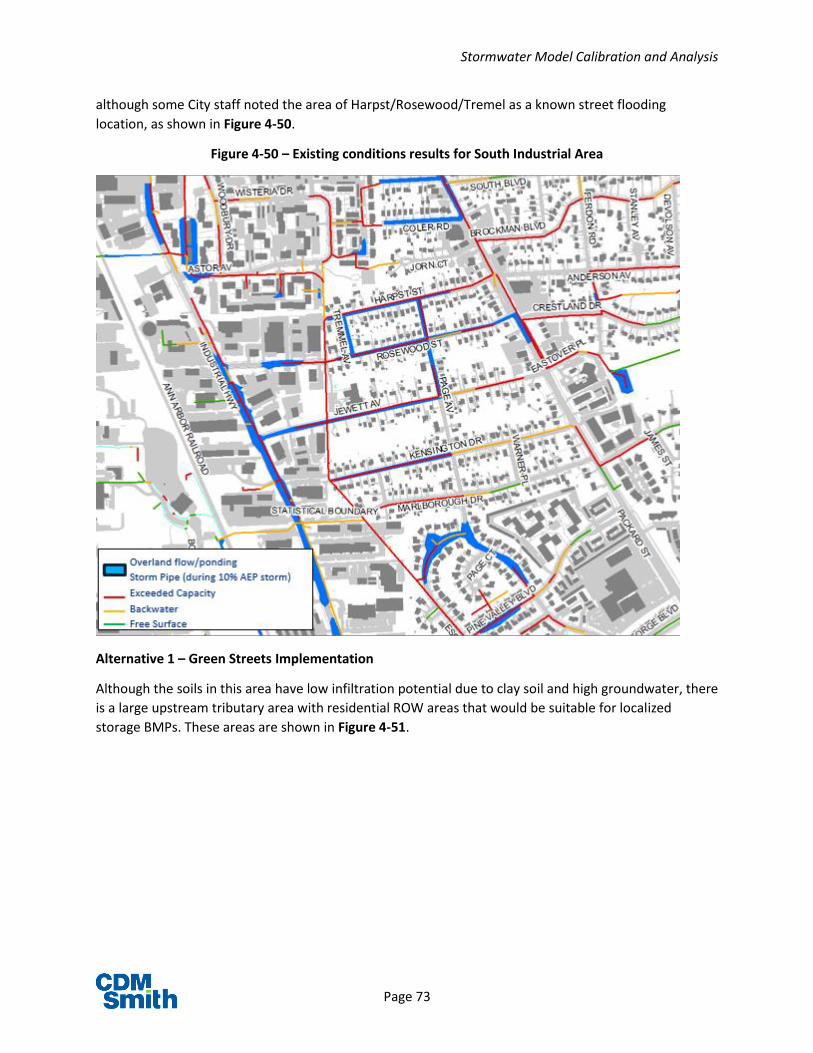
Stormwater Model Calibration and Analysis
Page 73
although some City staff noted the area of Harpst/Rosewood/Tremel as a known street flooding
location, as shown in Figure 4-50.
Figure 4-50 – Existing conditions results for South Industrial Area
Alternative 1 – Green Streets Implementation
Although the soils in this area have low infiltration potential due to clay soil and high groundwater, there
is a large upstream tributary area with residential ROW areas that would be suitable for localized
storage BMPs. These areas are shown in Figure 4-51.

Stormwater Model Calibration and Analysis
Page 74
Figure 4-51 – Conceptual Layout for Green Streets Alternative for S. Industrial Area
The reduced runoff resulting from these improvements would minimize street flooding and overland
flow for the 20% AEP storm. The pipe capacity would still be exceeded in the 10% AEP storm in most
locations. Model results for the Green Streets alternative under the 20% AEP storm are shown in Figure
4-52.

Stormwater Model Calibration and Analysis
Page 75
Figure 4-52 – Green Streets Alternative Pipe Capacity Results for S. Industrial Area
Recommendation
Because of the minimal impacts and the extensive scope of work, this area is not recommended as a
priority for stormwater improvements. As conditions allow for Green Streets implementation as part of
other neighborhood improvements, however, these efforts should be made to help reduce runoff flows
and minimize the frequency of flooding in downstream areas.
xv. Traver/Barton This study location has one pipe segment along Barton Drive south of Traver Road that was identified as
undersized during existing conditions modeling. Currently, the pipe capacity is reached during the 100%
AEP storm, and the collection system can be overwhelmed by overland flow coming downhill along
Traver. The curbs along Barton and the current placement of catch basins also prevent street flow from
leaving the roadway in some locations as shown in Figure 4-53.

Stormwater Model Calibration and Analysis
Page 76
Figure 4-53 – Existing conditions results for Traver/Barton
Recommendation
Due to surface grades, and a low potential for runoff infiltration, a conveyance alternative is
recommended for this location. The existing pipes along Traver and Barton should be substantially
upsized from 12” diameter to 30” and 36”, respectively, as shown in Figure 4-54. In addition, curb cuts
at the Traver Creek crossing should be built to allow for overland drainage into Traver Creek during
intense rainfall events. These improvements would have a negligible increase in WSEL and peak flows in
Traver Creek. This recommendation is shown in Table 4-10.
Figure 4-54 – Conceptual Layout for Conveyance Improvement Alternative for Traver/Barton

Stormwater Model Calibration and Analysis
Page 77
Table 4-10 – Recommended Traver/Barton Solution
xvi. Glendale Circle at Virginia Park Noted in section 4-A, this site was not originally included as part of the preliminary screening since the
flooding area is part of an open channel drainage that offers natural detention storage, and structures
have not historically been affected. Also, this site is only 3,500 feet upstream of the Mulholland site
(Section 4-C.6). However, the 54” storm pipe that passes beneath Virginia Park did not have sufficient
capacity to handle peak flow during the 20% AEP storm, and some property owners along Glendale
Circle have noted that flooding encroaches onto their properties, as shown in the Figure 4-55.
Figure 4-55 – Ponding at Wooded Area behind Glendale Circle

Stormwater Model Calibration and Analysis
Page 78
Two storage alternatives were considered for this site. A conveyance improvement alternative is
prohibitive because of existing flooding issues at Mulholland Drive downstream. Similar to the analysis
for that site, implementation of the Green Streets policy alone would not eliminate flooding issues for
the 10% AEP storm. Ponding at the wooded area behind Glendale Circle would drop by 3 inches at most.
The current peak flood depth in existing conditions for the 10% storm is predicted to be 4’.
The impacts of other stormwater management activities in tandem with the Green Streets policy are
evaluated in Alternative 3.
Alternative 1 – Deep Underground Storage at Virginia Park
This alternative includes moving existing surface storage volume to an underground storage tank at
Virginia Park. Due to the significant difference in elevation between the wooded area and Virginia Park,
the tank would have to be installed nearly 30 feet below grade. The size of the tank would be 2.7 MG to
reduce ponding at the wooded area to below 1 foot in depth. The storage would include a pipe
connecting to inlet (88-64592) at the wooded area and a restricted outlet control structure connecting
to the adjacent storm sewer. Runoff would be diverted to the storage once the 54” storm sewer
downstream is surcharged. Figure 4-56 shows the general location and configuration of the
underground storage tank.
Figure 4-56 – Location of Underground Storage at Virginia Park

Stormwater Model Calibration and Analysis
Page 79
Alternative 2 – Surface Storage Upstream
This alternative aims at reducing peak flows entering the Glendale Circle backyard area by detaining
additional volumes in open channel storage at Westwood Apartments to the west and in localized
depression storage in Eberwhite Woods. Outlet restrictors would be installed at these locations to
reduce the overall peak flow to below 270 cfs. Figure 4-57 shows the locations of the additional
upstream storage areas and outlet restriction devices. While this alternative would reduce potential
flooding risk for properties on Glendale Circle, it would effectively move surface flooding to other areas.
Eberwhite Woods is a sensitive nature area and increasing the frequency and extent of surface flooding
could be problematic.
Figure 4-57 – Location of Upstream Surface Storage for Glendale Circle / Virginia Park
Alternative 3 – Stormwater Management
Ponding at the wooded area could be reduced to less than 6 inches in the 10% AEP storm if the following
stormwater management activities were implemented altogether in upstream areas.
▪ 1% storm on-site detention for all redevelopment of commercial properties on W Stadium Blvd
and S Maple Road
▪ Storage of 1-inch runoff from impervious surface of residential properties
▪ Green Streets with on-site infiltration for City ROW areas upstream
The most effective of these activities would be the on-site detention for commercial and multi-family
residential properties. As shown in Figure 4-58 below, the W. Stadium and S. Maple/Pauline areas have
some large properties that were built without stormwater controls.

Stormwater Model Calibration and Analysis
Page 80
Figure 4-58 – Commercial and Multi-Family Residential Parcels with Redevelopment Potential
Recommendation
Each of the storage alternatives would effectively be moving the volume that is currently in the Glendale
Circle backyard area to other locations where the storage may have reduced impacts on property
owners. Since these other impacts have not been evaluated in detail, a long term stormwater
management strategy is the recommended approach to incrementally reduce flooding at this location.
These improvements would spread the cost impacts out over time and would benefit both this location
and the Allen Creek watershed overall. Where a portion of the surface storage features in alternative 2

Stormwater Model Calibration and Analysis
Page 81
are shown to be feasible, these could be implemented to provide additional surface flooding mitigation.
The recommended solution is shown in Table 4-11.
The stormwater system improvement alternatives presented for this location assumed ponding in the
Glendale Circle backyard area would be reduced to less than 1 foot. Further studies should determine
the acceptable level of ponding at the backyard to utilize the already-available natural surface storage.
The proposed alternatives could all be scaled back accordingly.
Table 4-11 – Recommended Glendale Circle at Virginia Park Solution
Alternative Probable Cost
Underground Storage $10 - $11m
Surface Storage $1.7 - $1.8m
Long-term Stormwater Management $5.1 - $5.8m + private funding
Evaluation Matrix Criteria
System Influence/Capacity Reduces surface flooding that impacts private properties
Water Quality 20% reduction in peak flow
Funding $6M capital cost for ROW areas; Additional cost for redevelopment and residential rain gardens
Level of Service Improves from 20% AEP to 10% AEP storm
Other Criteria Stormwater management meets sustainability goals; partnership opportunities with private property owners
xvii. Westgate and Maple Village Redevelopment During review of existing conditions model results, it was suggested that the impacts of detention for
properties with large areas of impervious surface should be considered. In the Allen Creek watershed,
the Westgate and Maple Village shopping centers were built prior to stormwater detention
requirements, and as a result have large roof areas and parking lots that discharge to the stormwater
system without any runoff controls. In total, the impervious area of these two parcels is greater than 50
acres in size.
The existing conditions model results for the stormwater network in the Westgate and Maple Village
shopping centers are shown in Figure 4-59.

Stormwater Model Calibration and Analysis
Page 82
Figure 4-59 – Existing conditions results for Westgate/Maple Village
For this evaluation, the model was adjusted to include 1% AEP storm detention for these parcels. The
northern portion of Westgate (which drains to the north) would require a detention volume of 0.91 MG.
Maple Village would require a detention volume of 2.82 MG.
Under the 10% AEP storm, most of the impacts of the redevelopment would be seen immediately
downstream of the new detention at Vets Park. Under existing conditions, the 10% storm causes surface
flooding through much of the park area, and this flooding would be substantially reduced by the
upstream detention, as shown in Figure 4-60 below. However, because Vets Park is currently providing
this storage, the impacts of new detention farther downstream are minimal. Surface flooding depths at
depression areas along the West Park-Miller drain would be reduced by less than 0.5 feet and there
would be negligible changes in water levels and flow rates at Revena Blvd. and at locations downstream.
These impacts are shown in Figure 4-60. There would also be negligible impacts on FEMA floodplain
elevations under 1% AEP storm simulations.
Figure 4-60 – Model results for Redevelopment Scenario for Westgate/Maple Village

Stormwater Model Calibration and Analysis
Page 83
xviii. Plymouth and Green Road Redevelopment Similar to the evaluation in the previous section, a redevelopment scenario was considered for the
commercial properties at Plymouth Road and Green Road. This includes the Red Roof Inn property and
the office complexes on the northeast corner, and the Holiday Inn, shopping center, and office complex
located on the southeast corner, as outlined in yellow in the figure below. The configuration in this area
is shown in Figure 4-61.
Figure 4-61 – Existing conditions results for Plymouth and Green Road
1% AEP storm detention for these properties, which total around 27 acres in area, would require a 2 MG
detention volume. Because of the nature of the Millers Creek watershed, this area is not generally prone
to flooding issues, but the properties themselves would have improved drainage and street flooding
would be minimized on Green Road and at the Green Road commuter parking lot. There would be
negligible changes in WSEL at and downstream of Baxter Road. The reduction in peak flows would be
beneficial in reducing channel erosion issues.
Additional analysis of the impacts of applying new detention requirements during redevelopment is
described in Section 5, when it is included with broader stormwater management activities in future
condition analysis.
D. Stormwater Improvement Conclusions The stormwater improvements evaluation generated a list of recommended improvements to address
study areas where stormwater system performance is not meeting the current design standards. It has
been noted that some of the study locations have not been validated by actual observations, but it is
important to recognize that the 10% AEP, 12-hour storm is a large rain event, and that some portions of
the City may not have experienced a storm of this size under current development conditions.
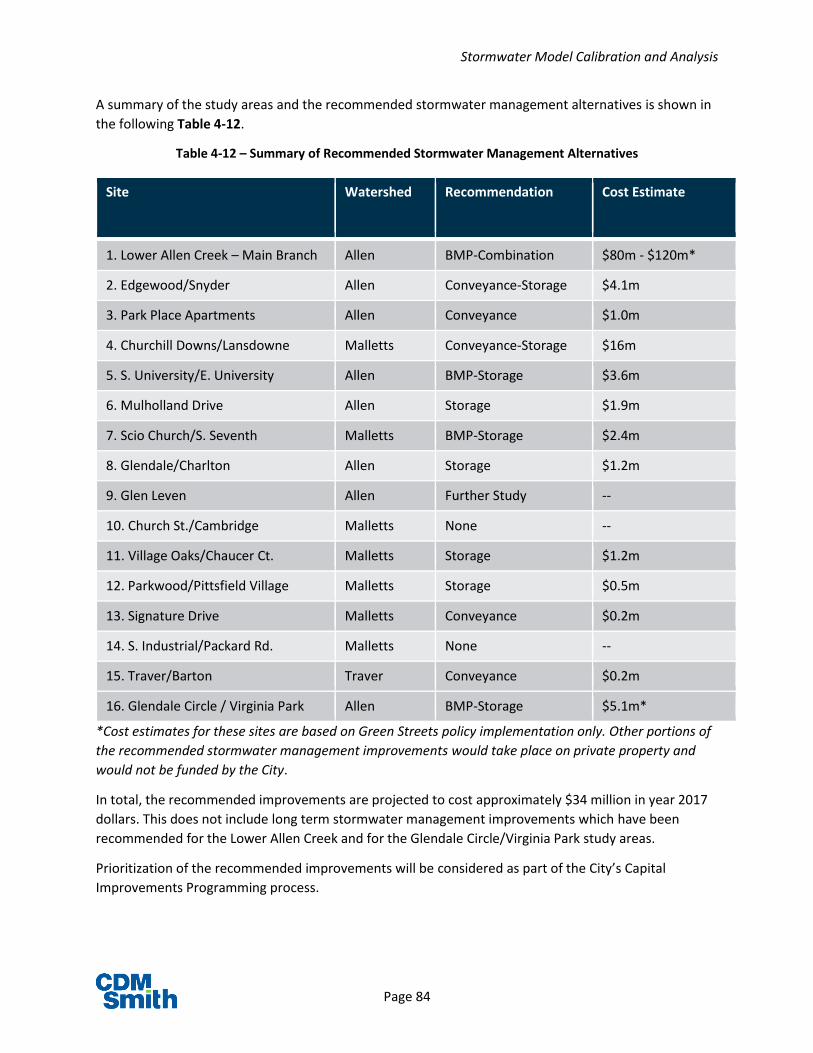
Stormwater Model Calibration and Analysis
Page 84
A summary of the study areas and the recommended stormwater management alternatives is shown in
the following Table 4-12.
Table 4-12 – Summary of Recommended Stormwater Management Alternatives
Site Watershed Recommendation Cost Estimate
1. Lower Allen Creek – Main Branch Allen BMP-Combination $80m - $120m*
2. Edgewood/Snyder Allen Conveyance-Storage $4.1m
3. Park Place Apartments Allen Conveyance $1.0m
4. Churchill Downs/Lansdowne Malletts Conveyance-Storage $16m
5. S. University/E. University Allen BMP-Storage $3.6m
6. Mulholland Drive Allen Storage $1.9m
7. Scio Church/S. Seventh Malletts BMP-Storage $2.4m
8. Glendale/Charlton Allen Storage $1.2m
9. Glen Leven Allen Further Study --
10. Church St./Cambridge Malletts None --
11. Village Oaks/Chaucer Ct. Malletts Storage $1.2m
12. Parkwood/Pittsfield Village Malletts Storage $0.5m
13. Signature Drive Malletts Conveyance $0.2m
14. S. Industrial/Packard Rd. Malletts None --
15. Traver/Barton Traver Conveyance $0.2m
16. Glendale Circle / Virginia Park Allen BMP-Storage $5.1m*
*Cost estimates for these sites are based on Green Streets policy implementation only. Other portions of
the recommended stormwater management improvements would take place on private property and
would not be funded by the City.
In total, the recommended improvements are projected to cost approximately $34 million in year 2017
dollars. This does not include long term stormwater management improvements which have been
recommended for the Lower Allen Creek and for the Glendale Circle/Virginia Park study areas.
Prioritization of the recommended improvements will be considered as part of the City’s Capital
Improvements Programming process.

Stormwater Model Calibration and Analysis
Page 85
5. Stormwater Management Scenarios
A. Citywide Stormwater Management Scenarios The stormwater model was utilized to evaluate the potential impacts of expanding low-impact
development (LID) and green infrastructure (GI) concepts citywide to the stormwater system. LID and GI
are decentralized stormwater best management practices (BMPs) that infiltrate and/or detain runoff
close to its source. By reducing site runoff and peak flow rates, these features can improve the level of
service provided by the existing stormwater system. In this study, the following stormwater strategies
were considered:
Green Streets: The City’s Green Streets policy includes on-site infiltration standards for public
roadway and right-of-way (ROW) construction and reconstruction projects. The policy calls for
infiltration of 1 inch (1st flush), 2.35 inches (50% annual chance 24-hour storm) or 3.26 inches
(10% annual chance 24-hour storm) of total precipitation volume that falls on the ROW,
depending on site soil conditions, slope and proximity to floodplain (Table 5-1).
Table 5-1 – Infiltration Standard Excerpted from Green Streets Policy
Figure 5-1 shows the applicable infiltration standard with streets color-coded based on soil map
information. It is assumed that on-site infiltration is not available in areas with groundwater
levels within 5 feet of the ground surface. Streets already reconstructed with Green Street
concepts were not included in the mapping and the model analysis of this approach.

Stormwater Model Calibration and Analysis
Page 86
Figure 5-1 – Potential Infiltration for Green Street Application
Rain Gardens for Single-/Two-Family Homes: Currently the City requires storage of 1st flush (1
inch) of runoff for new impervious area on an individual single- or two-family parcel if the net
increase in impervious area exceeds 200 sf. There are residential stormwater credits available
for customers that become RiverSafe Home Partners, install rain barrels, or create a rain
garden, cistern, or drywell. Support for rain garden design and construction is available through
Washtenaw County’s Rain Garden Assistance Program, and rain gardens have already been
installed through many areas of the City, as shown in Figure 5-2. This scenario assumes that
these rain garden initiatives were applied broadly to allow for storage of first flush for all
impervious surface areas for all single- and two-family homes citywide. For a typical parcel, this

Stormwater Model Calibration and Analysis
Page 87
would require a rain garden with a capacity of approximately 1500 gallons. This would add up
to 67MG of rain garden storage if applied citywide.
Figure 5-2 – Residential Rain Gardens in the City of Ann Arbor
(Source: Washtenaw County Rain Garden Assistance Program, colors indicate different years of rain
garden installations)
University of Michigan Redevelopment: This scenario assumes that the University of Michigan’s
stormwater management strategy would align with new development requirements of the City
and Washtenaw County Water Resources Commissioner’s Office (WCWRC). This would include
infiltrating at least the 1st inch of runoff (1st flush) and detaining runoff from 1% AEP 24-hour
storm events for all University properties discharging into County drains or the City’s storm
sewer system. Most of Central and Athletic Campus areas drain to Allen Creek while the eastern
part of North Campus drains to Millers Creek.
Downtown Stormwater Management: On top of Green Streets in the downtown area, this
scenario assumes 1% AEP storm detention would be provided for the entire tributary area
between Catherine Street to the north, State Street to the east, Jefferson Street to the south
and railroad to the west. This strategy is based on recent experience with stormwater
management work on South Fourth Avenue, and other soil testing in downtown areas, which
indicated that 1% AEP storm detention and infiltration can be achieved. These areas are all
tributary to Allen Creek and are shown in brown in Figure 5-3.
New Development and Redevelopment of Commercial and Multi-Family Parcels: This
stormwater management approach accounts for redevelopment of commercial, multi-family

Stormwater Model Calibration and Analysis
Page 88
and public properties larger than 1 acre that are currently without any existing on-site
stormwater control. Following the latest WCWRC’s stormwater design standards, 1% storm
detention would be provided along with storage/infiltration of at least the first flush. Figure 5-3
maps the locations of these properties in orange. These properties are concentrated around W.
Stadium Blvd in the upper tributary area of Allen Creek, S. Industrial, Research Park, and
Washtenaw/Huron Parkway areas in Malletts Creek. This also includes undeveloped areas at
Dhu Varren/Pontiac Trail and Dhu Varren/Nixon Road that are expected to have future large-
scale residential development.
Figure 5-3 – Potential Infiltration and 1% Storm Detention Areas

Stormwater Model Calibration and Analysis
Page 89
These different stormwater management strategies were evaluated in the modeling for Lower Allen
Creek, which was presented in Section 4C of this report. That analysis compared the relative impacts of
the different strategies at different locations along Allen Creek and under different design storm
scenarios. The next section presents our analysis of city-wide application of combined strategies under
future condition scenarios.
B. Future Conditions The stormwater management strategies described in the previous section are to be broadly applied and
should be considered as long-term stormwater management initiatives. Three (3) future scenarios were
included: 2040, 2065 and 2115 to show potential progress over time. It was assumed that all of these
strategies would be completed citywide by 2115 (in 100 years), and the levels of completion were
determined based roughly on the redevelopment/reconstruction interval for each type of property. The
commercial and multi-family percentages were weighted between the downtown properties and those
outside of the downtown area. The actual implementation schedule for each scenario would vary
depending on feasibility, funding availability, and changes in stormwater management policies. For the
purposes of this evaluation, Table 5-2 shows the assumption of percent completion for each of the
future conditions scenarios.
Table 5-2 – Future Scenarios Assumptions for Stormwater Management Strategies
Future Scenario 2040 2065 2115
Green Streets 25% 50% 100%
Residential Rain Gardens 50% 100% 100%
University Redevelopment 50% 100% 100%
Downtown Storage and Infiltration 25% 50% 100%
Commercial and Multi-Family Redevelopment
45% 85% 100%
Appendix B contains a series of maps showing the combined impact of all stormwater strategies in
2040, 2065 and 20115 scenarios under current 20% AEP 1-hour and 10% AEP 12-hour design storms for
each watershed.
Figures 5-4 to 5-8 below show hydrographs at the downstream end of each major creekshed under the
10% AEP storm for the different future condition scenarios, and are compared to the current conditions.
These strategies could reduce both runoff volume and peak flow and improve the level of service in
large portions of the drainage system. For example, peak flow exiting Malletts Creek could be dropped
by more than 50% by 2115 because the Mary Beth Doyle Park regional detention basin would no longer
be full and overflow during the 10% AEP storm.
However, as shown in the maps in Appendix B, all of these strategies combined could not completely
eliminate flooding in the 1% AEP floodplain and in other frequent flooding areas. For example, ponding
at Edgewood/Snyder would be reduced by almost 3 feet but not eliminated during the 10% AEP storm.
BMPs like residential rain gardens, as well as those employed as part the Green Streets policy, are
designed to be most effective in more frequent storms that are much smaller in size and less intense
than the 10% and 20% AEP design storm events evaluated here.

Stormwater Model Calibration and Analysis
Page 90
Results of the stormwater management modeling indicate that the greatest impact of the combined
strategies in terms of peak flow reduction would be seen in Malletts Creek, along with Traver Creek and
Millers Creek. The peak flow impacts are less pronounced for Allen Creek and for Swift Run. The results
for Allen Creek are noticeably unstable at lower flow rates. This instability in the model predictions is
due to the location of the observation point at the mouth of Allen Creek, where it is affected by the
assumed level of the Huron River.
Figures 5-4 to 5-8 – Flow Hydrographs for Current and Future Conditions (10% AEP, 12-Hr Storm)
The results shown in Figures 5-4 to 5-8 once again indicate that significant improvements in stormwater
system performance can be achieved through stormwater management policies and programs. Section
4.C.i provides a comparison of the individual stormwater management strategies, and includes
recommendations for future stormwater management policies in the Allen Creek watershed.
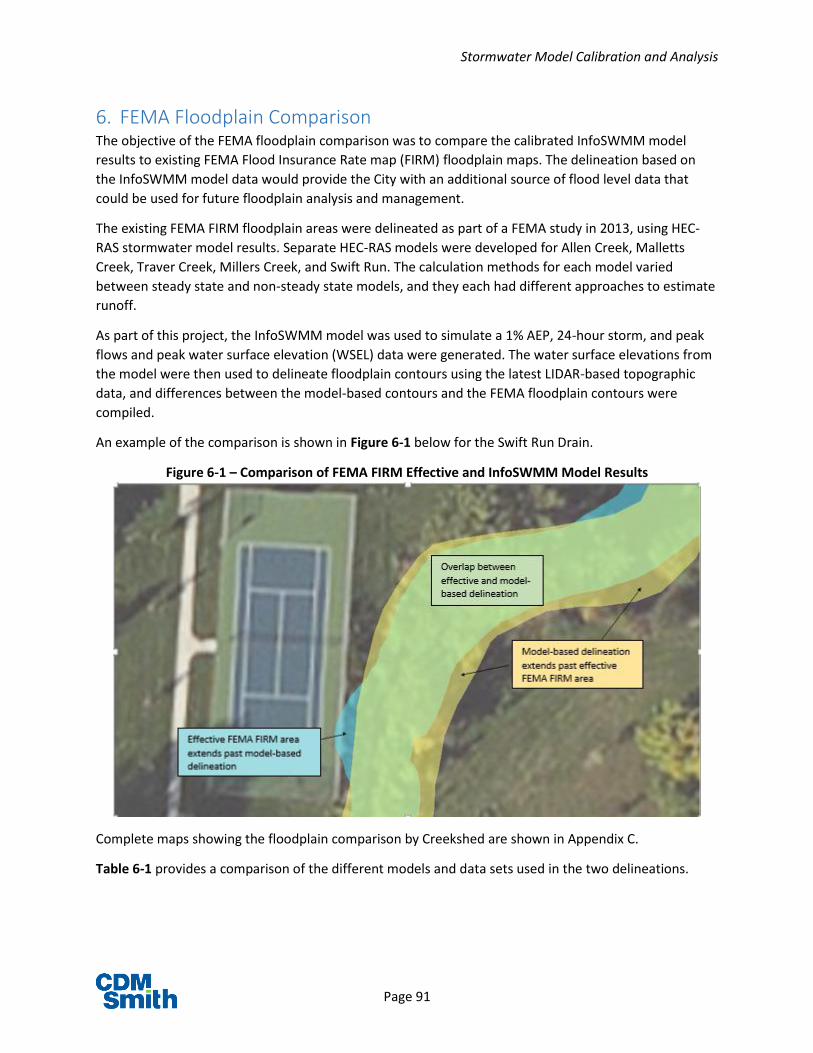
Stormwater Model Calibration and Analysis
Page 91
6. FEMA Floodplain Comparison The objective of the FEMA floodplain comparison was to compare the calibrated InfoSWMM model
results to existing FEMA Flood Insurance Rate map (FIRM) floodplain maps. The delineation based on
the InfoSWMM model data would provide the City with an additional source of flood level data that
could be used for future floodplain analysis and management.
The existing FEMA FIRM floodplain areas were delineated as part of a FEMA study in 2013, using HEC-
RAS stormwater model results. Separate HEC-RAS models were developed for Allen Creek, Malletts
Creek, Traver Creek, Millers Creek, and Swift Run. The calculation methods for each model varied
between steady state and non-steady state models, and they each had different approaches to estimate
runoff.
As part of this project, the InfoSWMM model was used to simulate a 1% AEP, 24-hour storm, and peak
flows and peak water surface elevation (WSEL) data were generated. The water surface elevations from
the model were then used to delineate floodplain contours using the latest LIDAR-based topographic
data, and differences between the model-based contours and the FEMA floodplain contours were
compiled.
An example of the comparison is shown in Figure 6-1 below for the Swift Run Drain.
Figure 6-1 – Comparison of FEMA FIRM Effective and InfoSWMM Model Results
Complete maps showing the floodplain comparison by Creekshed are shown in Appendix C.
Table 6-1 provides a comparison of the different models and data sets used in the two delineations.
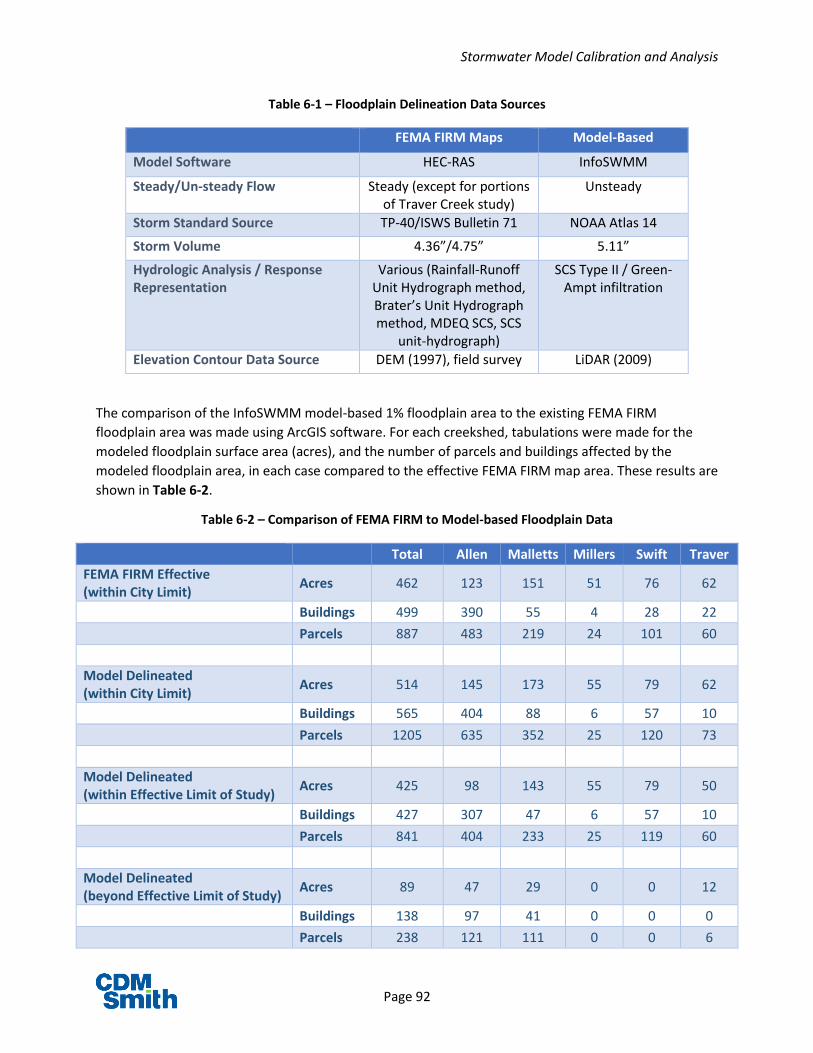
Stormwater Model Calibration and Analysis
Page 92
Table 6-1 – Floodplain Delineation Data Sources
FEMA FIRM Maps Model-Based
Model Software HEC-RAS InfoSWMM
Steady/Un-steady Flow Steady (except for portions of Traver Creek study)
Unsteady
Storm Standard Source TP-40/ISWS Bulletin 71 NOAA Atlas 14
Storm Volume 4.36”/4.75” 5.11”
Hydrologic Analysis / Response Representation
Various (Rainfall-Runoff Unit Hydrograph method, Brater’s Unit Hydrograph method, MDEQ SCS, SCS
unit-hydrograph)
SCS Type II / Green-Ampt infiltration
Elevation Contour Data Source DEM (1997), field survey LiDAR (2009)
The comparison of the InfoSWMM model-based 1% floodplain area to the existing FEMA FIRM
floodplain area was made using ArcGIS software. For each creekshed, tabulations were made for the
modeled floodplain surface area (acres), and the number of parcels and buildings affected by the
modeled floodplain area, in each case compared to the effective FEMA FIRM map area. These results are
shown in Table 6-2.
Table 6-2 – Comparison of FEMA FIRM to Model-based Floodplain Data
Total Allen Malletts Millers Swift Traver
FEMA FIRM Effective (within City Limit)
Acres 462 123 151 51 76 62
Buildings 499 390 55 4 28 22
Parcels 887 483 219 24 101 60
Model Delineated (within City Limit)
Acres 514 145 173 55 79 62
Buildings 565 404 88 6 57 10
Parcels 1205 635 352 25 120 73
Model Delineated (within Effective Limit of Study)
Acres 425 98 143 55 79 50
Buildings 427 307 47 6 57 10
Parcels 841 404 233 25 119 60
Model Delineated (beyond Effective Limit of Study)
Acres 89 47 29 0 0 12
Buildings 138 97 41 0 0 0
Parcels 238 121 111 0 0 6

Stormwater Model Calibration and Analysis
Page 93
Total Allen Malletts Millers Swift Traver
Added during comparison Acres 176 56 77 11 14 19
Buildings 242 130 76 2 33 1
Parcels 318 152 133 1 19 13
Removed during comparison Acres 125 34 55 7 10 18
Buildings 176 116 43 0 4 13
Parcels 0 0 0 0 0 0
There were two notable areas of the delineation and comparison where the FEMA FIRM mapping study
limits led to significant differences
Allen Creek south of Hill Street – In the current FEMA floodplain, the area of Allen Creek located
south of Hill Street is not included. Using the InfoSWMM model data, the floodplain delineation
would extend south through Hoover and S. State Street, covering an additional 47 acres. The
area outside of the FEMA FIRM effective area would include 97 buildings and 121 parcels.
Upper Malletts Creek – The scope of the existing FEMA floodplain delineation did not extend
west of South Seventh Street because of tributary area size limitations in the mapping
procedure. Using the citywide stormwater model for stormwater data would not have this
restriction so the Upper Malletts Creek area was included in the delineation. The model-based
floodplain area beyond the FEMA FIRM Effective study area would include an additional 14
acres, with 41 additional buildings and 98 additional parcels.
During the floodplain delineation and comparison, it was noted that many of the differences were a
result of using newer LiDAR based contour data. To better understand the source of differences in the
predicted floodplain areas, the City asked for a delineation using the existing FEMA FIRM flood
delineated areas, while adjusting to utilize updated LiDAR elevation contours.
Table 6-3 – Floodplain Comparison Using LiDAR Contour Data Only
Total Allen Malletts Millers Swift Traver
FEMA Effective Acres 462 123 151 51 76 62
Buildings 499 390 55 4 28 22
Parcels 887 483 219 24 101 60
LiDAR Contour Acres 519 131 191 40 77 80
Buildings 604 440 79 4 55 26
Parcels 946 521 223 20 118 64
Net Change Acres 57 8 40 -10 1 18
Buildings 105 50 24 0 27 4
Parcels 59 38 4 -4 17 4

Stormwater Model Calibration and Analysis
Page 94
The same delineation process was used and the results of the comparison are shown below in Table 6-3.
A portion of the overall net change in acreage, buildings, and parcels included in the floodplain areas can
be attributed to the updated LiDAR elevation contours. However, the updated rainfall volume and
resulting flow data, and the addition of previously excluded areas in Allen Creek south of Hill Street and
in the Upper Malletts Creek area west of South Seventh Street were the major factors in the differences
shown in the floodplain area comparison.

Stormwater Model Calibration and Analysis
Page 95
7. Project Conclusions
The overall goals of the City of Ann Arbor Stormwater Model Calibration and Analysis project were to
develop the model as a stormwater analysis tool and to provide answers to the City’s current
stormwater system management questions. Upon completion of the project, the following outcomes
and conclusions are reported.
The citywide stormwater model has been updated to reflect the current system configuration
and it has been calibrated based on collected flow and rainfall data.
Model updates were made prior to preliminary calibration to add model functionality, including
representation of overland flows. Preliminary calibration with 2007 data provided
improvements in model performance but was limited by a lack of large storm data. Additional
data collection was recommended to improve dormant season parameters, boundary condition
information, and calibration accuracy overall.
Additional model updates were made to reflect 2013 stormwater system configuration and to
allow for 2D modeling as part of final calibration. The calibration and validation work performed
with 2013 data had good agreement between model-predicted values and monitor-observed
values for volume and flow rate. Adjustments were made to the preliminary model parameters
to improve the model performance. In general, the model-predicted flows and volumes were
within 15% of recorded data, which fall within the expected range of agreement for stormwater
models of this size and level of detail.
The project was able to involve stakeholders and interested citizens in the project.
A number of public engagement initiatives were utilized during the project and the following
items were noted:
A high level of public participation was observed in Phase I public meetings and in the online
stormwater survey, especially from areas that have been affected by recent flooding.
Areas that had not been affected by recent flooding were not well represented in Phase I
public meetings.
The large event data gathering (LEDG) program was a successful public engagement activity,
attracting a “Citizen Storm Corps”, made up of interested residents who were able to
participate directly in stormwater management observations.
The Stormwater Advisory Group (SWAG) was formed primarily to provide review and
guidance of public interactions, but ended up providing valuable technical input and
feedback throughout the entire project. The SWAG was made up primarily of stormwater
professionals, representatives from local watershed groups, and interested citizens.
Phase II public meetings were reasonably well-attended, reflecting an overall interest in
stormwater management issues by Ann Arbor residents.
A stormwater video was developed as part of the project that will highlight the importance
and relevance of stormwater management in the City of Ann Arbor.
Stormwater Model Calibration and Analysis
Page 96
The project had input from the over-arching wet-weather projects Technical Oversight and
Advisory Group (TOAG) at key technical milestones, including after final calibration and
during the stormwater improvements evaluations.
The existing stormwater system performance was evaluated for a range of design storms,
leading to a set of potential stormwater system improvements.
The stormwater system is performing at a consistent design level of service for most areas of
the City. The 10% annual exceedance probability (AEP), 12-hour storm is the current design
standard, which is a 2.9” storm using NOAA Atlas 14 rainfall volumes. In the Allen Creek
watershed and in the Malletts Creek watershed, there are areas where surface flooding is
predicted during the 10% AEP storm and in some cases during the 20% AEP storm. Sixteen study
areas were evaluated for potential stormwater system improvements and these were presented
in a series of public meetings in November 2014. The recommended improvements total over
$34 million and will be considered as part of the City’s CIP Programming. Implementation of
longer term stormwater management strategies are recommended for the Allen Creek
watershed. The Green Streets portion of these improvement strategies was estimated at $80
million to $120 million.
The model was used to evaluate the effectiveness of stormwater management strategies.
The evaluation of future stormwater management strategies indicated that the City should
continue runoff reduction programs, including the Green Streets Policy and Residential Rain
Garden Programs. There should also be significant efforts put into encouraging compliance with
new development standards during redevelopment of commercial, multi-family, and school or
University properties. Future condition modeling scenarios show the potential for significant
improvements in stormwater system performance, especially during more frequent storm
events.
New model data was produced, allowing for comparison with existing FEMA FIRM Map 100-
year floodplain delineation.
A FEMA FIRM floodplain comparison was performed using updated LiDAR elevation contours
and also using flow and water level data generated by the new InfoSWMM model for the 1%
annual exceedance probability (AEP) storm. The 1% AEP floodplain was delineated using these
two data sets for comparison with the existing FEMA FIRM floodplain contours. The improved
refinement of 1% AEP floodplain data will be available for future FEMA floodplain mapping and
will support better decision-making on floodplain management issues.
Supporting documentation was produced, which will allow the City to utilize the stormwater
model as a system management tool.
Project documentation being provided to the City includes archives of project data files and
model files. Training sessions and written procedures for model updates and storm scenario
updates have been prepared that will enable a smooth transition of stormwater modeling
responsibilities and capabilities to City Staff. The model will be capable of providing output for
various applications, from green infrastructure planning and stormwater system design, to
floodplain analysis and emergency management. In addition, the City can build in procedures for

Stormwater Model Calibration and Analysis
Page 97
model adaptation so that adjustments can be made to reflect future stormwater system
performance monitoring or to respond to new storms or storm standards.