city of atlanta… · itu atibaia são caetano são joão da boa vista ... greenhouse gas emissions...
TRANSCRIPT
www.cdp.net
City of Atlanta
Data provided for the CDP Cities 2015 Report
Written by Report analysis & information design for CDP by
In partnership with


Atlanta in Context 04Atlanta in Focus 06Introduction 08Governance 10Risks & Adaptation 14Opportunities 22Emissions - Local Government 26Emissions – Community 33Strategy 40 CDP, C40 and AECOM are proud to present results from our fifth consecutive year of climate change reporting for cities. It was an impressive year, with 308 cities reporting on their climate change data (six times more than the number that was reported in the survey’s first year of 2011), making this the largest and most comprehensive survey of cities and climate change published to date by CDP. City governments from Helsinki to Canberra to La Paz participated, including over 90% of the membership of the C40 – a group of the world’s largest cities dedicated to climate change leadership.
Approximately half of reporting cities measure city-wide emissions. Together, these cities account for 1.67 billion tonnes CO2e, putting them on par with Japan and UK emissions combined. 60% of all reporting cities now have completed a climate change risk assessment. And cities reported over 3,000 individual actions designed to reduce emissions and adapt to a changing climate. CDP, C40 and AECOM salute the hard work and dedication of the world’s city governments in measuring and reporting these important pieces of data. With this report, we provide city governments the information and insights that we hope will assist their work in tackling climate change.
This document contains the questionnaire data provided to CDP from Atlanta as part of its 2015 CDP submission.
To see all of the results for all participating cities, visit https://www.cdp.net/cities.
The graphics in this document are from the 2015 CDP Cities infographic.

CDP Cities 2015 Atlanta4
Atlanta participation
Atlanta in context
Number of cities responding per year
73 110 2072012 2013 2014
3082015
482011
ChicagoLake Forest
DenverAuroraBoulderLakewood
St Louis
Phoenix
Las Vegas
Cleveland
MinneapolisEdina
Detroit
Baltimore
Washington, DCHoustonAustin
Miami
Mexico City
Dallas Atlanta
AbidjanLagos
Addis AbabaOuagadougou
Johannesburg
PietermaritzburgDurban
Cape Town
Copenhagen
Vilnius
Warsaw
MoscowHamburg
BornovaKadiovacik
Istanbul
Oristano
OsloStockholm
Dublin LondonAmsterdam
ManchesterLeicester
Rotterdam
ParisZurichBasel
Milan
Naples
MadridZaragoza
Barcelona
Portland
AnsanIncheon
Suwon
Seoul
KaohsiungPingtung
Hong Kong
Hanoi
Bangkok
Ho Chi Minh City
Singapore
TaipeiNew TaipeiHsinchu City
Tokyo
Hiroshima
Melbourne
Sydney
AparecidaGuaratinguetáLorena
Curitiba
Porto AlegreCaxias do Sul
Montevideo
Santiago
Belo HorizonteBetim
Rio de JaneiroDuque de CaxiasSão Gonçalo
Goiânia
Cali Bogotá
CaracasBarranquilla
Guayaquil
SalvadorCamaçari
RecifeJaboatão dos Guararapes
LimaPunta Hermosa
Buenos Aires
San FranciscoOakland
HaywardSan JosePalo Alto
Benicia
VictoriaSeattle
Brandon
Edmonton
Vancouver
Saskatoon
TorontoWinnipeg
London
Ft WayneIndianapolis
Pittsburgh
Philadelphia
ColombusCincinnati
Boston
Hamilton
Montreal
Lexington
Ft Worth
San Antonio
San Diego
Long BeachSanta Monica
Los Angeles
Richmond
Guatemala
Juarez
PueblaSan Luis Potosi
Salt Lake CityPark City
FlorianopolisBlumenau
Maceió
Uberlândia
Cuiabá
Fortaleza
Belem
Brasilia
São PauloCampinasGuarulhosItuAtibaiaSão CaetanoSão João da Boa VistaSorocabaTatuíCaieirasVinhedoMauáÁguas de São PedroCabreúvaCapivariFranco da RochaMairiporãPorto Feliz
CosmópolisOlímpia
Aparecida de GoiâniaSão Jose do Rio Preto
Bauru
São Bernardo do CampoCubatão
Macapá
Aracaju
Natal
Vitoria
São Luis
Pretoria
Nairobi
Dar es Salaam
Karachi
Wellington
YokohamaNagoya
Shenzhen
ChuncheonHoengseongHongcheonHwacheonInje
JecheonSamcheokWonjuUljin
JangseongImsil
NonsanPyeongtaek
SeocheonYoengwang
DaejeonChangwonGeojeGeumsanTongyeong
GokseongGuryeGwangjuGwangyangHaenamJangheungJejuMokpoSeogwipoShinanBoseong CountyJeong-sun Metro GovernmentJeonju Metro GovernmentMuan CountyNajuSunchang
FafePorto
ÁguedaBraga
LamegoVila Nova de Famalicão
Matosinhos Cascais
LisbonSantarém
SeixalMoita
FaroBarreiro
Torres Vedras
Rome
BolognaFerrara
PiacenzaRavenna
BolzanoPaduaVeniceReggio EmiliaUdine
GenoaTurin
Gibraltar
MonacoNice
Glasgow
Turku
NorthAmerica
LatinAmerica
Europe and Middle East
Africa
South Asiaand Oceania
East Asia
Panama City
Tegucigalpa
Amiens
Cuernavaca
MonterreyMoclovaTorreón
CanberraAdelaide
Arlington
AspenAlbanyBurlington
Berlin
Bournemouth
Brownsville
CharlotteColumbiaDurhamWinston-Salem
Athens
El Paso
Eugene
Flagstaff
GuadalajaraLeón de los Aldamas
Helsinki
Lahti
Oklahoma City
Perth
Reykjavík
New YorkYonkers
New Orleans
Quito
Funchal
Nijmegen
Amman
Iskandar
Halifax
Rio Branco
Cordoba
La Paz
Arequipa
Medellín
Aguascalientes
MéridaPlaya del Carmen
Niseko
Montes Claro
Palmas
Santo Domingo
Essen
Heidelberg
Trondheim
Douala
Lausanne
Wuhan
Tampico

5Atlanta in Context
Where Atlanta fits
171 small<600k population
Total population of cities responding in 2015
446,186,833
600k-1.6m population77 medium
Atlanta
443,775people
1.6m+ population
60 large
ChicagoLake Forest
DenverAuroraBoulderLakewood
St Louis
Phoenix
Las Vegas
Cleveland
MinneapolisEdina
Detroit
Baltimore
Washington, DCHoustonAustin
Miami
Mexico City
Dallas Atlanta
AbidjanLagos
Addis AbabaOuagadougou
Johannesburg
PietermaritzburgDurban
Cape Town
Copenhagen
Vilnius
Warsaw
MoscowHamburg
BornovaKadiovacik
Istanbul
Oristano
OsloStockholm
Dublin LondonAmsterdam
ManchesterLeicester
Rotterdam
ParisZurichBasel
Milan
Naples
MadridZaragoza
Barcelona
Portland
AnsanIncheon
Suwon
Seoul
KaohsiungPingtung
Hong Kong
Hanoi
Bangkok
Ho Chi Minh City
Singapore
TaipeiNew TaipeiHsinchu City
Tokyo
Hiroshima
Melbourne
Sydney
AparecidaGuaratinguetáLorena
Curitiba
Porto AlegreCaxias do Sul
Montevideo
Santiago
Belo HorizonteBetim
Rio de JaneiroDuque de CaxiasSão Gonçalo
Goiânia
Cali Bogotá
CaracasBarranquilla
Guayaquil
SalvadorCamaçari
RecifeJaboatão dos Guararapes
LimaPunta Hermosa
Buenos Aires
San FranciscoOakland
HaywardSan JosePalo Alto
Benicia
VictoriaSeattle
Brandon
Edmonton
Vancouver
Saskatoon
TorontoWinnipeg
London
Ft WayneIndianapolis
Pittsburgh
Philadelphia
ColombusCincinnati
Boston
Hamilton
Montreal
Lexington
Ft Worth
San Antonio
San Diego
Long BeachSanta Monica
Los Angeles
Richmond
Guatemala
Juarez
PueblaSan Luis Potosi
Salt Lake CityPark City
FlorianopolisBlumenau
Maceió
Uberlândia
Cuiabá
Fortaleza
Belem
Brasilia
São PauloCampinasGuarulhosItuAtibaiaSão CaetanoSão João da Boa VistaSorocabaTatuíCaieirasVinhedoMauáÁguas de São PedroCabreúvaCapivariFranco da RochaMairiporãPorto Feliz
CosmópolisOlímpia
Aparecida de GoiâniaSão Jose do Rio Preto
Bauru
São Bernardo do CampoCubatão
Macapá
Aracaju
Natal
Vitoria
São Luis
Pretoria
Nairobi
Dar es Salaam
Karachi
Wellington
YokohamaNagoya
Shenzhen
ChuncheonHoengseongHongcheonHwacheonInje
JecheonSamcheokWonjuUljin
JangseongImsil
NonsanPyeongtaek
SeocheonYoengwang
DaejeonChangwonGeojeGeumsanTongyeong
GokseongGuryeGwangjuGwangyangHaenamJangheungJejuMokpoSeogwipoShinanBoseong CountyJeong-sun Metro GovernmentJeonju Metro GovernmentMuan CountyNajuSunchang
FafePorto
ÁguedaBraga
LamegoVila Nova de Famalicão
Matosinhos Cascais
LisbonSantarém
SeixalMoita
FaroBarreiro
Torres Vedras
Rome
BolognaFerrara
PiacenzaRavenna
BolzanoPaduaVeniceReggio EmiliaUdine
GenoaTurin
Gibraltar
MonacoNice
Glasgow
Turku
NorthAmerica
LatinAmerica
Europe and Middle East
Africa
South Asiaand Oceania
East Asia
Panama City
Tegucigalpa
Amiens
Cuernavaca
MonterreyMoclovaTorreón
CanberraAdelaide
Arlington
AspenAlbanyBurlington
Berlin
Bournemouth
Brownsville
CharlotteColumbiaDurhamWinston-Salem
Athens
El Paso
Eugene
Flagstaff
GuadalajaraLeón de los Aldamas
Helsinki
Lahti
Oklahoma City
Perth
Reykjavík
New YorkYonkers
New Orleans
Quito
Funchal
Nijmegen
Amman
Iskandar
Halifax
Rio Branco
Cordoba
La Paz
Arequipa
Medellín
Aguascalientes
MéridaPlaya del Carmen
Niseko
Montes Claro
Palmas
Santo Domingo
Essen
Heidelberg
Trondheim
Douala
Lausanne
Wuhan
Tampico

CDP Cities 2015 Atlanta6
Atlanta in focus
Population
443,775
Area
343km2
Year reported
2015
Inventory method
Global Protocol for Community-Scale Greenhouse Gas Emissions Inventories (GPC)

7Atlanta in Focus
144 cities reporting emissions in 2015
102 cities reporting emissions of less than 10,000,000 metric tonnes CO2e
22 cities reporting emissions of 10,000,000 to 20,000,000 metric tonnes CO2e
8 cities reporting emissions of 20,000,000 to 30,000,000 metric tonnes CO2e
12 cities reporting emissions of greater than 30,000,000 metric tonnes CO2e
30,000,000Metric tonnes CO2e
20,000,000Metric tonnes CO2e
10,000,000Metric tonnes CO2e
5,000,000Metric tonnes CO2e
80,000,000Metric tonnes CO2e
50,000,000Metric tonnes CO2e
Atlanta
8,857,265Metric tonnes CO2e

CDP Cities 2015 Atlanta8
0 Introduction The City of Atlanta (also referenced in this document as Atlanta or the City), is located in the north-central part of the state of Georgia, USA. Atlanta was established in 1847 and provides municipal services to its inhabitants and visitors. These services include police and fire protection, the maintenance of streets and other infrastructures, recreational activities and cultural events, land use and building regulations, and solid waste collection and disposal.
Introduction

9Introduction
The City is also responsible for the water and wastewater operations and infrastructure and operates the worlds’ busiest passenger airport, the Hartsfield-Jackson Atlanta International Airport, which is financed exclusively with airport-generated income.

CDP Cities 2015 Atlanta10
Governance
1.1 Governance Atlanta’s process for managing progress and responsibility for climate action:
Emissions ReductionsThe City of Atlanta is using the Global Protocol for Community-scale Greenhouse Gas Emission Inventories (GPC) as the framework to track citywide GHG emissions. By selecting this protocol, the City of Atlanta is consistent with international standards. Each of the city’s GHG inventories has been verified by an independent 3rd party. The City of Atlanta Climate Action Plan (CAP), developed in 2012, is in the process of being updated. The update includes more aggressive emission

11Governance
Governance
reduction targets and new goals, strategies, and actions for mitigation. These goals, strategies, and actions have been selected with the participation of citywide experts from the five city stakeholder groups (i.e. business, non-profits, the academia, residents, and the government). The CAP will be submitted to the Atlanta City Council for endorsement. The expected date for endorsement is during the third quarter of 2015.
AdaptationThe City of Atlanta Office of Sustainability is in the process of selecting a framework, such as the Handbook for Local Government Leaders, to detect risks and vulnerable areas for the purposes of creating an adaptation and resilience plan. The framework will include the “Ten Essentials for Making Cities Resilient” developed by UNISDR as a toolkit for local government resilience and disaster risk reduction.
Atlanta has a plan and is committed to climate change adaptation.
The City of Atlanta is still recovering from the economic recession of 2009, which produced high levels of unemployment and lowered property prices. Over the last couple of years the local economy has been improving, providing a moderate decrease in

CDP Cities 2015 Atlanta12
unemployment and a moderate increase in the real estate market. Although the economy is not as strong as it was before the 2009 recession, the City of Atlanta is in a good position to focus on preparing for the challenges presented by climate change.
Atlanta anticipates that national and/or regional climate change activities will have impacts on Atlanta’s own climate change activities.
In November 2014 President Obama laid out a national plan to reduce GHG emissions in the USA, in the range of 26 to 28 percent below 2005 levels by 2025. Among these measures, the President directed the Environmental Protection Agency (EPA) to develop carbon pollution standards for power plants and to improve energy efficiency at all levels of the government. These national activities impact directly and indirectly our own climate change activities at a local level.
Atlanta incorporates sustainability goals and targets into the master planning for the city.
In 2014, the City of Atlanta through the Mayor’s Office of Sustainability, published the Power to Change sustainability plan. The plan, developed by more than 300 citywide stakeholders, identified 10 areas of impact, 30+ measures

13Governance
of success, and 100+ sustainable initiatives. Power to Change identifies short, mid, and long-term goals for all the impact areas. Goals include reducing water and energy consumption 20% by 2020, from the 2009 baseline and 90% of waste diverted to the landfill by 2020.
Atlanta has a climate change action plan for reducing GHG emissions.
City of Atlanta Climate Action Plan, 2015
CDP Cities 2015 Atlanta14
Risks & Adaptation
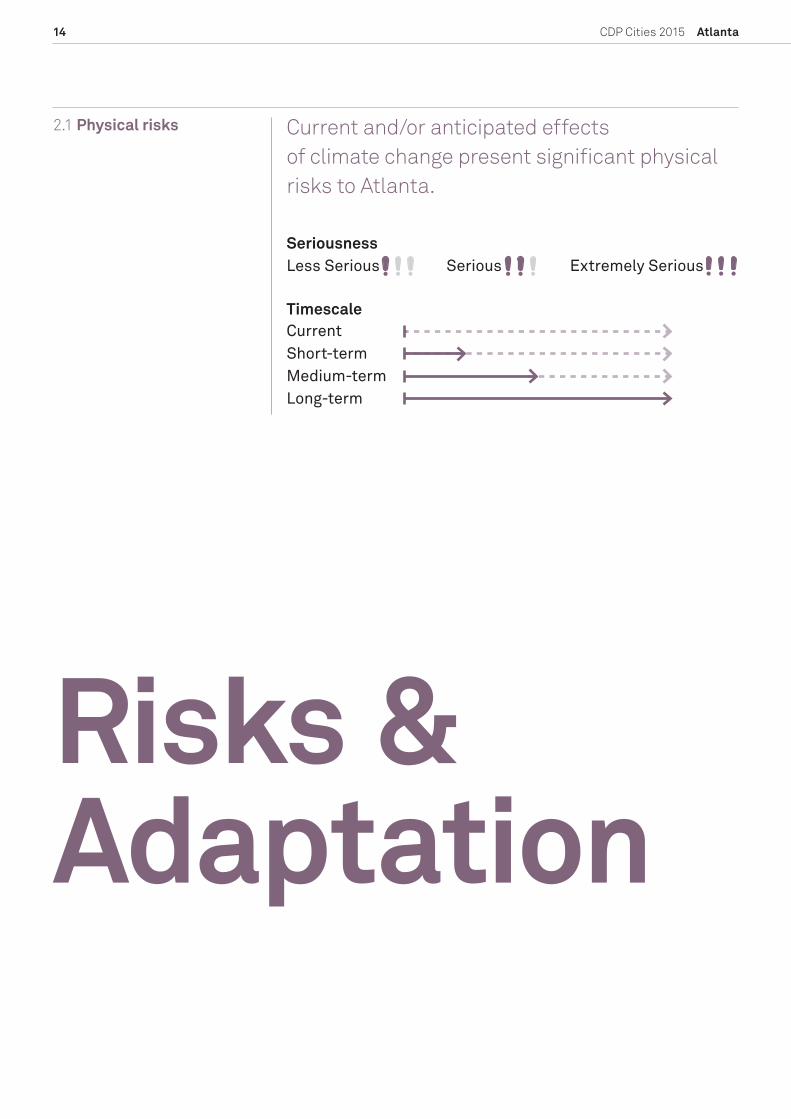
2.1 Physical risks Current and/or anticipated effects of climate change present significant physical risks to Atlanta.
Seriousness
Long-termMedium-term
CurrentTimescale
Short-term
Extremely SeriousSeriousLess Serious

15Risks & Adaptation
More intense droughtsRisk: Timescale:
Droughts decrease the availability of the water in the Chattahoochee River, Atlanta’s only water source. Droughts also exacerbate the urban heat island effect and produce wildfires in wooded areas near Atlanta, affecting the air quality of the entire region.
More frequent heat wavesRisk: Timescale:
Heat waves can cause heat strokes in vulnerable populations, particularly those who do not have access to air conditioning. Heat waves increase pollution levels by requiring more electricity to run air conditioning units.
More intense rainfallRisk: Timescale:
Floods destroy houses in vulnerable areas, disrupt highways, and produce sewage spills in the Chattahoochee River by overloading the Atlanta storm sewer system.
Increased frequency of large stormsRisk: Timescale:
Atlanta is not prepared for prolonged winter storms, which can cause traffic paralysis and food shortages.
Air qualityRisk: Timescale:
The effects of global warming can increase the number of unhealthy air, or “red” smog alert” days for Atlanta.
Infectious diseasesRisk: Timescale:
Increasing temperatures and humidity can increase risks for mosquito borne diseases that are associated with tropical climates such as yellow fever, dengue, and West Nile Virus.

CDP Cities 2015 Atlanta16
Compounding factors may worsen the physical effects of climate change in Atlanta.
Extreme temperatures not only bring extreme hazardous weather but also put extra stress in Atlanta’s aging infrastructure. As Atlantans increase the demand in heating/cooling and water use, they also increase their GHG emissions because most of the energy (74%) is generated from burning fossil fuels.
Atlanta considers that the physical impacts of climate change could threaten the ability of businesses to operate successfully.
Poor air quality, infectious diseases, and extreme weather can negatively affect employees’ health. Atlanta businesses have experienced losses due to extreme weather events that have paralyzed the City. For example, the catastrophic flooding that impacted the Atlanta metropolitan area in September 15-22, 2009, greatly impacted community and businesses. Initial property damage in Georgia was estimated at $250 million, but was eventually raised to $500 million. More than 20,000 homes, businesses and other buildings had major damage; 10 Georgia residents lost their lives during this event and hundreds of people were rescued from their homes and vehicles; portions of all major Atlanta-area interstates, including I-20,

17Risks & Adaptation
I-75 and I-85, were closed; 17 counties in Georgia received Federal Disaster Declarations, the majority of which were in the Atlanta Metropolitan area. The clean-up and rebuild process continued into 2010.
A climate change risk or vulnerability assessment is in progress for the Atlanta area.

CDP Cities 2015 Atlanta18
Atlanta currently experiences the following climate hazards.Drought
Heat wave
Rain storm
Heavy snow
Extreme hot weather
Atlanta expects the following hazards to affect the City in the future. Rain storm
Heavy snow
Tornado
Extreme cold weather
Heat wave
Extreme hot weather
Drought
Forest fire
Flash/surface flood
Storm surge
Air-borne disease
2.2 Climate Hazards

19Risks & Adaptation
Actions Atlanta is taking to reduce risks to infrastructure, citizens, and businesses from climate changes include the following.
Water efficiency equipment and appliancesHazard: Water ScarcityThe Department of Watershed Management encourages conservation efforts and offers incentive program and water conservation education/outreach.
Tree plantingHazard: Extreme heatAtlanta implemented the Tree Protection Ordinance in 1995, which states that there shall be no net loss of trees within the boundaries of the city.
Water butts/rainwater captureHazard: FloodThe City is a part of the local Clean Water Campaign which provides storm water management solutions, including education and infrastructure.
Crisis Management including warning and evacuation systemsHazard: Large StormsIn conjunction with the State, the City of Atlanta is part of the Winter Task Force that studies the best way to handle future storms and augment the infrastructure in place.
Community Engagement/EducationHazard: Extreme heatWork with businesses and non-profits to educate and offer assistance to design and implement commuting options that make business sense and decrease carbon output; protect public health; create programs targeted to commuters and employers; provide Smog Alert notifications for Georgia cities; and work with elementary, middle and high schools to educate and protect children from harmful pollution and empower
2.3 Adaptation

CDP Cities 2015 Atlanta20
children to take a positive role in reducing traffic and cleaning the air.
Disease prevention measuresHazard: PrecipitationWork with the CDC (Centers for Diseases Control and Prevention) and other organizations in the prevention of mosquito borne diseases.
Cities are at risk from climate change
This year,
1.2 billion metric tonnes of CO 2e have been reported
by 108 cities.
Of surveyed cities,
52% have completed an
emissions inventory...
Other
...and our research reveals that sources of emissions can vary
Cities are facing risks from climate change.
Percentage of cities facing di rent categories of natural risk.
Cities are undertaking 2110 activities to mitigate and adapt to climate change.
4.1m MTCO 2e
Denver3.5m
MTCO 2e
London
1.1m MTCO 2e
Taipei
1.6m MTCO 2e
Madrid
2.8m MTCO 2e
Durban
RotterdamCO 2 emissions reduction from industry
Five cities where carbon footprints have fallen since
2009 in metric tonnes CO 2e.
This is CDP Cities 2014Now in its fourth year, CDP Cities is the most comprehensive climate change reporting platform at the city level.
54% 46%
Building energy demand
Transport
Waste
37%
of risks reported as
serious and near-term
53%
of cities have completed a
risk assessment
54%
78%
68%
41%
30%
29%
Temperature increase /heatwaves
Frequent /intense rainfall
Drought
Sea level rise
Activities set to cut the most carbon
emissions in metric tonnes CO 2e.
Most popular sectors for emissions reductions activities by percentage
of cities.
4.0mMTC0 2e
$
$
3.0mMTC0 2e
Washington, DC
RotterdamLow or zero carbon energy supply generation
2.7mMTC0 2e
2.3mMTC0 2e
Washington, DCBuilding performance rating and reporting
2.1mMTC0 2e
Cleveland
From Rio to Boston, more and more cities are measuring their CO 2 emissions.
CDP cities represent a growing slice of the world’s economy.
That’s
28% of world GDP...
...an incredible
$21 trillion in total annual output.
Cities reporting to CDP have a combined annual budget of
$954 billion roughly the annual budget of the UK.
Commercial / institutional facilities
Industrial buildings
Industrial process and product use emissions
On-road transportation Cars, LDV, HDV / buses, others
Residential buildings
5%
17%
28%
50%
28%12%
11%
21%
13%
14%

21Risks & Adaptation
2.4 Social risks Atlanta faces social risks as a result of climate change.
Increased resource demandTimescale: Increases in temperature cause Atlanta residents and businesses to use air conditioning units more frequently and extensively, which increase energy demand. The Atlanta utility, Georgia Power, produces a 74 percentage of the energy used in Atlanta, by fossil fuels.
Increased incidence and prevalence of diseaseTimescale: The Asthma and Allergy Foundation of America (AAFA) classified Atlanta as #13 in asthma cases from 100 US cities surveyed. The main reason for this rating is poor air quality, created by vehicles emissions.
Increased risk to already vulnerable populationsTimescale: Poor air quality in Atlanta mostly affects vulnerable populations: 9% of children under the age of 18 suffer from asthma and other respiratory diseases. More than 200,000 children age 18 and younger in the region have asthma.

CDP Cities 2015 Atlanta22
Opportunities
3.1 Opportunities Climate change action presents economic opportunities for Atlanta.

23Opportunities
Atlanta is positioning itself to take advantage of opportunities from taking climate change action.
Improved efficiency of operationsThe City of Atlanta adopted a buildings energy efficiency ordinance aimed at reducing energy and water consumption by 20% in commercial buildings by the year 2030, spur the creation of more than 1,000 jobs a year in the first few years, and reduce carbon emissions by 50 percent from 2013 levels by 2030. Buildings performance data collected under the ordinance benchmarking initiative will be made transparent to the public to allow the market to recognize, reward, and drive increased demand for high-performing buildings. The ordinance is part of the City’s work under the City Energy Project, which is developing locally-tailored plans and programs to create healthier, more prosperous, and more resilient cities by reducing carbon pollution from buildings. Other participants include Boston, Chicago, Denver, Houston, Kansas City, Los Angeles, Orlando, Philadelphia and Salt Lake City. By investing in building energy efficiency programs and policies, together the City Energy Project participants are projected to cut up to 7 million tons of carbon emissions annually and save residents and businesses a combined total of nearly $1 billion annually on their energy bills.
Increased infrastructure investmentVehicles generate more than one-third of emissions in Atlanta. The Atlanta BeltLine is the most comprehensive transportation and economic development effort ever undertaken in the City of Atlanta and among the largest, most wide-ranging urban re-development programs currently underway in the United States. The Atlanta BeltLine is a sustainable redevelopment project that will provide a network of public parks, multi-use trails and transit along a historic 22-mile railroad corridor circling downtown and connecting many neighborhoods directly to each other. In 2013, the City of Atlanta received $18 million from the U.S. Department of Transportation for the development of a 2.5-mile portion of the Atlanta BeltLine in the southwest corridor. The building of the modern Atlanta Streetcar represents the first step in the dawning of a new era

CDP Cities 2015 Atlanta24
for transit – one that will begin to transform how we get around in our community. The section that opened for use in December 2014 represents phase one of a grand vision for the Atlanta Streetcar. In the coming years, additional lines are planned, and project developers intend to expand service to additional neighborhoods and other popular destinations around the city. Ultimately, the Atlanta Streetcar is destined to become part of a whole new system of local and regional transportation. Phase one offers last mile connectivity to the city center for MARTA, the Atlanta BeltLine and other transit options, and additional phases will expand that service even further. The Atlanta Streetcar makes access easier within the city, and it also functions as a metaphorical link between the city’s rich history with rail transportation and its evolution into a robust centerpiece of the New South and 21st century connectivity. In March of 2015, Atlanta voters approved $250 million bond referendum for transportation and construction projects. The projects include the repair and upgrades to bridges, roads, sidewalks, bike lanes, and public buildings.
Development of new business industries (e.g. clean tech)Atlanta is home to 541 clean tech company facilities representing 30,605 jobs focused on clean technology. Since 2010, Atlanta has attracted 34 clean tech companies, creating more than 2,200 jobs. Clean technologies in Atlanta include energy efficiency, recycling and solid waste, smart grid, and solar and water technology. The Georgia Green Loan funds support small business to start or expand eco-friendly product or services or “green” existing business.

25Opportunities
#CDPCities#COP21
...the combined population of three G7 nations - America, Britain and France.
of emissions (CO2e) for all reporting cities.
the number that reported in the survey’s first year, 2011.
IT’S6XMORE
people live in these cities, accounting for 6% of global population, or...
446,000,000
reported to the world’s definitive study on cities and climate change.
IN 2015,308CITIES
CAN CITIESQUIT FOSSIL FUELS? YES.of the 162 cities report that
already more than
35% of theirelectricity is
from non-fossilfuel sources.
75%Year on year, CDP is supporting more cities in tackling climate change. 2015 CDP data reveals that in many countries, cities are leading the way in making the global switch to renewable energy. Through their commitment to action and innovative identification of projects, cities are showing that the shift to non-fossil energy is within our reach. The challenge now is to match projects to funding, and to ensure a fair distribution between developed and developing cities - an important issue in the run up to COP21 in Paris in December 2015 and beyond.
TO PARISAND BEYOND
...innovationand collaboration.
More than half of the world’s people
live in them.Cities consume...
CITIESARE
HUBS FOR... 78% 12.6gt
CO2
...of energy globally.
Untapped potential in cities can significantly
accelerate a globalshift away from
fossil fuels.
Power generationis the single largest
carbon emitter - and by a big margin.
Per year, the power marketcurrently emits...
This number isprojected to
double by 2040.Our data reveals thatcities can directly and
indirectly influence thissector - in a big way.
Gas 2%
Geothermal 2%
46 LATINAMERICANCITIES
55 NORTH AMERICANCITIES
4 AFRICANCITIES
38 EUROPEANCITIES
19 ASIAN/OCEANIAN
CITIESEnergy mix by non-fossil %
76% 0%
Coal33%
Gas20%
Nuclear21%
Hydro16%
Oil 1%
Wind
6%
Geothermal 1%
Biomass 1%
Solar 1%
Hydro72%
Geothermal 2%
Biomass 2%
Oil13%
Gas8%
Coal 4%
Hydro25%
Wind13%
Nuclear11%
Gas18%
Coal16%
Oil7%
Biomass 4%Solar 4%
Gas36%
Coal32%
Oil17%
Hydro
6%
Nuclear 5%
Wind 3%
Solar 1%
Hydro50%
Coal40%
Nuclear 1%
Oil7%
revealing a diversity of responses, for cities large and small across all regions.
LONDON, UK
Hydro 1.2%
Gas26.7%
Wind 7.7%
Coal40.7%
Biomass21.1%
Nuclear 2.8%
NEW YORK, US
Hydro 1%
Nuclear19%
Gas78%
Oil 1%
CITIESAIM HIGH.These cities have set themselves renewable electricity targets:
JUST A LITTLECHANGEWILL GO FAR.
$57 TRILLIONwill be invested in infrastructure through 2030. That means that less than 0.01% of this sum, or just
$1 OF EVERY $8Kspent is required to support delivery of renewable goals for all the CDP cities that report a target. At just over $7 billion in total, this is still a large price tag and represents a considerable challenge for cities, but with global focus it can be achieved.
43 cities reported that they want private sector support to deliver community renewable projects. CDP data indicates that less than half of these projects are located in the global south.
96 CITIESor 1/3 of cities that reported are taking action to de-carbonize their energy supply.
CAN CITIES QUIT FOSSIL FUELS?
162 CITIES REPORTED THEIR ENERGY MIX,
REYKJAVÍK, IS
Hydro70%
Geothermal30%
Biomass 6.5%
STOCKHOLM, SE
Hydro58%
Nuclear21.5%
Wind 5.5%Coal 4.5%
Gas 4% Oil 4.4%Wind 1.1%
Biomass 7.6%
CAMPINAS, BR
Hydro70.6%
Gas11.3%
Coal 2.6%
1.67 BILLION TONNESREPORTED
ASPEN 100%SANTA MONICA 100%SAN FRANCISCO 100%STOCKHOLM 100%VANCOUVER 93%CANBERRA 90%AUSTIN 55%ADELAIDE 50%LOS ANGELES 33%SYDNEY 30%
CITIES TAKE ACTION.
CITIES PRESENT AN OPPORTUNITY.
THE RESULTS ARE DIVERSE. REVEALING MIXES FROM 100% NON-FOSSIL TO 100% CONTINUED RELIANCE ON FOSSIL AND MANY COMBINATIONS THEREOF.
86% of these cities see an
San Francisco has brought together public and private stakeholders to form a task force that highlighted barriers and opportunities for renewable electricity.
BUILDING CONSENSUS FROM SF TO STOCKHOLM.
Following a broad consultation, Stockholm prepared a roadmap outlining the steps the city and other have to take to achieve their 2050 goal.
1 MILtCO2
Cape Town could reduce CO2e by 1 million tonnes, equivalent to 300 wind turbines.
CAPETOWN
ECONOMICOPPORTUNITYin climate change.
100
100100
Atlanta is hoping to attract private sector involvement for the following climate-related projects.
The Georgia Congress passed a bill that will allow the Atlanta BeltLine to use public-private partnerships to finance and build a wide variety of projects along the 22-mile loop, including:
Hiking trails
Sidewalks
Streetscaping
Bike lanes
Transit facilities

CDP Cities 2015 Atlanta26
Emissions – Local Government
4.1 Date and boundary Atlanta is reporting a GHG measurement inventory for a period of one year.
Mon 01 Jul 2013 - Mon 30 Jun 2014
Boundary typology used for Atlanta’s GHG emissions inventory:
Departments, entities or companies over which financial control is exercised

27Emissions – Local Government
4.2 GHG emissions data Atlanta included the following major sources of emissions in its GHG emissions inventory:Airport(s)
Buildings
Landfills
Municipal vehicle fleet
Street lighting and traffic signals
Wastewater treatment
Water supply
Atlanta has used the following protocol to inventory emissions:
Local Government Operations Protocol (ICLEI/The Climate Registry/California Climate Action Registry/California Air Resources Board)
CDP Cities 2015 Atlanta28
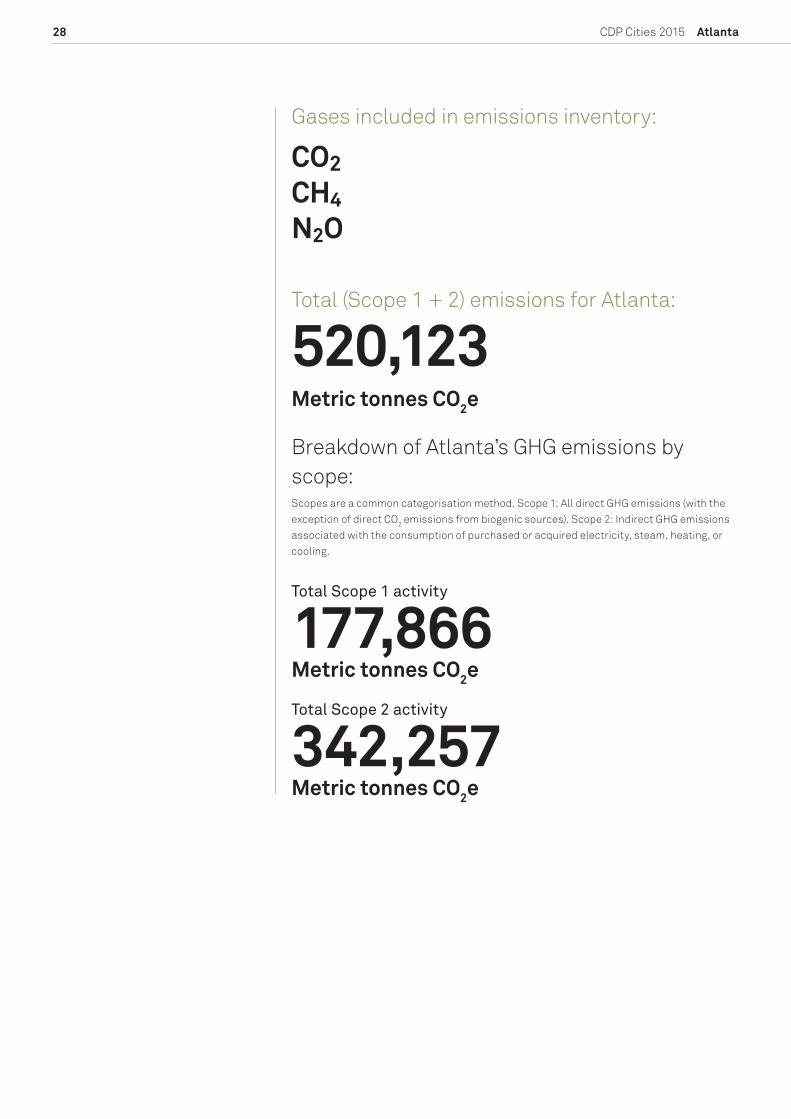
Gases included in emissions inventory:
CO2CH4N2O
Total (Scope 1 + 2) emissions for Atlanta:
520,123Metric tonnes CO2e
Breakdown of Atlanta’s GHG emissions by scope: Scopes are a common categorisation method. Scope 1: All direct GHG emissions (with the exception of direct CO2 emissions from biogenic sources). Scope 2: Indirect GHG emissions associated with the consumption of purchased or acquired electricity, steam, heating, or cooling.
Total Scope 1 activity
177,866Metric tonnes CO2e
Total Scope 2 activity
342,257Metric tonnes CO2e

29Emissions – Local Government
Total amount of fuel (direct/Scope 1 emissions) consumed in Atlanta during the reporting year:
Motor gasoline (petrol)
71,454,027LDiesel/Gas oil
17,430,298L
Town gas or city gas (Buildings)
4,357,990Therms
Wastewater treatment
116,188Metric tonnes
Compressed Natural Gas (CNG)
8,196L
Methane (Landfills)
570Short tons

CDP Cities 2015 Atlanta30
Electricity, heat, steam, and cooling (indirect/Scope 2 emissions) consumed by Atlanta during the reporting year:
603,637MWh

31Emissions – Local Government
Atlanta does not measures Scope 3 emissions.The city is working to simplify the process for the annual municipal GHG inventories with scope 1 and 2, and will create the respective policies to acquire the necessary information to calculate and report scope 3.
Breakdown of Atlanta’s GHG emissions by department (total):
Mayor’s Office of Enterprise Assets Management
Scope 1: 23,165Scope 2: 342,257Metric tonnes CO2e
Watershed Department Office of Water Treatment and Reclamation
116,188Metric tonnes CO2e
Public Works Office of Fleet Services
26,551Metric tonnes CO2e
Public Works Office of Solid Waste Services
11,962Metric tonnes CO2e

CDP Cities 2015 Atlanta32
Atlanta’s emissions decreased.
Emissions have decreased primarily due to energy efficiency measures.
4.3 External verification Atlanta’s emissions have been externally verified.
Valerie Thomas, Ph.D
2013
Doctor Thomas is an independent contractor with the Georgia Institute of Technology (Georgia Tech).
#CDPCities#COP21
...the combined population of three G7 nations - America, Britain and France.
of emissions (CO2e) for all reporting cities.
the number that reported in the survey’s first year, 2011.
IT’S6XMORE
people live in these cities, accounting for 6% of global population, or...
446,000,000
reported to the world’s definitive study on cities and climate change.
IN 2015,308CITIES
CAN CITIESQUIT FOSSIL FUELS? YES.of the 162 cities report that
already more than
35% of theirelectricity is
from non-fossilfuel sources.
75%Year on year, CDP is supporting more cities in tackling climate change. 2015 CDP data reveals that in many countries, cities are leading the way in making the global switch to renewable energy. Through their commitment to action and innovative identification of projects, cities are showing that the shift to non-fossil energy is within our reach. The challenge now is to match projects to funding, and to ensure a fair distribution between developed and developing cities - an important issue in the run up to COP21 in Paris in December 2015 and beyond.
TO PARISAND BEYOND
...innovationand collaboration.
More than half of the world’s people
live in them.Cities consume...
CITIESARE
HUBS FOR... 78% 12.6gt
CO2
...of energy globally.
Untapped potential in cities can significantly
accelerate a globalshift away from
fossil fuels.
Power generationis the single largest
carbon emitter - and by a big margin.
Per year, the power marketcurrently emits...
This number isprojected to
double by 2040.Our data reveals thatcities can directly and
indirectly influence thissector - in a big way.
Gas 2%
Geothermal 2%
46 LATINAMERICANCITIES
55 NORTH AMERICANCITIES
4 AFRICANCITIES
38 EUROPEANCITIES
19 ASIAN/OCEANIAN
CITIESEnergy mix by non-fossil %
76% 0%
Coal33%
Gas20%
Nuclear21%
Hydro16%
Oil 1%
Wind
6%
Geothermal 1%
Biomass 1%
Solar 1%
Hydro72%
Geothermal 2%
Biomass 2%
Oil13%
Gas8%
Coal 4%
Hydro25%
Wind13%
Nuclear11%
Gas18%
Coal16%
Oil7%
Biomass 4%Solar 4%
Gas36%
Coal32%
Oil17%
Hydro
6%
Nuclear 5%
Wind 3%
Solar 1%
Hydro50%
Coal40%
Nuclear 1%
Oil7%
revealing a diversity of responses, for cities large and small across all regions.
LONDON, UK
Hydro 1.2%
Gas26.7%
Wind 7.7%
Coal40.7%
Biomass21.1%
Nuclear 2.8%
NEW YORK, US
Hydro 1%
Nuclear19%
Gas78%
Oil 1%
CITIESAIM HIGH.These cities have set themselves renewable electricity targets:
JUST A LITTLECHANGEWILL GO FAR.
$57 TRILLIONwill be invested in infrastructure through 2030. That means that less than 0.01% of this sum, or just
$1 OF EVERY $8Kspent is required to support delivery of renewable goals for all the CDP cities that report a target. At just over $7 billion in total, this is still a large price tag and represents a considerable challenge for cities, but with global focus it can be achieved.
43 cities reported that they want private sector support to deliver community renewable projects. CDP data indicates that less than half of these projects are located in the global south.
96 CITIESor 1/3 of cities that reported are taking action to de-carbonize their energy supply.
CAN CITIES QUIT FOSSIL FUELS?
162 CITIES REPORTED THEIR ENERGY MIX,
REYKJAVÍK, IS
Hydro70%
Geothermal30%
Biomass 6.5%
STOCKHOLM, SE
Hydro58%
Nuclear21.5%
Wind 5.5%Coal 4.5%
Gas 4% Oil 4.4%Wind 1.1%
Biomass 7.6%
CAMPINAS, BR
Hydro70.6%
Gas11.3%
Coal 2.6%
1.67 BILLION TONNESREPORTED
ASPEN 100%SANTA MONICA 100%SAN FRANCISCO 100%STOCKHOLM 100%VANCOUVER 93%CANBERRA 90%AUSTIN 55%ADELAIDE 50%LOS ANGELES 33%SYDNEY 30%
CITIES TAKE ACTION.
CITIES PRESENT AN OPPORTUNITY.
THE RESULTS ARE DIVERSE. REVEALING MIXES FROM 100% NON-FOSSIL TO 100% CONTINUED RELIANCE ON FOSSIL AND MANY COMBINATIONS THEREOF.
86% of these cities see an
San Francisco has brought together public and private stakeholders to form a task force that highlighted barriers and opportunities for renewable electricity.
BUILDING CONSENSUS FROM SF TO STOCKHOLM.
Following a broad consultation, Stockholm prepared a roadmap outlining the steps the city and other have to take to achieve their 2050 goal.
1 MILtCO2
Cape Town could reduce CO2e by 1 million tonnes, equivalent to 300 wind turbines.
CAPETOWN
ECONOMICOPPORTUNITYin climate change.
100
100100

33Emissions – Community
Emissions – Community
5.1 Date and boundary Atlanta is reporting a GHG measurement inventory for a period of one year.
Tue 01 Jan 2013 - Tue 31 Dec 2013
Boundary typology used for Atlanta’s GHG emissions inventory:
Administrative boundary of a local government

CDP Cities 2015 Atlanta34
5.2 GHG emissions data Atlanta has used the Global Protocol for Community-Scale Greenhouse Gas Emissions Inventories (GPC), (WRI, C40 and ICLEI).
The Atlanta Mayor’s Office of Sustainability uses the Global Protocol for Community-Scale Greenhouse Gas Emission Inventories (GPC) as the framework for its annual citywide greenhouse gas (GHG) reports, which is consistent with international standards. The GPC level selected for the 2013 reports was BASIC. This level will serve as a baseline for more comprehensive reports in the future. This report included emissions from electricity and natural gas consumption, vehicles, city-owned landfills, municipal solid waste (MSW) generated inside the city but sent to landfills outside city limits, and emissions from wastewater treatment plants (WWTP), MARTA, and the Hartsfield-Jackson Atlanta International Airport (excluding aviation fuel emissions). All these emitting sources are in compliance with the GPC protocol.
Gases included in emissions inventory:
CO2CH4N2O

35Emissions – Community
Total (Scope 1 + 2) emissions for Atlanta:
8,857,265Metric tonnes CO2e
Breakdown of Atlanta’s GHG emissions by scope: Scopes are a common categorisation method. Scope 1: All direct GHG emissions (with the exception of direct CO2 emissions from biogenic sources). Scope 2: Indirect GHG emissions associated with the consumption of purchased or acquired electricity, steam, heating, or cooling.
Total Scope 1 activity
3,440,523Metric tonnes CO2e
Total Scope 2 activity
5,416,741Metric tonnes CO2e
Breakdown of these emissions by end user, economic sector, IPCC sector, GHG or any other classification system used:End user: buildings, water, waste, transport. Economic sector: residential, commercial, industrial, institutional. IPCC sector: stationary combustion, mobile combustion, industrial processes, waste. Greenhouse gas: CO2, CH4, N2O etc.
Stationary Energy: energy use – Scope 1
811,834Metric tonnes CO2e

CDP Cities 2015 Atlanta36
Stationary Energy: energy use – Scope 2
4,800,781Metric tonnes CO2e
Transportation – Scope 1
2,500,541Metric tonnes CO2e
Transportation – Scope 2
281,302Metric tonnes CO2e
Waste: waste generated within the city boundary – Scope 1
128,148Metric tonnes CO2e
Waste: waste generated within the city boundary – Scope 2
334,657Metric tonnes CO2e
Total Basic Emissions
8,857,265Metric tonnes CO2e

37Emissions – Community
5.3 External verification
Atlanta’s emissions have decreased.
The decrease of emissions from the previous year was very small (0.52%) mainly caused by energy efficiency measures. The City is planning to increase its energy efficiency and follow a climate action plan to increase reductions to meet its 2020 climate targets.
Atlanta’s emissions have been externally verified.
Valerie Thomas, Ph.D.
2014
Doctor Thomas is an independent contractor with the Georgia Institute of Technology (Georgia Tech).

CDP Cities 2015 Atlanta38
#CDPCities#COP21
...the combined population of three G7 nations - America, Britain and France.
of emissions (CO2e) for all reporting cities.
the number that reported in the survey’s first year, 2011.
IT’S6XMORE
people live in these cities, accounting for 6% of global population, or...
446,000,000
reported to the world’s definitive study on cities and climate change.
IN 2015,308CITIES
CAN CITIESQUIT FOSSIL FUELS? YES.of the 162 cities report that
already more than
35% of theirelectricity is
from non-fossilfuel sources.
75%Year on year, CDP is supporting more cities in tackling climate change. 2015 CDP data reveals that in many countries, cities are leading the way in making the global switch to renewable energy. Through their commitment to action and innovative identification of projects, cities are showing that the shift to non-fossil energy is within our reach. The challenge now is to match projects to funding, and to ensure a fair distribution between developed and developing cities - an important issue in the run up to COP21 in Paris in December 2015 and beyond.
TO PARISAND BEYOND
...innovationand collaboration.
More than half of the world’s people
live in them.Cities consume...
CITIESARE
HUBS FOR... 78% 12.6gt
CO2
...of energy globally.
Untapped potential in cities can significantly
accelerate a globalshift away from
fossil fuels.
Power generationis the single largest
carbon emitter - and by a big margin.
Per year, the power marketcurrently emits...
This number isprojected to
double by 2040.Our data reveals thatcities can directly and
indirectly influence thissector - in a big way.
Gas 2%
Geothermal 2%
46 LATINAMERICANCITIES
55 NORTH AMERICANCITIES
4 AFRICANCITIES
38 EUROPEANCITIES
19 ASIAN/OCEANIAN
CITIESEnergy mix by non-fossil %
76% 0%
Coal33%
Gas20%
Nuclear21%
Hydro16%
Oil 1%
Wind
6%
Geothermal 1%
Biomass 1%
Solar 1%
Hydro72%
Geothermal 2%
Biomass 2%
Oil13%
Gas8%
Coal 4%
Hydro25%
Wind13%
Nuclear11%
Gas18%
Coal16%
Oil7%
Biomass 4%Solar 4%
Gas36%
Coal32%
Oil17%
Hydro
6%
Nuclear 5%
Wind 3%
Solar 1%
Hydro50%
Coal40%
Nuclear 1%
Oil7%
revealing a diversity of responses, for cities large and small across all regions.
LONDON, UK
Hydro 1.2%
Gas26.7%
Wind 7.7%
Coal40.7%
Biomass21.1%
Nuclear 2.8%
NEW YORK, US
Hydro 1%
Nuclear19%
Gas78%
Oil 1%
CITIESAIM HIGH.These cities have set themselves renewable electricity targets:
JUST A LITTLECHANGEWILL GO FAR.
$57 TRILLIONwill be invested in infrastructure through 2030. That means that less than 0.01% of this sum, or just
$1 OF EVERY $8Kspent is required to support delivery of renewable goals for all the CDP cities that report a target. At just over $7 billion in total, this is still a large price tag and represents a considerable challenge for cities, but with global focus it can be achieved.
43 cities reported that they want private sector support to deliver community renewable projects. CDP data indicates that less than half of these projects are located in the global south.
96 CITIESor 1/3 of cities that reported are taking action to de-carbonize their energy supply.
CAN CITIES QUIT FOSSIL FUELS?
162 CITIES REPORTED THEIR ENERGY MIX,
REYKJAVÍK, IS
Hydro70%
Geothermal30%
Biomass 6.5%
STOCKHOLM, SE
Hydro58%
Nuclear21.5%
Wind 5.5%Coal 4.5%
Gas 4% Oil 4.4%Wind 1.1%
Biomass 7.6%
CAMPINAS, BR
Hydro70.6%
Gas11.3%
Coal 2.6%
1.67 BILLION TONNESREPORTED
ASPEN 100%SANTA MONICA 100%SAN FRANCISCO 100%STOCKHOLM 100%VANCOUVER 93%CANBERRA 90%AUSTIN 55%ADELAIDE 50%LOS ANGELES 33%SYDNEY 30%
CITIES TAKE ACTION.
CITIES PRESENT AN OPPORTUNITY.
THE RESULTS ARE DIVERSE. REVEALING MIXES FROM 100% NON-FOSSIL TO 100% CONTINUED RELIANCE ON FOSSIL AND MANY COMBINATIONS THEREOF.
86% of these cities see an
San Francisco has brought together public and private stakeholders to form a task force that highlighted barriers and opportunities for renewable electricity.
BUILDING CONSENSUS FROM SF TO STOCKHOLM.
Following a broad consultation, Stockholm prepared a roadmap outlining the steps the city and other have to take to achieve their 2050 goal.
1 MILtCO2
Cape Town could reduce CO2e by 1 million tonnes, equivalent to 300 wind turbines.
CAPETOWN
ECONOMICOPPORTUNITYin climate change.
100
100100

#CDPCities#COP21
...the combined population of three G7 nations - America, Britain and France.
of emissions (CO2e) for all reporting cities.
the number that reported in the survey’s first year, 2011.
IT’S6XMORE
people live in these cities, accounting for 6% of global population, or...
446,000,000
reported to the world’s definitive study on cities and climate change.
IN 2015,308CITIES
CAN CITIESQUIT FOSSIL FUELS? YES.of the 162 cities report that
already more than
35% of theirelectricity is
from non-fossilfuel sources.
75%Year on year, CDP is supporting more cities in tackling climate change. 2015 CDP data reveals that in many countries, cities are leading the way in making the global switch to renewable energy. Through their commitment to action and innovative identification of projects, cities are showing that the shift to non-fossil energy is within our reach. The challenge now is to match projects to funding, and to ensure a fair distribution between developed and developing cities - an important issue in the run up to COP21 in Paris in December 2015 and beyond.
TO PARISAND BEYOND
...innovationand collaboration.
More than half of the world’s people
live in them.Cities consume...
CITIESARE
HUBS FOR... 78% 12.6gt
CO2
...of energy globally.
Untapped potential in cities can significantly
accelerate a globalshift away from
fossil fuels.
Power generationis the single largest
carbon emitter - and by a big margin.
Per year, the power marketcurrently emits...
This number isprojected to
double by 2040.Our data reveals thatcities can directly and
indirectly influence thissector - in a big way.
Gas 2%
Geothermal 2%
46 LATINAMERICANCITIES
55 NORTH AMERICANCITIES
4 AFRICANCITIES
38 EUROPEANCITIES
19 ASIAN/OCEANIAN
CITIESEnergy mix by non-fossil %
76% 0%
Coal33%
Gas20%
Nuclear21%
Hydro16%
Oil 1%
Wind
6%
Geothermal 1%
Biomass 1%
Solar 1%
Hydro72%
Geothermal 2%
Biomass 2%
Oil13%
Gas8%
Coal 4%
Hydro25%
Wind13%
Nuclear11%
Gas18%
Coal16%
Oil7%
Biomass 4%Solar 4%
Gas36%
Coal32%
Oil17%
Hydro
6%
Nuclear 5%
Wind 3%
Solar 1%
Hydro50%
Coal40%
Nuclear 1%
Oil7%
revealing a diversity of responses, for cities large and small across all regions.
LONDON, UK
Hydro 1.2%
Gas26.7%
Wind 7.7%
Coal40.7%
Biomass21.1%
Nuclear 2.8%
NEW YORK, US
Hydro 1%
Nuclear19%
Gas78%
Oil 1%
CITIESAIM HIGH.These cities have set themselves renewable electricity targets:
JUST A LITTLECHANGEWILL GO FAR.
$57 TRILLIONwill be invested in infrastructure through 2030. That means that less than 0.01% of this sum, or just
$1 OF EVERY $8Kspent is required to support delivery of renewable goals for all the CDP cities that report a target. At just over $7 billion in total, this is still a large price tag and represents a considerable challenge for cities, but with global focus it can be achieved.
43 cities reported that they want private sector support to deliver community renewable projects. CDP data indicates that less than half of these projects are located in the global south.
96 CITIESor 1/3 of cities that reported are taking action to de-carbonize their energy supply.
CAN CITIES QUIT FOSSIL FUELS?
162 CITIES REPORTED THEIR ENERGY MIX,
REYKJAVÍK, IS
Hydro70%
Geothermal30%
Biomass 6.5%
STOCKHOLM, SEHydro58%
Nuclear21.5%
Wind 5.5%Coal 4.5%
Gas 4% Oil 4.4%Wind 1.1%
Biomass 7.6%
CAMPINAS, BR
Hydro70.6%
Gas11.3%
Coal 2.6%
1.67 BILLION TONNESREPORTED
ASPEN 100%SANTA MONICA 100%SAN FRANCISCO 100%STOCKHOLM 100%VANCOUVER 93%CANBERRA 90%AUSTIN 55%ADELAIDE 50%LOS ANGELES 33%SYDNEY 30%
CITIES TAKE ACTION.
CITIES PRESENT AN OPPORTUNITY.
THE RESULTS ARE DIVERSE. REVEALING MIXES FROM 100% NON-FOSSIL TO 100% CONTINUED RELIANCE ON FOSSIL AND MANY COMBINATIONS THEREOF.
86% of these cities see an
San Francisco has brought together public and private stakeholders to form a task force that highlighted barriers and opportunities for renewable electricity.
BUILDING CONSENSUS FROM SF TO STOCKHOLM.
Following a broad consultation, Stockholm prepared a roadmap outlining the steps the city and other have to take to achieve their 2050 goal.
1 MILtCO2
Cape Town could reduce CO2e by 1 million tonnes, equivalent to 300 wind turbines.
CAPETOWN
ECONOMICOPPORTUNITYin climate change.
100
100100

CDP Cities 2015 Atlanta40
6.1 Local government operations – GHG emissions reduction
Atlanta has a GHG emissions reduction target in place for local government operations.
Strategy

41Strategy
Atlanta’s local government operations GHG emissions reduction target in detail:
Baseline year
2009Baseline emissions
538,988Metric tonnes CO2e
Percentage reduction target
20%Target date
2020The City of Atlanta is the largest property owner impacted by the Atlanta buildings energy efficiency legislation with some 110 buildings subject to the portfolio requirements. Already benchmarking its assets, the City is expected to begin performance reporting in the fall of 2015. The City is soliciting proposals from qualified Energy Service Providers (ESPs) capable of providing comprehensive energy management and energy-related capital improvement services and equipment for City-owned facilities.

CDP Cities 2015 Atlanta42
Activities undertaken to reduce Atlanta’s emissions in its government operations:
Buildings
Energy efficiency/retrofit measuresAnticipated total reduction: 150,000 metric tonnes CO2eBenchmarking and retro-commissioning of municipal buildings
Outdoor Lighting
LED / CFL / other luminaire technologiesAnticipated total reduction: 20,000 metric tonnes CO2eReplace all the streetlight with LED
#CDPCities#COP21
...the combined population of three G7 nations - America, Britain and France.
of emissions (CO2e) for all reporting cities.
the number that reported in the survey’s first year, 2011.
IT’S6XMORE
people live in these cities, accounting for 6% of global population, or...
446,000,000
reported to the world’s definitive study on cities and climate change.
IN 2015,308CITIES
CAN CITIESQUIT FOSSIL FUELS? YES.of the 162 cities report that
already more than
35% of theirelectricity is
from non-fossilfuel sources.
75%Year on year, CDP is supporting more cities in tackling climate change. 2015 CDP data reveals that in many countries, cities are leading the way in making the global switch to renewable energy. Through their commitment to action and innovative identification of projects, cities are showing that the shift to non-fossil energy is within our reach. The challenge now is to match projects to funding, and to ensure a fair distribution between developed and developing cities - an important issue in the run up to COP21 in Paris in December 2015 and beyond.
TO PARISAND BEYOND
...innovationand collaboration.
More than half of the world’s people
live in them.Cities consume...
CITIESARE
HUBS FOR... 78% 12.6gt
CO2
...of energy globally.
Untapped potential in cities can significantly
accelerate a globalshift away from
fossil fuels.
Power generationis the single largest
carbon emitter - and by a big margin.
Per year, the power marketcurrently emits...
This number isprojected to
double by 2040.Our data reveals thatcities can directly and
indirectly influence thissector - in a big way.
Gas 2%
Geothermal 2%
46 LATINAMERICANCITIES
55 NORTH AMERICANCITIES
4 AFRICANCITIES
38 EUROPEANCITIES
19 ASIAN/OCEANIAN
CITIESEnergy mix by non-fossil %
76% 0%
Coal33%
Gas20%
Nuclear21%
Hydro16%
Oil 1%
Wind
6%
Geothermal 1%
Biomass 1%
Solar 1%
Hydro72%
Geothermal 2%
Biomass 2%
Oil13%
Gas8%
Coal 4%
Hydro25%
Wind13%
Nuclear11%
Gas18%
Coal16%
Oil7%
Biomass 4%Solar 4%
Gas36%
Coal32%
Oil17%
Hydro
6%
Nuclear 5%
Wind 3%
Solar 1%
Hydro50%
Coal40%
Nuclear 1%
Oil7%
revealing a diversity of responses, for cities large and small across all regions.
LONDON, UK
Hydro 1.2%
Gas26.7%
Wind 7.7%
Coal40.7%
Biomass21.1%
Nuclear 2.8%
NEW YORK, US
Hydro 1%
Nuclear19%
Gas78%
Oil 1%
CITIESAIM HIGH.These cities have set themselves renewable electricity targets:
JUST A LITTLECHANGEWILL GO FAR.
$57 TRILLIONwill be invested in infrastructure through 2030. That means that less than 0.01% of this sum, or just
$1 OF EVERY $8Kspent is required to support delivery of renewable goals for all the CDP cities that report a target. At just over $7 billion in total, this is still a large price tag and represents a considerable challenge for cities, but with global focus it can be achieved.
43 cities reported that they want private sector support to deliver community renewable projects. CDP data indicates that less than half of these projects are located in the global south.
96 CITIESor 1/3 of cities that reported are taking action to de-carbonize their energy supply.
CAN CITIES QUIT FOSSIL FUELS?
162 CITIES REPORTED THEIR ENERGY MIX,
REYKJAVÍK, IS
Hydro70%
Geothermal30%
Biomass 6.5%
STOCKHOLM, SE
Hydro58%
Nuclear21.5%
Wind 5.5%Coal 4.5%
Gas 4% Oil 4.4%Wind 1.1%
Biomass 7.6%
CAMPINAS, BR
Hydro70.6%
Gas11.3%
Coal 2.6%
1.67 BILLION TONNESREPORTED
ASPEN 100%SANTA MONICA 100%SAN FRANCISCO 100%STOCKHOLM 100%VANCOUVER 93%CANBERRA 90%AUSTIN 55%ADELAIDE 50%LOS ANGELES 33%SYDNEY 30%
CITIES TAKE ACTION.
CITIES PRESENT AN OPPORTUNITY.
THE RESULTS ARE DIVERSE. REVEALING MIXES FROM 100% NON-FOSSIL TO 100% CONTINUED RELIANCE ON FOSSIL AND MANY COMBINATIONS THEREOF.
86% of these cities see an
San Francisco has brought together public and private stakeholders to form a task force that highlighted barriers and opportunities for renewable electricity.
BUILDING CONSENSUS FROM SF TO STOCKHOLM.
Following a broad consultation, Stockholm prepared a roadmap outlining the steps the city and other have to take to achieve their 2050 goal.
1 MILtCO2
Cape Town could reduce CO2e by 1 million tonnes, equivalent to 300 wind turbines.
CAPETOWN
ECONOMICOPPORTUNITYin climate change.
100
100100

43Emissions – Community

CDP Cities 2015 Atlanta44
6.2 Community – GHG emissions reduction
Atlanta has a GHG emissions reduction target in place for its community.
Atlanta’s community GHG emissions reduction target in detail:
2009Baseline emissions
10,267,363Metric tonnes CO2e
Percentage reduction target
20%Target date
2020
45Strategy
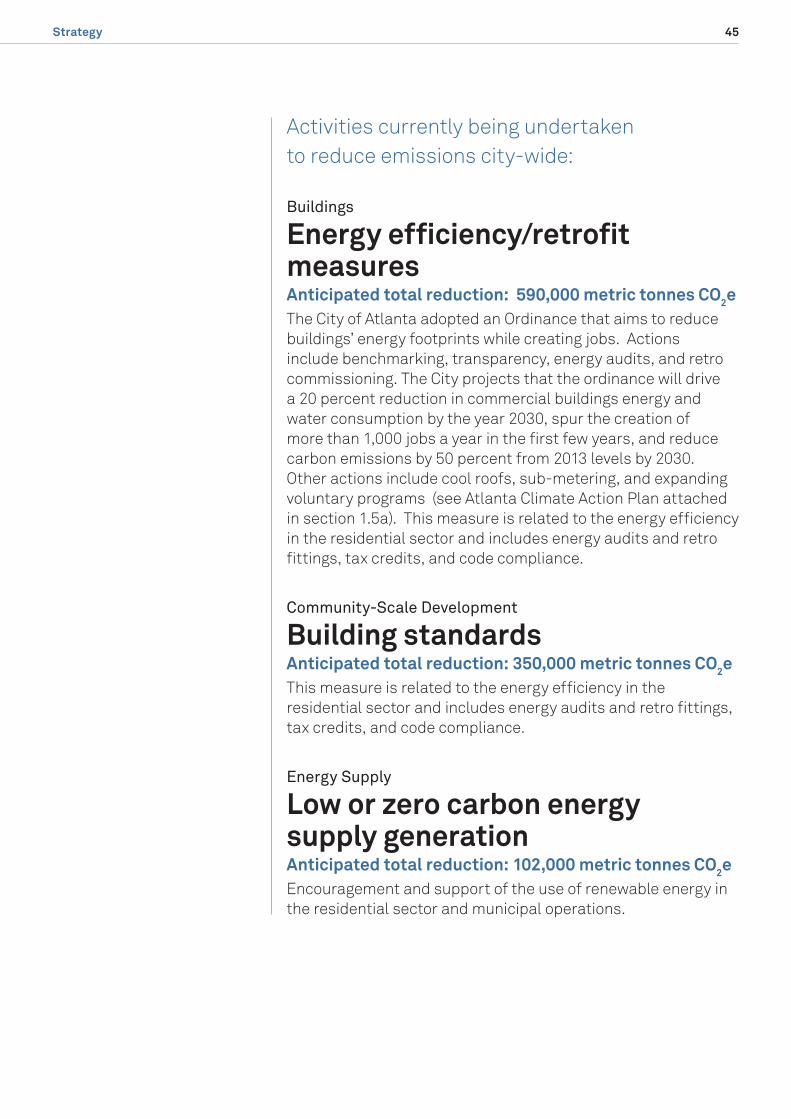
Activities currently being undertaken to reduce emissions city-wide:
Buildings
Energy efficiency/retrofit measuresAnticipated total reduction: 590,000 metric tonnes CO2eThe City of Atlanta adopted an Ordinance that aims to reduce buildings’ energy footprints while creating jobs. Actions include benchmarking, transparency, energy audits, and retro commissioning. The City projects that the ordinance will drive a 20 percent reduction in commercial buildings energy and water consumption by the year 2030, spur the creation of more than 1,000 jobs a year in the first few years, and reduce carbon emissions by 50 percent from 2013 levels by 2030. Other actions include cool roofs, sub-metering, and expanding voluntary programs (see Atlanta Climate Action Plan attached in section 1.5a). This measure is related to the energy efficiency in the residential sector and includes energy audits and retro fittings, tax credits, and code compliance.
Community-Scale Development
Building standardsAnticipated total reduction: 350,000 metric tonnes CO2eThis measure is related to the energy efficiency in the residential sector and includes energy audits and retro fittings, tax credits, and code compliance.
Energy Supply
Low or zero carbon energy supply generationAnticipated total reduction: 102,000 metric tonnes CO2eEncouragement and support of the use of renewable energy in the residential sector and municipal operations.

CDP Cities 2015 Atlanta46
Waste
Recycling or composting collections and/or facilitiesAnticipated total reduction: 66,900 metric tonnes CO2eEducation and pricing mechanisms to increase diversion rate from landfill.
Water
Water metering and billingAnticipated total reduction: 602,000 metric tonnes CO2eOptimization of water distribution system and conservation measures.
Private Transport
Infrastructure for non-motorized transportAnticipated total reduction: 374,000 metric tonnes CO2eIncrease AFV (alternative fuel vehicles) usage and infrastructure and reduce VMT emissions by implementing policies such as congestion or emissions pricing.
Community-Scale Development
Green space and/ or biodiversity preservation and expansionAnticipated total reduction: 10,000 metric tonnes CO2eIncrease green spaces (urban parks) and urban canopy to reduce the heat island effect. Allow accessibility to parks (half a mile) to 45% of the city population.
Food and Agriculture
Encourage sustainable food production and consumptionAnticipated total reduction: 5,000 metric tonnes CO2ePromote the development and marketing of products from urban gardens and vertical farms and reduce food deserts.

47Strategy
6.3 Planning The city-wide energy mix for Atlanta’s electricity:
Gas
39%Coal
35%Nuclear
23%Hydro
3%
Atlanta has a renewable energy target:
Municipal
5%City-wide
1%Target date
2020

CDP Cities 2015 Atlanta48
Increased water stress or scarcityRisk: Timescale: In 2007, the Atlanta region was affected by the worst drought and largest forest fire in over 100 years, with damage estimated at over $1 billion. The drought was repeated in 2013, followed by the sixth heaviest May calendar day rain storm on record.
FloodingRisk: Timescale: In 2009, the City of Atlanta was affected by floods of historic proportion, breaking records that went back more than a century in some locations. The Chattahoochee River, the largest river in the region, measured water levels at a 500-year flood level.
Atlanta foresees substantive risks to its water supply in the short or long term.
Risks to Atlanta’s water supply as well as timescale:
Long-termMedium-term
CurrentTimescale
Short-term
SeriousnessExtremely SeriousSeriousLess Serious
6.4 Water

49Strategy
Actions that Atlanta is taking to reduce risks to its water supply:
Increased water stress or scarcity
Municipal water efficiency retrofitsThe City of Atlanta is committed to improving its aged drinking water infrastructure by finding leaks and repairing or replacing those pipes. The Mayor’s goal is to reduce system water loss from leakage by 50%.
Flooding
Stormwater management (natural or man-made infrastructure)The Department of Watershed Management has recently updated the Post-Development Stormwater Management Ordinance to promote the use of green infrastructure on new and redevelopment projects in the City. Green infrastructure uses natural hydrologic features to manage water and provide environmental and community benefits. On development sites, green infrastructure includes engineered practices that are designed to mimic natural hydrology by infiltrating stormwater runoff into the ground, evapotranspiration (uptake of water by plants) in landscaped areas, or capturing and reusing the runoff through rainwater harvesting techniques.


CDP team
Conor Riffle Director, Cities and Data Product Innovation
Maia Kutner Head of Cities
Andreia Banhe Account Manager, Latin America
Hanah Paik Account Manager, Asia Pacific
Katie Walsh Account Manager, North America
Juliette Daniels Account Manager, Europe, Middle East, and Africa
Sara Telahoun Project Officer
Simeran Bachra Data Analyst
CDP Board of Trustees
Chairman: Alan Brown Wellcome Trust
Ben Goldsmith WHEB Group
Chris Page Rockefeller Philanthropy Advisors
James CameronOverseas Development Institute (ODI)
Jeremy BurkeGreen Investment Bank
Jeremy Smith
Kate HamptonChildren’s Investment Fund Foundation
Martin Wise Relationship Capital Partners
Takejiro SueyoshiTessa Tennant
AECOM team
Claire Bonham-Carter Principal
Ben Smith Director of Sustainable Development
Culley Thomas Senior Strategic Planner
Christopher Pountney Principal Engineer, Sustainability
Daniel Elsea Creative Director
Contact Claire Bonham-Carter AECOM +1 415 955 2800 [email protected] www.aecom.com
C40 team
Seth Schultz Head of Research, Measurement and Planning
Michael Doust Head of Measurement and Planning
Brooke Russell Head of Editorial and Content
Kathryn Vines Head of Climate Change Adaptation Research
Hanya Gartner Manager, City Reporting
CDP 3rd Floor, Quadrant House,
4 Thomas More Square,
Thomas More Street,
London,
E1W 1YW
Tel: +44 (0) 20 3818 3900
www.cdp.net [email protected] @CDP
Lead sponsors