city of austin office of sustainability 2010-2011 of austin office of sustainability 2010-2011 “...
TRANSCRIPT

City of Austinoffice of sustainability2010-2011
“ Join us on the journeyto a more sustainable future in the city we
call home.”

A Message from theChief Sustainability Officer
I am proud to present the 2011 City of Austin Climate Action Report. We are recognized both nationally and internationally for our sustainability leadership and
aggressive climate protection goals. 2011 was a year of milestones and accomplishments.
To cite a few: Austin Energy Green Building celebrated its 20th anniversary. Voters passed the City’s first mobility bond package focused on multi-modal livabil-ity. The City, along with regional partners, is using a $3.7 million federal Sustainable Communities grant to pursue a regional Sustainable Places Project. We’re one of 10 pilot cities now refining a new national sustain-ability benchmarking tool, the STAR Community Index. And shortly before this report went to press, the Austin Convention Center earned a Gold certification under the LEED for Existing Buildings rating system.
Since joining the City as its first Chief Sustainability Officer last September, I have spent my days listening and learning, and have spoken to more than 2,000 people. In June, I represented Austin at the C40 Cities Climate Leadership Summit in São Paulo, Brazil, along-side our new Climate Program Manager, Zach Baumer. Learning from the actions of other major global cities reinforces our sense of urgency about planning for the future. Fortunately, the Imagine Austin Comprehensive Plan coming forward has sustainability as its central theme.
In the days ahead, the Office of Sustainability will continue working to advance green initiatives across the City and the community. Those include helping local businesses trim operating expenses by conserving resources, and releasing a broad sustainability agenda including more than 30 of the City’s most vision-
ary initiatives. Healthy food and sustainable urban agriculture is a new City focus, and we’ve developed a downtown self-guided tour and map featuring Austin’s
“green gems.”It’s heartening and inspiring to see first-hand the
many steps Austinites are taking to lower their carbon footprints and help secure a sustainable future. Of course, there is much more to be done. If you are already part of the important work of climate action, I thank you for your efforts. If you have yet to take part, please join us on the journey to a more sustainable future in the city we call home.
austin climate protection program joins the office of sustainability
septemberNew Office of Sustainability
launched as part of City
Manager’s Office, sending a
clear signal from executive
leadership that sustain-
ability is a core value.
decemberCity Manager Marc Ott
moves the Austin Climate
Protection Program within
the City's new Office of
Sustainability to position it
for greater citywide impact.
februaryAustin Climate Protection
Program leader Ester
Matthews retires from
Austin Energy after 23 years
of service.
mayZach Baumer begins leader-
ship role as new Climate
Program Manager, after a
national search.
ongoingClimate action is inte-
grated into the Office of
Sustainability's work to
connect and amplify green
initiatives citywide, as part
of a foundation for Austin's
enduring prosperity.
2010 2011
Lucia Athens. Photo: Jeff Wilson
future
Climate Action Report A Message from the Chief Sustainability Officer | I

MARC A. OTTCity ManagerSUE EDWARDSAssistant City ManagerLUCIA ATHENSChief Sustainability Officer ZACH BAUMERClimate Program Manager
Office ofSustainability &the Austin ClimateProtection Program Marc CoudertKatherine GregorLeah HaynieKate KruegerMelissa MartinezJenell MoffettNathan PaulsonMary PriddyDylan Siegler
Technical AdvisersAustin EnergySarah Fusco
Carol Harwell
Scott Jarman
Dennis Lilley
Karl Rábago
Austin-Travis County EMSMary Ann Carney
Ernesto Rodriguez
Austin WaterDavid Greene
Jill Mayfield
Joe Smith
Central Texas Clean CitiesStacy Neef Communications & Public Information OfficeDavid Matustik
Samantha Park
Fleet ServicesJennifer Walls
Parks and Recreation DepartmentJake Stewart
Austin Resource RecoveryAiden Cohen
Jennifer Herber
Gena McKinley
Shaun-Marie Auckland
Transportation DepartmentPharr Andrews
Cover art by Lauren JonesAdapted from original works
including photography by
Michael Knox, ASLA
table of contents
II | Table of Contents Climate Action Report
A Message from the Chief Sustainability Officer I
the big picture 01-05Zach Baumer Takes the Helm at the Austin Climate Protection Program 01Austin’s Climate Action Leadership 02Preparing Austin for the Unpredictable: Becoming Resilient to a Changing Climate 02map: Extreme Drought Persists in Central Texas 03graph: City Government Emission Reduction Targets Around the World 04Going Climate Neutral: How We’ll Reach our 2020 Goals 05
city government impacts 06-10City Departments Work to Shrink Carbon Footprints 06graph: City Departments’ Greenhouse Gas Emissions 06City of Austin Departments & Facilities switch to 100% GreenChoice® 07graph: City of Austin Total Energy Consumption 07graph: City Operations Emissions Reductions 2007-2010 08graph: City Operations Emissions Breakdown 08Reducing Emissions through Renewable Energy & Alternative Fuels 09Ambulances Tap the Sun for Power 09Follow the Fleet: City Adopts Alternative Fuels 10graph: City Government Fuel Use 10
community climate action 11-21Bringing Climate Cool to School: Educating Austin’s Kids on Climate Action 11Survey Gauges Priorities for Austin’s Future 11Austin is a Heat Island, and Trees are Part of the Solution 13UT Architecture Students Design for Climate Resilience 13Keep Austin Edible: Encouraging Austin-Grown Foods 14City Staff Investigate Biochar for Carbon Sequestration 14Change is in the Air: Assessing Austin’s Air Quality 15graph: Ozone Trends in the Austin Area 15Comparing our Community’s Carbon Footprint 16graph: Travis County Greenhouse Gas Inventory 16graph: Greenhouse Gas Emissions per Capita 16How We Take Stock of Community Emissions 17Community Climate Action: City Builds on Stakeholders’ Bright Ideas 18A Local Way to Offset your Carbon is Coming 18New City Program Recognizes Local Companies that Go Green 19Business Climate: Green Jobs are a Reality in Austin 19Sustainability by the Numbers 20City Map Locates Austin’s Sustainable Sites 21
A Message from the City Manager 22
more information
Email:[email protected]
Office of Sustainability:AustinTexas.gov/Sustainability
Social Media:Facebook.com/AustinSustainability
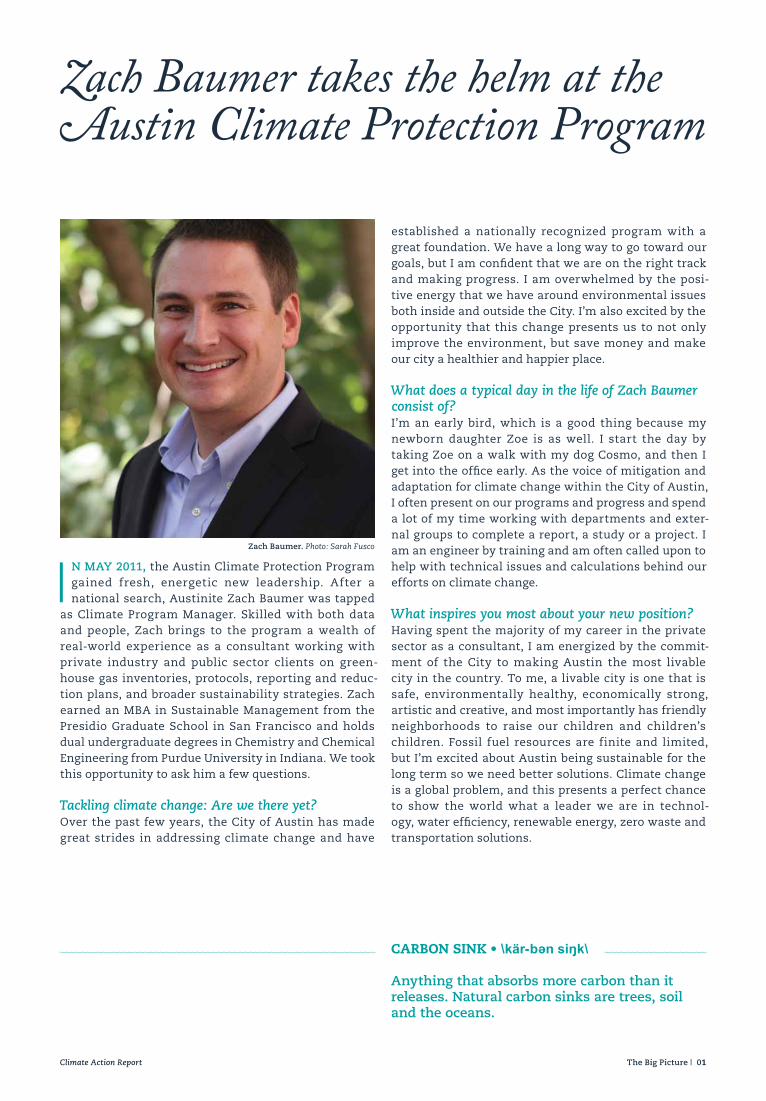
I N MAy 2011, the Austin Climate Protection Program gained fresh, energetic new leadership. After a national search, Austinite Zach Baumer was tapped
as Climate Program Manager. Skilled with both data and people, Zach brings to the program a wealth of real-world experience as a consultant working with private industry and public sector clients on green-house gas inventories, protocols, reporting and reduc-tion plans, and broader sustainability strategies. Zach earned an MBA in Sustainable Management from the Presidio Graduate School in San Francisco and holds dual undergraduate degrees in Chemistry and Chemical Engineering from Purdue University in Indiana. We took this opportunity to ask him a few questions.
Tackling climate change: Are we there yet?Over the past few years, the City of Austin has made great strides in addressing climate change and have
established a nationally recognized program with a great foundation. We have a long way to go toward our goals, but I am confident that we are on the right track and making progress. I am overwhelmed by the posi-tive energy that we have around environmental issues both inside and outside the City. I’m also excited by the opportunity that this change presents us to not only improve the environment, but save money and make our city a healthier and happier place.
What does a typical day in the life of Zach Baumer consist of?I’m an early bird, which is a good thing because my newborn daughter Zoe is as well. I start the day by taking Zoe on a walk with my dog Cosmo, and then I get into the office early. As the voice of mitigation and adaptation for climate change within the City of Austin, I often present on our programs and progress and spend a lot of my time working with departments and exter-nal groups to complete a report, a study or a project. I am an engineer by training and am often called upon to help with technical issues and calculations behind our efforts on climate change.
What inspires you most about your new position?Having spent the majority of my career in the private sector as a consultant, I am energized by the commit-ment of the City to making Austin the most livable city in the country. To me, a livable city is one that is safe, environmentally healthy, economically strong, artistic and creative, and most importantly has friendly neighborhoods to raise our children and children’s children. Fossil fuel resources are finite and limited, but I’m excited about Austin being sustainable for the long term so we need better solutions. Climate change is a global problem, and this presents a perfect chance to show the world what a leader we are in technol-ogy, water efficiency, renewable energy, zero waste and transportation solutions.
Zach Baumer takes the helm at the Austin Climate Protection Program
carbOn Sink • \kär-bən siŋk\
Anything that absorbs more carbon than it releases. Natural carbon sinks are trees, soil and the oceans.
Zach Baumer. Photo: Sarah Fusco
Climate Action Report The Big Picture | 01

austin’s climate action leadership
preparing austin for the unpredictable
IN 2011, the global scientific evidence and consensus is clear: The world is undoubtedly warming. Recognizing a responsibility to help contain climate change, as well as the local risks and impacts of rising temperatures, in 2007 the Austin City Council passed a resolution that led to creation of the Austin Climate Protection Program. The resolution committed the City to enact “policies, procedures, timelines, and targets as are necessary to make Austin the leading city in the nation in the effort to reduce and reverse the negative impacts of global warming.”
Today, scientists report that the measurable climate change now occurring—caused primarily by carbon dioxide and other greenhouse gases (GHG) from human activities—is advancing even faster than projected in 2007. The Intergovernmental Panel on Climate Change has projected temperature increases by 2100 averaging two to 11.5 degrees Fahrenheit globally, with warming in the U.S. about 50 percent greater, according to the Pew Center on Global Climate Change.
No one city can avert climate change alone. Austin is proud to be one of over 1,000 U.S. cities that have committed to collective effort by signing the U.S. Conference of Mayors Climate Protection Agreement, and launching into action. By setting a strong example for municipal climate action, Austin can lead the way and inspire others with innovative solutions.
CENTRAL TExAS has just had a brutally hot summer and is experiencing one of the worst droughts on record, leading to tragic wildfires that burned more than 30,000 acres, killed two people, and destroyed approximately 1,600 homes. The drought has killed trees, plants and wildlife and affected our entire ecosystem. Stressed wildlife must compete for scarce food and water: the drought affects the entire food chain.
No one can say definitively global warming caused any single event. What we do know is that a pattern of increasing extreme weather events is consistent with climate change projections. 2011 has given us a taste of the future predicted by climate science. In Central Texas, we can learn from this year’s record heat wave and drought to assess our vulnerabilities and take posi-tive steps to manage risks in the decades to come.
As global warming is already occurring, and the sources of GHG emissions continue, some future temperature rises are unavoidable. Lower Colorado River Authority modeling predicts that climate change is very likely to increase net evaporation and reduce stream flows in the Colorado River within this century. Extended drought conditions and water shortages are projected in the decades ahead as Texas warms. The City of Austin must begin planning to adapt to a chang-ing climate in Central Texas.
By teaming up with the U.S. Environmental Protection Agency and the Centers for Disease Control, the Climate Protection Program is looking at how climate change will impact health, food, emergency rescue, water, electricity and a host of other issues. How might emergency vehicle routes be impacted by flooding? Are vulnerable popu-lations located within walking distance of food sources? Is Austin ready to receive disaster refugees from neighboring regions? Proactively working with other agencies to develop models and share information will help prepare us for the unpredictable.
Working with other agencies to develop models and share infor-mation will help prepare us for the unpredictable.
cliMatE adaptatiOn • \klī-mət a-dap-tā-shən\
Efforts to anticipate and respond to likely climate change impacts such as shifts in temperature and rain patterns, viable crops, and the spread of diseases. Climate adaptation activities lead to climate resiliency.
02 | The Big Picture Climate Action Report

extreme drought conditions persist in central texas
new York times:December 5, 2011
Carbon dioxide “emissions
rose 5.9 percent in 2010,
according to an analysis
released Sunday by the
Global Carbon Project, an
international collaboration
of scientists tracking the
numbers. Scientists with
the group said the increase,
a half-billion extra tons of
carbon pumped into the
air, was almost certainly
the largest absolute jump
in any year since the
Industrial Revolution, and
the largest percentage
increase since 2003.”
newsweek:May 29, 2011
“In the U.S. alone, nearly
1,000 tornadoes have
ripped across the heartland,
killing more than 500
people and inflicting $9
billion in damage. The
Midwest suffered the
wettest April in 116 years,
forcing the Mississippi to
flood thousands of square
miles, even as drought-
plagued Texas suffered the
driest month in a century.
Worldwide, the litany of
weather’s extremes has
reached biblical proportions.
The 2010 heat wave in
Russia killed an estimated
15,000 people. Floods in
Australia and Pakistan
killed 2,000 and left large
swaths of each country
under water. A months-
long drought in China has
devastated millions of
acres of farmland. And the
temperature keeps rising:
2010 was the hottest year
on earth since weather
records began.”
released: THURSDAy, DECEMBER 15, 2011 authors: MATTHEW ROSENCRANS, National Oceanic & Atmospheric Administration (noaa) / National Weather Service (nws) / National Centers for Environmental Prediction (ncep) / Climate Protection Center (cpc)
intensity:D0 Abnormally DryD1 Drought–ModerateD2 Drought–SevereD3 Drought–ExtremeD4 Drought–Exceptional
drought impact types:Delineates Dominant ImpactsShort-Term: typically <6 months(e.g. agriculture, grasslands)Long-Term: typically >6 months(e.g. hydrology, ecology)
Climate Action Report The Big Picture | 03
http://droughtmonitor.unl.edu/
u.s drought monitor: 12/13/2011
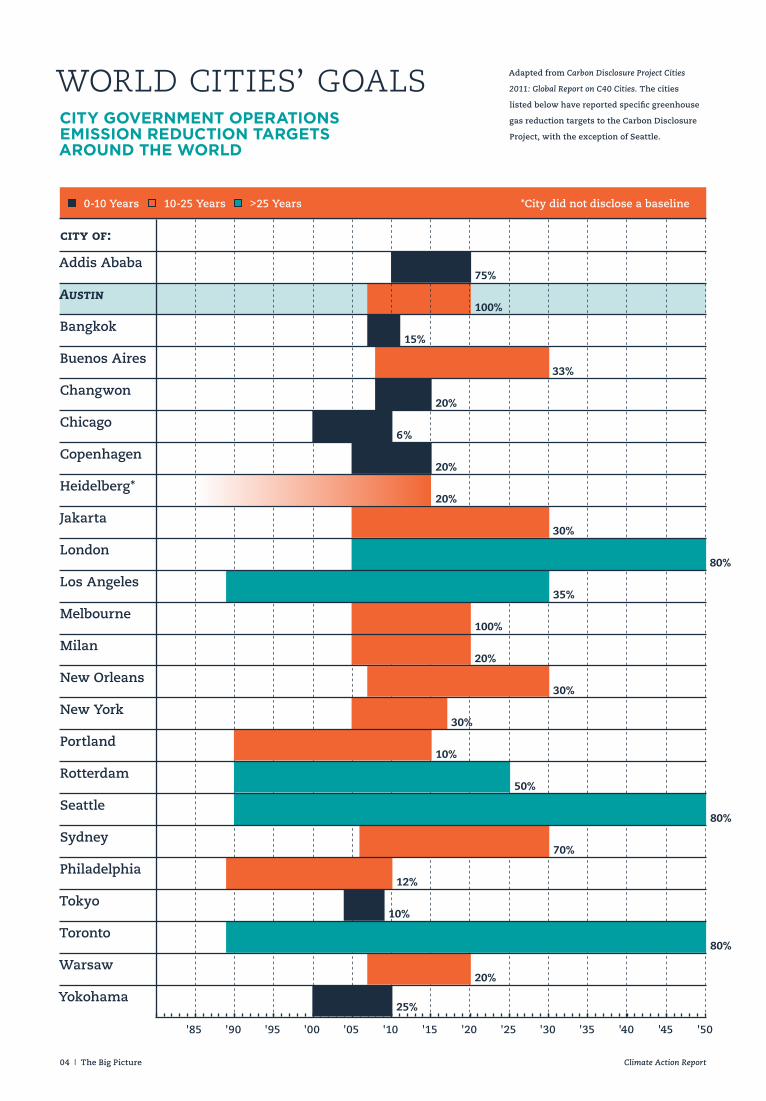
0-10 years *City did not disclose a baseline>25 years10-25 years
world cities’ goalscity government operationsemission reduction targetsaround the world
Addis Ababa
Austin
Bangkok
Buenos Aires
Changwon
Chicago
Copenhagen
Heidelberg*
Jakarta
London
Los Angeles
Melbourne
Milan
New Orleans
New york
Portland
Rotterdam
Seattle
Sydney
Philadelphia
Tokyo
Toronto
Warsaw
yokohama
city of:
'85 '90 '95 '00 '05 '10 '15 '20 '25 '30 '35 '40 '45 '50
75%
15%
33%
20%
20%
20%
30%
80%
35%
100%
20%
20%
25%
30%
30%
10%
50%
70%
12%
10%
80%
80%
6%
100%
04 | The Big Picture Climate Action Report
Adapted from Carbon Disclosure Project Cities
2011: Global Report on C40 Cities. The cities
listed below have reported specific greenhouse
gas reduction targets to the Carbon Disclosure
Project, with the exception of Seattle.

ONLy ONE other major city in the world—Melbourne, Australia—has a municipal climate action target as aggressive as the City of Austin’s. Other major U.S. cities with reduc-tion targets are shooting for less improvement within a longer timespan. Average targets equate to approximately 2.3 percent per year, according to the Carbon Disclosure Project. Our 2020 goal sets a tone of leadership and innova-tion in everything we do to address climate change. In the four years that the Austin Climate Protection Program has shepherded Austin’s pursuit of that goal—by developing
Austin’s greenhouse gas inventories, leading the reduction efforts of City staff, and reaching out to the community—it has become clear that solutions to climate change are the same ones that keep our air breathable, our water clean, our economy vibrant and our communities healthy. When we have reduced our emissions as much as technology allows, we’ll focus on maximizing our natural carbon sinks as well as investing in carbon reduction projects in Central Texas—building local jobs and regional prosperity.
going climate neutral
Solutions to climate change are the same ones that keep our air breathable, our water clean, our economy vibrant and our communities healthy.
reaching our greenhouse gas reduction targets
2012All City Facilities Powered by Renewable Energy
2020800 MW of New Energy Savings through Energy Efficiency & Conservation
202035% Renewable Energy in the Utility’s Portfolio
2020All City of Austin Facilities, Fleets, & Operations Totally Carbon Neutral
MtCO2e • Metric Ton Carbon Dioxide Equivalent
The unit of measurement used as an international reporting standard for greenhouse gas emissions. There are 2204.62 lbs of CO2 in one metric ton.
Climate Action Report The Big Picture | 05
Adapted from original photo by Michael Knox, ASLA

2010 city departmentgreenhouse gas emissions220,000 MTCO2e
city climate action team:23 departments strong
THE CITy of Austin’s oper-ational carbon footprint is shrinking. Twenty-three departmental plans; five bui lding plans ; 1,500 strategies; 219,111 metric tons of CO2 equivalent to go; nine more years: All are part of the complex calculation the City of Austin is working to make its operations, facilities
and vehicle fleets carbon neutral by 2020. Led by the Austin Climate Protection Program, a cross-departmen-tal group of City of Austin staff has identified strategies that may look small on their own—buying renewable energy, powering down computers and monitors, switching out inefficient lighting, eliminating plastic foam cups and vehicle idling—but will equal significant carbon reductions when implemented at the scale of the City of Austin’s 11,000-plus staffers and scores of facilities. Since 2007, departmental teams have watched the overall municipal carbon footprint fall by more than 49,000 metric tons of CO2 equivalent.
to
p 5
co
ntr
ibu
tor
s
Austin Energy
Austin Water
Austin Resource Recovery
27%
47%
04%
07%
05%
Aviation
Austin Police Dept.
Other Departments10%10%
Photo: Jody Horton
06 | City Government Impacts Climate Action Report

making the greenchoice® for city departments & facilities
city operations total energy consumption
AS OF October 1, 2012, 100 percent of the electricity used to power city facilities
comes from Austin Energy’s GreenChoice® program. Subscribers to the program are buying energy produced from entirely renew-able sources like wind power and methane gas from landfills. The City of Austin is now the No. 2 city on the U.S. EPA’s Top 20 Local Government list of green power purchasers—ranked by annual green power usage—and sells more renewable energy through a utility-sponsored, voluntary green-pricing energy program than any of the 850 other programs in the nation. (The City of Houston ranked No. 1, for purchas-ing 438,000,000 kWh. However, that represents only 34% of that city’s energy usage. Austin’s purchase of 406,000,000 kWh represents 100% of municipal energy usage.)
In the last fiscal year, 55 percent of City of Austin electricity accounts—19 percent of total kilowatt hours (kWh) purchased—subscribed to GreenChoice. With the switch to 100 percent for the fiscal year that began October 1, 2011, the City will avoid more than 100,000 metric tons of CO2 emissions per year, which is by far the largest GHG reduction activity it has yet under-taken. The move makes good on City Council’s 2007 commitment to power all City facilities with renewable energy by 2012—making a posi-tive impact on health outcomes and health-care costs by improving air quality.
Does it cost more? Yes, for the moment, but probably not over the long haul. The current fuel charge of just over 3 cents per kWh rises to 5.7 cents per kWh with GreenChoice Batch 6, the sixth offering of GreenChoice power. The good news is, the City will be locked into this rate for years into the future, reducing risk to future City budgets due to rising fossil fuel prices. In fact, subscribers to four of the six GreenChoice batches—including some City accounts—saved money when the regular fuel charge rose above their GreenChoice rate.
Greenchoice® Electricity Metric Tons of CO2 EquivalentNon-Greenchoice® ElectricityNatural Gas
2,000
1,600
1,200
800
400
0
250,000
200,000
150,000
100,000
50,000
02007 2008 2009 2010 2011 2012 2013
actual
mmbtuthousands mtco2e
forecast
City of Austin depart-ments and facilities are now 100% powered by renewable energy
Climate Action Report City Government Impacts | 07

Emissions AvoidedTotal GHG Emissions
greenhouse gas emissions reductions 2007-2010
government operations greenhouse gas emissions breakdown
3,000
2,500
2,000
1,500 2007 (baseline)
Emissions avoided based on baseline levels
2008 2009 2010
269,249255,171 257,225
220,115
300,000
250,000
200,000
150,000
100,000
50,000
0 2007 2008 2009 2010
mtco2e
Total MTCO2eWater Use Vehicle Fuel UseEnergy
mtco2ehundreds
08 | City Government Impacts Climate Action Report
city of austin departments, facilities and fleet

ambulances tap the sun for power
W HEN AUSTIN -Trav is Count y E MS leader s learned that vehicle use made up more than 90 percent of their opera-tional carbon footprint, sirens went off. Director Ernesto Rodriguez knew they could do better. “Our rationale was, we can lead the way in protecting the c l imate —let ’s ex per i-
ment and become the model,” he says. The department purchased new, more fuel-efficient ambulances that, have led to a 47 percent improvement in ambulance miles per gallon and a 31 percent reduction in annual ambulance CO2 emissions (from 45.5 to 31.3 metric tons per ambulance) since October 2010, with no loss in speed or quality of care. The equipment paramedics use to care for patients (plus all those flashing lights) use a lot of energy to function properly. New solar panels
on ambulances—13 have them so far—charge batteries so ambulances idle less at hospitals, meaning each uses 560 fewer gallons of gas per year. “Then we realized, hey! You can save money doing that,” says Rodriguez.
“For us, nothing is cast in stone. We are always looking for better ways to do things, and luckily we have a lot of creative people.”
reducing emissions through renewable energy and alternative fuelsThe Austin Climate Protection Program prepares an annual greenhouse
gas inventory for City of Austin municipal operations, which excludes
Austin Energy power generation, wastewater treatment fugitive emis-
sions, and the FM 812 landfill. The inventory provides a platform to
evaluate and prioritize climate protection initiatives, and functions
as a progress report in Austin’s effort to reduce its greenhouse gas
emissions. The 2010 municipal carbon footprint shows a reduction in
GHG emissions since the baseline inventory conducted in 2007 that’s
equal to taking nearly 10,000 cars off the road for a year. The drop is
due primarily to a large reduction in City of Austin vehicle emissions
through hybrids and less carbon-intensive fuels, as well as purchase of
renewable energy at City of Austin facilities through the Austin Energy
GreenChoice® program.
Climate Action Report City Government Impacts | 09
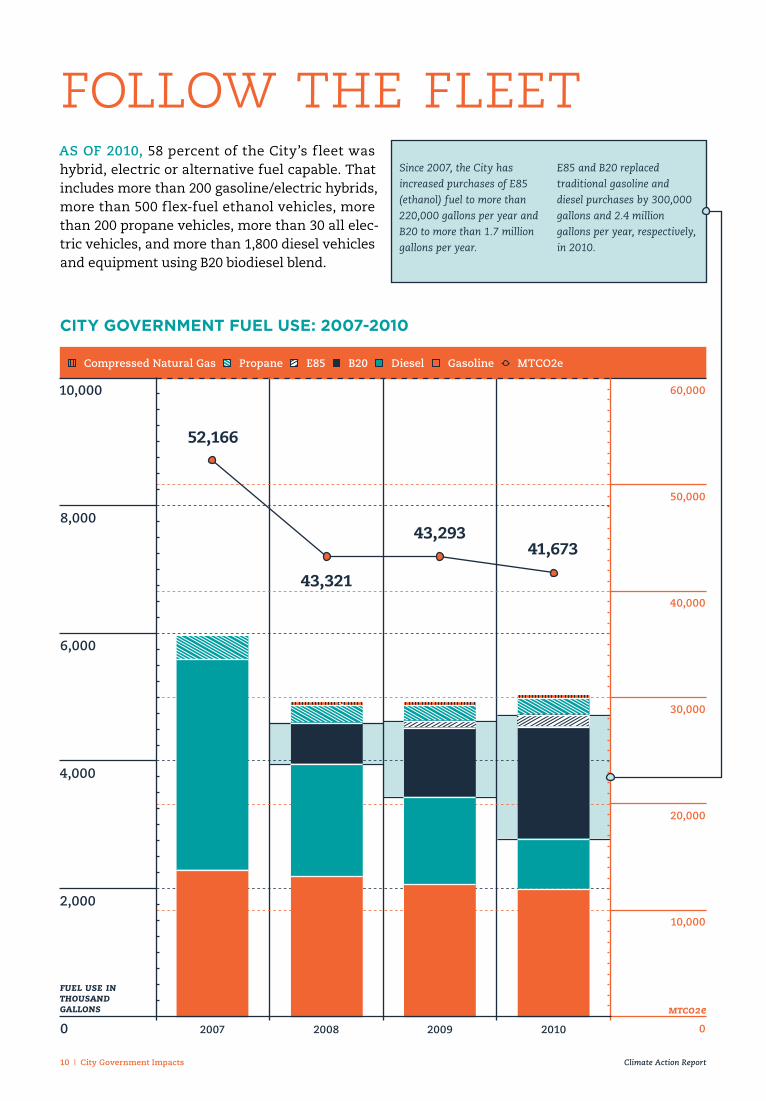
Compressed Natural Gas MTCO2eE85 B20 Diesel GasolinePropane
mtco2e
follow the fleet AS OF 2010, 58 percent of the City’s fleet was hybrid, electric or alternative fuel capable. That includes more than 200 gasoline/electric hybrids, more than 500 flex-fuel ethanol vehicles, more than 200 propane vehicles, more than 30 all elec-tric vehicles, and more than 1,800 diesel vehicles and equipment using B20 biodiesel blend.
Since 2007, the City has
increased purchases of E85
(ethanol) fuel to more than
220,000 gallons per year and
B20 to more than 1.7 million
gallons per year.
E85 and B20 replaced
traditional gasoline and
diesel purchases by 300,000
gallons and 2.4 million
gallons per year, respectively,
in 2010.
10,000
8,000
6,000
4,000
2,000
0
52,166
43,321
43,29341,673
60,000
50,000
40,000
20,000
30,000
10,000
02007 2008 2009 2010
fuel use in thousand gallons
10 | City Government Impacts Climate Action Report
city government fuel use: 2007-2010

survey says...In spring of 2010 more
than 1,300 Austinites
responded to a City of
Austin survey about priori-
ties for our region’s future.
The following percentages
of respondents agreed that
the identified elements
should be a part of
Austin’s future.
Adequate Water Supply Clean Rivers, Creeksand Springs
Climate Protection
Energy Conservation Environmental and Natural Resources Protection
Increased Local Food Production
MARy PRIDDy of the Office of Sustainability br ings the cl imate protect ion message to classrooms and assembly halls all over the
Austin area. More than 1,350 students in kindergarten through 12th grade in Austin-area schools participated in Climate Protection outreach activities in the first six months of 2011. We gave Mary a pop quiz about her job.
Why is it important to reach out to kids about climate protection?Kids are so open to ideas and change. Every kid’s favor-ite question is “why?” If they understand the positive or negative impacts their actions may have on the planet, they’ll be more inclined to make a positive choice.
What is the most inspiring part of your job?Seeing just how ingrained conservation is in kids’ daily actions at a young age. They recycle, for instance, because it is what they’ve always done and they will likely pass these practices off to their own children someday. That gives me hope.
Any favorite anecdotes to share?I ran into a child whose school I had recently visit-ed, and his mother greet-ed me with “Oh, you’re that Mary.” Apparently, a f t e r m y l e s s o n o n unplugging appliances to avoid “vampire loads”—electricity being used by appliances while they’re plugged in but not in use—the child was unplugging everything…whether it was in use or not.
Bringing Climate Cool to Schooleducating the nextgeneration of climate stars
94% 91% 68%
82% 80% 70%
Mary Priddy.
Climate Action Report Community Climate Action | 11

“ Austin just won’t be Austin if it doesn’t
have trees.”

next-gen design
Trees are the keys
THE NExT generation of urban designers will face new chal lenges as our climate changes. Students at the University of Texas School of Architecture
got a head start on designing a resilient city through a Fall 2011 design studio focused on applying design principles to the challenge of climate change, taught by professor Fernando Lara with the help of studio advisers Marc Coudert and Dylan Siegler of the
C ity of austin Heat Island program coordinator Leah Haynie is the Austin Climate Protection Program’s resident treehugger—not to mention
tree planter, educator, and advocate. Haynie works to ensure trees are incorporated in city building projects, and NeighborWoods, which provides free trees to resi-dents in areas with low tree cover. She’ll remind you that covering 40% of Austin with trees could lower peak summer temperatures by as much as two degrees—and keep our city a beautiful, livable oasis all year round.
Why is planting and caring for trees an important element of the City’s work?In a nutshell, they reduce localized temperatures and sequester carbon, reduce energy use and stormwater runoff and erosion, and provide habitat as an integral part of our urban ecosystem. Our urban forest has the potential to store more than 100,000 tons of CO2 per year, according to estimates by the Parks and Recreation Department. These are the tangible reasons why the City is working hard to grow the urban forest. But the softer reasons have to do with love of Austin and its connection with trees. We know that Austin just won’t be Austin if it doesn’t have trees.
How many trees does the City plant each year?More than 6,000 trees were planted through City of Austin programs in 2010—in parks, rights-of-way, and on private property throughout Austin. Austin’s com-mercial development requirements also result in exten-sive tree-planting by the private sector.
Students at the University of Texas School of Architecture draw up plans for our changing climate
austin is a heat island, and trees are part of the solution
What are the challenges involved with growing and maintaining our urban forest?Drought and an aging tree population are two big challenges. Proper mulching and watering are key to keeping our trees alive; in this drought, even estab-lished trees need watering. Continually planting new, hardy native trees to keep our city green in the decades ahead is just as important.
Leah Haynie. Photo: Sarah Fusco
Office of Sustainability. The class looked at Austin’s swing between droughts and f loods and its impact on how our city is designed and built. Guest lecturers included City staff from the Watershed Protection Department and Austin Water, and staff from Austin/Trav is Count y Health and Human Ser v ices and Adaptation International, a local nonprofit focused on climate adaptation. Final student design projects were exhibited at City Hall in an effort to educate the Austin community to inspire action on climate change and adaptation.
Climate Action Report Community Climate Action | 13
keep austin edible
charring a new course
SEVEN PERCENT of total U.S. greenhouse gas emissions come from agriculture—that’s due to its transportation to your plate as well as fertilizer use, livestock and electricity use. And once you include the energy and
emissions embedded in the modern factory food system, the greenhouse gas burden is closer to 30 percent. Many Austinites reduce that burden—and save money—by growing their own produce at home or in one of the city’s 18 community gardens, which cover more than 100 acres. In August 2011, the New Day Community Garden in East Austin was the first to earn the new City-Endorsed Community Garden designa-tion, which allows gardens to obtain water tap permits, exempts them from paying substantial fees associated with the installation of water infrastructure, and allows the City to recognize community gardens as legitimate entities. Other new City of Austin programs are in the works to further support community gardens helmed by community members, increasing Austin’s food secu-rity. There are also more than 10 farms in Austin and 114 in the five-county region. Their goods are available at large local farmers’ markets throughout the week, neighborhood markets and stands, and community supported agriculture programs all over Austin.
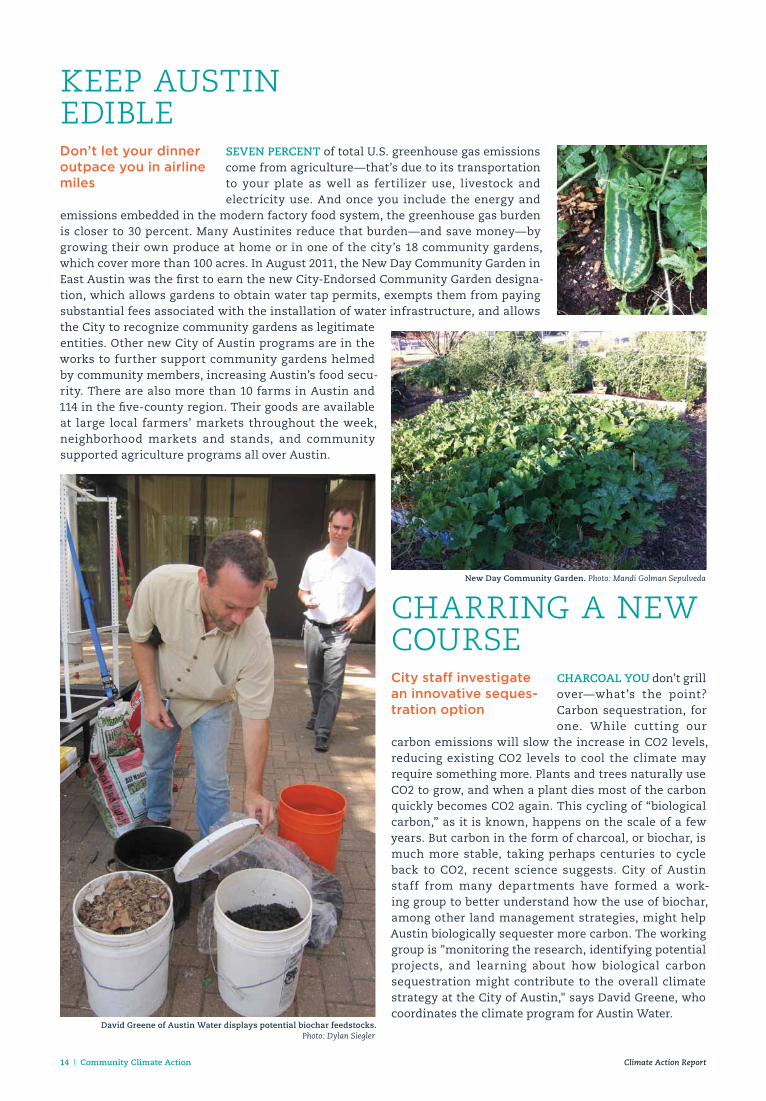
CHARCOAL yOU don’t grill over—what’s the point? Carbon sequestration, for one. While cutting our
carbon emissions will slow the increase in CO2 levels, reducing existing CO2 levels to cool the climate may require something more. Plants and trees naturally use CO2 to grow, and when a plant dies most of the carbon quickly becomes CO2 again. This cycling of “biological carbon,” as it is known, happens on the scale of a few years. But carbon in the form of charcoal, or biochar, is much more stable, taking perhaps centuries to cycle back to CO2, recent science suggests. City of Austin staff from many departments have formed a work-ing group to better understand how the use of biochar, among other land management strategies, might help Austin biologically sequester more carbon. The working group is "monitoring the research, identifying potential projects, and learning about how biological carbon sequestration might contribute to the overall climate strategy at the City of Austin," says David Greene, who coordinates the climate program for Austin Water.
Don’t let your dinner outpace you in airline miles
City staff investigate an innovative seques-tration option
New Day Community Garden. Photo: Mandi Golman Sepulveda
David Greene of Austin Water displays potential biochar feedstocks.Photo: Dylan Siegler
14 | Community Climate Action Climate Action Report

change is inthe air
EVERyONE WANTS clean air to breathe, and many of the same measures that
protect air quality also protect the climate. Air quality in Austin is better than in many of our peer cities, but it’s not perfect. Ozone is the main air pollutant that threatens public health in the Austin area, and it’s regu-lated through standards set by the U.S. EPA. The Austin area’s average ozone levels have been decreasing for more than a decade, primarily due to cleaner emissions from cars and trucks. And research suggests that much of our ozone burden is imported to the Austin area from upwind, meaning many sources of high ozone are beyond local control. But as the Austin-area population grows, more vehicles burden our airshed. City of Austin Air Quality programs are part of the solution. In 2010, Climate Protection Program staff coordinated the Walk, Bike & Roll Challenge, an alternative commute program that rewards City of Austin employees with prizes for when they walk, bike, carpool or take transit to work. It resulted in 25,094 single-occupancy vehicle trips avoid-ed. In 2011, Air Quality programs and staff became part of the City’s Transportation Department, to create an even tighter connection to mobility choices.
How does air quality affect you?Young children, the elderly, and people with health problems such as asthma, other respiratory conditions, and heart and lung disease can have serious trouble breathing on high-ozone days. Children and athletes breathe at a faster rate, taking in more pollution than adults at rest. Ozone can also irritate the eyes, nose and throat, and it is linked to illnesses from bronchi-tis to lung cancer.
Assessing Austin’sair quality
ozone trends in the austin area1999-2010
100
90
80
70 1999 2000 2001 2002 2003 2004 2005 2006 2007 2008 2009 2010
8-hr ozone (parts per billion)
Ozone in Austin’s five-county region has been trending downward since
1999, likely due to cleaner cars and trucks in Austin and upwind. Graphed
here is Austin’s “design value,” a statistic that reflects the region’s aver-
age ozone level. It is compared to the U.S. EPA’s health-based standard
to determine attainment status. Eight-hour ozone is the surface ozone
concentration in parts per billion (PPB) backward averaged over 8 hours.
747577
808282
858589 8889
84
Austin Area Ozone “Design Value” 2008 Ozone Standard 1997 Ozone Standard
Climate Action Report Community Climate Action | 15

measuring up
travis county greenhouse gas inventoryest. 14.9 Million MTCO2e
greenhouse gas emissions per capita
ON AVERAGE, each Travis
C o u n t y r e s i d e n t w a s
responsible for approxi-
mately 15 metr ic tons of
CO2 emissions from energy use (electricity, natural gas,
and transportation fuel) in 2010. Comparatively, the aver-
age U.S. resident is responsible for roughly 19 metric tons
of energy-related CO2 emissions per year, and the aver-
age Texas resident emits approximately 25 metric tons of
energy-related CO2 per year. Travis County residents’ per
capita carbon footprints are roughly 21 percent smaller
than that of their U.S. counterparts and 40 percent smaller
than the average Texan’s carbon footprint. Why are we
nearly half the Texas average? In part, it’s because Texas
oil and gas refineries and other heavy industries, operate
outside Central Texas.
Comparing our community’s carbon footprint
Average Texan
Average U.S. Resident
Average Travis County Resident
11% Waste
36% Transportation
<1% Wastewater Treatment
53% Energy
25
19
15
Metric Tons CO2e per Capita
16 | Community Climate Action Climate Action Report

Counting our CO2
W HAT GETS MEASURED can get managed, a nd t h at ’s why t he Au s t i n C l i m at e Protection Program calculates a commu-
nity-wide greenhouse gas (GHG) inventory. The inven-tory takes data from energy, water, transportation, materials and waste emissions sources from the Travis County area and converts them to a CO2 emission equivalent. This includes the City of Austin’s municipal operations plus residential, industrial, and commercial entities. Knowing baseline emissions levels allows us to develop emissions reduction strategies for residents, businesses and institutions, and track whether GHG emissions are increasing or dropping. Jenell Moffett of the Austin Climate Protection Program took a break from her spreadsheets to share how she makes the inventory happen.
How do you collect the data for the community greenhouse gas inventory?We use anonymous electricity use information for Austin homes and businesses provided to us by Austin Energy, as well as modeled data based on population and usage patterns, such as estimates of the number of vehicle miles traveled in Travis County. We are always working to improve the accuracy of the data.
What kind of tools do you use to do your job?Currently, most of our analysis is done in Microsoft Excel spreadsheets. I use a pink calculator, a notebook, and a mechanical pencil. I keep GHG emission protocols nearby and refer to various conversion and emission factors tables regularly.
What is the hardest part of completing a green-house gas inventory?It is a manual process. You have to add, subtract, multi-ply, divide, sort, and query thousands of records over and over again to get the data as accurate as possible. Boundaries, emission factors, data sources, contacts,
how the austin climate protection program takes stock of community emissions
and protocols are constantly changing. Managing these changes makes it a work in progress.
What‘s great about being our inventory guru?The most rewarding part is to see the inventory go to work: plans implemented, targets met, and emissions reduced with the inventory as the foundation. The graphs are fun too—they are my illustration to the story.
Is there anything about the process that would surprise us?Not much about the process is surprising, but the trends can be very satisfying. Whether it’s hybrid cars or renewable power, the evidence of their benefits is in the inventory. It shows that every emission has a source, and we as a community have the power to influ-ence our impacts—our greenhouse gas emissions are something that we control.
Every emission has a source, and we as a commu-nity have the power to influence our impacts.
Jenell Moffett. Photo: Sarah Fusco
grEEnhOuSE gaS MitigatiOn • \grēn-haus gas mi-tə-gā-shən\
Efforts to reduce the production or effects of greenhouse gases such as carbon dioxide and methane.
Climate Action Report Community Climate Action | 17

climate of actionMORE THAN 100 Austinites came together in 2010 to answer a seemingly straightforward question:
How can the Austin community reduce its greenhouse gas emissions? The group brainstormed more than 50 actions that residents and businesses can take to reduce their carbon emissions, some of which are already being carried out. Austin Climate Protection Program staff are building on the foundation of that initial set of solutions, ensuring that the Imagine Austin comprehensive plan aligns and developing initiatives designed to make greenhouse gas reductions easier to achieve. Meanwhile, with the help of dedicated stake-holders, the recommended actions have been distilled into a roadmap to continue to guide the reduction of the community’s greenhouse gas emissions in Central Texas.
Building on the community’s bright ideas for a cooler city
energy• Expand energy efficency programs
• Increase on-site renewable
energy systems
• Diversify energy sources
• Incorporate climate change into
energy projections
• Provide affordable energy
water• Expand water efficiency programs
• Increase on-site water harvesting
• Advance green infrastructure
• Diversify water sources
• Strengthen flood response
• Consider human health impacts
• Prepare for drought
waste• Advance green purchasing practices
• Divert waste from landfills
• Engage in green economic
development
• Insure adequate supply of materi-
als for emergencies
• Emphasize locally sourced materials
• Plan for debris management
• Manage landfills over the term
transportation• Increase access to public transit
• Encourage walking and biking
• Make available alternative fuels
for transportation
• Plan for emergency transportation
• Match transportation options to
residents
• Use new roadway material
land use• Promote infill and mixed-use
redevelopment near services to
reduce sprawl
• Preserve undeveloped land and
protect sensitive environmental
features
• Use compact development to
prepare for extreme events
• Decrease the urban heat island
food• Develop Austin food-growing
capacity and local food availability
• Ensure local capacity to meet
food needs
• Identify best crops and farming
methods in light of predicted
climate-related stresses
• Develop transportation routes,
lines of communication, and
better coordination with other
government entities to ensure
food security
cOMMunitY grEEnhOuSE gaS rEductiOn rOadMap
Tree planting is one way to offset carbon emissions.
a local way to offset your carbon is comingIF A TREE is planted in the forest but no one’s there to see it, does it make a difference? Paying for tree-plant-ing in the rainforest is one way to offset your carbon emissions —a purchase that reduces global CO2 emis-sions, to compensate for those we can’t yet eliminate ourselves. But it’s perhaps more motivating to offset your carbon footprint in a way that also improves Austin tangibly. That’s what the Austin Climate Protection Program aimed for when developing a new way to offset your carbon emissions through worthy local projects you can see for yourself. Soon, individuals will be able to support local tree-planting (through the nonprofit TreeFolks), cooling and cleaning our air while beautifying the city. Alternatively, individuals or orga-nizations can support solar panels on the roof of the Yellow Bike Project (YBP) in East Austin, an all-volunteer
Community participants in a March 2010 Climate Protection work session.
initiative to put bicycles on our streets through bike advocacy and education about bike maintenance. Further offsets will be generated by solar panels atop M Station, a new 150-unit green affordable multifamily community near the MLK MetroRail stop. Austin Energy is funding the projects and verifying the impacts, and you’ll be able to register your support in 2012.
18 | Community Climate Action Climate Action Report

Are you an Austin GreenBusiness Leader?
business climate
T HE NUMBER OF businesses in the Austin area has grown despite the limping economy—the number of businesses with 99 or fewer employees grew by
1.5 percent in Austin between 2007 and 2008 (the latest period covered by official statistics), while no other market did better than 0.6 percent. Austin’s growth is expected to continue, and our promising economic outlook presents an opportunity for the City of Austin to help new and existing businesses become more sustainable. The Office of Sustainability has convened a core group of City staff from across multiple depart-ments to guide Austin Green Business Leaders, an initiative that will provide local businesses with tools, resources, and assistance through the City’s existing sustainability programs. The program will also recog-nize companies that demonstrate commitment to eco-friendly practices. Marc Coudert of the Austin Climate Protection Program coordinates the group.
How can a local business participate in the Austin Green Business Leaders program?Starting in 2012, Austin businesses will have the oppor-tunity to commit to actions focused on reducing waste, water, vehicle miles traveled and energy use. They will then document their progress going green, and will be recognized for their success. When we say “green,” we mean both in terms of environmental impact and saving money.
Why is this important for Austin right now?The Austin business community is very active in sustainability and we want to make sure those stories
CLIM AT E CA PITA LISTS believe that the best route to building our economy, grow-
ing our city and expanding job markets is to solve prob-lems that contribute to climate change while turning a profit. In Austin as in the rest of the country, business leaders are entering the growing markets for renewable energy technologies, sustainable agriculture, green building, and alternative transportation. Others, from start-up entrepreneurs to huge corporations to govern-ment offices, are optimizing their use of energy and resources. It makes operational sense, cuts costs, and can boost overall profitability. Research by Goldman Sachs has revealed that the leading companies in envi-
new city program recognizes local companies that go green
Green jobs are a reality in Austin
are heard. The Austin Green Business Leaders will provide public recognition for the great work that local businesses are doing and provide a forum for other businesses to learn from them.
What’s the best part of your job coordinating this program?We are responsible for connecting the dots, making sure the energetic and creative individuals who are working toward the same ends share resources, lessons learned and accomplishments. Austin Green Business Leaders brings together vibrant local businesses with City and Capital Metro experts in areas such as zero waste, energy savings, and alternative commuting. There is such an energetic and creative undercurrent in Austin, and this program taps into it.
ronment, social and good governance policy have 25 percent higher stock value than their less sustainable competitors. Since 2008, these sustainability leaders also have had the fastest-growing stock value.
Austin is one of the nation’s most progressive and proactive entrepreneurial centers, according to Entrepreneur.com. In late 2010, the City's Economic Growth and Redevelopment Services Office negoti-ated an economic development incentive proposal with SunPower Corp., a leader in commercial and residential solar installations. The company is expected to create approximately 450 jobs here over a 10-year period. The Texas Workforce Commission estimated in 2009 that green industries in Austin—including clean energy tech—employed 45,672 people; in 2010, the Greater Austin Chamber of Commerce tallied 175 clean energy technology companies in the city.
Marc Coudert. Photo: Sarah Fusco
Climate Action Report Community Climate Action | 19

sustainability by the numbersDepartment of Energy funds received by Austin
Energy under the American Recovery and
Reinvestment Act (ARRA). The federal funds
have paid for major mechanical renovations and
controls audits and upgrades for City facilities from fire stations to the Mexican American Cultural
Center; lighting improvements indoors and out (including the parking garage at City Hall); commis-
sioning—confirming that building systems function correctly—at the City’s 14 largest buildings;
and other energy efficiency retrofits. The stimulus dollars also bought a biogas generator for the
Hornsby Bend Biosolids Management Plant, which processes the sewage solids from all of Austin's
wastewater plants. The generator (part of a larger upgrade of the plant being funded through a
separate multimillion-dollar ARRA zero interest loan) will use methane from the sludge treatment
process to generate renewable power—more than is needed to run the plant.
$7,496,700
20 | Community Climate Action Climate Action Report
5The number of materials Austin multifamily and commercial properties will be required to recycle beginning in October 2012 under the Universal Recycling Ordinance, including office paper, plastic #1 and #2, glass, corrugated cardboard, and aluminum. Compliance with the ordinance will be phased in by type and size of property.
9,400Acres of land occupied by farms in Austin’s five county region.
469Number of wildland fires in the Austin Fire Department service territory in the first seven months of 2011.
7,566Total gallons of 100 percent post-consumer, reblended low-VOC flat paint made from paint collected at the City of Austin’s Household Hazardous Waste facility since July 2010. The paint, known as Austin Reblend, is free to residential or civic projects and comes in two neutral colors. Every gallon made diverts the same amount from the landfill.
13,611The number of tons of CO2 equivalent reduced through alternative fuel vehicle use and other means by Central Texas Clean Cities participating fleets reporting in 2010. Central Texas Clean Cities is a volunteer coalition of public and private fleets that work to reduce petroleum consumption.
90The number of Austin days with temperatures of at least 100 degrees in 2011. That’s the most 100 degree days in Austin in a year since 1895.
6,000Number of trees planted through City of Austin programs in 2010.
163Gallons of water used per capita per day in Austin, expressed as a five-year rolling average. In 2010 Austin City Council approved a policy to reduce Austin’s per capita water use to below 140 gallons per capita per day by 2020.
6Number of greenhouse gases, including carbon dioxide (CO2), that are known to drive climate change.
912City of Austin employees who attended Austin Climate Protection Program-led trainings in 2011. Represented depart-ments included Health and Human Services, the Convention Center, Public Works, the Library, Austin Energy, Communications and Technology Management, and the Parks and Recreation Department.

finding green gemsin the rough
GREEN GEMS MAP2011
Discover Sustainable Downtown Austin
Tour Green Buildings, Local-Food Eateries, Cultural Sites, Biking & Walking Features, Rail Transit, Farmers Market, Recycling Centers, Urban Nature & More
Office of Sustainability
WILLIE NELSON BLVD.
W. NINTH ST.
W. SEVENTH ST.
W. TENTH ST.
RIO
GR
AN
DE
ST.
WE
ST
AV
E.
BO
WIE
ST.
NU
EC
ES
ST.
SA
N A
NTO
NIO
ST.
GU
AD
ALU
PE
ST.
GU
AD
ALU
PE
ST.
LAV
AC
A S
T.
LAV
AC
A S
T.
LAV
AC
A S
T.
CO
NG
RE
SS
AV
E.
N. L
AM
AR
BLV
D.
BLA
NC
O S
T.
PR
ESS
LER
ST.
BA
YLO
R S
T.
N. L
AM
AR
BLV
D.
S. C
ON
GR
ES
S A
VE
.
SA
N J
AN
CIN
TO B
LVD
.
TR
INIT
Y S
T.
TR
INIT
Y S
T.
RE
D R
IVE
R S
T.
RE
D R
IVE
R S
T.
BR
AZ
OS
ST.
NE
CH
ES
ST.
CO
LOR
AD
O S
T.
W. 11 TH ST.
W. SEVENTH ST.
E. SEVENTH ST.
E. SIXTH ST.
E. FIFTH ST.
E. FOURTH ST.
W. SIXTH ST.
W. FIFTH ST.
W. FIFTH ST.
W. SIXTH ST.
W. FOURTH ST.
E. FIFTH ST.
WILLOW ST.SPENCE ST.
GARDEN ST.
LAMBIE ST.
HOLLY ST.
SAN
MA
RC
OS
ST.
WA
LLE
R S
T.
WA
LL
ER
ST.
LYD
IA S
T.
W. FOURTH ST.
W. THIRD ST.
W. THIRD ST.
W. SECOND ST.
W. SECOND ST.
LADY BIRD LAKE
LA
DY
BIR
D L
AK
E
BARTON SPRINGS RD.
W. CESAR CHAVEZ ST.
E. FIRST ST.
S. F
IRST
ST.
S. F
IRST
ST.
E. FIRST ST.
E. THIRD ST.
E. SIXTH ST.
E. SEVENTH ST.
E. EIGHTH ST.
SA
N M
AR
CO
S S
T.
E. TENTH ST.
E. NINTH ST.
E. 11 TH ST.
JUNIPER ST.
OLIVE ST.
E. 11 TH ST.
E. TENTH ST.
E. NINTH ST.
E. EIGHTH ST.
W. EIGHTH ST.
W. 12 TH ST.
E. 12 TH ST.
STATE CAPITOL
290
35
290
35
RA
INY
ST.
EA
ST
AV
E.
DRISKILL ST.
RIVER ST.
SH
OA
L CR
EE
K
W. RIVERSIDE DR.
Green Building1 AUSTIN CITY HALL 301 Willie Nelson Blvd. (W. 2nd St.)
2 W HOTEL & CONDOS/ AUSTIN CITY LIMITS LIVE 200 Lavaca St.
3 AUSTIN CONVENTION CENTEr 200 Congress Ave.
4 THE AUSTONIAN 500 E. Cesar Chavez St.
5 CArr AMErICA 300 W. Sixth St.
6 WHOLE FOODS MArKET 525 N. Lamar Blvd.
7 THE ALLEY FLAT INITIATIVE PILOT PrOjECT 904 Lydia St.
8 CHIPOTLE MEXICAN GrILL Eighth & Congress
Green/Sustainable Infrastructure 9 PAUL rObbINS DOWNTOWN DISTrICT COOLING PLANT 300 San Antonio St.
!0 MEXICAN AMErICAN CULTUrAL CENTEr 600 River St.
Mobility
!1 SOLAr PUMP CHArGING STATION S. First St. at Live Oak
!2 bIKE COrrAL 711 Red River St.
!3 METrOrAIL DOWNTOWN STATION 401 E. Fourth St.
!4 MELLOW jOHNNY’S bIKE SHOP 400 Nueces St.
!5 LANCE ArMSTrONG bIKEWAY
!6 PFLUGEr PEDESTrIAN/ bICYCLE brIDGE OVEr LADY bIrD LAKE
!7 ELECTrIC VEHICLE CHArGING STATIONS
Recycling!8 ECOLOGY ACTION 707 E. Ninth Street
!9 bIGbELLY SOLAr COMPACTOrS
Ecology and Wildlife@0 UrbAN bAT COLONY Ann Richards Congress Ave. Bridge
@1 TrASH bOOMS ON LADY bIrD LAKE
@2 bIOFILTrATION POND Cesar Chavez at Lamar Blvd.
@3 GrOW GrEEN DEMONSTrATION GArDENS One Texas Center, 505 Barton Springs Rd. Local FoodRestaurants that source local foods when possible.
@4 AUSTIN FArMErS MArKET DOWNTOWN 422 Guadalupe St.
@5 LEAF SALAD 419 W. Second St.
@6 24 DINEr 600 N. Lamar Blvd.
@7 CHEz NOUS 510 Neches St.
@8 COUNTEr CAFé 626 N. Lamar Blvd.
@9 LA CONDESA 400 W. Second St.
#0 MANUEL’S 310 Congress Ave.
#1 PArKSIDE 310 Congress Ave.
#2 SECOND bAr + KITCHEN 200 Congress Ave.
#3 TNT (TACO AND TEqUILA) 507 Pressler St.
#4 TrACE (AT THE W HOTEL) 200 Lavaca St.
#5 WALTON’S FANCY & STAPLE 609 W. Sixth St.
#6 WINK 1014 N. Lamar Blvd.
#7 EAST SIDE SHOWrOOM 1100 E. Sixth St.
#8 bLUE DAHLIA 1115 E. 11th St.
500 ft.200 m.
Points of Interest GREEN GEMSSee detailed descriptions on back
Please give us your feedback about this map: [email protected]
W H AT M A K E S d o w n -t ow n Au st i n “g r e en”? Grab a 2011 Green Gems Map, hop on your bike or
lace up your walking shoes and find out. This handy street plan and narrative guide includes local-product-focused restaurants, sustainably designed buildings, green infrastructure features, resource recovery spaces, and human-powered, urban nature-oriented ways to get there. Download your complete copy at: www.austintexas.gov/sustainability.
New map locates downtown Austin’s most sustainable sites
Climate Action Report Community Climate Action | 21
Photo: Michael Knox, ASLA

A Message from theCity Manager
W HEN THE Mayor and City Council enacted the ambitious Austin Climate Protection Plan in early 2007, they set one of the
highest bars in the world for municipal greenhouse gas reductions by 2020. The City was boldly entering uncharted territory in a fast-changing and uncertain regulatory and energy environment with no real blue-print to follow.
Four years later, I’m proud of how we have tackled that learning curve. Our interdepartmental Climate Action Team has developed detailed plans to lower the carbon footprints of each and every City department. Greenhouse gas emissions from municipal operations have been reduced significantly. For this work, the City received top national recognition in 2010 from ICLEI Local Governments for Sustainability USA.
Even if climate change were not an issue, it just makes good management sense to consume less energy, water and other resources. It’s part of being the Best-Managed City.
I’m pleased that our Office of Sustainability, launched in September 2010, is providing strong, centralized leadership, oversight and coordination of the City’s environmental, climate and sustainability policies, practices and programs. We’re also integrating our comprehensive plan, departmental and mobil-ity long-range plans, and capital improvement project program around a focus on smart investments, livabili-ty and sustainability. Those initiatives can help to lower the whole community’s carbon footprint.
To meet the requirements of the original City Council Climate Protection resolution, since October 1, 2011 the
City is purchasing enough renewable GreenChoice® power to 100 percent power all municipal departments and operations, making us truly a national climate action leader.
As the Central Texas climate gradually becomes warmer, with more drought and other extreme weather events, prudent risk mitigation requires that we take steps to prepare now.
Let’s make sure that your children and mine—and their children too—are able to enjoy the enviable qual-ity of life we enjoy in Austin today.
Marc a. OttCity Manager | City of Austin
20 | A Message from the City Manager Climate Action Report


more [email protected]/SustainabilityFacebook.com/AustinSustainability
City of Austinoffice of sustainability2010-2011