city of brenham, texas
TRANSCRIPT
CITY OF BRENHAM, TEXAS COMPREHENSIVE ANNUAL FINANCIAL REPORT
FOR THE YEAR ENDED SEPTEMBER 30, 2011
PREPARED BY THE FINANCE DIVISION

CITY OF BRENHAM, TEXAS COMPREHENSIVE ANNUAL FINANCIAL REPORT
TABLE OF CONTENTS
For The Fiscal Year Ended September 30, 2011
INTRODUCTORY SECTION
Letter of Transmittal ................................................................................................................................................... 1 Certificate of Achievement for Excellence in Financial Reporting .............................................................................. 5 Organizational Chart ................................................................................................................................................... 6 List of Principal Officials .............................................................................................................................................. 7
FINANCIAL SECTION
Independent Auditor's Report ..................................................................................................................................... 9 Management’s Discussion and Analysis .................................................................................................................. 11 Basic Financial Statements Government-wide Financial Statements:
Statement of Net Assets ................................................................................................................................... 23 Statement of Activities ...................................................................................................................................... 25
Fund Financial Statements: Balance Sheet – Governmental Funds ............................................................................................................ 26
Statement of Revenues, Expenditures, and Changes in Fund Balances – Governmental Funds ................... 28 Statement of Net Assets – Proprietary Funds .................................................................................................. 31 Statement of Revenues, Expenditures, and Changes in Fund Net Assets – Proprietary Funds ..................... 33
Statement of Cash Flows – Proprietary Funds ................................................................................................. 34 Notes to the Financial Statements ........................................................................................................................ 37
REQUIRED SUPPLEMENTARY INFORMATION
Schedule of Funding Progress – Other Postemployment Benefit Plan (OPEB) ....................................................... 67 Schedule of Funding Progress – Texas Municipal Retirement System (TMRS) ...................................................... 69 Schedule of Revenues, Expenditures, and Changes in Fund Balances Budget and Actual–General Fund...................................................................................................................... 70 Notes to the Required Supplementary Information ................................................................................................... 71
COMBINING FUND STATEMENTS AND SCHEDULES
Nonmajor Governmental Funds
Special Revenue Funds ..................................................................................................................................... 73 Capital Projects Funds ....................................................................................................................................... 73 Internal Service Funds ....................................................................................................................................... 75 Debt Service Fund .............................................................................................................................................. 75 Combining Balance Sheet – Other Governmental Funds .................................................................................. 76 Combining Statement of Revenues, Expenditures, and Changes in Fund Balances Other Governmental Funds ........................................................................................................................... 77 Combining Balance Sheet – Special Revenue Funds ........................................................................................ 78 Statement of Revenues, Expenditures, and Changes in Fund Balances – Special Revenue Funds ................................................................................................................................. 79 Combining Balance Sheet – Nonmajor Capital Projects Funds ......................................................................... 80 Statement of Revenues, Expenditures, and Changes in Fund Balances – Nonmajor Capital Projects Funds ............................................................................................................................................... 81
Internal Service Funds Combining Statement of Net Assets .................................................................................................................. 82 Statement of Revenues, Expenditures, and Changes in Fund Net Assets ........................................................ 83 Combining Statement of Cash Flows – Internal Service Funds ......................................................................... 84

CITY OF BRENHAM, TEXAS COMPREHENSIVE ANNUAL FINANCIAL REPORT
TABLE OF CONTENTS
For The Fiscal Year Ended September 30, 2011 Schedules of Revenues, Expenditures, and Changes in Fund Balances – Budget and Actual:
Debt Service Fund .............................................................................................................................................. 85 Hotel/Motel Tax Fund ......................................................................................................................................... 86 Hotel/Motel Fund - Washington County ............................................................................................................. 87 PD Criminal Law Enforcement Fund .................................................................................................................. 88 Courts Technology/Security Fund ...................................................................................................................... 89 Parks Capital Improvements Fund ..................................................................................................................... 90 US 290 Pass Thru Finance Fund ....................................................................................................................... 91 Brenham Community Development Corporation Fund ...................................................................................... 92
REPORTS FOR MANAGEMENT SECTION
Government-wide Expenses by Function ................................................................................................................. 94 Government-wide Revenues ................................................................................................................................... 95 General Governmental Expenditures by Function .................................................................................................... 96 Reconciliation of Property Tax Receivable ............................................................................................................... 97 Revenues by Source – Governmental Funds ........................................................................................................... 98 Ratio of Annual Debt Service Expenditures for General Obligation Bonded Debt to General Governmental Expenditures .................................................................................................................... 99 Property Value and Construction ............................................................................................................................ 100 Revenue by Source – Business Type Activities ...................................................................................................... 101 Electric Customers, Consumption and Sales ......................................................................................................... 102 Gas Customers, Consumption and Sales .............................................................................................................. 103 Electric Rates .......................................................................................................................................................... 104 Gas Rates ............................................................................................................................................................... 105 Ten Largest Electric Customers ............................................................................................................................. 106 Ten Largest Gas Customers ................................................................................................................................. 107 The Water System - Utility Billing Statistics ............................................................................................................ 108 The Wastewater System - Utility Billing Statistics ................................................................................................... 109 The Sanitation System - Utility Billing Statistics ...................................................................................................... 110 Schedule of Expenditures of Federal and State Awards ........................................................................................ 111 Notes to Schedule of Expenditures of Federal and State Awards .......................................................................... 113
STATISTICAL SECTION
Financial Trends Net Assets by Component ................................................................................................................................... 116 Changes in Net Assets by Component ................................................................................................................ 117 Fund Balances – Governmental Funds ............................................................................................................... 119 Changes in Fund Balances – Governmental Funds ............................................................................................ 120 Revenue Capacity Tax Revenues by Source – Governmental Funds............................................................................................... 121 Assessed and Estimated Actual Value of Taxable Property ............................................................................... 122 Sales Subject to Sales Tax by Industry ............................................................................................................... 123 Direct and Overlapping Property and Sales Tax Rates ....................................................................................... 124 Ten Largest Property Taxpayers ......................................................................................................................... 125 Property Tax Levies and Collections .................................................................................................................. 126 Principal Sales Taxpayers by Industry ................................................................................................................ 127

CITY OF BRENHAM, TEXAS COMPREHENSIVE ANNUAL FINANCIAL REPORT
TABLE OF CONTENTS
For The Fiscal Year Ended September 30, 2011 Debt Capacity Ratio of Outstanding Debt by Type ...................................................................................................................... 128 Ratio of Net General Obligation Bonded Debt .................................................................................................... 129 Direct and Overlapping Debt .............................................................................................................................. 130 Legal Debt Margin Information ............................................................................................................................ 131 Pledged-Revenue Coverage ............................................................................................................................... 132 Demographics/Economics
Demographic and Economic Information ............................................................................................................ 133 Principal Employers ............................................................................................................................................. 134
Operating
Full-time Equivalent Employees .......................................................................................................................... 135 Operations Indicators by Function/Program ........................................................................................................ 136 Capital Assets by Function/Program ................................................................................................................... 137
AUDIT SECTION
Report on Internal Control over Financial Reporting and on Compliance Based on an Audit of Financial Statements Performed in Accordance with Government Auditing Standards ..................................... 139


(As of September 30, 2011)
Chief Financial OfficerCarolyn D. Miller, CPA
Accounting & ReportingStacy Hardy, CPA
Budget & RatesDebbie Gaffey, CPA
City SecretaryJeana Bellinger
Municipal CourtRhonda Kuehn
Purchasing & Central Warehouse Adam Griffin
Communications/9-1-1 Pam Ruemke
Human Resources/Risk Mgmt.Janie Mehrens
Information TechnologyGary Jeter
MaintenanceDanny Romo
Rex PhelpsRicky Boeker
Alton Sommerfield
City AttorneyCary Bovey
Terry K. Roberts
Kyle DannhausAssistant City Manager
Assistant ChiefJay Petrash
Police ChiefFire Chief/Emergency Mgmt.
Building Inspection
Mapping/GIS
Allen Jacobs
Becky Squyres
Main Street
Wesley Brinkmeyer
Captain A Shift
Library
Public Utilities DirectorLowell Ogle
Gas
Assistant DirectorDane Rau
Electric
Commissioners
Municipal Court JudgeJay Weisler
Ande Bostain
Water Treatment/Const.Dane BybeeAmanda Carker
Animal ControlLeslie Kelm
Doug Baker
CITY OF BRENHAM - ORGANIZATIONAL CHART
Bobby Keene, Jr.Wastewater Treatment/Const.
Parks Maintenance
Streets
City BoardsCommittees
Alan Finke
Associate JudgeRobert Wright
Public Works Director Community Services Director
City Manager
Charles SuessmuthAirport
Kim Hodde
Jennifer Eckermann
Lin Hartstack
MayorMilton Y. Tate, Jr.
& City Council
Fire Marshal & Deputy Chief
Utility Customer Service
Captain C Shift
Lt. - PatrolTodd Jacobs
Lt. - CIDBilly Rich
Code EnforcementDavid Doelitsch
Allen HinzeRecreation/Aquatics
Jamie Maurer
Heath Mahlmann
Captain B ShiftDoug Maurer
SanitationBobby Branham
Wanda Kramer
6
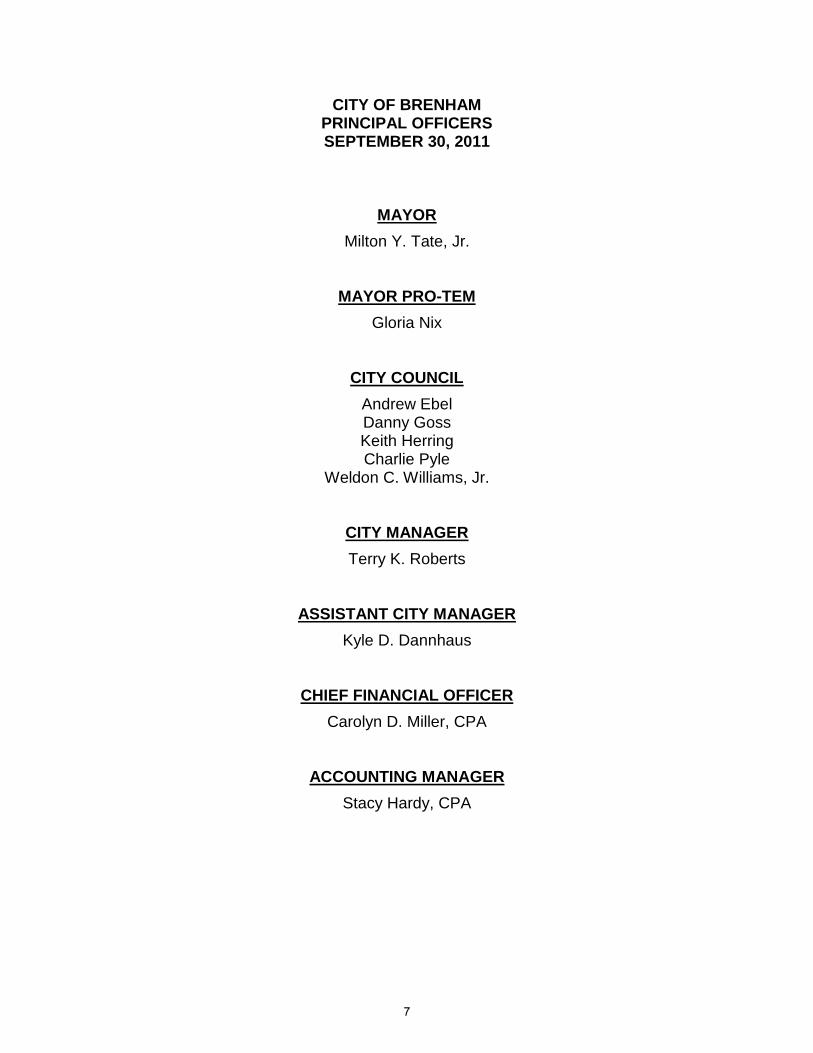
CITY OF BRENHAM PRINCIPAL OFFICERS SEPTEMBER 30, 2011
MAYOR Milton Y. Tate, Jr.
MAYOR PRO-TEM Gloria Nix
CITY COUNCIL Andrew Ebel Danny Goss Keith Herring Charlie Pyle
Weldon C. Williams, Jr.
CITY MANAGER Terry K. Roberts
ASSISTANT CITY MANAGER Kyle D. Dannhaus
CHIEF FINANCIAL OFFICER Carolyn D. Miller, CPA
ACCOUNTING MANAGER Stacy Hardy, CPA
7

This page intentionally left blank.
8


CITY OF BRENHAM, TEXAS Management’s Discussion and Analysis
September 30, 2011 _________________________________________________________________________________________
The Management Discussion and Analysis (MD&A) provides a narrative overview and analysis of the financial activities of the City of Brenham for the fiscal year ended September 30, 2011. We encourage readers to consider the information presented here in conjunction with additional information that we have furnished in our letter of transmittal, which can be found on pages 1-4 of this report. All amounts, unless otherwise indicated, are expressed in thousands of dollars. FINANCIAL HIGHLIGHTS The following financial highlights summarize the City’s financial position and operations as presented in more detail in the Basic Financial Statements (BFS). The assets of the City of Brenham exceeded its liabilities at the close of the most recent fiscal year by
$86,499 (net assets). Of this amount, $19,051 (unrestricted net assets) may be used to meet the government's ongoing obligations to citizens and creditors.
The government's total net assets increased by $3,472. As of the close of the current fiscal year, the City of Brenham’s governmental funds reported combined
ending fund balances of $9,944 an increase of $4,790 in comparison with the prior year. Approximately $3,529 is available for spending at the government's discretion (unassigned fund balance).
At the end of the current fiscal year, unreserved fund balance for the general fund was $3,837 or 24.5% of total general fund expenditures.
The City of Brenham’s total bonded debt increased by $13,260 or 33% during the current fiscal year.
OVERVIEW OF THE FINANCIAL STATEMENTS Basic Financial Statements. The MD&A is intended to serve as an introduction to the City’s BFS. The BFS are comprised of three components: 1) Government-Wide Financial Statements (GWFS), 2) Fund Financial Statements (FFS), and 3) Notes to the Basis Financial Statements (Notes). The CAFR also contains other supplementary information in addition to the BFS. Government-Wide Financial Statements. The GWFS, shown on pages 23-25, contain the Statement of Net Assets and the Statement of Activities, which are described below, and are designed to provide readers with a broad overview of the City of Brenham’s finances, in a manner similar to a private-sector business. The Statement of Net Assets presents information on all of the City of Brenham’s assets and liabilities, with the difference between the two reported as net assets. Over time, increases or decreases in net assets may serve as a useful indicator of whether the financial position of the City of Brenham is improving or deteriorating. The Statement of Activities presents information showing how the government's net assets changed during the most recent fiscal year. All changes in net assets are reported as soon as the underlying event giving rise to the change occurs, regardless of the timing of related cash flows. Thus, revenues and expenses are reported in this statement for some items that will only result in cash flows in future fiscal periods (e.g., uncollected taxes and earned but unused vacation leave). Both of the GWFS distinguish functions of the City of Brenham that are principally supported by taxes and intergovernmental revenues (governmental activities) from other functions that are intended to recover all or a significant portion of their costs through user fees and charges (business-type activities). The governmental activities of the City of Brenham include general government, public safety, highways and streets, debt service, health and welfare, and culture and recreation. The business-type activities of the City of Brenham include water, wastewater, sanitation, gas and electric distribution operations. Component Unit. The GWFS include not only the City of Brenham itself (known as the primary government), but also a legally separate community development corporation (Brenham Community Development Corporation - BCDC) for which the City of Brenham is financially accountable. Financial information for this Component Unit is reported separately from the financial information presented for the primary government itself.
11
CITY OF BRENHAM, TEXAS Management’s Discussion and Analysis
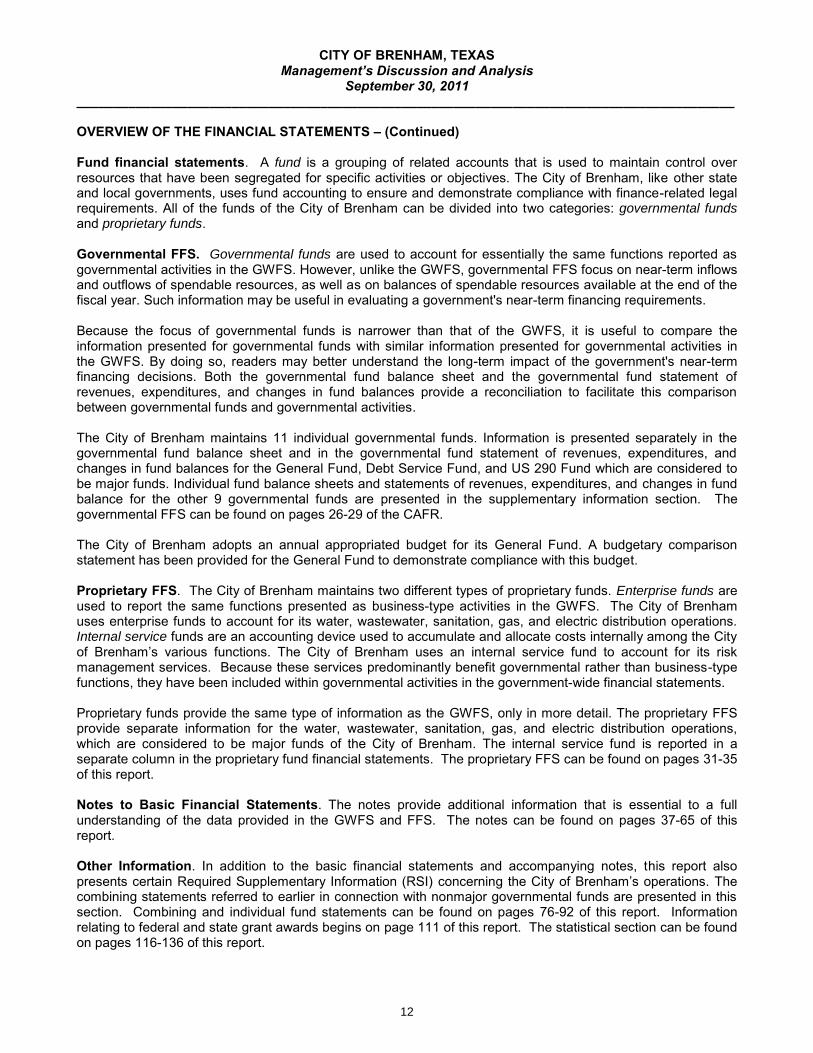
September 30, 2011 _________________________________________________________________________________________ OVERVIEW OF THE FINANCIAL STATEMENTS – (Continued) Fund financial statements. A fund is a grouping of related accounts that is used to maintain control over resources that have been segregated for specific activities or objectives. The City of Brenham, like other state and local governments, uses fund accounting to ensure and demonstrate compliance with finance-related legal requirements. All of the funds of the City of Brenham can be divided into two categories: governmental funds and proprietary funds. Governmental FFS. Governmental funds are used to account for essentially the same functions reported as governmental activities in the GWFS. However, unlike the GWFS, governmental FFS focus on near-term inflows and outflows of spendable resources, as well as on balances of spendable resources available at the end of the fiscal year. Such information may be useful in evaluating a government's near-term financing requirements. Because the focus of governmental funds is narrower than that of the GWFS, it is useful to compare the information presented for governmental funds with similar information presented for governmental activities in the GWFS. By doing so, readers may better understand the long-term impact of the government's near-term financing decisions. Both the governmental fund balance sheet and the governmental fund statement of revenues, expenditures, and changes in fund balances provide a reconciliation to facilitate this comparison between governmental funds and governmental activities. The City of Brenham maintains 11 individual governmental funds. Information is presented separately in the governmental fund balance sheet and in the governmental fund statement of revenues, expenditures, and changes in fund balances for the General Fund, Debt Service Fund, and US 290 Fund which are considered to be major funds. Individual fund balance sheets and statements of revenues, expenditures, and changes in fund balance for the other 9 governmental funds are presented in the supplementary information section. The governmental FFS can be found on pages 26-29 of the CAFR. The City of Brenham adopts an annual appropriated budget for its General Fund. A budgetary comparison statement has been provided for the General Fund to demonstrate compliance with this budget. Proprietary FFS. The City of Brenham maintains two different types of proprietary funds. Enterprise funds are used to report the same functions presented as business-type activities in the GWFS. The City of Brenham uses enterprise funds to account for its water, wastewater, sanitation, gas, and electric distribution operations. Internal service funds are an accounting device used to accumulate and allocate costs internally among the City of Brenham’s various functions. The City of Brenham uses an internal service fund to account for its risk management services. Because these services predominantly benefit governmental rather than business-type functions, they have been included within governmental activities in the government-wide financial statements. Proprietary funds provide the same type of information as the GWFS, only in more detail. The proprietary FFS provide separate information for the water, wastewater, sanitation, gas, and electric distribution operations, which are considered to be major funds of the City of Brenham. The internal service fund is reported in a separate column in the proprietary fund financial statements. The proprietary FFS can be found on pages 31-35 of this report. Notes to Basic Financial Statements. The notes provide additional information that is essential to a full understanding of the data provided in the GWFS and FFS. The notes can be found on pages 37-65 of this report. Other Information. In addition to the basic financial statements and accompanying notes, this report also presents certain Required Supplementary Information (RSI) concerning the City of Brenham’s operations. The combining statements referred to earlier in connection with nonmajor governmental funds are presented in this section. Combining and individual fund statements can be found on pages 76-92 of this report. Information relating to federal and state grant awards begins on page 111 of this report. The statistical section can be found on pages 116-136 of this report.
12
CITY OF BRENHAM, TEXAS Management’s Discussion and Analysis
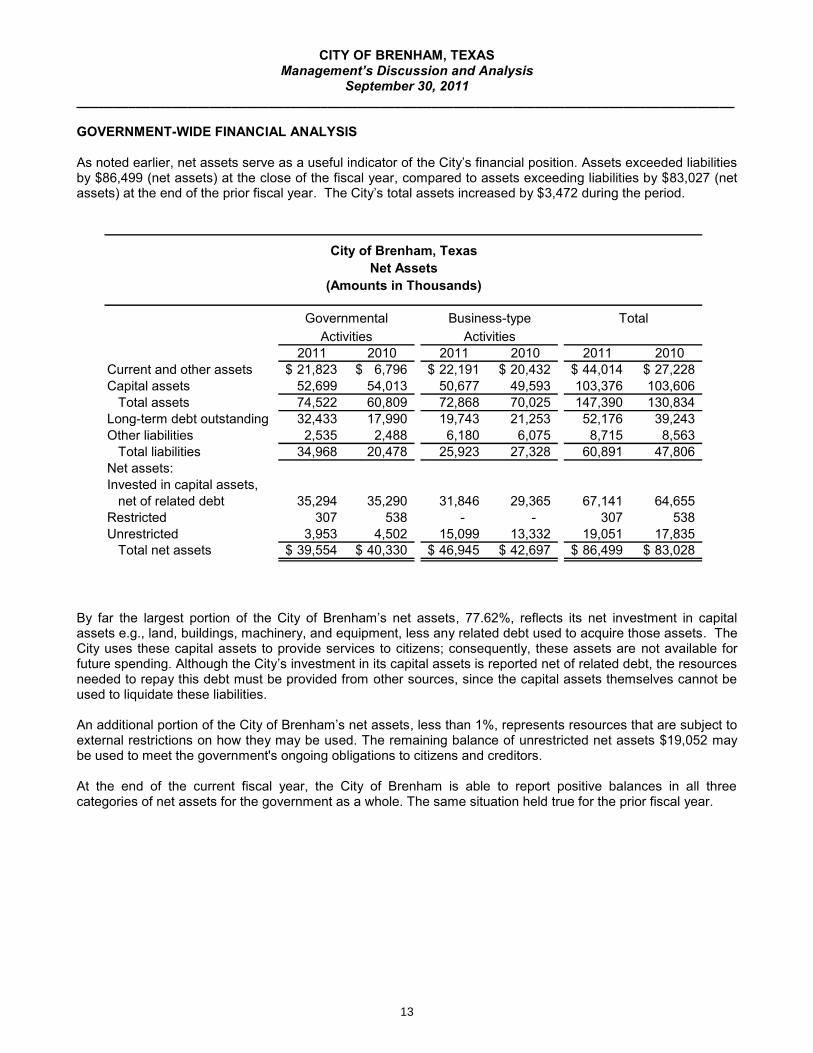
September 30, 2011 _________________________________________________________________________________________ GOVERNMENT-WIDE FINANCIAL ANALYSIS As noted earlier, net assets serve as a useful indicator of the City’s financial position. Assets exceeded liabilities by $86,499 (net assets) at the close of the fiscal year, compared to assets exceeding liabilities by $83,027 (net assets) at the end of the prior fiscal year. The City’s total assets increased by $3,472 during the period.
2011 2010 2011 2010 2011 2010Current and other assets 21,823$ 6,796$ 22,191$ 20,432$ 44,014$ 27,228$ Capital assets 52,699 54,013 50,677 49,593 103,376 103,606
Total assets 74,522 60,809 72,868 70,025 147,390 130,834 Long-term debt outstanding 32,433 17,990 19,743 21,253 52,176 39,243 Other liabilities 2,535 2,488 6,180 6,075 8,715 8,563
Total liabilities 34,968 20,478 25,923 27,328 60,891 47,806 Net assets: Invested in capital assets,
net of related debt 35,294 35,290 31,846 29,365 67,141 64,655 Restricted 307 538 - - 307 538 Unrestricted 3,953 4,502 15,099 13,332 19,051 17,835
Total net assets 39,554$ 40,330$ 46,945$ 42,697$ 86,499$ 83,028$
City of Brenham, Texas
Governmental TotalActivities Activities
Business-type
(Amounts in Thousands)Net Assets
By far the largest portion of the City of Brenham’s net assets, 77.62%, reflects its net investment in capital assets e.g., land, buildings, machinery, and equipment, less any related debt used to acquire those assets. The City uses these capital assets to provide services to citizens; consequently, these assets are not available for future spending. Although the City’s investment in its capital assets is reported net of related debt, the resources needed to repay this debt must be provided from other sources, since the capital assets themselves cannot be used to liquidate these liabilities. An additional portion of the City of Brenham’s net assets, less than 1%, represents resources that are subject to external restrictions on how they may be used. The remaining balance of unrestricted net assets $19,052 may be used to meet the government's ongoing obligations to citizens and creditors. At the end of the current fiscal year, the City of Brenham is able to report positive balances in all three categories of net assets for the government as a whole. The same situation held true for the prior fiscal year.
13
CITY OF BRENHAM, TEXAS Management’s Discussion and Analysis
September 30, 2011 _________________________________________________________________________________________ GOVERNMENT-WIDE FINANCIAL ANALYSIS – (Continued)
2011 2010 2011 2010 2011 2010Revenues:Program revenues:
Charges for services 1,390$ 1,349$ 41,952$ 38,491$ 43,342$ 39,840$ Operating grants and
contributions 627 866 16 - 643 866 Capital grants and
contributions 610 1,213 600 229 1,210 1,442 General revenues:
Property taxes 4,980 5,011 - - 4,980 5,011 Sales taxes 3,775 3,679 - - 3,775 3,679 Franchise taxes 3,152 2,885 - - 3,152 2,885 Hotel Occupancy taxes 523 434 - - 523 434 Alcoholic Beverage taxes 24 25 - - 24 25 Other 394 978 117 96 511 1,074
Total revenues 15,475 16,440 42,685 38,816 58,160 55,256
Expenses:General government 5,174 5,756 - - 5,174 5,756 Public safety 6,579 6,831 - - 6,579 6,831 Highway/streets 2,629 2,680 - - 2,629 2,680 Interest on Long Term Debt 939 855 - - 939 855 Culture and recreation 3,514 3,676 - - 3,514 3,676 Health and welfare 289 299 - - 289 299 Water - - 3,430 3,088 3,430 3,088 Wastewater - - 2,861 2,979 2,861 2,979 Electric - - 23,963 22,260 23,963 22,260 Gas - - 2,603 3,200 2,603 3,200 Sanitation - - 2,707 2,669 2,707 2,669
Total Expenses 19,124 20,097 35,564 34,196 54,688 54,293 Increase (decrease) in net assets before transfers (3,649) (3,656) 7,121 4,620 3,472 964 Transfers 2,873 2,836 (2,873) (2,836) - -
Increase (decrease) in net assets (776) (820) 4,248 1,784 3,472 964 Net assets - beginning 40,330 41,040 42,697 40,357 83,027 81,397 Restatement of net assets - 110 - 556 - 666 Net assets - beginning as restated 40,330 41,150 42,697 40,913 83,027 82,063
Net assets - ending 39,554$ 40,330$ 46,945$ 42,697$ 86,499$ 83,027$
Activities Activities
City of Brenham, Texas
Governmental Business-type Total
(Amounts in Thousands)Changes in Net Assets
14

CITY OF BRENHAM, TEXAS Management’s Discussion and Analysis
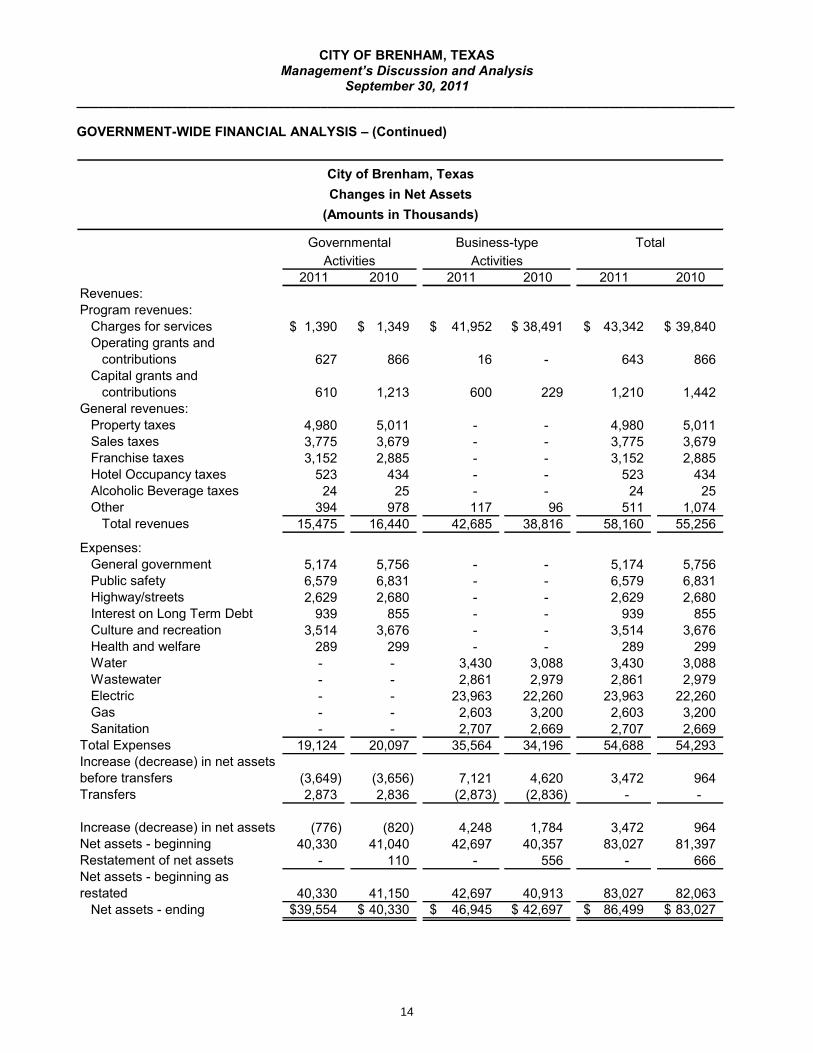
September 30, 2011 _________________________________________________________________________________________ GOVERNMENT-WIDE FINANCIAL ANALYSIS – (Continued) Governmental activities. Governmental activities decreased the City of Brenham’s net assets by $776 compared to a decrease of $820 in the prior fiscal year. Key elements of this decrease are noted below. Revenues decreased $965 (5.9%) during the year. This decrease is attributable to several factors. Program Revenues
Charges for Services increased $41 (3%) due primarily to increased Municipal Court fees and fines. Operating Grants and Contributions decreased by $239 (27.5%) which is primarily due to the following:
in FY10 Washington County paid $105 for the BVWACS radio tower project, and the City received $95 for the STEP grant which was not awarded to the City in FY11.
Capital Grants and Contributions decreased by $603 (49.8%) due primarily to the following: in FY10, the airport runway project was substantially complete, and public safety grants for the BVWACS radio system were also received.
General Revenues Property Taxes decreased $31 due to a decline in taxable values of -0.59% for the fiscal year. Sales Tax increased $96 over the prior year due to increased consumer spending. With higher motor
fuel costs, more consumers chose to limit their travel outside the City limits and shop locally. Franchise Taxes are received from the enterprise funds and are budgeted at 7% of revenue. The
franchise taxes were higher than the prior year by $267 which is directly attributable to increased revenues in the Electric and Water Funds.
Hotel Occupancy Taxes were higher by $89 or 20.5% due to the implementation and collection of a new 7% hotel occupancy tax for properties located in Washington County, but outside the city limits.
Other Revenues were lower than the prior year by $584, and the components are noted below. o Payments from Component Unit were lower by $631, due to proceeds from issuance of Limited
Tax Notes which were transferred to the Component Unit for capital improvements at the business park.
o Interest income was higher by $6, insurance proceeds were higher by $20, and the sale of assets increased by $5 over the prior year.
Expenses decreased $973 or 4.8% during the year. This decrease is attributable to several factors.
General Government expenditures decreased by $582. As noted in the section above, the timing of capital and operating grants impacts the revenue and corresponding expenditures of the general government departments. The FY10 expenditures included the Henderson Park Lift Station and the general government portion of the BVWACS interoperability radio project.
Public Safety expenditures decreased by $252 which is due primarily to the timing of the public safety portion of the BVWACS interoperability radio project and the Police Department K-9 program which were implemented in FY10.
Highway & Streets expenditures decreased by $51 which is attributable to reduced funding for Phase II of the street rehabilitation project.
Interest on Long Term Debt increased $84 primarily from the issuance of new Pass-Through Toll Revenue Bonds and Tax Anticipation Notes.
Culture & Recreation expenditures decreased $162 related mainly to capital improvements in Fireman’s Park and Hohlt Park which occurred in FY10.
Health & Welfare expenses decreased by $10 primarily from replacement of a vehicle in FY10. Transfers increased $37 during the year due to higher indirect expense allocation and utility transfers for downtown capital improvements.
15

CITY OF BRENHAM, TEXAS Management’s Discussion and Analysis
September 30, 2011 _________________________________________________________________________________________ GOVERNMENT-WIDE FINANCIAL ANALYSIS – (Continued)
16

CITY OF BRENHAM, TEXAS Management’s Discussion and Analysis
September 30, 2011 _________________________________________________________________________________________ GOVERNMENT-WIDE FINANCIAL ANALYSIS – (Continued) Business-type activities. Business-type activities increased the City of Brenham’s net assets by $4,248 compared to an increase of $1,784 in the prior fiscal year. Key elements of this increase are noted below. Revenues increased $3,869 or 10% during the year. This increase is attributable to several factors.
The charges for services in the Electric Fund increased by $2,427. Due to the extreme heat during the summer months, our electric customers increased their KWH consumption by 7% above FY10 consumption.
Gas Fund revenues decreased $531 resulting from lower winter gas sales which were 48,782 MCFs below the prior year.
The charges for services in the Water Fund increased by $1,224 during the year. With the continuing drought conditions, water consumption totaled 996 million gallons which was 31% or 243 million gallons higher than the previous year.
Charges for services in the Wastewater Fund were higher by $166 compared to the previous fiscal year. This increase is due primarily to a higher level of commercial/industrial gallons processed which resulted in higher commercial and industrial surcharge revenue.
The Sanitation Fund charges for services were higher by $207 which is due primarily to budgeted rate
increases in Transfer Station and Collection Station fees; increase in fees for garbage bags deposited at the Recycling Center and Collection Station; and the rebound in cardboard prices and other recyclables.
Other Revenue experienced an increase from the prior year of $21 comprised of a $45 increase in interest earnings and offset by reduced disposal of surplus capital and non-capital assets.
Capital grants and contributions were $600 for various projects: $348 for an emergency generator at the Water Treatment Plant; $224 for Woodbridge Subdivision infrastructure improvements; and $28 for Henderson Park Lift Station.
Expenses increased $1,368 or 4% during the year with specific changes presented below.
Electric Fund expenses increased by $1,704 resulting from higher KWH consumption which also results in higher franchise taxes.
The decrease in Gas Fund expenses of $598 is due to lower gas purchase costs driven by reduced sales volume which translates to lower franchise taxes.
The increased revenue from higher water sales has a corresponding impact on expenses in the Water
Fund which increased by $342 due to higher costs for water treatment chemicals, electrical costs and higher franchise taxes.
Wastewater Fund expenses decreased by $118 and can be attributed mainly to lower interest expense resulting from the refunding of the 2001 and 2002 Certificates of Obligation.
With four operational areas, the Sanitation Fund expenses increased by $38 due primarily to higher
vehicle maintenance and improvements to parking lots at the Transfer Station and Collection Station.
Transfers increased $37 during the year due to higher indirect expense allocation and utility transfers for downtown capital improvements.
17

CITY OF BRENHAM, TEXAS Management’s Discussion and Analysis
September 30, 2011 _________________________________________________________________________________________ GOVERNMENT-WIDE FINANCIAL ANALYSIS – (Continued)
18

CITY OF BRENHAM, TEXAS Management’s Discussion and Analysis
September 30, 2011 _________________________________________________________________________________________ FINANCIAL ANALYSIS OF THE GOVERNMENT’S FUNDS As noted earlier, the City of Brenham uses fund accounting to ensure and demonstrate compliance with finance-related legal requirements. Governmental funds. The focus of the City of Brenham’s governmental funds is to provide information on near-term inflows, outflows, and balances of spendable resources. Such information is useful in assessing the City of Brenham’s financing requirements. In particular, unassigned fund balance may serve as a useful measure of a government's net resources available for spending at the end of the fiscal year. As of the end of the current fiscal year, the City of Brenham’s governmental funds reported combined ending fund balances of $9,944 an increase of $4,790 in comparison with the prior year. The increase is primarily related to the U.S. Hwy 290 Fund activity, which is described below. The U.S. Hwy 290 Pass-Thru Finance Fund has a total fund balance of $5,404 which is an increase of $4,955 in comparison to the prior fiscal year. When the Pass-Through Toll Revenue Bonds were issued this year, the City received $15,000 in proceeds. In accordance with the TxDOT agreement, $10,000 was paid in FY11 and the remaining balance will be paid in the subsequent fiscal year. The Debt Service Fund has a total fund balance of $246 all of which is restricted for the payment of debt. The fund balance decreased during the current year by $236 due utilization of fund balance to pay the initial debt service payments for the U.S. Hwy 290 project deferring a tax increase until FY12. Proprietary funds. The City of Brenham’s proprietary funds provide the same type of information found in the GWFS, but in more detail. Unrestricted net assets of the Electric Fund at the end of the year amounted to $9,377; those of the Gas Fund were $1,021; the Water Fund $2,447; the Wastewater Fund $1,396 and the Sanitation Fund $756. Other factors concerning the finances of these funds have already been addressed in the discussion of the City of Brenham’s business-type activities. GENERAL FUND BUDGETARY HIGHLIGHTS The General Fund is the chief operating fund of the City of Brenham. With the implementation of GASB Statement No. 54 Fund Balance Reporting and Governmental Fund Type Definitions, six other governmental funds were combined with the General Fund. The original revenue budget was $11,673 and the final amended budget was $11,787, an increase of $114. Revenues were amended by $35 for the sale of surplus assets via an online auction, and $86 for increased Municipal Court fines. The original expenditure budget was $14,604 and the final amended budget was $14,531 (a decrease of $73) which is primarily due to the downtown master plan which was deferred to FY12. The original budget for transfers-in was $3,078 and the final amended budget was $3,068 a decrease of $10. This change is related to a transfer-out to the Electric Fund for street light and signal maintenance, which reduced the overall transfers-in to the General Fund.
19

CITY OF BRENHAM, TEXAS Management’s Discussion and Analysis
September 30, 2011 _________________________________________________________________________________________ CAPITAL ASSET AND DEBT ADMINISTRATION Capital assets. The City of Brenham’s investment in capital assets for its governmental and business- type activities as of September 30, 2011 amounts to $103,376 (net of accumulated depreciation). This investment in capital assets includes land, buildings and system improvements, machinery and equipment, park facilities, roads, highways, and bridges. The total decrease in the City of Brenham’s investment in capital assets for the current fiscal year was $229 or less than 1%. Changes in major capital asset expenditures during the current fiscal year included the following: Governmental capital assets showed a net decrease of $1,314 due primarily to the following: the current
year net change (additions less retirements) was $1,603 while the current year depreciation expense was $2,916. However, current year increases included $50 donation of Linda Anderson Park from Washington County; Woodbridge Subdivision infrastructure improvements donated by the developer for $375; and construction-in-progress additions of $172 related to paving and drainage infrastructure improvements in the Southwest Industrial Park, Section 3.
Business-type capital assets showed a net increase of $1,085. In comparing the change between fiscal
years, the significant change in is the Infrastructure category. The increase is due primarily to the AMR meter replacement project. Each utility operation is replacing the existing meters with a smart meter and project completion varies between funds. The Electric Utility is 48% complete, Gas Utility is 38% complete, and the Water Utility is 36% complete.
2011 2010 2011 2010 2011 2010Land and Improvements 3,048$ 2,949$ 1,313$ 1,313$ 4,361$ 4,262$ Buildings 18,943 19,300 449 381 19,392 19,681Improvements other than buildings 6,246 6,783 22,333 22,713 28,579 29,496Furniture, fixtures, and equipment 986 1,157 570 324 1,556 1,481Machinery 199 233 - - 199 233Vehicles 2,575 2,702 1,069 1,027 3,644 3,729Intangibles 169 178 58 7 227 185 Infrastructure 20,827 21,157 24,688 23,352 45,515 44,509Construction in progress 368 216 197 475 565 691Impairment (662) (662) - - (662) (662)
Total 52,699$ 54,013$ 50,677$ 49,592$ 103,376$ 103,605$
Activities Activities
(net of depreciation)
City of Brenham, Texas
Governmental Business-type Total
Capital Assets(Amounts in Thousands)
Additional information on the City of Brenham’s capital assets can be found in note III.E on pages 47-48 of this report.
20

CITY OF BRENHAM, TEXAS Management’s Discussion and Analysis
September 30, 2011 _________________________________________________________________________________________ CAPITAL ASSET AND DEBT ADMINISTRATION – (Continued) Long-term debt. At the end of the current fiscal year, the City of Brenham had total bonded debt outstanding, net of unamortized charges, of $53,778. Of this amount, $32,932 is tax-supported debt backed by the full faith and credit of the government and sales tax revenues of the BCDC (Component Unit). The remaining $20,846 is self-supported debt that is to be repaid from system revenues.
2011 2010 2011 2010 2011 2010General Obligation Bonds 9,383$ 6,906$ 6,536$ 8,764$ 15,919$ 15,670$ Certificates of Obligation 7,949 11,407 14,972 13,892 22,921 25,299Pass-Through Toll Revenue Bonds 14,165 - - - 14,165 - Limited Tax Notes 655 - - - 655 - Unamortized Credits/Charges 780 (23) (662) (428) 118 (451)
Total 32,932$ 18,290$ 20,846$ 22,228$ 53,778$ 40,518$
General Obligation Bonds, Certificates of Obligation, Pass-Through Toll Revenue Bonds and Limited Tax Notes
Activities Activities
City of Brenham, Texas
(Amounts in Thousands)
Governmental Business-type Total
Outstanding Debt
The City of Brenham’s total bonded debt increased by $13,260 or 33% during the current fiscal year primarily due to the issuance of Pass-Through Toll Revenue Bonds for improvements to U.S. Hwy 290. Despite a struggling economy nationwide, the City of Brenham maintained its strong bond rating of AA- from the Standard and Poor’s rating agency. The ratings reflect the City’s strong financial position bolstered by the maintenance of healthy financial reserves. The Fitch bond rating remained at an “A” rating level. State statutes limit the amount of general obligation debt a governmental entity may issue to 2.5% of its total assessed valuation. Additionally, the City’s charter allows a rate not exceeding $1.65 per $100 valuation for any one year. The tax rate is $.5042 for the year ended September 30, 2011 which is significantly below the $1.65 allowed by the City’s charter. Additional information about the City’s long-term debt can be found in note III.H through I on pages 51-55 of this report. ECONOMIC FACTOR’S AND NEXT YEAR’S BUDGET AND RATES The unemployment rate for Washington County as of September 2011 was 6.4%, which is slightly higher
than the rate of 5.9% one year ago. The current rate compares favorably to the state's average unemployment rate of 8.4%.
Sales tax, which is the City’s largest revenue source for funding general government operations, was higher than budgeted levels by 1.4%. However, with the U.S. Hwy 290 construction project and its potential, temporary interference with ease of access to important retail areas, we are continuing a conservative approach for FY12 with only a 1% increase budgeted for sales tax revenue.
Inflationary trends in the region compare favorably to national indices.
These factors, as well as items noted in the Economic Conditions and Outlook section in the letter of transmittal, were considered in preparing the City of Brenham’s budget for the 2012 fiscal year.
21

CITY OF BRENHAM, TEXAS Management’s Discussion and Analysis
September 30, 2011 _________________________________________________________________________________________ ECONOMIC FACTOR’S AND NEXT YEAR’S BUDGET AND RATES – (Continued) During the current fiscal year, unassigned fund balance in the General Fund, which excludes the other internal funds, grew from $2,765 to over $3,301. The City of Brenham’s adopted budget for fiscal year 2012 is at a break-even level, so that General Fund expenditures do not utilize any fund balance. For FY12, the City’s overall tax rate increased from $0.5042 to $0.5432 due to transportation initiative described below. The M&O rate remained at $0.3420 while the I&S rate increased by $0.039 from $0.1622 to $0.2012. Two major transportation initiatives were funded in the FY12 budget. First, the two-year construction of the U.S. Highway 290 Transportation Project began in mid-2011. This project will aid mobility and safety for the 26,000 vehicles per day traveling US Highway 290, and is a joint project with the City, Washington County, and the Texas Department of Transportation. The City’s portion of the debt service costs required a $0.025 increase in the I&S tax rate. Secondly, Limited Tax Notes for $1.2 million were issued for a Street Overlay project to be performed by an outside contractor. The impact of this additional debt service added $0.0188 to the I&S tax rate. Both of these increases are partially offset by a tax rate reduction of $0.0048 for maturing capital leases. Although we are continuing the AMR meter replacement project, no rate increases were necessary in the fiscal year 2012 operating budgets for the enterprise funds. We believe excess working capital from each of the funds is sufficient to cover meter replacement costs. Requests for Information This financial report is designed to present users with a general overview of the City of Brenham’s finances and to demonstrate the City’s accountability. Questions concerning any of the information provided in this report or requests for additional financial information should be addressed to the Chief Financial Officer, P.O. Box 1059, Brenham, Texas, 77834.
22

$ 4,305,636 $ 8,719,213 $ 13,024,849 $ 1,292,533 191,219 - 191,219 -663,035 - 663,035 221,012
56,836 - 56,836 -362,236 5,178,305 5,540,541 -
- 55,649 55,649 -(475,085) 475,085 - -
10,130,260 11,597 10,141,857 -197,188 1,852,873 2,050,061 -
- 51,394 51,394 -13,641 704,275 717,916 -
5,908,422 3,483,174 9,391,596 -3,426,260 1,517,854 4,944,114 2,258,383
- 1,368,539 1,368,539 -469,747 291,287 761,034 -
49,272,759 49,158,826 98,431,585 -74,522,153 72,868,071 147,390,225 3,771,928
592,785 2,780,640 3,373,425 104,073 20,811 - 20,811 -
167 3,403 3,570 -151,827 94,407 246,234 55,649 121,665 - 121,665 -148,308 82,737 231,045 -
1,383,489 - 1,383,489 -116,347 95,507 211,854 -
- 1,456,513 1,456,513 -- - - 51,394 - 1,666,624 1,666,624 -
174,545 70,428 244,973 -273,384 190,054 463,438 -
31,984,884 19,482,453 51,467,337 1,368,539 34,968,212 25,922,766 60,890,978 1,579,655
35,294,268 31,846,549 67,140,817 838,450 307,292 - 307,292 -
- - - 520,619 - - - 213,496 - - - 619,708
3,952,381 15,098,756 19,051,138 -$ 39,553,941 $ 46,945,305 $ 86,499,247 $ 2,192,273
The notes to the financial statements are an integral part of this statement.
Total liabilities
NET ASSETSInvested in Capital Assets, Net of Related DebtRestricted for Debt ServiceRestricted for Economic Development
Post Employment BenefitsLong Term Debt, Net
UnrestrictedTotal net assets
Restricted for Capital Improvements
Self Insurance Claims PayableCompensated Absences, CurrentBonds Payable, CurrentLease Payable, CurrentRevenue Bonds Payable, Current
Restricted for Recreation
Notes Payable, Current - Component UnitConsumer DepositsCompensated Absences, Long Term
Total assets
LIABILITIESAccounts Payable and Other Current LiabilitiesDue to Other GovernmentsOther LiabilitiesAccrued Interest
Restricted CashCapital Assets, Not Being DepreciatedNotes Receivable, Long TermUnamortized Bond Issuance Costs, NetOther Capital Assets, Net
Due from Other GovernmentsInventory at CostNotes Receivable, CurrentOther Current Assets
Cash and EquivalentsReceivables - Property Tax (net)Receivables - Sales TaxReceivables - Occupancy TaxesReceivables - Account (net)
Internal BalancesReceivables - Interest
ASSETS
City of BrenhamStatement of Net Assets
September 30, 2011
Primary Government
GovernmentalActivities
Business-typeActivities Total
Component Unit
23

This page intentionally left blank.
24

Expenses Total
$ 5,177,514 $ 515,429 $ (3,635,641) $ - $ (3,635,641) $ - 6,579,061 - (6,198,607) - (6,198,607) -2,628,682 37,603 (2,509,594) - (2,509,594) -
288,699 - (199,239) - (199,239) -3,513,628 57,113 (3,017,608) - (3,017,608) -
938,663 - (938,663) - (938,663) -
19,126,247 610,145 (16,499,352) - (16,499,352) -
23,962,803 - 2,851,225 2,851,225 -2,602,842 - 575,969 575,969 -2,706,750 - 429,387 429,387 -2,860,922 - 1,025,839 1,025,839 -3,430,862 - 2,122,229 2,122,229 -
35,564,179 599,799 - 7,004,649 7,004,649 -
$ 269,757 - (269,757)$ 269,757 - (269,757)
4,980,377 - 4,980,377 -3,774,894 - 3,774,894 1,258,298 3,152,016 - 3,152,016 -
523,605 - 523,605 -24,247 - 24,247 -18,501 95,798 114,299 1,645
143,988 21,046 165,034 -12,771 - 12,771 3,100
219,526 - 219,526 (219,526)2,872,953 (2,872,953) - -
15,722,878 (2,756,109) 12,966,769 1,043,517
40,330,415 42,696,765 83,027,180 1,418,513
$ 39,553,941 $ 46,945,305 $ 86,499,246 $ 2,192,273
Business-type Activities
ComponentUnit
City of BrenhamStatement of Activities
For the Year Ended September 30, 2011
Net (Expense) Revenue andChanges in Net AssetsProgram Revenues
Functions/Programs
Primary GovernmentCapital Grants
and Contributions
Charges for Services
Governmental Activities
Primary government: Governmental activities: General Government $ 934,808 $ 91,636
Operating Grants and Contributions
Public Safety 6,258 374,196 Highways and Streets 51,666 29,819 Health and Welfare 32,452 57,008 Culture and Recreation 364,696 74,211 Interest on Long Term Debt - -
Total governmental activities 1,389,880 626,870
Business-type activities: Electric 26,814,028 - Gas 3,178,811 - -
-
Sanitation 3,119,515 16,622 - Wastewater 3,717,883 - 168,878
$ 43,342,287 $ 643,492 $ 1,209,944
Water 5,122,170 - 430,921 Total business-type activities 41,952,407 16,622
$ (16,499,352) $ 7,004,649 $ (9,494,703) $ -
Component unit: Brenham Community Devel Corp - -
Total primary government $ 54,690,426
Total component unit - -
Property TaxesSales TaxesFranchise TaxesHotel Occupancy TaxesAlcoholic Beverage TaxesInvestment Income not RestrictedMiscellaneousGain on Sale of Capital AssetsPayments to/from Component Unit
Transfers
Total general revenuesChange in net assets (776,474) 4,248,540
The notes to the financial statements are an integral part of this statement.
3,472,066 773,760
Net assets - beginning
Net assets - ending
25
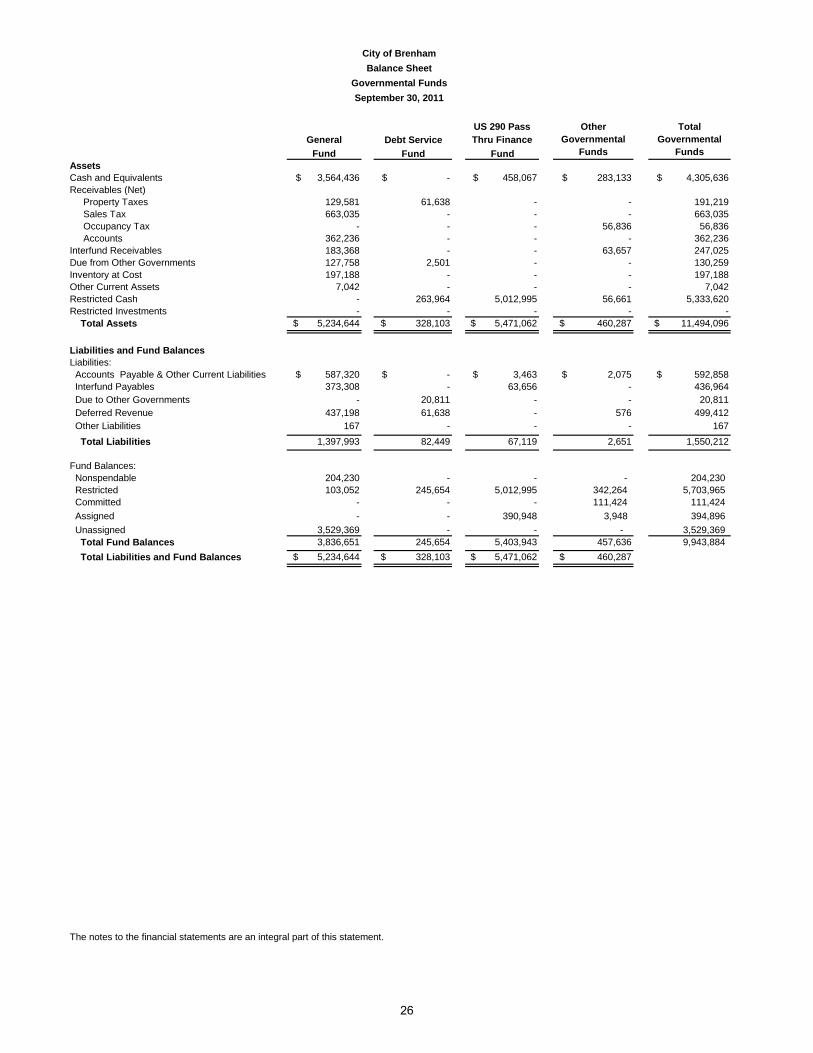
GeneralFund
$ 3,564,436 $ 283,133 $ 4,305,636
129,581 - 191,219 663,035 - 663,035
- 56,836 56,836 362,236 - 362,236 183,368 63,657 247,025 127,758 - 130,259 197,188 - 197,188
7,042 - 7,042 - 56,661 5,333,620 - - -
$ 5,234,644 $ 460,287 $ 11,494,096
$ 587,320 $ 2,075 $ 592,858 373,308 - 436,964
- 20,811 - - 20,811 437,198 576 499,412
167 - 167 1,397,993 2,651 1,550,212
204,230 - 204,230 103,052 342,264 5,703,965
- 111,424 111,424 - 3,948 394,896
3,529,369 - 3,529,369 3,836,651 457,636 9,943,884
$ 5,234,644 $ 460,287
The notes to the financial statements are an integral part of this statement.
Total Liabilities and Fund Balances $ 328,103
245,654 Committed
-
- -
Total Fund Balances 245,654 5,403,943 $ 5,471,062
- -
Assigned Unassigned
Deferred Revenue 61,638 Other Liabilities -
-
Total Liabilities 82,449
Fund Balances: Nonspendable Restricted
Liabilities: Accounts Payable & Other Current Liabilities $ - Interfund Payables -
Restricted Investments - Total Assets $ 328,103
Liabilities and Fund Balances
Inventory at Cost -Other Current Assets -Restricted Cash 263,964
Accounts -Interfund Receivables -Due from Other Governments 2,501
61,638 Sales Tax - Occupancy Tax -
Thru Finance
Due to Other Governments
City of BrenhamBalance Sheet
Governmental FundsSeptember 30, 2011
Other Governmental
Funds
Total Governmental
FundsDebt Service
FundAssetsCash and Equivalents $ - Receivables (Net) Property Taxes
---
Fund
$ 458,067
--
US 290 Pass
67,119
5,012,995
390,948 -
$ 3,463 63,656
--
--
5,012,995 -
$ 5,471,062
-
26

Total fund balances - total governmental funds $ 9,943,884
Amounts reported for governmental activities in the statement of net assets are different because:
Capital assets used in governmental activities are not current financial resources and 52,699,018 therefore are not reported in the governmental funds balance sheet.
Gross capital assets 90,502,924 Accumulated depreciation (37,141,564) Impairment Loss (662,342)
52,699,018
Certain long-term assets are not available to pay current period expenditures and therefore 10,000,000 are not reported in the governmental funds balance sheet.
Long term liabilities are not due and payable in the current period and, therefore, they are (33,763,037) not reported in the governmental funds balance sheet.
Bonds payable 32,151,853 Less: Unamortized bond issue costs (469,749) Less: Issuance discount (942) Add: Issuance premium 1,226,875 Less: Unamortized deferred charges (445,397) Accrued interest payable 151,827 Capital lease payable 552,333 Compensated absences 322,853 Post retirement benefits 273,384
33,763,037
Internal service funds are used by management to charge the costs of risk management 174,664 services to individual funds. The assets and liabilities of the internal service fund are included in governmental activities in the statement of net assets.
Other long term assets are not available to pay for current period expenditures and 499,412 therefore are deferred in the funds.
Net assets of governmental activities 39,553,941$
The notes to the financial statements are an integral part of this statement.
City of BrenhamReconciliation of the Balance Sheet of Governmental Funds
To the Statement of Net AssetsFor the Year Ended September 30, 2011
27

$ - $ 523,605 12,445,035 - - 64,465 - 65,951 696,256 - 65,237 558,484 - - 766,908
11,289 155 18,259 - 181,000 970,989
- - 1,250 111,254 - 3,181 115,930
11,289 840,379 15,747,580
- 364,968 2,860,841 - 60,672 4,814,955 - - 278,258
10,046,872 135 11,426,323 - 1,188 5,801,959
- - 932,687 - - 1,623,452
255,146 - 331,409 11,847 239,004 1,203,378
10,313,865 665,967 29,273,262
Excess (Deficiency) of Revenues Over (Under) Expenditures (10,302,576) 174,412 (13,525,682)
- - 3,091,370 (67,679) (150,738) (218,417)
- - (751,463)- - 3,060,619
- - - (3,004,387)772,558 - 15,325,116 - 16,097,674
- - 40,074
15,257,437 (150,738) 18,315,470
4,954,861 23,674 4,789,788
449,082 433,962 5,154,096
$ 5,403,943 $ 457,636 $ 9,943,884
RevenuesTaxes $ 10,323,014 $ 1,598,416
Fund
US 290 PassThru Finance
Other Governmental
Funds
City of BrenhamStatement of Revenues, Expenditures, and Changes in Fund Balances
Governmental FundsFor the Year Ended September 30, 2011
Total Governmental
FundsGeneral Debt Service
Fund Fund
Licenses and Permits 64,465 -Intergovernmental 630,305 -Charges for Services 493,247 -Fines and Forfeitures 766,908 -Investment Income 5,560 1,255 Payment from Component Unit 216,500 573,489 Contributions and Donations 110,004 Miscellaneous 112,749 -
Total revenues 12,722,752 2,173,160
ExpendituresCurrent: Culture and Recreation 2,495,873 - General Government 4,754,283 - Health and Welfare 278,258 - Highways and Streets 1,379,316 - Public Safety 5,800,771 -Debt service: Interest & Fiscal Charges - 932,687 Principal Retirement - 1,623,452 Issuance Costs 21,095 55,168 Capital Outlay 952,527 -
Total expenditures 15,682,123 2,611,307
(2,959,371) (438,147)Other Financing Sources (Uses)Transfers In 2,945,685 145,685 Transfers Out - -
Refunding bonds issued - 3,060,619 Payment to Component Unit (751,463) -
Payment to refunded bond escrow agent (3,004,387)
Insurance Proceeds 40,074 -Proceeds from Bonds
Total other financing sources and (uses) 3,006,854 201,917
Net change in Fund Balances 47,483 (236,230)
3,789,168 481,884
Fund balances - ending $ 3,836,651 $ 245,654
Fund balances - beginning as restated
28
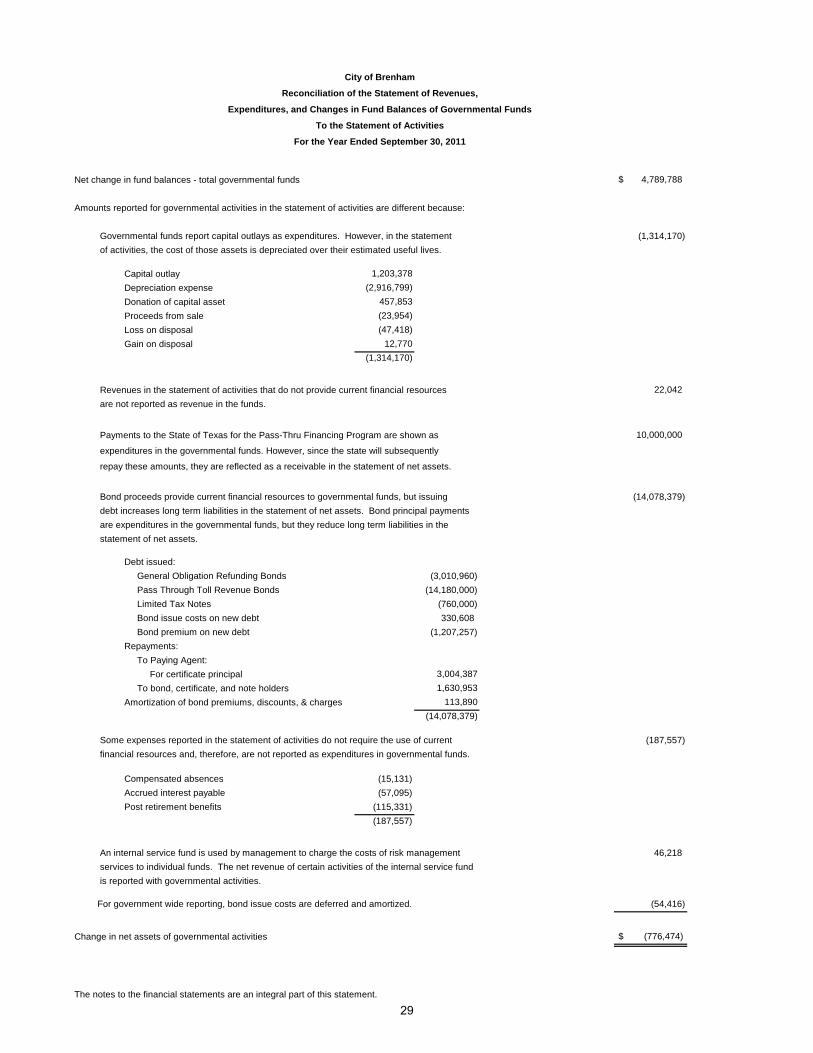
Net change in fund balances - total governmental funds $ 4,789,788
Amounts reported for governmental activities in the statement of activities are different because:
Governmental funds report capital outlays as expenditures. However, in the statement (1,314,170) of activities, the cost of those assets is depreciated over their estimated useful lives.
Capital outlay 1,203,378 Depreciation expense (2,916,799)Donation of capital asset 457,853 Proceeds from sale (23,954)Loss on disposal (47,418)Gain on disposal 12,770
(1,314,170)
Revenues in the statement of activities that do not provide current financial resources 22,042 are not reported as revenue in the funds.
Payments to the State of Texas for the Pass-Thru Financing Program are shown as 10,000,000
expenditures in the governmental funds. However, since the state will subsequently
repay these amounts, they are reflected as a receivable in the statement of net assets.
Bond proceeds provide current financial resources to governmental funds, but issuing (14,078,379) debt increases long term liabilities in the statement of net assets. Bond principal payments are expenditures in the governmental funds, but they reduce long term liabilities in the statement of net assets.
Debt issued: General Obligation Refunding Bonds (3,010,960) Pass Through Toll Revenue Bonds (14,180,000) Limited Tax Notes (760,000) Bond issue costs on new debt 330,608 Bond premium on new debt (1,207,257) Repayments: To Paying Agent: For certificate principal 3,004,387 To bond, certificate, and note holders 1,630,953 Amortization of bond premiums, discounts, & charges 113,890
(14,078,379)
Some expenses reported in the statement of activities do not require the use of current (187,557) financial resources and, therefore, are not reported as expenditures in governmental funds.
Compensated absences (15,131) Accrued interest payable (57,095) Post retirement benefits (115,331)
(187,557)
An internal service fund is used by management to charge the costs of risk management 46,218 services to individual funds. The net revenue of certain activities of the internal service fund is reported with governmental activities.
For government wide reporting, bond issue costs are deferred and amortized. (54,416)
Change in net assets of governmental activities $ (776,474)
The notes to the financial statements are an integral part of this statement.
City of Brenham
Reconciliation of the Statement of Revenues,
Expenditures, and Changes in Fund Balances of Governmental Funds
To the Statement of Activities
For the Year Ended September 30, 2011
29

This page intentionally left blank.
30

Gas Fund
$ 696,150 $ 941,448 $ 1,203,842 $ 717,623 $ - - - - - -
234,729 792,087 477,526 238,568 995 - 223,494 - - -- - - 11,597 -
229,291 838,292 30,859 - -- 45,297 1,906 26,310 6,599 - - - - -- 1,688,918 - - 574,802
Total current assets 1,160,170 4,529,536 1,714,133 994,098 582,396
1,647,236 18,466,897 20,511,532 1,426,474 -- 114,761 176,526 - -- - - - -
Total noncurrent assets 1,647,236 18,581,658 20,688,058 1,426,474 -2,807,406 23,111,194 22,402,191 2,420,572 582,396
- 2,353 1,050 - -51 49,732 44,228 286 -
- - 181,784 41,710 183,368 - - - - - 122,661
7,644 12,393 13,702 11,733 -9,566 2,787 3,225 71,829 -
- - 600,230 856,283 - -- - - - -
8,396 12,693 8,192 8,359 -21,565 37,296 29,229 27,495 -8,458 9,370,703 10,048,745 14,765 -
1,629,212 10,520,994 9,779,804 1,339,880 - 1,020,961 2,447,410 1,395,900 756,015 276,367
$ 2,650,173 $ 12,968,404 $ 11,175,704 $ 2,095,895 $ 276,367
Some amounts reported for business-type activities in the Statement of Activities are differentbecause the net revenue(expense) of certain internal service funds are reported with
Net Assets of business-type activities
Interest Receivable 55,649 55,649
City of Brenham, TexasStatement of Net Assets
Proprietary FundsSeptember 30, 2011
Business-type Activities - Enterprise Funds
Electric Fund Water Fund Wastewater Fund
Sanitation Fund TotalProprietary
Gov. ActivitiesInternal Service
Assets Current assets:
Cash and Equivalents $ 5,160,150 $ 8,719,213
Receivables - Accounts, Net 3,435,395 5,178,305 Receivables - Interfund 373,308 596,802 Intergovernmental Receivable - 11,597 Inventory at Cost 754,431 1,852,873 Other Current Assets 630,762 704,275 Notes Receivable, Net 51,394 51,394 Restricted Cash 1,794,256 3,483,174
12,255,345 20,653,282 Noncurrent assets:
Capital Assets, Net 8,624,541 50,676,680 Unamortized Bond Issuance Cost - 291,287 Notes Receivable, Long Term 1,368,539 1,368,539
9,993,080 52,336,506 Total assets 22,248,425 72,989,788
LiabilitiesCurrent liabilities:
Accounts Payable & Other Current Liabilities $ 2,435,935 $ 101,553 $ 54,603 $ 40,049 $ 148,500 $ 2,780,640 $ - Other Liabilities - 3,403 Accrued Interest 110 94,407 Interfund Payable - 223,494 Self Insurance Claims Payable -Compensated Absences, Current 37,265 82,737 Lease Payable, Current 8,100 95,507 Revenue Bonds Payable, Current 1,456,513 Consumer Deposits 1,666,624 1,666,624
Total current liabilities 4,148,034 118,814 722,098 1,140,321 274,058 6,403,325 306,029
Non current liabilities:Compensated Absences 32,788 70,428 Post Employment Benefits 74,469 190,054 Long Term Debt, Net 39,782 19,482,453
Total noncurrent liabilities 147,039 38,419 9,420,692 10,086,166 50,619 19,742,935 -Total liabilities 4,295,073 157,233 10,142,790 11,226,487 324,677 26,146,260 306,029
Net AssetsInvested in Capital Assets, Net of Related Debt 8,576,659 31,846,549 Unrestricted 9,376,693 14,996,979 Total net assets $ 17,953,352 46,843,528
business-type activities 101,777 $ 46,945,305
The notes to the financial statements are an integral part of this statement.
31

This page intentionally left blank.
32
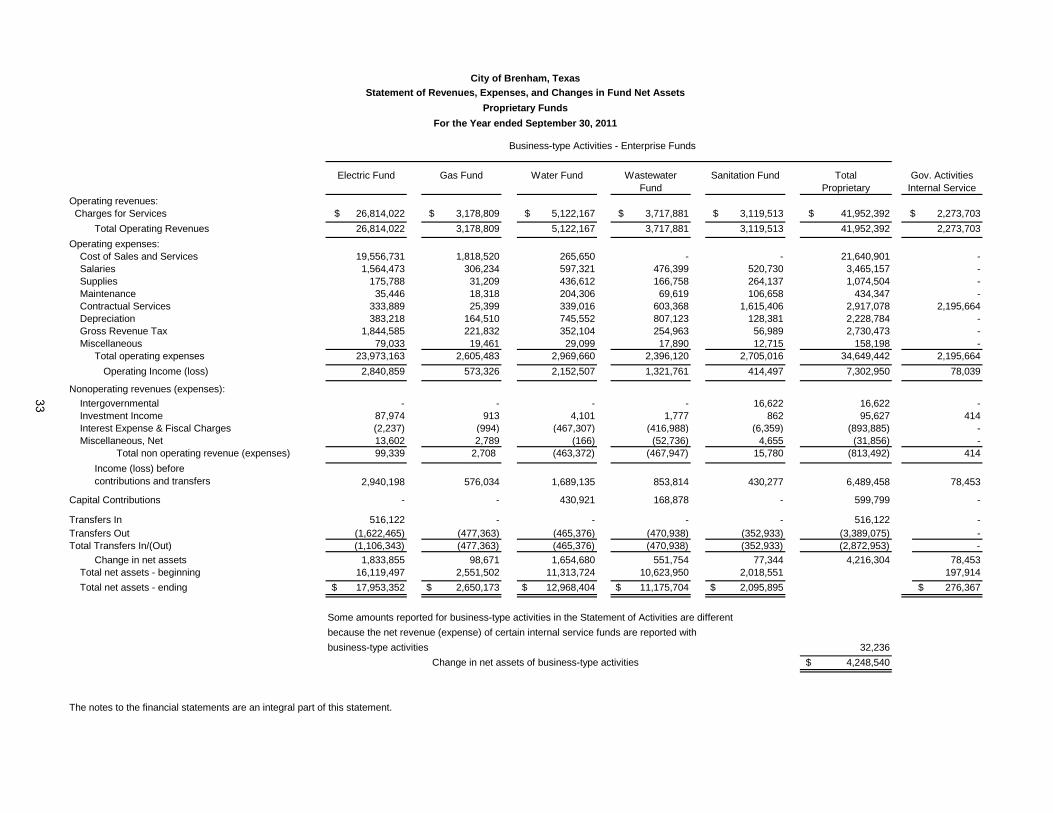
$ 3,178,809 $ 5,122,167 $ 3,717,881 $ 3,119,513 3,178,809 5,122,167 3,717,881 3,119,513
1,818,520 265,650 - -306,234 597,321 476,399 520,730 31,209 436,612 166,758 264,137 18,318 204,306 69,619 106,658 25,399 339,016 603,368 1,615,406
164,510 745,552 807,123 128,381 221,832 352,104 254,963 56,989 19,461 29,099 17,890 12,715
2,605,483 2,969,660 2,396,120 2,705,016
- - - - 16,622 913 4,101 1,777 862
(994) (467,307) (416,988) (6,359)2,789 (166) (52,736) 4,655
2,708 (463,372) (467,947)
576,034 1,689,135 853,814 430,277 78,453
- 430,921 168,878 - -
- - - - -(477,363) (465,376) (470,938) (352,933) -(477,363) (465,376) (470,938) (352,933) (2,872,953) -
1,833,855 98,671 1,654,680 551,754 77,344 4,216,304 78,453 Total net assets - beginning 2,551,502 11,313,724 10,623,950 2,018,551 197,914
$ 2,650,173 $ 12,968,404 $ 11,175,704 $ 2,095,895 $ 276,367
Some amounts reported for business-type activities in the Statement of Activities are differentbecause the net revenue (expense) of certain internal service funds are reported withbusiness-type activities 32,236
Change in net assets of business-type activities $ 4,248,540
The notes to the financial statements are an integral part of this statement.
16,119,497 Total net assets - ending $ 17,953,352
Transfers In 516,122 516,122 Transfers Out (1,622,465) (3,389,075)Total Transfers In/(Out) (1,106,343)
Change in net assets
Total non operating revenue (expenses) 99,339 15,780 (813,492) 414 Income (loss) beforecontributions and transfers 2,940,198 6,489,458
Capital Contributions - 599,799
Investment Income 87,974 95,627 414 Interest Expense & Fiscal Charges (2,237) (893,885) -Miscellaneous, Net 13,602 (31,856) -
Nonoperating revenues (expenses):
Operating Income (loss) 2,840,859 573,326 2,152,507
Intergovernmental 16,622 -
Depreciation 383,218 2,228,784 -Gross Revenue Tax 1,844,585 2,730,473 -
1,321,761 414,497
Miscellaneous 79,033 158,198 -Total operating expenses 23,973,163 34,649,442 2,195,664
7,302,950 78,039
Supplies 175,788 1,074,504 -Maintenance 35,446 434,347 -Contractual Services 333,889 2,917,078 2,195,664
Operating expenses:Cost of Sales and Services 19,556,731 21,640,901 -Salaries 1,564,473 3,465,157 -
Operating revenues: Charges for Services $ 26,814,022 $ 41,952,392 $ 2,273,703
Total Operating Revenues 26,814,022 41,952,392 2,273,703
City of Brenham, TexasStatement of Revenues, Expenses, and Changes in Fund Net Assets
Proprietary FundsFor the Year ended September 30, 2011
Business-type Activities - Enterprise Funds
Electric Fund Gas Fund Water Fund Wastewater Fund
Sanitation Fund TotalProprietary
Gov. ActivitiesInternal Service
33
.Wastewater Total Gov. Activities
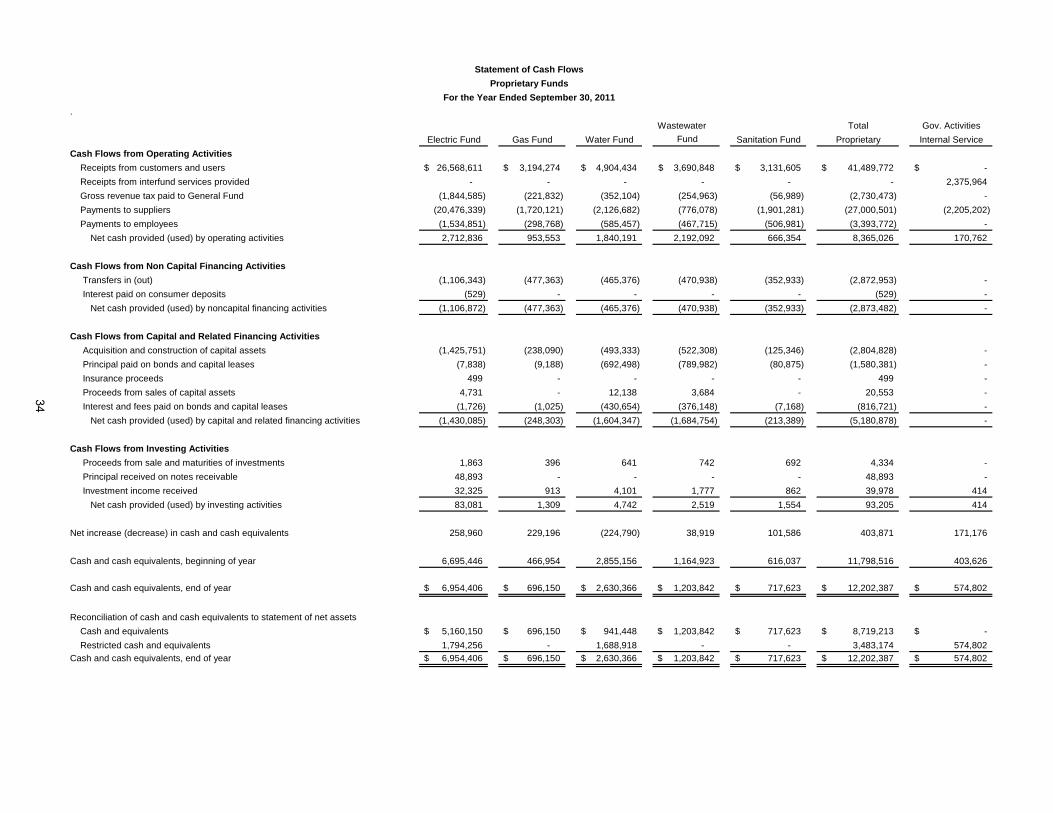
Electric Fund Gas Fund Water Fund Fund Sanitation Fund Proprietary Internal ServiceCash Flows from Operating Activities Receipts from customers and users 26,568,611$ 3,194,274$ 4,904,434$ 3,690,848$ 3,131,605$ 41,489,772$ -$ Receipts from interfund services provided - - - - - - 2,375,964 Gross revenue tax paid to General Fund (1,844,585) (221,832) (352,104) (254,963) (56,989) (2,730,473) - Payments to suppliers (20,476,339) (1,720,121) (2,126,682) (776,078) (1,901,281) (27,000,501) (2,205,202) Payments to employees (1,534,851) (298,768) (585,457) (467,715) (506,981) (3,393,772) - Net cash provided (used) by operating activities 2,712,836 953,553 1,840,191 2,192,092 666,354 8,365,026 170,762
Cash Flows from Non Capital Financing Activities Transfers in (out) (1,106,343) (477,363) (465,376) (470,938) (352,933) (2,872,953) - Interest paid on consumer deposits (529) - - - - (529) - Net cash provided (used) by noncapital financing activities (1,106,872) (477,363) (465,376) (470,938) (352,933) (2,873,482) -
Cash Flows from Capital and Related Financing Activities Acquisition and construction of capital assets (1,425,751) (238,090) (493,333) (522,308) (125,346) (2,804,828) - Principal paid on bonds and capital leases (7,838) (9,188) (692,498) (789,982) (80,875) (1,580,381) - Insurance proceeds 499 - - - - 499 - Proceeds from sales of capital assets 4,731 - 12,138 3,684 - 20,553 - Interest and fees paid on bonds and capital leases (1,726) (1,025) (430,654) (376,148) (7,168) (816,721) - Net cash provided (used) by capital and related financing activities (1,430,085) (248,303) (1,604,347) (1,684,754) (213,389) (5,180,878) -
Cash Flows from Investing Activities Proceeds from sale and maturities of investments 1,863 396 641 742 692 4,334 - Principal received on notes receivable 48,893 - - - - 48,893 - Investment income received 32,325 913 4,101 1,777 862 39,978 414 Net cash provided (used) by investing activities 83,081 1,309 4,742 2,519 1,554 93,205 414
Net increase (decrease) in cash and cash equivalents 258,960 229,196 (224,790) 38,919 101,586 403,871 171,176
Cash and cash equivalents, beginning of year 6,695,446 466,954 2,855,156 1,164,923 616,037 11,798,516 403,626
Cash and cash equivalents, end of year 6,954,406$ 696,150$ 2,630,366$ 1,203,842$ 717,623$ 12,202,387$ 574,802$
Reconciliation of cash and cash equivalents to statement of net assets Cash and equivalents 5,160,150$ 696,150$ 941,448$ 1,203,842$ 717,623$ 8,719,213$ -$ Restricted cash and equivalents 1,794,256 - 1,688,918 - - 3,483,174 574,802 Cash and cash equivalents, end of year 6,954,406$ 696,150$ 2,630,366$ 1,203,842$ 717,623$ 12,202,387$ 574,802$
Statement of Cash Flows
Proprietary FundsFor the Year Ended September 30, 2011
34

Reconciliation of operating income to net cash provided (used) by operating activities Operating income (loss) 2,840,859$ 573,326$ 2,152,507$ 1,321,761$ 414,497$ 7,302,950$ 78,039$ Adjustments to reconcile net cash provided (used) by operating activities - Depreciation 383,218 164,510 745,552 807,123 128,381 2,228,784 - Provision for uncollectible accounts 74,501 3,414 13,702 14,199 4,619 110,435 - Other income (expense) 26,072 2,788 3,824 2,463 21,275 56,422 - Changes in assets and liabilities affecting cash provided by operations: (Increase) decrease in accounts receivable (383,040) 9,263 (235,259) (43,695) (13,804) (666,535) (141) (Increase) decrease in inventory (359,529) (134,015) (657,877) (4,675) - (1,156,096) - (Increase) decrease in interfund receivables (87,208) 330,791 (493) - 68,208 311,298 4,938 (Increase) decrease in intergovernmental receivables - - - - 151 151 - Increase (decrease) in interfund payables - - - 80,505 41,710 122,215 72,890 Increase (decrease) in self insurance claims liability - - - - - - (9,224) (Increase) decrease in other assets (33,638) - (1,022) (1,906) (16,536) (53,102) 24,575 Increase (decrease) in accounts payable and other current liabilities 184,923 (3,990) (192,607) 7,633 4,104 63 (315) Increase (decrease) in salaries & benefits payable (1,557) (1,610) (113) (3,577) 760 (6,097) - Increase (decrease) in compensated absences 3,267 1,965 (725) 10,046 12,055 26,608 - Increase (decrease) in postemployment benefits 27,912 7,111 12,702 2,215 934 50,874 - Increase (decrease) in consumer deposits 37,056 - - - - 37,056 - Net cash provided (used) by operating activities 2,712,836$ 953,553$ 1,840,191$ 2,192,092$ 666,354$ 8,365,026$ 170,762$
Noncash investing, capital and financing activities Purchase of capital asset with lease proceeds 1,863$ 396$ 641$ 742$ 692$ 4,334$ -$ Contribution of capital assets - - 430,921 168,878 - 599,799 -
The notes to the financial statements are an integral part of this statement.
35

This page intentionally left blank.
36


City of Brenham, Texas Notes to Basic Financial Statements
September 30, 2011
I. SUMMARY OF SIGNIFICANT ACCOUNTING PRINCIPLES A. Reporting Entity The City of Brenham is a home-rule municipality governed by an elected mayor and six-member council. The City operates under a Council-Manager form of government, established by City charter. The accompanying financial statements present the financial operations of the City as the primary government and those component units for which the primary government is considered to be financially accountable. The following discretely presented component unit is reported in a separate column in the government-wide financial statements to emphasize that it is legally separate from the primary government.
1. Discretely presented component unit
The Brenham Community Development Corporation (BCDC) is a legally separate entity from the City and is governed by a board appointed by City Council. The BCDC was formed to oversee revenues and expenditures of a special three-eighth cent sales tax for economic development and community recreational development. The City is financially accountable for the BCDC because the City’s council approves the BCDC budget and the City Manager serves as its Chief Executive Officer. For financial reporting purposes, the BCDC is reported as a governmental fund. The component unit has a single general fund which is discretely presented in the financial statements. The Corporation does not issue separate financial statements. B. Government-Wide and Fund Financial Statements The government-wide financial statements (i.e., the statement of net assets and the statement of activities) report information on all of the non-fiduciary activities of the primary government and its component units. For the most part, the effect of inter-fund activity has been removed from these statements. Governmental activities, which normally are supported by taxes and intergovernmental revenues, are reported separately from business-type activities which rely to a significant extent on fees and charges for support. Likewise, the primary government is reported separately from the legally separate BCDC component unit for which the primary government is financially accountable.
The statement of activities demonstrates the degree to which the direct expenses of a given function or segment is offset by program revenues. Direct expenses are those that are clearly identifiable with a specific function or segment. Program revenues include 1) charges to customers or applicants who purchase, use, or directly benefit from goods, services, or privileges provided by a given function or segment; and 2) grants and contributions that are restricted to meeting the operational or capital requirements of a particular function or segment. Taxes and other items not properly included among program revenues are reported instead as general revenues.
Separate financial statements are provided for governmental funds and proprietary funds. Major individual governmental funds and major individual enterprise funds are reported as separate columns with composite columns for non-major funds in the fund financial statements. C. Measurement Focus, Basis of Accounting, and Financial Statement Presentation The government-wide financial statements are reported using the economic resources measurement focus and the accrual basis of accounting, as are the proprietary fund financial statements. Revenues are recorded when earned and expenses are recorded when a liability is incurred, regardless of the timing of related cash flows. Property taxes are recognized as revenues in the year for which they are levied. Grants and similar items are recognized as revenue as soon as all eligibility requirements imposed by the provider have been met.
37

City of Brenham, Texas Notes to Basic Financial Statements
September 30, 2011
I. SUMMARY OF SIGNIFICANT ACCOUNTING PRINCIPLES (Continued) Governmental fund financial statements are reported using the current financial resources measurement focus and the modified accrual basis of accounting. Revenues are recognized as soon as they are both measurable and available. Revenues are considered to be available when they are collectible within the current period or soon enough thereafter to pay liabilities of the current period. For this purpose, the government considers revenues to be available if they are collected within 60 days of the end of the current fiscal period. Expenditures generally are recorded when a liability is incurred, as under accrual accounting. However, debt service expenditures, as well as expenditures related to compensated absences and claims and judgments, are recorded only when payment is due.
Property taxes, investment earnings and charges for services are recognized as revenue when earned. Licenses and permits, intergovernmental revenues, fines and miscellaneous items are recorded as revenue when cash is received because they are generally not measurable until actually received.
The government reports the following major governmental funds:
The General Fund is the government’s primary operating fund. It accounts for all financial resources of the general government, except those required to be accounted for in another fund.
The Debt Service Fund accounts for the resources accumulated and payments made for principal and interest on long-term debt obligations of governmental funds.
The US 290 Pass-Thru Finance Fund accounts for pass-thru toll revenue bond proceeds and payments pursuant to the Pass-Thru Agreement with Texas Department of Transportation.
The government reports the following major proprietary funds:
The Electric Fund accounts for the activities of the City’s electric distribution operations.
The Gas Fund accounts for the activities of the City’s gas distribution operations.
The Water Fund accounts for the activities of the City’s water distribution and water treatment facilities.
The Wastewater Fund accounts for the activities of the City’s wastewater treatment plant and wastewater collection systems.
The Sanitation Fund accounts for the activities of the City’s sanitation, recycling and transfer station operations.
Additionally, the government reports the following fund types: Internal Service Funds provide self-insured health insurance risk management services and a zero deductible plan for workers’ compensation to other funds of the City on a cost reimbursement basis. These funds are presented in detail in the Supplementary Information Section and in summary form as part of the proprietary fund financial statements. The financial statements of the Internal Service Funds are included in the governmental activities column when presented at the government-wide level. Private-sector standards of accounting and financial reporting issued prior to December 1, 1989, generally are followed in both the government-wide and proprietary fund financial statements to the extent that those standards do not conflict with or contradict guidance of the Governmental Accounting Standards Board. Governments also have the option of following subsequent private-sector guidance for their business-type activities and enterprise funds, subject to this same limitation. The government has elected not to follow subsequent private-sector guidance.
38

City of Brenham, Texas Notes to Basic Financial Statements
September 30, 2011
I. SUMMARY OF SIGNIFICANT ACCOUNTING PRINCIPLES (Continued) As a general rule the effect of inter-fund activity has been eliminated from the government-wide financial statements. Exceptions to this general rule are franchise tax payments and other charges between the City’s proprietary fund functions and various other functions of the government. Elimination of these charges would distort the direct costs and program revenues reported for various functions concerned. Amounts reported as program revenues include 1) charges to customers or applicants for goods, services, or privileges provided, 2) operating grants and contributions, and 3) capital grants and contributions, including special assessments. Internally dedicated resources are reported as general revenues rather than as program revenues. Likewise, general revenues include all taxes. Proprietary funds distinguish operating revenues and expenses from non-operating items. Operating revenues and expenses generally result from providing services and producing and delivering goods in connection with a proprietary fund’s principal ongoing operations. The principal operating revenues of the water, wastewater, electric, gas, and sanitation funds and of the government’s internal service fund are charges to customers for sales and services. The gas, electric, and water funds include in their operating revenue the recovery of source costs from customers. Operating expenses for enterprise funds and the internal service fund include the cost of sales and services, operating and administrative expenses, and depreciation on capital assets. All revenues and expenses not meeting this definition are reported as non-operating revenues and expenses. When both restricted and unrestricted resources are available for use, it is the government’s policy to use restricted resources first, then unrestricted resources as they are needed. D. Assets, Liabilities, and Net Assets or Equity 1. Deposits and investments The City’s cash and equivalents are considered to be cash on hand and demand deposits. State statutes authorize the government to invest in obligations of the U.S. Treasury, commercial paper, collateralized mortgage obligations, repurchase agreements, certificates of deposit and investment pools. Investments for the government, as well as the component unit, are reported at fair value. Funds are invested in a state money pool and another public investment pool. The City invests in no form of joint venture with other entities. 2. Receivables and payables Activities between funds that are representative of lending/borrowing arrangements outstanding at the end of the fiscal year are referred to as either “due to / from other funds” (i.e., the current portion of inter-fund loans) or “advances to / from other funds” (i.e., the non-current portion of inter-fund loans). All other outstanding balances between funds are reported as “due to / from other funds.” Any residual balances outstanding between the governmental activities and business-type activities are reported in the government-wide financial statements as “internal balances.” Advances between funds, as reported in the fund financial statements, are offset by a fund balance reserve account in applicable governmental funds to indicate that they are not available for appropriation and are not expendable available financial resources. Trade accounts and property taxes receivable are shown net of an allowance for uncollectibles.
39

City of Brenham, Texas Notes to Basic Financial Statements
September 30, 2011
I. SUMMARY OF SIGNIFICANT ACCOUNTING PRINCIPLES (Continued) Property taxes are levied on October 1 on property values assessed as of January 1 of each year, in conformity with Subtitle E of the Texas Property Tax Code. Taxes are due upon receipt of the bill; however, are not considered delinquent until February 1 of the following year. Delinquent uncollected taxes are included in the general fund assets and debt service fund assets with offsetting deferred revenue accounts for the amounts which will not be collected within sixty days after the end of the fiscal year. 3. Inventories and prepaid items All inventories are valued at the lower of cost or market, using the first-in/first-out (FIFO) method. Inventories are recognized as expenditures of governmental funds and as expenses in proprietary funds when used, in accordance with the consumption method of accounting. Certain payments to vendors reflect costs applicable to future accounting periods and are recorded as prepaid items in both government-wide and fund financial statements. 4. Restricted assets Certain resources are set aside for the repayment of outstanding bond debt. Unexpended resources from proceeds of bond issuances have also been set aside. These amounts are classified as restricted assets on the balance sheet because their use is limited by applicable bond covenants. 5. Capital assets Capital assets, which include property, plant, equipment, and infrastructure assets (e.g., roads, bridges, sidewalks, and similar items), are reported in the applicable governmental or business-type activities columns in the government-wide financial statements. Infrastructure is defined by the government as long-lived and stationary in nature and includes streets, curbs, gutters, drainage systems, airport runways and taxiways, utility lines and utility plants. Infrastructure assets include all new construction with an estimated useful life of 20 - 50 years. Capital assets, other than infrastructure assets, are defined by the government as assets with an initial, individual cost of more than $15,000 (amount not rounded) and an estimated useful life in excess of one year. Such assets are recorded at historical cost or estimated historical cost if purchased or constructed. Donated capital assets are recorded at estimated fair market value at the date of donation. In the case of initial capitalization of general infrastructure assets (i.e., those reported by governmental activities) the government chose to include all such items regardless of their acquisition date or amount. The government was able to estimate the historical cost for the initial reporting of these assets through back trending (i.e., estimating the current replacement cost of the infrastructure to be capitalized and using an appropriate price-level index to deflate the cost to the acquisition year or estimated acquisition year). As the government constructs or acquires additional capital assets each period, including infrastructure assets, they are capitalized and reported at historical cost.
40

City of Brenham, Texas Notes to Basic Financial Statements
September 30, 2011
I. SUMMARY OF SIGNIFICANT ACCOUNTING PRINCIPLES (Continued) The costs of normal maintenance and repairs that do not add to the value of the asset or materially extend assets lives are not capitalized. Major outlays for capital assets and improvements are capitalized as projects are constructed. Property, plant, and equipment of the primary government, as well as the component units, are depreciated using the straight line method over the following estimated useful lives:
Assets Years Buildings (New structure) 40 Buildings (Used structure) 20 Building improvements 7-20 Improvements Other than Buildings 10-20 Machinery and Equipment 5-10 Vehicles 5-20 Infrastructure 20-50
6. Compensated absences City employees are entitled to certain compensated absences based on their length of employment in accordance with official policy adopted by the City council. Vacation pay is accrued when incurred in the government-wide and proprietary fund financial statements. The liability for these amounts is recorded as a liability of the funds. There is no liability for unpaid accumulated sick leave since the City does not pay any amounts when employees separate from service. 7. Long-term obligations In the government-wide financial statements, and proprietary fund types in the fund financial statements, long-term debt and other long-term obligations are reported as liabilities in the applicable governmental activities, business-type activities, or proprietary fund type statement of net assets. Bond premiums and discounts, as well as issuance costs, are deferred and amortized over the life of the bonds using the effective interest method. Bonds payable are reported net of the applicable bond premium or discount. Bond issuance costs are reported as deferred charges and amortized over the term of the related debt. In the fund financial statements, governmental fund types recognize bond premiums and discounts, as well as bond issuance costs, during the current period. The face amount of debt issued is reported as other financing sources. Premiums received on debt issuances are reported as other financing sources while discounts on debt issuances are reported as other financing uses. Issuance costs, whether or not withheld from the actual debt proceeds received, are reported as debt service expenditures. 8. Fund equity Fund balance for governmental funds is reported in classifications (nonspendable, restricted, committed, assigned, and unassigned) that comprise a hierarchy based primarily on the extent to which the government is bound to honor constraints on the specific purposes for which amounts in those funds can be spent.
41

City of Brenham, Texas Notes to Basic Financial Statements
September 30, 2011
I. SUMMARY OF SIGNIFICANT ACCOUNTING PRINCIPLES (Continued) 9. Post closure care cost The City's Sanitation Enterprise Fund adopted Governmental Accounting Standards Board (GASB) Statement No. 18, "Accounting for Municipal Solid Waste Landfill Closure and Post Closure Costs" as of October 1, 1993. This statement requires that closure and post closure care costs that are incurred on or after the landfill stops accepting waste be recognized as expense during the period that waste is accepted. The City stopped accepting waste at its landfill in November, 1990. State and federal laws and regulations require the City to place a final cover on the site and perform maintenance and monitoring functions at the site for five years after closure. In 2009, TCEQ inspected the facility and determined that all post-closure care maintenance requirements had been satisfied and the site has completed the post-closure care maintenance period. The City operates a waste transfer station for which it has demonstrated financial assurance of $63,593 by meeting the financial assurance test. Estimated closure cost is $15,000. 10. Post-employment benefits The City provides the availability of post-retirement health care for certain retirees. Retirees and covered spouses whose sum of age and years of service was equal to or greater than 75 at the time of retirement may purchase group health until they and their covered spouses reach Medicare eligibility. Currently, 9 retirees/covered spouses meet those eligibility requirements and have elected to receive this benefit. The retiree/covered spouse pays the entire premium for group health coverage and claims are paid through the self-insured medical fund. Employees who terminate employment because of a disability may qualify for life insurance and long term disability benefits until reaching age 65 or the end of the disability eligibility, whichever comes first. Premiums for those qualifying are waived and there is no further cost to the City or the former employee. Currently, one qualifies for the long term disability benefit. 11. Implementation of New Pronouncements In this fiscal year, the City adopted GASB Statement No. 54, “Fund Balance, Reporting and Governmental Fund Type Definitions.” II. STEWARDSHIP, COMPLIANCE, AND ACCOUNTABILITY A. Budgetary Information The budget process of the City complies with the Texas Uniform Budget Law. Annual operating budgets are adopted each fiscal year through passage of an annual budget ordinance. The City Manager, as chief executive officer, has ultimate responsibility for the budget. The City Manager formulates the budget goals for the City under the direction of the City Council. The departmental budget is the basic unit of measurement for the City's budget. Six director positions report to the City Manager and oversee the individual departmental budgets within their area of responsibility. These positions include the Director of Public Works, Director of Public Utilities, Chief Financial Officer, Director of Community Services, Chief of Police and Fire Chief.
42
City of Brenham, Texas Notes to Basic Financial Statements
September 30, 2011
II. STEWARDSHIP, COMPLIANCE, AND ACCOUNTABILITY (Continued) 1. Basis of accounting With the exception of the General Fund, all budgets are prepared and adopted on a basis consistent with generally accepted accounting principles of accounting which is the same basis used for financial reporting in these financial statements. See Note 1 under the Required Supplementary Information section regarding the General Fund basis of accounting. 2. Budgeted funds Annual appropriated budgets are adopted for all governmental fund types except for certain major capital improvements that are set up as capital projects funds. Annual budgets are not adopted because these projects span more than one fiscal year. For the year ended September 30, 2011, annual appropriated budgets were adopted by passage of a budget ordinance for the General Fund, Electric Fund, Gas Fund, Water Fund, Wastewater Fund, Sanitation Fund, Debt Service Fund and the US 290 Pass-Thru Finance Fund. Non major governmental funds for which budgets were adopted include the Hotel/Motel Tax, Washington County Hotel/Motel Tax, PD Criminal Law Enforcement Fund, Courts Technology/Security and Parks Capital Improvements Fund. Internal Service funds with budgets adopted include the Self-Insured Health Insurance and Workers’ Compensation funds. All annual budget appropriations lapse at the end of the fiscal year. The by-laws of the Brenham Community Development Corporation require that an annual budget be prepared by the corporation's board and approved by City Council. 3. Legal level of control The City Manager is authorized to transfer budgeted amounts between line items and departments within any fund. Any revisions that alter the total expenditures of any fund must be approved by the City Council. The legal level of budgetary control (the level at which expenditures may not legally exceed appropriations) is the fund level. 4. Budget amendments The budget is originally enacted by ordinance; therefore, any amendments to the budget must also be made by ordinance. The initial step in amending the budget is to present the proposed amendments and the justification thereof during a City Council meeting. The proposed ordinance amending the budget is presented for approval during a formal session at two subsequent meetings of the Council. 5. Encumbrances Encumbrance accounting is a system under which purchase orders, contracts, and other commitments for the expenditure of funds are recorded in order to reserve that portion of the applicable appropriation. Encumbrances are reported as reservations of fund balances since they do not constitute expenditures or liabilities. The City does not employ encumbrance accounting as it feels its current system is adequate to assure effective budgetary control and accountability and to facilitate effective cash planning and control.
43
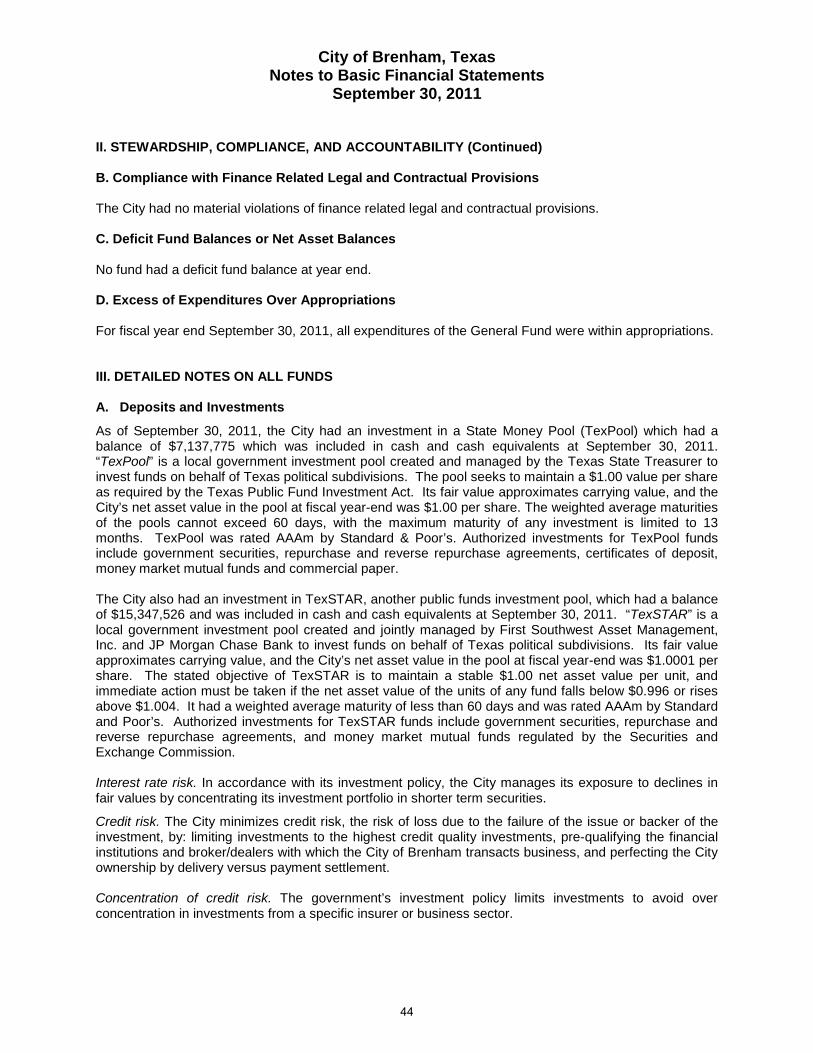
City of Brenham, Texas Notes to Basic Financial Statements
September 30, 2011
II. STEWARDSHIP, COMPLIANCE, AND ACCOUNTABILITY (Continued) B. Compliance with Finance Related Legal and Contractual Provisions The City had no material violations of finance related legal and contractual provisions. C. Deficit Fund Balances or Net Asset Balances No fund had a deficit fund balance at year end. D. Excess of Expenditures Over Appropriations For fiscal year end September 30, 2011, all expenditures of the General Fund were within appropriations. III. DETAILED NOTES ON ALL FUNDS A. Deposits and Investments
As of September 30, 2011, the City had an investment in a State Money Pool (TexPool) which had a balance of $7,137,775 which was included in cash and cash equivalents at September 30, 2011. “TexPool” is a local government investment pool created and managed by the Texas State Treasurer to invest funds on behalf of Texas political subdivisions. The pool seeks to maintain a $1.00 value per share as required by the Texas Public Fund Investment Act. Its fair value approximates carrying value, and the City’s net asset value in the pool at fiscal year-end was $1.00 per share. The weighted average maturities of the pools cannot exceed 60 days, with the maximum maturity of any investment is limited to 13 months. TexPool was rated AAAm by Standard & Poor’s. Authorized investments for TexPool funds include government securities, repurchase and reverse repurchase agreements, certificates of deposit, money market mutual funds and commercial paper. The City also had an investment in TexSTAR, another public funds investment pool, which had a balance of $15,347,526 and was included in cash and cash equivalents at September 30, 2011. “TexSTAR” is a local government investment pool created and jointly managed by First Southwest Asset Management, Inc. and JP Morgan Chase Bank to invest funds on behalf of Texas political subdivisions. Its fair value approximates carrying value, and the City’s net asset value in the pool at fiscal year-end was $1.0001 per share. The stated objective of TexSTAR is to maintain a stable $1.00 net asset value per unit, and immediate action must be taken if the net asset value of the units of any fund falls below $0.996 or rises above $1.004. It had a weighted average maturity of less than 60 days and was rated AAAm by Standard and Poor’s. Authorized investments for TexSTAR funds include government securities, repurchase and reverse repurchase agreements, and money market mutual funds regulated by the Securities and Exchange Commission. Interest rate risk. In accordance with its investment policy, the City manages its exposure to declines in fair values by concentrating its investment portfolio in shorter term securities.
Credit risk. The City minimizes credit risk, the risk of loss due to the failure of the issue or backer of the investment, by: limiting investments to the highest credit quality investments, pre-qualifying the financial institutions and broker/dealers with which the City of Brenham transacts business, and perfecting the City ownership by delivery versus payment settlement. Concentration of credit risk. The government’s investment policy limits investments to avoid over concentration in investments from a specific insurer or business sector.
44

City of Brenham, Texas Notes to Basic Financial Statements
September 30, 2011
III. DETAILED NOTES ON ALL FUNDS (Continued) Custodial credit risk – deposits. In the case of deposits, this is the risk that in the event of a bank failure, the government’s deposits may not be returned to it. It’s the policy of the City to require full collateralization of all City funds on deposit with a depository bank. At year end, the government's carrying amount of deposits for the primary government and BCDC component unit was $1,216,325 and the bank balances totaled $1,785,601. Of the bank balances, $250,000 was covered by federal depository insurance and $900,833 was collateralized with securities held by the pledging financial institution’s trust department or agent in the government’s name. The remaining $634,768 was being held at JP Morgan Chase Bank in an overnight investment sweep account. These funds, although not FDIC insured or collateralized with securities held by the pledging financial institution’s trust department or agent in the government’s name, were invested in a low risk U.S Treasury plus Money Market Fund. The primary investments of this fund are direct obligations of the U.S. Treasury including Treasury bills, bonds and other obligations issued or guaranteed by the U.S. Treasury and repurchase agreements collateralized by such obligations. B. Receivables - Account Accounts receivable as of year-end for the government's individual major funds and non-major, and proprietary funds in the aggregate, including the applicable allowances for uncollectible accounts, are as follows:
General Fund
Accounts 230,545$ Assessments 135,691
366,236 Less Allowance for Uncollectibles (4,000) Accounts Receivable, Net 362,236$
Electric Fund Gas Fund Water FundWastewater
FundSanitation
Fund TotalAccounts 3,495,395$ 239,729$ 804,087$ 490,526$ 244,568$ 5,274,305$ Less Allowance for Uncollectibles (60,000) (5,000) (12,000) (13,000) (6,000) (96,000) Accounts Receivable, Net 3,435,395$ 234,729$ 792,087$ 477,526$ 238,568$ 5,178,305$
Proprietary Funds
45

City of Brenham, Texas Notes to Basic Financial Statements
September 30, 2011
III. DETAILED NOTES ON ALL FUNDS (Continued) Governmental funds report deferred revenue in connection with receivables for revenues that are not considered to be available to liquidate liabilities of the current period. Governmental funds also defer revenue recognition in connection with resources that have been received, but not yet earned. At the end of the current fiscal year, the various components of deferred revenue and unearned revenue reported in the governmental funds were as follows: Components Unavailable Unearned TotalDelinquent property taxes receivable (General Fund) 129,581$ -$ 129,581$ Delinquent property taxes receivable (Debt Service Fund) 61,638 - 61,638 Franchise fees receivable 177,897 - 177,897 Lien assessments and pending seizures 130,296 - 130,296 Total deferred/unearned revenue for governmental funds 499,412$ -$ 499,412$
Balances not expected to be collected within one year 130,296$ -$ 130,296$ C. Receivables – Property Taxes The following information relates to property taxes receivable for the year ended September 30, 2011:
Original Certified Tax Roll 975,919,507$ Approved Rate (Per $100 Valuation) 0.5042
Original Levy 4,920,586 Supplements 7,663 Adjusted Levy 4,928,249$
Collections on Current Tax Roll 4,840,737 Total Collections/Refunds/Adjustments 4,914,041 Property Taxes Receivable 191,219$
D. Notes Receivable Notes receivable at September 30, 2011 consisted of the following: Business-type Activities - Electric Fund
Note receivable from component unit Brenham Community Development Corporation, in a sum not to exceed $2,500,000; payable on demand or at the expiration of one year, whichever is later; interest payable monthly at 5.5%; unsecured 419,933$
Note receivable from component unit Brenham Community Development Corporation, prinicipal amount $1,000,000; Interest payable at 4.750% with the first payment due September 30, 2017; maturing September 2029, unsecured 1,000,000
1,419,933$
Less Current Portion (51,394)
1,368,539$
46
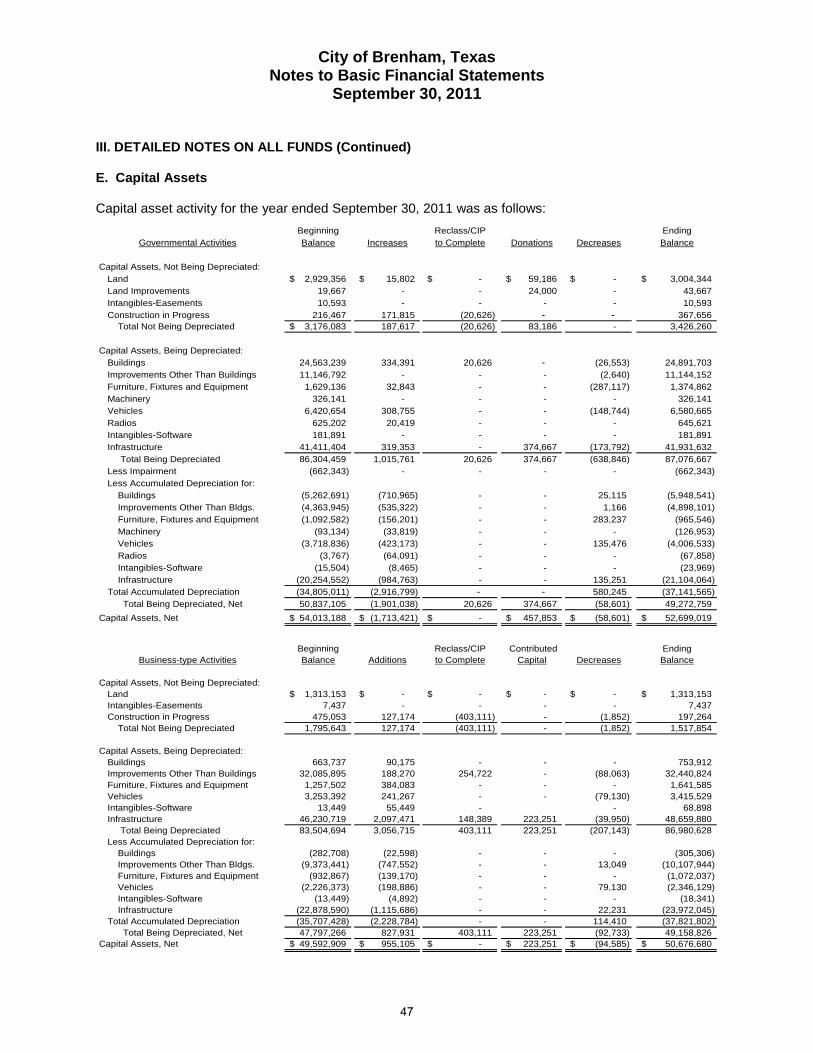
City of Brenham, Texas Notes to Basic Financial Statements
September 30, 2011
III. DETAILED NOTES ON ALL FUNDS (Continued) E. Capital Assets Capital asset activity for the year ended September 30, 2011 was as follows:
Beginning Reclass/CIP EndingBalance Increases to Complete Donations Decreases Balance
Capital Assets, Not Being Depreciated:Land 2,929,356$ 15,802$ -$ 59,186$ -$ 3,004,344$ Land Improvements 19,667 - - 24,000 - 43,667 Intangibles-Easements 10,593 - - - - 10,593 Construction in Progress 216,467 171,815 (20,626) - - 367,656 Total Not Being Depreciated 3,176,083$ 187,617 (20,626) 83,186 - 3,426,260
Capital Assets, Being Depreciated:Buildings 24,563,239 334,391 20,626 - (26,553) 24,891,703Improvements Other Than Buildings 11,146,792 - - - (2,640) 11,144,152Furniture, Fixtures and Equipment 1,629,136 32,843 - - (287,117) 1,374,862Machinery 326,141 - - - - 326,141Vehicles 6,420,654 308,755 - - (148,744) 6,580,665Radios 625,202 20,419 - - - 645,621Intangibles-Software 181,891 - - - - 181,891Infrastructure 41,411,404 319,353 - 374,667 (173,792) 41,931,632 Total Being Depreciated 86,304,459 1,015,761 20,626 374,667 (638,846) 87,076,667Less Impairment (662,343) - - - - (662,343)Less Accumulated Depreciation for: Buildings (5,262,691) (710,965) - - 25,115 (5,948,541) Improvements Other Than Bldgs. (4,363,945) (535,322) - - 1,166 (4,898,101) Furniture, Fixtures and Equipment (1,092,582) (156,201) - - 283,237 (965,546) Machinery (93,134) (33,819) - - - (126,953) Vehicles (3,718,836) (423,173) - - 135,476 (4,006,533) Radios (3,767) (64,091) - - - (67,858) Intangibles-Software (15,504) (8,465) - - - (23,969) Infrastructure (20,254,552) (984,763) - - 135,251 (21,104,064)Total Accumulated Depreciation (34,805,011) (2,916,799) - - 580,245 (37,141,565) Total Being Depreciated, Net 50,837,105 (1,901,038) 20,626 374,667 (58,601) 49,272,759
Capital Assets, Net 54,013,188$ (1,713,421)$ -$ 457,853$ (58,601)$ 52,699,019$
Beginning Reclass/CIP Contributed EndingBalance Additions to Complete Capital Decreases Balance
Capital Assets, Not Being Depreciated:Land 1,313,153$ -$ -$ -$ -$ 1,313,153$ Intangibles-Easements 7,437 - - - - 7,437Construction in Progress 475,053 127,174 (403,111) - (1,852) 197,264 Total Not Being Depreciated 1,795,643 127,174 (403,111) - (1,852) 1,517,854
Capital Assets, Being Depreciated:Buildings 663,737 90,175 - - - 753,912Improvements Other Than Buildings 32,085,895 188,270 254,722 - (88,063) 32,440,824Furniture, Fixtures and Equipment 1,257,502 384,083 - - - 1,641,585Vehicles 3,253,392 241,267 - - (79,130) 3,415,529Intangibles-Software 13,449 55,449 - - 68,898Infrastructure 46,230,719 2,097,471 148,389 223,251 (39,950) 48,659,880 Total Being Depreciated 83,504,694 3,056,715 403,111 223,251 (207,143) 86,980,628Less Accumulated Depreciation for: Buildings (282,708) (22,598) - - - (305,306) Improvements Other Than Bldgs. (9,373,441) (747,552) - - 13,049 (10,107,944) Furniture, Fixtures and Equipment (932,867) (139,170) - - - (1,072,037) Vehicles (2,226,373) (198,886) - - 79,130 (2,346,129) Intangibles-Software (13,449) (4,892) - - - (18,341) Infrastructure (22,878,590) (1,115,686) - - 22,231 (23,972,045)Total Accumulated Depreciation (35,707,428) (2,228,784) - - 114,410 (37,821,802) Total Being Depreciated, Net 47,797,266 827,931 403,111 223,251 (92,733) 49,158,826
Capital Assets, Net 49,592,909$ 955,105$ -$ 223,251$ (94,585)$ 50,676,680$
Governmental Activities
Business-type Activities
47
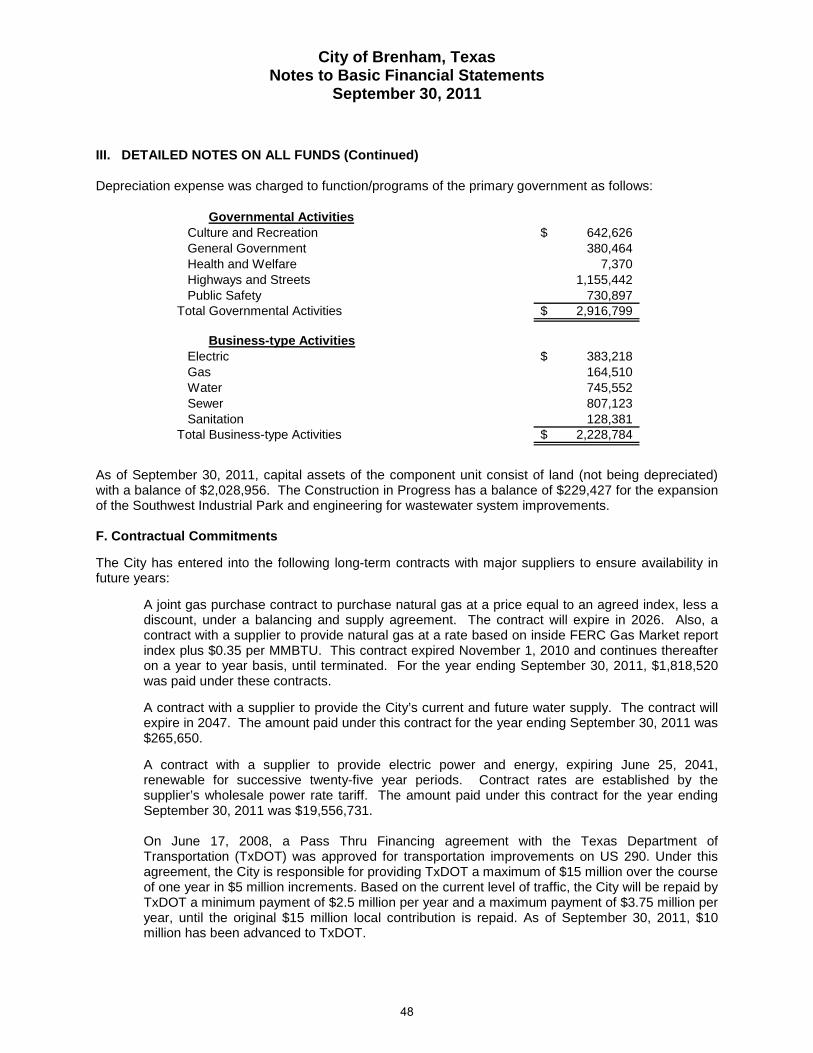
City of Brenham, Texas Notes to Basic Financial Statements
September 30, 2011
III. DETAILED NOTES ON ALL FUNDS (Continued) Depreciation expense was charged to function/programs of the primary government as follows:
Culture and Recreation 642,626$ General Government 380,464 Health and Welfare 7,370 Highways and Streets 1,155,442 Public Safety 730,897
Total Governmental Activities 2,916,799$
Electric 383,218$ Gas 164,510 Water 745,552 Sewer 807,123 Sanitation 128,381
Total Business-type Activities 2,228,784$
Governmental Activities
Business-type Activities
As of September 30, 2011, capital assets of the component unit consist of land (not being depreciated) with a balance of $2,028,956. The Construction in Progress has a balance of $229,427 for the expansion of the Southwest Industrial Park and engineering for wastewater system improvements. F. Contractual Commitments
The City has entered into the following long-term contracts with major suppliers to ensure availability in future years:
A joint gas purchase contract to purchase natural gas at a price equal to an agreed index, less a discount, under a balancing and supply agreement. The contract will expire in 2026. Also, a contract with a supplier to provide natural gas at a rate based on inside FERC Gas Market report index plus $0.35 per MMBTU. This contract expired November 1, 2010 and continues thereafter on a year to year basis, until terminated. For the year ending September 30, 2011, $1,818,520 was paid under these contracts.
A contract with a supplier to provide the City’s current and future water supply. The contract will expire in 2047. The amount paid under this contract for the year ending September 30, 2011 was $265,650.
A contract with a supplier to provide electric power and energy, expiring June 25, 2041, renewable for successive twenty-five year periods. Contract rates are established by the supplier’s wholesale power rate tariff. The amount paid under this contract for the year ending September 30, 2011 was $19,556,731. On June 17, 2008, a Pass Thru Financing agreement with the Texas Department of Transportation (TxDOT) was approved for transportation improvements on US 290. Under this agreement, the City is responsible for providing TxDOT a maximum of $15 million over the course of one year in $5 million increments. Based on the current level of traffic, the City will be repaid by TxDOT a minimum payment of $2.5 million per year and a maximum payment of $3.75 million per year, until the original $15 million local contribution is repaid. As of September 30, 2011, $10 million has been advanced to TxDOT.
48
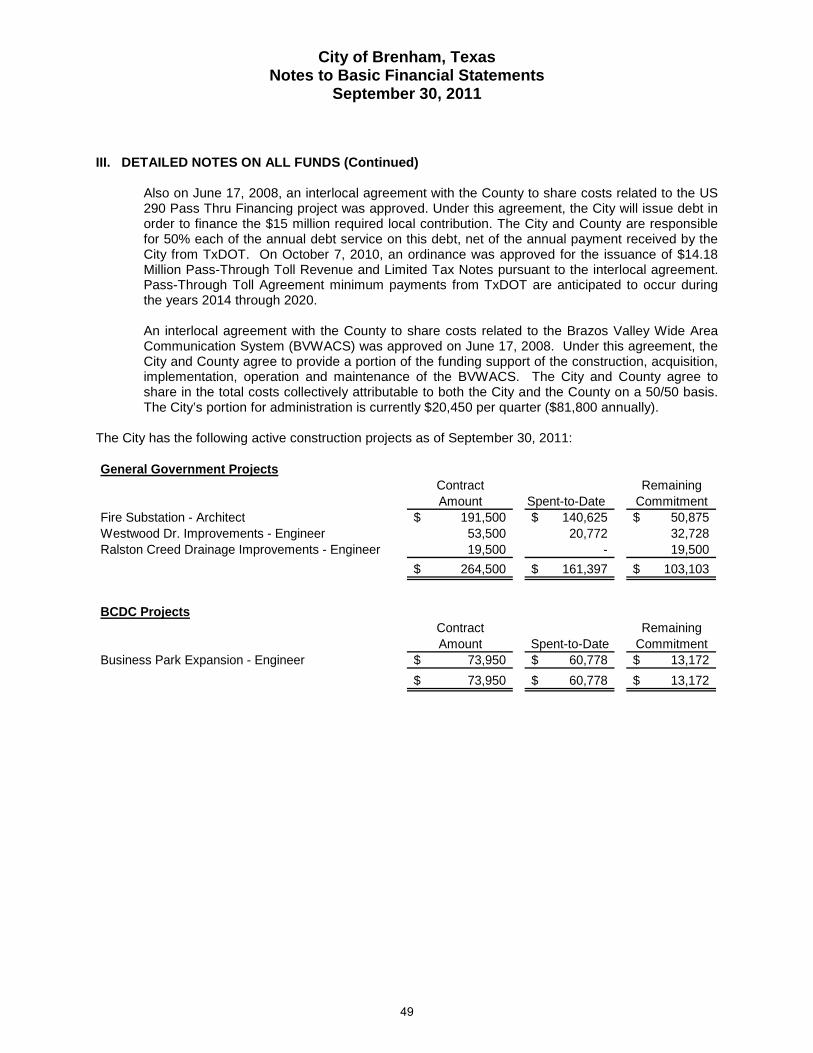
City of Brenham, Texas Notes to Basic Financial Statements
September 30, 2011
III. DETAILED NOTES ON ALL FUNDS (Continued) Also on June 17, 2008, an interlocal agreement with the County to share costs related to the US 290 Pass Thru Financing project was approved. Under this agreement, the City will issue debt in order to finance the $15 million required local contribution. The City and County are responsible for 50% each of the annual debt service on this debt, net of the annual payment received by the City from TxDOT. On October 7, 2010, an ordinance was approved for the issuance of $14.18 Million Pass-Through Toll Revenue and Limited Tax Notes pursuant to the interlocal agreement. Pass-Through Toll Agreement minimum payments from TxDOT are anticipated to occur during the years 2014 through 2020. An interlocal agreement with the County to share costs related to the Brazos Valley Wide Area Communication System (BVWACS) was approved on June 17, 2008. Under this agreement, the City and County agree to provide a portion of the funding support of the construction, acquisition, implementation, operation and maintenance of the BVWACS. The City and County agree to share in the total costs collectively attributable to both the City and the County on a 50/50 basis. The City’s portion for administration is currently $20,450 per quarter ($81,800 annually).
The City has the following active construction projects as of September 30, 2011: General Government Projects
Contract RemainingAmount Spent-to-Date Commitment
Fire Substation - Architect 191,500$ 140,625$ 50,875$ Westwood Dr. Improvements - Engineer 53,500 20,772 32,728 Ralston Creed Drainage Improvements - Engineer 19,500 - 19,500
264,500$ 161,397$ 103,103$
BCDC ProjectsContract RemainingAmount Spent-to-Date Commitment
Business Park Expansion - Engineer 73,950$ 60,778$ 13,172$ 73,950$ 60,778$ 13,172$
49

City of Brenham, Texas Notes to Basic Financial Statements
September 30, 2011
III. DETAILED NOTES ON ALL FUNDS (Continued) G. Interfund Receivables, Payables, and Transfers
Interfund receivables and payables represent money that is transferred among the various funds for cash flow purposes throughout the year. At September 30, 2011 the balances were as follows:
Receivable Fund Payable Fund Amount
Electric Fund General Fund 373,308$
Water Fund Sewer Fund 181,784$ Sanitation Fund 41,710
223,494$
General Fund Internal Service Fund 183,368$
Other Governmental Fund Hwy 290 Pass Thru Fund 63,657$ The government-wide statement of activities eliminates transfers as reported within the segregated governmental and business-type activities columns. Only transfers between the two columns appear in this statement as internal balances. Amounts transferred on the fund basis include debt service payments, City matching revenues for grants reported as capital projects and investment income. The following schedule shows transfers and payments within the reporting entity as of September 30, 2011: Transfers From: Transfers To:
Governmental Activities
Business Type
ActivitiesNet Transfers
FromDebt Other Internal
General Service Govt'l Service ElectricGovernmental ActivitiesMajor Funds Hwy 290 Pass Through - 67,679 - - - 67,679 Other Gov'tl Funds 72,732 78,006 - - - 150,738 Internal Service - - - 115,092 - 115,092
Business-type ActivitiesMajor Funds Electric 1,622,465 - - - - 1,622,465 Gas 335,057 - - - 142,306 477,363 Water 310,011 - - - 155,365 465,376 Wastewater 316,377 - - - 154,561 470,938 Sanitation 289,043 - - - 63,890 352,933
Total Transfers To 2,945,685$ 145,685$ -$ 115,092$ 516,122$ 3,722,584$
50
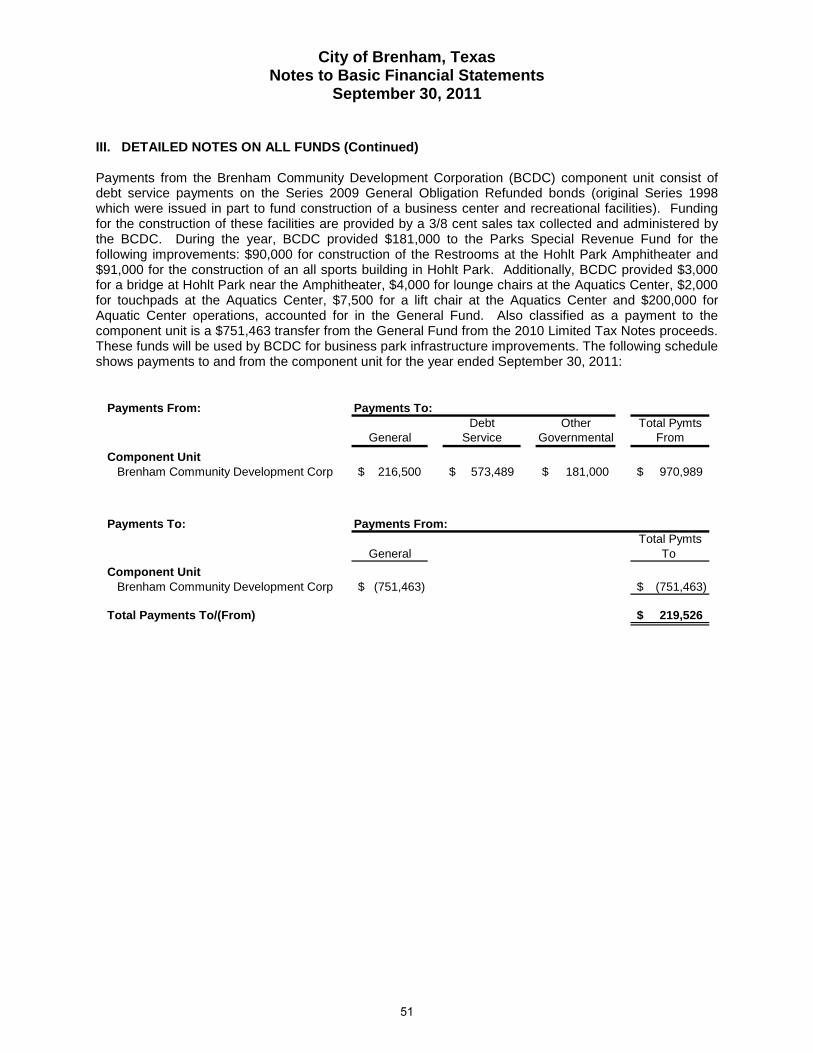
City of Brenham, Texas Notes to Basic Financial Statements
September 30, 2011
III. DETAILED NOTES ON ALL FUNDS (Continued) Payments from the Brenham Community Development Corporation (BCDC) component unit consist of debt service payments on the Series 2009 General Obligation Refunded bonds (original Series 1998 which were issued in part to fund construction of a business center and recreational facilities). Funding for the construction of these facilities are provided by a 3/8 cent sales tax collected and administered by the BCDC. During the year, BCDC provided $181,000 to the Parks Special Revenue Fund for the following improvements: $90,000 for construction of the Restrooms at the Hohlt Park Amphitheater and $91,000 for the construction of an all sports building in Hohlt Park. Additionally, BCDC provided $3,000 for a bridge at Hohlt Park near the Amphitheater, $4,000 for lounge chairs at the Aquatics Center, $2,000 for touchpads at the Aquatics Center, $7,500 for a lift chair at the Aquatics Center and $200,000 for Aquatic Center operations, accounted for in the General Fund. Also classified as a payment to the component unit is a $751,463 transfer from the General Fund from the 2010 Limited Tax Notes proceeds. These funds will be used by BCDC for business park infrastructure improvements. The following schedule shows payments to and from the component unit for the year ended September 30, 2011:
Payments From: Payments To:Debt Other Total Pymts
General Service Governmental FromComponent Unit Brenham Community Development Corp 216,500$ 573,489$ 181,000$ 970,989$
Payments To: Payments From:Total Pymts
General To Component Unit Brenham Community Development Corp (751,463)$ (751,463)$
Total Payments To/(From) 219,526$
51

City of Brenham, Texas Notes to Basic Financial Statements
September 30, 2011
III. DETAILED NOTES ON ALL FUNDS (Continued) H. Long-Term Debt
The following is a summary of long-term debt transactions of the City for the year ended September 30, 2011:
Balance FY11 Balance Due Within
9/30/2010 Refunding Additions Retirements 9/30/2011 One Year Long TermGovernmental Activities
2001 COB - Gen 1,155,755$ (962,151)$ -$ (193,604)$ -$ -$ -$ 2002 COB - Gen 2,207,090 (1,796,840) - (131,665) 278,585 136,312 142,273 2006 COB - Gen 8,045,000 - - (375,000) 7,670,000 385,000 7,285,000 2007 GOB Ref - Gen 1,491,332 - - (6,872) 1,484,460 6,873 1,477,587 2009 GOB Ref - Gen 5,414,770 - - (477,431) 4,937,339 491,695 4,445,644 2010 PTT-Hwy 290 - Gen - - 14,180,000 (15,000) 14,165,000 - 14,165,000 2010 Ltd Tax Notes - Gen - - 760,000 (105,000) 655,000 105,000 550,000 2010 GOB Ref - Gen - 989,640 - (23,366) 966,274 202,052 764,222 2011 GOB Ref - Gen - 2,021,320 - (26,125) 1,995,195 56,557 1,938,638
18,313,947 251,969 14,940,000 (1,354,063) 32,151,853 1,383,489 30,768,364
Unamort Bond Premium 184,463 (16,508) 1,207,258 (148,338) 1,226,875 NA 1,226,875 Unamort Bond Discount (4,596) 3,512 - 142 (942) NA (942) Ref Deferred Charges - '07 Ref COB (55,309) - - 4,707 (50,602) NA (50,602) Ref Deferred Charges - '09 Ref GOB (147,925) - - 18,590 (129,335) NA (129,335) Ref Deferred Charges - '10 Ref GOB - - (40,653) 3,790 (36,863) NA (36,863) Ref Deferred Charges - '11 Ref GOB - - (235,816) 7,219 (228,597) NA (228,597)
18,290,580 238,973 15,870,789 (1,467,953) 32,932,389 1,383,489 31,548,900
Chase Equip Lease 67,761 - - (67,761) - - - Chase New World Lease 88,959 - - (88,959) - - - Chase '08 Vehicle/Equip Lease 54,013 - - (26,441) 27,572 27,572 - Chase '09 Vehicle Lease 45,194 - - (45,194) - - - Chase BVWACS Radio Lease 610,656 - - (85,897) 524,759 88,775 435,984
866,583 - - (314,252) 552,331 116,347 435,984
Compensated Absences (1) 307,722 - 296,615 (281,484) 322,853 148,308 174,545
Total Governmental 19,464,885$ 238,973$ 16,167,404$ (2,063,689)$ 33,807,573$ 1,648,144$ 32,159,429$
(1) The General Fund is used to liquidate the liability for compensated absences.
52

City of Brenham, Texas Notes to Basic Financial Statements
September 30, 2011
III. DETAILED NOTES ON ALL FUNDS (Continued)
Balance FY11 Balance Due Within9/30/2010 Refunding Additions Retirements 9/30/2011 One Year Long Term
Business Type Activities
2001 COB - Water Impr 900,016$ (761,250)$ -$ (138,766)$ -$ -$ -$ 2001 GOB Ref (Water) 1,895,000 (1,445,000) - (450,000) - - - 2001 COB - Wastewater Impr 2,119,230 (1,776,600) - (342,630) - - - 2002 COB -Wastewater Impr 4,917,910 (4,003,160) - (293,335) 621,415 303,688 317,727 2007 GOB Ref - Water 1,179,937 - - (5,437) 1,174,500 5,438 1,169,062 2007 GOB Ref - Wastewater 2,753,730 - - (12,690) 2,741,040 12,690 2,728,350 2008 COB - Water 5,955,000 - - (40,000) 5,915,000 40,000 5,875,000 2009 GOB Ref - Water 880,448 - - (17,268) 863,180 17,489 845,691 2009 GOB Ref - Wastewater 2,054,782 - - (40,300) 2,014,482 40,816 1,973,666 2010 GOB Ref - Water - 783,000 - (18,488) 764,512 159,863 604,649 2010 GOB Ref - Wastewater - 1,827,360 - (43,146) 1,784,214 373,086 1,411,128 2011 GOB Ref - Water - 1,205,403 - (20,675) 1,184,728 377,440 807,288 2011 GOB Ref - Wastewater - 4,503,277 - (58,202) 4,445,075 126,003 4,319,072
22,656,053 333,030 - (1,480,937) 21,508,146 1,456,513 20,051,633
Unamort Bond Discount-Wastewater (9,332) 7,825 - 289 (1,218) NA (1,218) Unamort Bond Premium-Water 40,765 (13,061) 37,087 (8,732) 56,059 NA 56,059 Unamort Bond Premium-Wastewater 95,142 (30,483) 95,749 (20,657) 139,751 NA 139,751 07 Ref Deferred Chrg-Water (43,760) - - 3,724 (40,036) NA (40,036) 07 Ref Deferred Chrg-Wastewater (102,126) - - 8,692 (93,434) NA (93,434) 01 Ref Deferred Chrg-Water (106,317) 81,067 - 25,250 - NA - 09 Ref Deffered Chrg-Water (90,553) - - 11,378 (79,175) NA (79,175) 09 Ref Deffered Chrg-Wastewater (211,335) - - 26,554 (184,781) NA (184,781) 10 Ref Deferred Chrg-Water - - (32,164) 2,998 (29,166) NA (29,166) 10 Ref Deferred Chrg-Waterwater - - (75,065) 6,998 (68,067) NA (68,067) 11 Ref Deferred Chrg-Water - - 152,305 (4,662) 147,643 NA 147,643 11 Ref Deferred Chrg-Waterwater - - (525,373) 16,082 (509,291) NA (509,291) Sub Total Bonds Payable 22,228,537 378,378 (347,461) (1,413,023) 20,846,431 19,389,918
Compensated Absences 145,510 165,493 (157,838) 153,165 82,737 70,428 Chase Equip Lease - 5 Ton Haul Truck-Sanit 11,968 - (11,968) - - - Chase '08 Vehicle/Equip Lease - Gas 15,366 - (7,522) 7,844 7,844 - Chase '08 Vehicle/Equip Lease - Sanitation 134,820 - (65,998) 68,822 68,822 - Chase BVWACS Radio Lease-Electric 55,720 - (7,838) 47,882 8,100 39,782 Chase BVWACS Radio Lease-Gas 11,847 - (1,666) 10,181 1,723 8,458 Chase BVWACS Radio Lease-Water 19,174 - (2,697) 16,477 2,787 13,690 Chase BVWACS Radio Lease-Wastewater 22,187 - (3,121) 19,066 3,226 15,840 Chase BVWACS Radio Lease-Sanitation 20,681 - (2,909) 17,772 3,006 14,766 Total Proprietary 22,665,810$ 378,378$ (181,968)$ (1,674,580)$ 21,187,640$ 1,634,758$ 19,552,882$
Component Unit Governmental Activities
Note Payable-BCDC to City Elec Fund 468,826$ (48,893)$ 419,933$ 51,394$ 368,539$ Note Payable-BCDC to City Elec Fund-FY10 1,000,000 - - 1,000,000 - 1,000,000
Total Governmental - BCDC 1,468,826$ -$ (48,893)$ 1,419,933$ 51,394$ 1,368,539$
The annual debt service requirement to maturity for all outstanding debt as of September 30, 2011 follows:
FISCALYEAR CERTIFICATES OF OBLIGATION
ENDING9/30 PRINCIPAL INTEREST PRINCIPAL INTEREST PRINCIPAL INTEREST PRINCIPAL INTEREST PRINCIPAL INTEREST
2012 1,870,000 775,160 105,000 14,506 - 554,650 865,000 610,886 2,840,000 1,955,202 2013 1,925,000 737,362 105,000 12,406 - 554,650 900,000 576,316 2,930,000 1,880,734 2014 2,440,000 692,616 110,000 10,306 1,195,000 554,650 480,000 540,931 4,225,000 1,798,503 2015 2,355,000 637,469 110,000 8,106 2,480,000 518,800 550,000 521,590 5,495,000 1,685,965 2016 2,425,000 563,146 110,000 5,631 2,575,000 419,600 580,000 498,569 5,690,000 1,486,946
2017-2021 12,000,000 1,505,327 115,000 3,019 7,915,000 623,800 3,575,000 2,098,727 23,605,000 4,230,873 2022-2026 1,340,000 62,300 - - - - 6,180,000 1,145,611 7,520,000 1,207,911 2027-2028 - - - - - - 1,355,000 98,400 1,355,000 98,400
$ 24,355,000 $ 4,973,380 $ 655,000 $ 53,975 $ 14,165,000 $ 3,226,150 $ 14,485,000 $ 6,091,030 $ 53,660,000 $ 14,344,535
PRIMARY GOVERNMENTGENERAL OBLIGATION TAX NOTES PTT REVENUE & TAX BONDS TOTAL REQUIREMENTS
53

City of Brenham, Texas Notes to Basic Financial Statements
September 30, 2011
III. DETAILED NOTES ON ALL FUNDS (Continued) Debt outstanding at September 30, 2011 for the primary government is comprised of the following: $9,245,000, 2002 Combination Tax and Revenue Certificates of Obligation Post-Refunding 900,000Debt due in installments of $425,000 to $460,000 through August 15, 2013; interest rates 3.875 to 4.0%
$9,000,000, 2006 Combination Tax and Revenue Certificates of Obligation due in annual 7,670,000installments of $155,000 to $740,000 through August 15, 2026; interest rate 3.940%
$5,545,000, 2007 General Obligation Refunding Bonds due in annual installments of 5,400,000$25,000 to $1,760,000 through August 15, 2021; interest rate 3.990%
$5,985,000, 2008 Combination Tax & Revenue Certificates of Obligation due in annual 5,915,000installments of $30,000 to $695,000 through August 15, 2028; interest rate 4.1-4.8%
$8,970,000; 2009 General Obligation Refunding Bonds due in annual 7,815,000installments of $105,000 to $1,905,000 through August 15, 2018; interest rate 3.0-4.0%
$760,000; 2010 Limited Tax Notes due in annual installments of $105,000 655,000to $115,000 through August 15, 2017; interest rate 2.0-2.625%
$14,180,000; 2010 Pass-Through Toll Revenue and Limited Tax Bonds with an 14,165,000installment of $15,000 August 15, 2011 and annual installments of $1,195,000 to$2,790,000 from August 15, 2014 through August 15, 2019; interest rate 3.0-4.0%
$3,600,000; 2010 General Obligation Refunding Bonds due in annual installments of 3,515,000$85,000 to $800,000 through August 15, 2014 and a final installment of $1,220,000on August 15, 2020; interest rate 2.0-4.0%
$7,730,000; 2011 General Obligation Refunding Bonds due in annual installments of $7,625,000 $105,000 to $1,035,000 through August 15, 2023; interest rate 1.0-3.125%
$480,130 lease payable dated August 30, 2007 due in annual payments of $108,700, 104,238Including interest, through August, 2012 (FY08 Vehicles and Equipment)
$782,650 lease payable dated February 16, 2010 due in monthly payments of $10,589 636,137Including interest, through March, 2017 (BVWACS Radios)
Compensated Absences for accrued vacation 476,019$54,876,394
Unamortized Bond Premium 1,422,682Unamortized Bond Discount (2,158)Deferred Charges on Bonds (1,301,705)
$54,995,213
54

City of Brenham, Texas Notes to Basic Financial Statements
September 30, 2011
III. DETAILED NOTES ON ALL FUNDS (Continued) Debt outstanding for Brenham Community Development Corporation Component Unit at September 30, 2011 and annual debt service payments to maturity for the outstanding debt follows:
$899,347 note payable to primary government dated May 21, 1998 in a sum not to exceed $2,500,000, payable in one year or on demand, whichever is later; interest payable monthly at 5.5%; unsecured; note is being amortized for 20 years through September 30, 2018 419,933$
$1,000,000 note payable to primary government dated August 6, 2010, interest payable at 4.75%, unsecured, annual payments 2017 through 2029 1,000,000
1,419,933$
FISCAL YEAR
ENDING NOTES PAYABLE 9/30 PRINCIPAL INTEREST2012 51,394 19,829 2013 54,023 17,200 2014 56,787 14,436 2015 59,693 11,531 2016 62,747 8,477
2017-2021 566,119 262,224 2022-2026 380,322 379,504 2027-2029 188,849 267,047
1,419,933$ 980,248$
COMPONENT UNIT
1. Prior Year Refunding In 2010, the City issued $3,600,000 of general obligation refunding bonds to provide resources to purchase federal securities that were placed in an irrevocable trust for the purpose of generating resources for the redemption on August 15, 2011 for certificates maturing 2012 through 2014 and 2020. As a result, the refunded bonds are considered to be defeased and the liability has been removed from long-term debt. At September 30, 2011, the outstanding principal on the defeased debt was $0. In 2011, the City issued $7,730,000 of general obligation refunding bonds to provide resources to purchase federal securities that were placed in an irrevocable trust for the purpose of generating resources for the redemption on August 15, 2011 for 2001 certificates maturing 2012 through 2014 and August 15, 2012 for 2002 certificates maturing 2014 through 2023. As a result, the refunded bonds are considered to be defeased and the liability has been removed from long-term debt. At September 30, 2011, the outstanding principal on the defeased debt was $5,800,000. I. Capital Leases The city entered into lease agreements to finance the acquisitions of radios for proprietary and government funds, street department heavy equipment, public safety radios, gas department vehicle, sanitation haul trucks and heavy equipment, and residential collection trucks. These lease commitments qualify as capital leases for accounting purposes, and therefore have been recorded at the present value of their future minimum lease payments as of inception date.
55
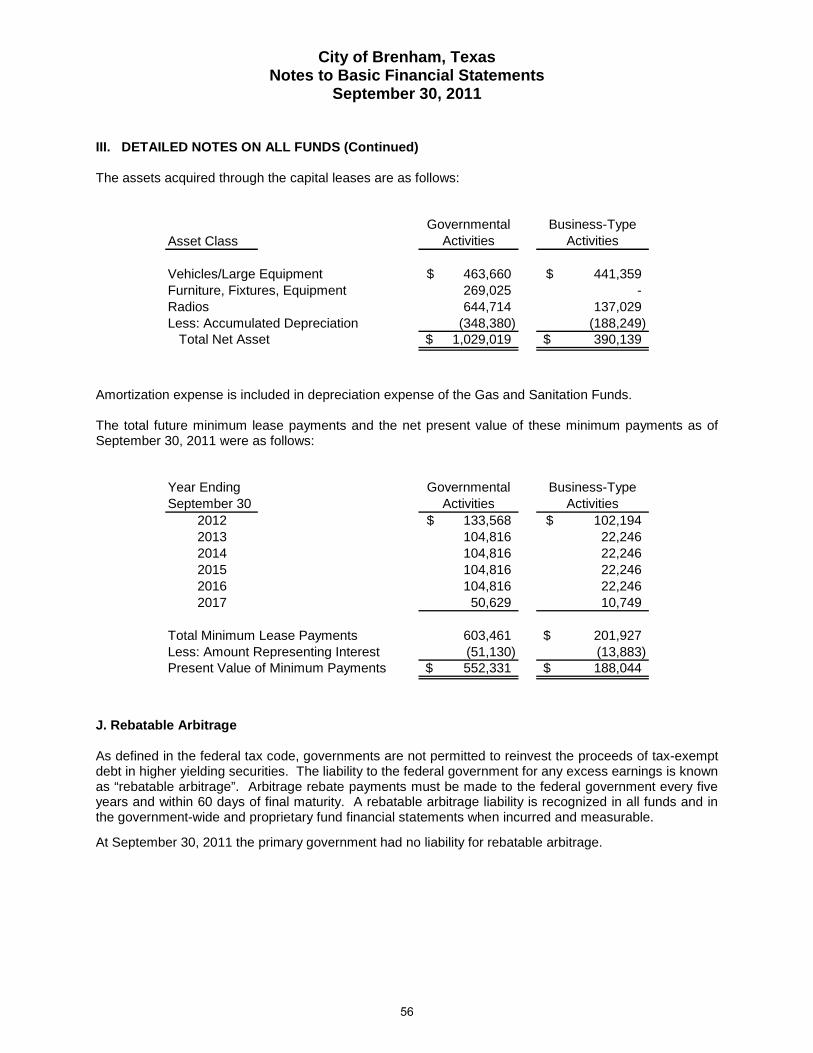
City of Brenham, Texas Notes to Basic Financial Statements
September 30, 2011
III. DETAILED NOTES ON ALL FUNDS (Continued) The assets acquired through the capital leases are as follows:
Asset ClassGovernmental
ActivitiesBusiness-Type
Activities
Vehicles/Large Equipment 463,660$ 441,359$ Furniture, Fixtures, Equipment 269,025 - Radios 644,714 137,029 Less: Accumulated Depreciation (348,380) (188,249)
Total Net Asset 1,029,019$ 390,139$
Amortization expense is included in depreciation expense of the Gas and Sanitation Funds. The total future minimum lease payments and the net present value of these minimum payments as of September 30, 2011 were as follows:
Year Ending September 30
Governmental Activities
Business-Type Activities
2012 133,568$ 102,194$ 2013 104,816 22,246 2014 104,816 22,246 2015 104,816 22,246 2016 104,816 22,246 2017 50,629 10,749
Total Minimum Lease Payments 603,461 201,927$ Less: Amount Representing Interest (51,130) (13,883) Present Value of Minimum Payments 552,331$ 188,044$
J. Rebatable Arbitrage As defined in the federal tax code, governments are not permitted to reinvest the proceeds of tax-exempt debt in higher yielding securities. The liability to the federal government for any excess earnings is known as “rebatable arbitrage”. Arbitrage rebate payments must be made to the federal government every five years and within 60 days of final maturity. A rebatable arbitrage liability is recognized in all funds and in the government-wide and proprietary fund financial statements when incurred and measurable.
At September 30, 2011 the primary government had no liability for rebatable arbitrage.
56

City of Brenham, Texas Notes to Basic Financial Statements
September 30, 2011
III. DETAILED NOTES ON ALL FUNDS (Continued) K. Restricted Cash and Investments: The balances of the restricted cash and investment accounts in the governmental and business type activities were as follows:
Capital Projects -$ 1,688,918$ Customer Deposits - 1,794,256 Debt Service 263,964 - Hotel/Motel Tax 28,076 - PD Criminal Law Enforcement 28,585 - Worker's compensation and health insurance account 574,802 - Pass Thru Toll Agreement 5,012,995
5,908,422$ 3,483,174$
GovernmentalActivities
Business-typeActivities
L. Classification of Net Assets The government-wide and business-type activities financial statements utilize a net assets presentation. Net assets are categorized as invested in capital assets (net of related debt), restricted and unrestricted. Net assets invested in capital assets, net of related debt represents capital assets, net of accumulated depreciation and is reduced by outstanding balances for bonds and other debt that is attributed to the acquisition, construction, or improvement of those assets. Restricted net assets represent assets that have externally imposed restrictions by creditors, grantors, contributions, or laws or regulations of other governments. M. Classification of Fund Balance: In the fund financial statements, the components of fund balances reflect policies and procedures established by actions of the City Council and its designated officials. Nonspendable Fund Balance – Includes amounts that cannot be spent because they are either not in spendable form, or, for legal or contractual reason, must be kept intact. This classification includes inventories, prepaid amounts, assets held for sale, and long-term receivables. Restricted Fund Balance – Constraints placed on the use of these resources are either externally imposed by creditors (such as through debt covenants), grantors, contributors or other governments; or are imposed by law (through constitutional provisions or enabling legislation). Committed Fund Balance – Amounts that can only be used for a specific purpose because they are constrained by limitations that the government imposes upon itself at its highest level of decision making authority and that remain binding unless removed in the same manner.
57
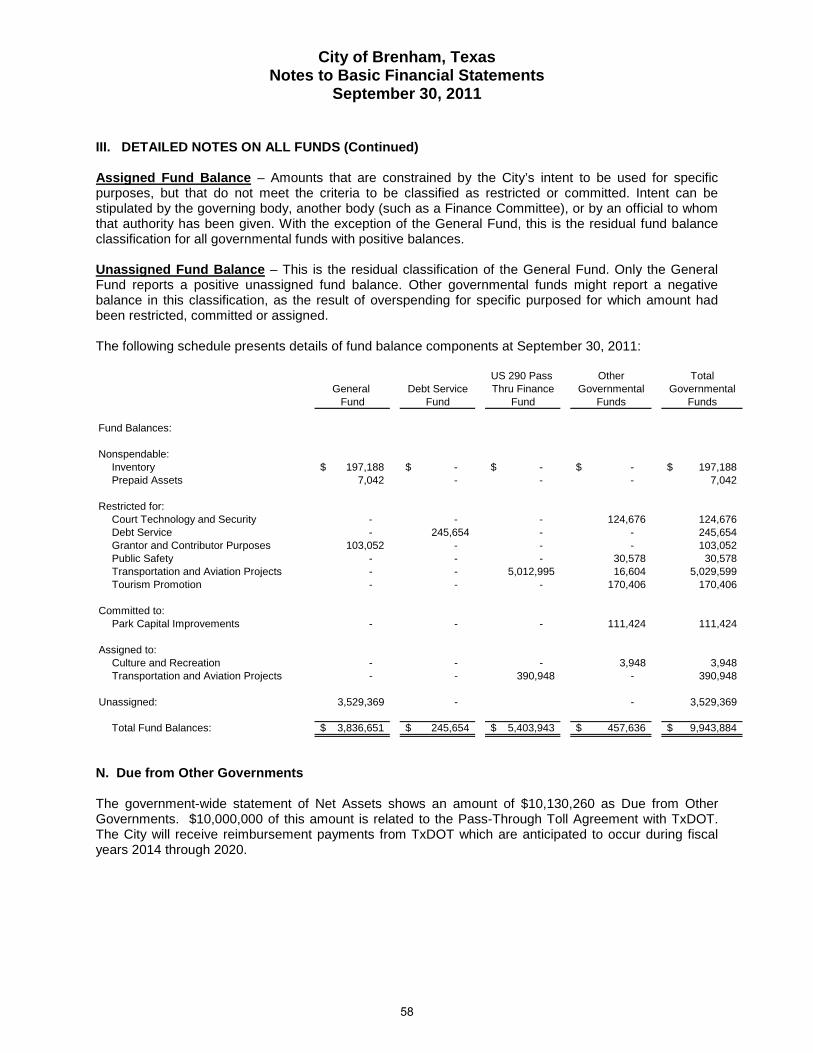
City of Brenham, Texas Notes to Basic Financial Statements
September 30, 2011
III. DETAILED NOTES ON ALL FUNDS (Continued) Assigned Fund Balance – Amounts that are constrained by the City’s intent to be used for specific purposes, but that do not meet the criteria to be classified as restricted or committed. Intent can be stipulated by the governing body, another body (such as a Finance Committee), or by an official to whom that authority has been given. With the exception of the General Fund, this is the residual fund balance classification for all governmental funds with positive balances. Unassigned Fund Balance – This is the residual classification of the General Fund. Only the General Fund reports a positive unassigned fund balance. Other governmental funds might report a negative balance in this classification, as the result of overspending for specific purposed for which amount had been restricted, committed or assigned. The following schedule presents details of fund balance components at September 30, 2011:
US 290 Pass Other TotalGeneral Debt Service Thru Finance Governmental Governmental
Fund Fund Fund Funds Funds
Fund Balances:
Nonspendable:Inventory 197,188$ -$ -$ -$ 197,188$ Prepaid Assets 7,042 - - - 7,042
Restricted for:Court Technology and Security - - - 124,676 124,676 Debt Service - 245,654 - - 245,654 Grantor and Contributor Purposes 103,052 - - - 103,052 Public Safety - - - 30,578 30,578 Transportation and Aviation Projects - - 5,012,995 16,604 5,029,599 Tourism Promotion - - - 170,406 170,406
Committed to:Park Capital Improvements - - - 111,424 111,424
Assigned to:Culture and Recreation - - - 3,948 3,948 Transportation and Aviation Projects - - 390,948 - 390,948
Unassigned: 3,529,369 - - 3,529,369
Total Fund Balances: 3,836,651$ 245,654$ 5,403,943$ 457,636$ 9,943,884$
N. Due from Other Governments The government-wide statement of Net Assets shows an amount of $10,130,260 as Due from Other Governments. $10,000,000 of this amount is related to the Pass-Through Toll Agreement with TxDOT. The City will receive reimbursement payments from TxDOT which are anticipated to occur during fiscal years 2014 through 2020.
58

City of Brenham, Texas Notes to Basic Financial Statements
September 30, 2011
IV. OTHER INFORMATION
A. Risk Management The City is exposed to various risks of loss related to torts; theft of, damage to and destruction of assets; errors and omissions; and natural disasters for which the City assumes part of the risk and participates in the Texas Municipal League Intergovernmental Risk Pool for the excess over certain deductibles. The City pays an annual premium to the TML Pool in order to receive premium discounts. The Pool is intended to be self-sustaining through member contributions and reinsures through commercial companies for claims over certain deductibles. The Pool returns a portion of contributions to members if claims and needed reserves are less than contributions received. The City has established a risk management program for medical insurance benefits. Premiums are paid into an internal service fund by all other funds to be used to pay claims, administrative costs and to accumulate reserves for future claims. The net assets of these funds are designated for future costs incurred in these specific programs. Liabilities are reported when it is probable that a loss has occurred and the amount of that loss can be reasonably estimated. To prevent incurring unexpected losses, the City has obtained excess insurance coverage in the event abnormally large claims occur. Incurred but not reported claims (IBNR) in the amount of $122,661 at September 30, 2011 are included as liabilities, styled "self-insurance claims payable", based upon previous experience with similar claims and information obtained from the excess carrier. Interfund premiums are based upon the insured funds' historical claims experience and are recorded as quasi-external interfund transactions in the Proprietary Fund statements. For the year ended September 30, 2011, the various funds paid into the risk management internal service fund $1,531,989 of premiums. Net assets as of September 30, 2011 totaled $276,367. Changes in the balances of claims liabilities for the year ended September 30 are as follows:
2011 2010Unpaid Claims, Beginning of Year 131,883$ 78,243$ Claims Incurred (including IBNR) 1,742,338 1,934,434Payments on Claims (1,751,560) (1,880,794)Other, net - - Unpaid Claims, End of Year 122,661$ 131,883$
B. Contingent Liabilities The City participates in a number of federally assisted grant programs. These programs are subject to program compliance audits by the grantors or their representatives. Audits for some of these federal programs for the year ended September 30, 2011 and for several prior years have not yet been conducted. Accordingly, the City’s compliance with applicable grant requirements will be established at some future date. The amount, if any, of expenditures which may be disallowed by the grantor agencies cannot be determined at this time although the City expects such amounts, if any, to be immaterial.
59

City of Brenham, Texas Notes to Basic Financial Statements
September 30, 2011
IV. OTHER INFORMATION (Continued) C. Deferred Compensation Plans and Retirement The City offers its employees two deferred compensation plans created in accordance with Internal Revenue Code Section 457. The plans, available to all City employees, permit them to defer a portion of their salary until future years. Participation in either plan is optional. The deferred compensation is not available to employees until termination, retirement, death or unforeseeable emergency. The City’s involvement in administering the plan is limited to remitting the amounts collected from employees to the plan administrator. The government is not considered to be holding the assets of the plan and the assets are not available to support the City’s own programs, therefore the deferred compensation plans are not presented in this report. 1. Plan description The City provides pension benefits for all of its full-time employees through a non-traditional, joint contributory, hybrid defined benefit plan in the state-wide Texas Municipal Retirement System (TMRS), one of 837 administered by TMRS, an agent multiple-employer public employee retirement system. The plan provisions that have been adopted by the city are within the options available in the governing state statutes of TMRS. TMRS issues a publicly available comprehensive annual financial report that includes financial statements and required supplementary information (RSI) for TMRS; the report also provides detailed explanations of the contributions, benefits and actuarial methods and assumptions used by the System. This report may be obtained from TMRS’ website at www.tmrs.com or by calling 1-800-924-8677. The plan provisions are adopted by the governing body of the City, within the options available in the state statutes governing TMRS. Plan provisions for the City were as follows:
Plan Year 2010 Plan Year 2011Employee Deposit Rate 5% 5%Matching Ratio (City to Employee) 2 to 1 2 to 1Years Required for Vesting 5 5Service Retirement Eligibility (Expressed as Age/Years of Service) 60/5, 0/20 60/5, 0/20
Updated Service Credit 100%, Transfers 100%, TransfersAnnuity Increase (To Retirees) 70% of CPI 70% of CPI
2. Contributions Under the state law governing TMRS, the contribution rate for each city is determined annually by the actuary, using the Projected Unit Credit actuarial cost method. This rate consist of the normal cost contribution rate and the prior service cost contribution rate, which is calculated to be a level percent of payroll from year to year. The normal cost contribution rate finances the portion of an active member’s projected benefit allocated annually; the prior service contribution rate amortizes the unfunded (overfunded) actuarial liability (asset) over the applicable period for that city. Both the normal cost and prior service contribution rates include recognition of the projected impact of annually repeating benefits, such as Updated Service Credits and Annuity Increases.
60
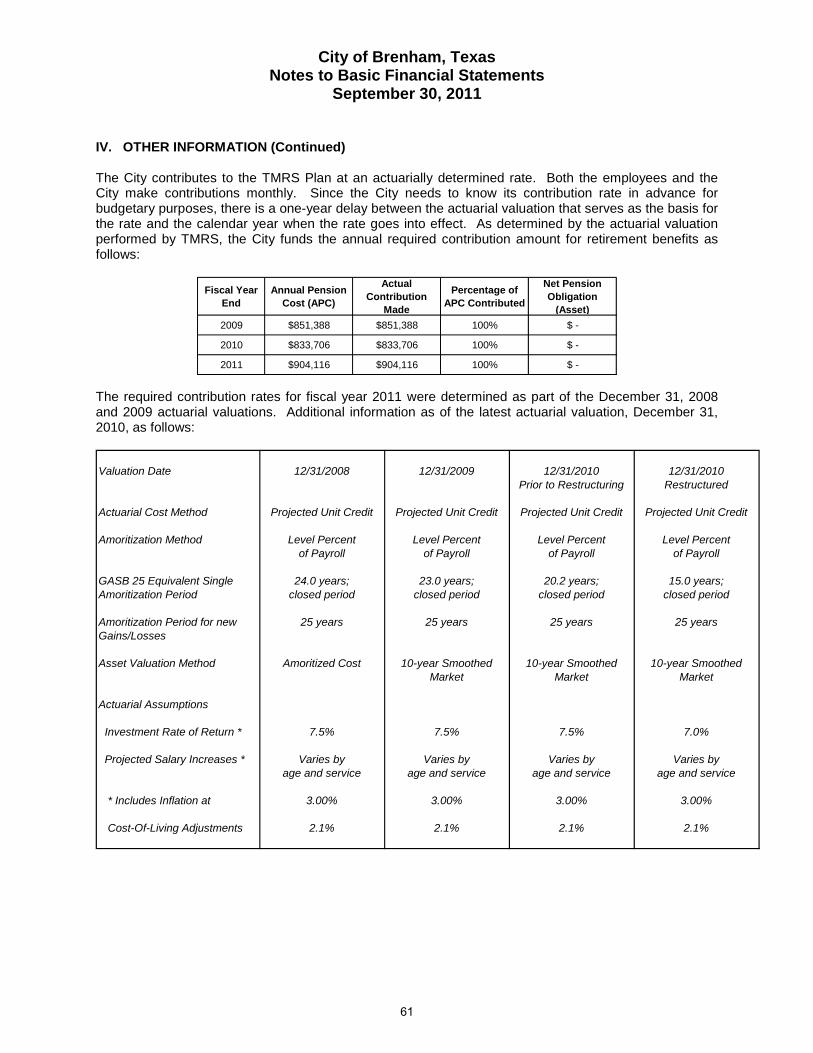
City of Brenham, Texas Notes to Basic Financial Statements
September 30, 2011
IV. OTHER INFORMATION (Continued) The City contributes to the TMRS Plan at an actuarially determined rate. Both the employees and the City make contributions monthly. Since the City needs to know its contribution rate in advance for budgetary purposes, there is a one-year delay between the actuarial valuation that serves as the basis for the rate and the calendar year when the rate goes into effect. As determined by the actuarial valuation performed by TMRS, the City funds the annual required contribution amount for retirement benefits as follows:
Fiscal Year End
Annual Pension Cost (APC)
Actual Contribution
Made
Percentage of APC Contributed
Net Pension Obligation
(Asset)2009 $851,388 $851,388 100% $ -
2010 $833,706 $833,706 100% $ -
2011 $904,116 $904,116 100% $ - The required contribution rates for fiscal year 2011 were determined as part of the December 31, 2008 and 2009 actuarial valuations. Additional information as of the latest actuarial valuation, December 31, 2010, as follows:
Valuation Date 12/31/2008 12/31/2009 12/31/2010 12/31/2010Prior to Restructuring Restructured
Actuarial Cost Method Projected Unit Credit Projected Unit Credit Projected Unit Credit Projected Unit Credit
Amoritization Method Level Percent Level Percent Level Percent Level Percentof Payroll of Payroll of Payroll of Payroll
GASB 25 Equivalent Single 24.0 years; 23.0 years; 20.2 years; 15.0 years;Amoritization Period closed period closed period closed period closed period
Amoritization Period for new 25 years 25 years 25 years 25 yearsGains/Losses
Asset Valuation Method Amoritized Cost 10-year Smoothed 10-year Smoothed 10-year SmoothedMarket Market Market
Actuarial Assumptions
Investment Rate of Return * 7.5% 7.5% 7.5% 7.0%
Projected Salary Increases * Varies by Varies by Varies by Varies byage and service age and service age and service age and service
* Includes Inflation at 3.00% 3.00% 3.00% 3.00%
Cost-Of-Living Adjustments 2.1% 2.1% 2.1% 2.1%
61

City of Brenham, Texas Notes to Basic Financial Statements
September 30, 2011
IV. OTHER INFORMATION (Continued) 3. Funded Status and Funding Progress In June 2011, SB 350 was enacted by the Texas Legislature, resulting in a restructure of the TMRS funds. This legislation provided for the actuarial valuation to be completed, as if restructuring had occurred on December 31, 2010. In addition, the actuarial assumptions were updated for the new fund structure, based on the actuarial experience study that was adopted by the TMRS Board at their May, 2011 meeting (the review compared actual to expected experience for the four-year period of January 1, 2006 through December 31, 2009). For a complete description of the combined impact of the legislation and new actuarial assumptions, including the effects on TMRS city rates and funding ratios, please see the December 31, 2010 TRMS Comprehensive Annual Financial Report (CAFR). The funded status as of December 31, 2010, under the two separate actuarial valuations, is presented as follows:
Actuarial Valuation Date
Actuarial Value of Assets
Actuarial Accrued Libility
(AAL)
Funded Ratio
Unfunded AAL (UAAL)
Covered Payroll
UAAL as a Percentage of
Covered Payroll
(1) (2) (3) (4) (5) (6)
(1) / (2) (2) - (1) (4) / (5)
12/31/2010 (1) 19,915,730$ 24,149,740$ 82.5% 4,234,010$ 9,567,491$ 44.3%
12/31/2010 (2) 28,437,560$ 29,272,502$ 97.1% 834,942$ 9,567,491$ 8.7%
(1) Actuarial valuation performed under the original fund structure(2) Actuarial valuation performed under the new fund structure Actuarial valuations involve estimates of the value of reported amounts and assumptions about the probability of events far into the future. Actuarially determined amounts are subject to continual revision as actual results are compared to past expectations and new estimates are made about the future. Actuarial calculations are based on the benefits provided under the terms of the substantive plan in effect at the time of each valuation, and reflect a long-term perspective. Consistent with that perspective, actuarial methods and assumptions used include techniques that are designed to reduce short term volatility in actuarial accrued liabilities and the actuarial value of assets. The schedule of funding progress, presented as Required Supplementary Information following the Notes to the Financial Statements, presents multi-year trend information about whether the actuarial value of plan assets is increasing or decreasing over time relative to the actuarial accrued liability of benefits. D. Subsequent Events At the October 20, 2011 City Council meeting, a resolution was approved to accept the donation of the newly constructed outdoor amphitheater at Hohlt Park. This project was privately funded and then donated to the City. By accepting the donation, the City will assume ownership, operation and maintenance of the amphitheater. At the November 3, 2011 meeting, the City Council approved several bids for the construction of restrooms in Hohlt Park. The contracts totaled $107,777. On November 17, 2011, the City Council authorized the issuance and sale of $1,200,000 of Limited Tax Notes, Series 2011, to fund Phase II of the Street Overlay Project. The interest rate on the notes is 1.71 percent with a maturity date of August 15, 2018.
62

City of Brenham, Texas Notes to Basic Financial Statements
September 30, 2011
IV. OTHER INFORMATION (Continued) E. New Pronouncements The City will implement the following new financial accounting and reporting standard issued by GASB:
• Statement No. 63, “Financial Reporting of Deferred Outflows of Resources, Deferred Inflows of Resources, and Net Position.” The requirements of this statement are effective for FY12, but the effect of implementing this statement is unknown.
F. Change in Beginning Fund Balance 1. Reclassification At the end of the year it was determined a reclassification of beginning fund balance was necessary as the result of a previously reported special revenue fund that per accounting standards must now be classified as a major fund. 2. New Standard During the year the City implemented GASB Statement No. 54, “Fund Balance Reporting and Governmental Fund Type Definitions.” With the implementation of GASB 54, several funds previously reported as special revenue funds no longer met the definition and needed to be reclassified as part of the General Fund or as a capital improvement fund. The following discloses the restatement of governmental fund balances as of the beginning of the fiscal year:
General Fund
US 290 Pass Thru Finance
Fund
Other Governmental
FundsFund Balance/Net assets as previously reported 2,764,850$ -$ 1,907,362$ Increase(decrease) due to reclassification of special revenue funds 1,024,318 (1,024,318) Increase(decrease) due to reclassification of non major fund to major 449,082 (449,082) Fund Balance/Net assets as restated 3,789,168$ 449,082$ 433,962$
G. Other Postemployment Benefits Plan Description. The City of Brenham Employee Benefits Plan, a Texas political subdivision employees’ uniform group benefits plan, is a self-funded, non-federal, governmental health plan. The plan is a single-employer defined benefit OPEB plan. Plan benefits include medical and prescription coverage. The Texas Local Government Code Chapter 172 is the authority under which benefit provisions are established and the State of Texas has the authority to amend the requirements. The City of Brenham utilizes Texas Municipal League Intergovernmental Benefits Pool (TMLIEBP) as the third party administrator for claims processing. The City does not issue stand alone financial statements of the group medical plan; however, all required information is presented in this report. Funding Policy. The contribution requirements of plan members are established by the City and may be amended as needed. Medical coverage levels for retirees are the same coverage provided to active City employees in accordance with the terms and conditions of the current City Benefit Plan. Retirees and covered spouses whose sum of age and years of service was equal to or greater than 75 at the time of retirement may purchase group health insurance until they or their spouse reach Medicare eligibility.
63

City of Brenham, Texas Notes to Basic Financial Statements
September 30, 2011
IV. OTHER INFORMATION (Continued) Currently, six retirees and three spouses meet plan eligibility requirements and have elected to receive this benefit. The retiree pays 100% of the premium for group health care coverage, and the annual required medical contributions are shown below: Coverage Premium
Retiree Only $5,632.92 Retiree & Spouse $11,493.12 The City is not required to make contributions to the plan on behalf of the retirees and funds the plan on a projected pay-as-you-go financing method. The plan had 221 active members as of October 1, 2010, the effective date of this OPEB valuation. The City pays 95% of monthly premiums ($469.41) for active members, 77.5% of premiums ($741.81) for member and spouse, 80.1% of premiums ($669.86) for member and child, and 72.5% for family coverage ($943.97). Employees who retire because of a disability may qualify for life insurance and long term disability benefits until reaching age 65 or the end of the disability eligibility, whichever comes first. Premiums for qualifying retirees are waived and there is no further cost to the City or the retiree. Currently, one retiree and one active employee qualify for long term disability. Annual OPEB Cost. The City’s annual OPEB expense is calculated based on the annual required contribution (ARC) of the employer, an amount actuarially determined in accordance with the parameters of GASB Statement 45. The ARC represents a level of funding that, if paid on an ongoing basis, is projected to cover normal costs each year and amortize any unfunded actuarial liabilities over a period not to exceed thirty years. The following table shows the calculation of the Annual Required Contribution and Net OPEB Obligation assuming a 4.0% discount rate:
FY Ending 09/30/2011
FY Ending 09/30/2010
FY Ending 09/30/2009
Determination of Annual Required Contribution Normal Cost at fiscal year end 99,378$ 69,731$ 69,731$ Amortization of UAAL 90,122 70,504 70,504
Annual Required Contribution (ARC) 189,500$ 140,235$ 140,235$
Determination of Net OPEB Obligation Annual Required Contribution 189,500$ 140,235$ 140,235$ Interest on prior year Net OPEB Obligation 11,131 5,609 - Adjustment to ARC (15,474) (7,798) -
Annual OPEB Cost 185,157$ 138,046$ 140,235$ Contributions made - - -
Estimated increase in Net OPEB Obligation 185,157$ 138,046$ 140,235$
Estimated Net OPEB Obligation - begin of year 278,281$ 140,235$ -$
Estimated Net OPEB Obligation - end of year 463,438$ 278,281$ 140,235$ Funded Status and Funding Progress. As of October 1, 2010, the most recent actuarial valuation date, the plan was not funded. The actuarial accrued liability for benefits was $1,558,393, and the actuarial value of the assets was $0, resulting in an unfunded actuarial accrued liability (UAAL) of $1,558,393. The covered payroll (annual payroll of active employees covered by the plan) was $10,139,094 and the ratio of the UAAL to the covered payroll was 15%.
64
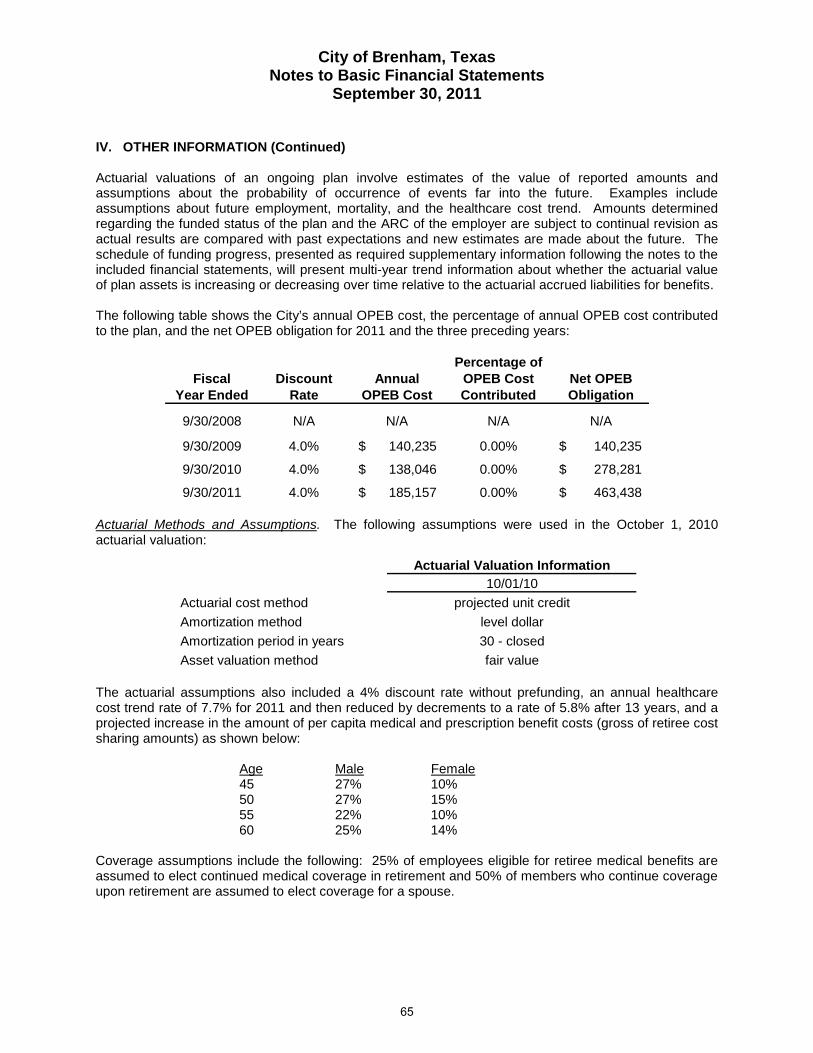
City of Brenham, Texas Notes to Basic Financial Statements
September 30, 2011
IV. OTHER INFORMATION (Continued) Actuarial valuations of an ongoing plan involve estimates of the value of reported amounts and assumptions about the probability of occurrence of events far into the future. Examples include assumptions about future employment, mortality, and the healthcare cost trend. Amounts determined regarding the funded status of the plan and the ARC of the employer are subject to continual revision as actual results are compared with past expectations and new estimates are made about the future. The schedule of funding progress, presented as required supplementary information following the notes to the included financial statements, will present multi-year trend information about whether the actuarial value of plan assets is increasing or decreasing over time relative to the actuarial accrued liabilities for benefits. The following table shows the City’s annual OPEB cost, the percentage of annual OPEB cost contributed to the plan, and the net OPEB obligation for 2011 and the three preceding years:
Percentage ofFiscal Discount Annual OPEB Cost Net OPEB
Year Ended Rate OPEB Cost Contributed Obligation
9/30/2008 N/A N/A N/A N/A
9/30/2009 4.0% 140,235$ 0.00% 140,235$
9/30/2010 4.0% 138,046$ 0.00% 278,281$
9/30/2011 4.0% 185,157$ 0.00% 463,438$ Actuarial Methods and Assumptions. The following assumptions were used in the October 1, 2010 actuarial valuation:
Actuarial Valuation Information10/01/10
Actuarial cost method projected unit creditAmortization method level dollarAmortization period in years 30 - closedAsset valuation method fair value
The actuarial assumptions also included a 4% discount rate without prefunding, an annual healthcare cost trend rate of 7.7% for 2011 and then reduced by decrements to a rate of 5.8% after 13 years, and a projected increase in the amount of per capita medical and prescription benefit costs (gross of retiree cost sharing amounts) as shown below: Age Male Female 45 27% 10% 50 27% 15% 55 22% 10% 60 25% 14% Coverage assumptions include the following: 25% of employees eligible for retiree medical benefits are assumed to elect continued medical coverage in retirement and 50% of members who continue coverage upon retirement are assumed to elect coverage for a spouse.
65

This page intentionally left blank.
66


City of Brenham, Texas Required Supplementary Information
September 30, 2011
SCHEDULE OF FUNDING PROGRESS - Other Postemployment Benefit Plan (OPEB)*
UnfundedActuarial Actuarial
Actuarial Actuarial Accrued AccruedValuation Value Liabilities Liabilities Funded Covered Funded
Date of Assets (AAL) (1) (UAAL) (2) Ratio Payroll (3) Ratio
October 1, 2008 - 1,219,154$ 1,219,154$ 0% 9,114,493$ 13%
October 1, 2009 N/A N/A N/A N/A N/A N/A
October 1, 2010 - 1,558,393$ 1,558,393$ 0% 10,139,094$ 15%
(1) Actuarial Accrued Liability determined under the projected unit credit actuarial cost method
(2) Actuarial Accrued Liability less Actuarial Value of Assets
(3) Because of the City's plan size, it is required to obtain an actuarial valuation at least biennially. The most recent actuarial valuation is shown.
* Health Care Insurance Plan
67

This page intentionally left blank.
68

City of Brenham, Texas Required Supplementary Information
September 30, 2011
SCHEDULE OF FUNDING PROGRESS - Texas Municipal Retirement System (TMRS)
12/31/2010 12/31/2009 12/31/2008Actuarial Value of Assets 28,437,560$ 18,760,400$ 17,950,666$ Actuarial Accrued Liability 29,272,502 22,545,959 21,639,916 Percentage Funded 97.1% 83.2% 83.0%Unfunded (Over-funded) ActuarialAccrued Liaiblity (UAAL) 834,942 3,785,559 3,689,250 Annual Covered Payroll 9,567,491 9,171,150 9,116,479 UAAL as a Percentage of Covered Payroll 8.7% 41.3% 40.5%Net Pension Obligation (NPO)Beginning of Period - - - Annual Pension Cost: Annual Required Contribution (ARC) 904,116 833,706 851,388 Interest on NPO - - - Adjustment to ARC - - -
904,116 833,706 851,388 Contributions Made 904,116 833,706 851,388 Increase in NPO - - - NPO at the end of the period -$ -$ -$
A summary of actuarial assumptions and definitions can be found in the December 31, 2010 TMRS Comprehensive Annual Financial Report (CAFR).
69

Adjustments Actual Variance to Budget Budget with
Basis Basis Final Budget
$ - $ 10,323,014 $ 285,450 - 64,465 (10,625)
(466,864) 163,441 16,766 - 493,247 (13,413)- 766,908 40,402
(177) 5,383 (1,317)- 216,500 -
(110,004) - -(10,165) 102,584 30,789
(587,210) 12,135,542 348,052
2,521,237 (81,240) 2,414,633 106,604 4,923,948 (31,898) 4,722,385 201,563
234,214 (45,990) 232,268 1,946 1,340,727 (154,178) 1,225,138 115,589 5,511,226 (312,150) 5,488,621 22,605
14,531,352 (625,456) 14,083,045 448,307
- (21,095) - -(21,095) - -
36,500 (792,774) 159,753 (123,253)14,567,852 (1,439,325) 14,242,798 325,054
Excess (Deficiency) of Revenues Over (Under) Expenditures 852,115 (2,107,256) 673,106
3,068,208 (16,276) 2,929,409 (138,799)(326,346) (326,346) (326,346) -
- 751,463 - -- (772,558) - -
38,500 - 40,074 1,574 (363,717) 2,643,137 (137,225)
488,398 535,881 535,881
(1,024,318) 2,764,850 - $ (535,920) $ 3,300,731 $ 535,881
Revenues
- 772,558
-
Total revenues
City of BrenhamGeneral Fund
Schedule of Revenues, Expenditures, and Changes in Fund Balances - Budget and ActualFor the Year Ended September 30, 2011
Budgeted Amounts
Original Final Actual
Taxes $ 10,037,564 $ 10,037,564 $ 10,323,014 Licenses and Permits 75,090 75,090 64,465 Intergovernmental 144,675 146,675 630,305 Charges for Services 532,660 506,660 493,247 Fines and Forfeitures 640,025 726,506 766,908 Investment Income 6,700 6,700 5,560 Payment from Component Unit 200,000 216,500 216,500
Miscellaneous 36,195 71,795 112,749 Contributions and Donations 110,004
11,672,909 11,787,490 12,722,752
ExpendituresCurrent:
Culture and Recreation 2,500,237 2,495,873 General Government 4,990,753 4,754,283 Health and Welfare 234,214 278,258 Highways and Streets 1,358,237 1,379,316 Public Safety 5,520,165 5,800,771
14,603,606 14,708,501
Debt Service:
- - 21,095 Issuance Costs - 21,095
3,078,208
Capital Outlay 46,000 952,527 Total Expenditures 14,649,606 15,682,123
(751,463)Proceeds from Bonds
(2,976,697) (2,780,362) (2,959,371)
Other Financing Sources (Uses)Transfers In
-
2,945,685 Transfers Out (101,511) -
Insurance Proceeds - 40,074
Payment to Component Unit -
$ 3,836,651
Total other financing sources and (uses) 2,976,697 2,780,362 3,006,854
47,483
Fund balance - beginning as restated
Net change in fund balance -
The accompanying notes to required supplementary information are an integral part of this statement.
2,764,850 2,764,850 3,789,168 Fund balance - ending $ 2,764,850 $ 2,764,850
70

City of Brenham, Texas Required Supplementary Information
September 30, 2011 NOTES TO REQUIRED SUPPLEMENTARY INFORMATION Note 1: Budgetary Basis of Accounting
With the exception of General Fund, all budgets are prepared and adopted on a basis consistent with generally accepted accounting principles which is the same basis of accounting used for financial reporting in these financial statements. The General Fund budget, as shown in the financial statements, is prepared and adopted on a different basis. Intergovernmental revenues are budgeted as “contra expenditures” to more clearly reflect the departmental operations. At the end of the year, adjusting journal entries are posted to reclass the “contra expenditures” to intergovernmental revenues. Also, with the implementation of GASB Statement No. 54 Fund Balance Reporting and Governmental Fund Type Definitions, six other governmental funds were combined with the General Fund for financial reporting purposes. The effect of these items is shown in the adjustments to budget basis column.
71

This page intentionally left blank.
72

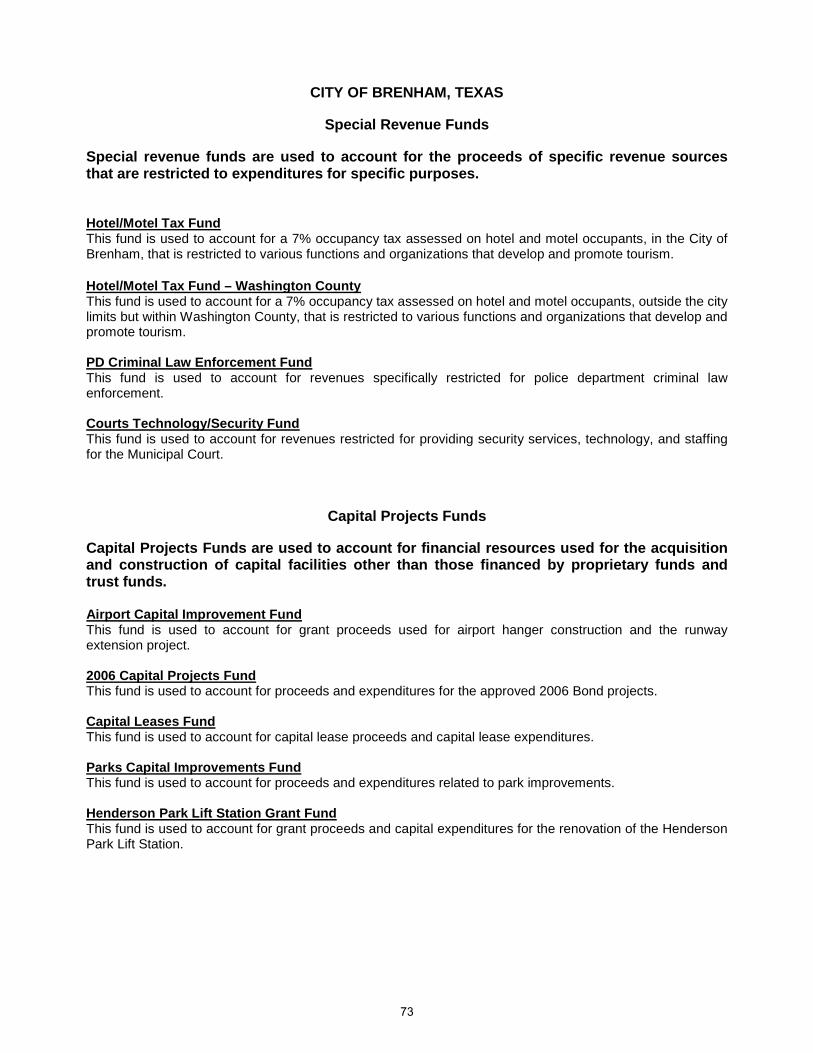
CITY OF BRENHAM, TEXAS
Special Revenue Funds
Special revenue funds are used to account for the proceeds of specific revenue sources that are restricted to expenditures for specific purposes. Hotel/Motel Tax Fund This fund is used to account for a 7% occupancy tax assessed on hotel and motel occupants, in the City of Brenham, that is restricted to various functions and organizations that develop and promote tourism. Hotel/Motel Tax Fund – Washington County This fund is used to account for a 7% occupancy tax assessed on hotel and motel occupants, outside the city limits but within Washington County, that is restricted to various functions and organizations that develop and promote tourism. PD Criminal Law Enforcement Fund This fund is used to account for revenues specifically restricted for police department criminal law enforcement. Courts Technology/Security Fund This fund is used to account for revenues restricted for providing security services, technology, and staffing for the Municipal Court.
Capital Projects Funds
Capital Projects Funds are used to account for financial resources used for the acquisition and construction of capital facilities other than those financed by proprietary funds and trust funds. Airport Capital Improvement Fund This fund is used to account for grant proceeds used for airport hanger construction and the runway extension project. 2006 Capital Projects Fund This fund is used to account for proceeds and expenditures for the approved 2006 Bond projects. Capital Leases Fund This fund is used to account for capital lease proceeds and capital lease expenditures. Parks Capital Improvements Fund This fund is used to account for proceeds and expenditures related to park improvements. Henderson Park Lift Station Grant Fund This fund is used to account for grant proceeds and capital expenditures for the renovation of the Henderson Park Lift Station.
73

This page intentionally left blank.
74

CITY OF BRENHAM, TEXAS
Internal Service Funds
Internal Service Funds are used to account for the financing of goods or services provided by one department or agency to other departments or agencies of the government and to other government units, on a cost reimbursement basis. Workers’ Compensation Fund This fund is used to account for a zero deductible plan for workers’ compensation provided to other funds of the City on a cost reimbursement basis. Self-Insured Health Insurance Fund This fund is used to account for self-insured health insurance risk management services to other funds of the City on a cost reimbursement basis.
Debt Service Fund This fund is used to account for the accumulation of financial resources for the payment of interest and principal on the general long-term debt of the City, other than debt service payments made by enterprise funds. Ad valorem taxes and interest earned on the investments of the Debt Service funds are used for the payment of principal, interest, and commissions to fiscal agents on the City’s general obligation bonds, which are reflected in the government-wide financial statements.
75

Special Total Other Revenue Governmental
Funds Funds
$ 212,739 $ 283,133
56,836 56,836 - 63,657
56,661 56,661 $ 326,236 $ 460,287
$ - $ 2,075 576 576 576 2,651
325,660 342,264 - 111,424 - 3,948
325,660 457,636 $ 326,236 $ 460,287
Total Fund Balances 131,976 Total Liabilities and Fund Balances $ 134,051
Total Liabilities 2,075
Fund Balances: Restricted Committed Assigned
Accounts Payable & Other Current $ 2,075 Deferred Revenue -
Total Assets $ 134,051
Liabilities and Fund BalancesLiabilities:
Restricted Cash -
Occupancy Tax -Interfund Receivables 63,657
ProjectsFunds
AssetsCash and Equivalents $ 70,394 Receivables (Net)
16,604
3,948 111,424
City of BrenhamCombining Balance Sheet
Other Governmental FundsSeptember 30, 2011
NonmajorCapital
76
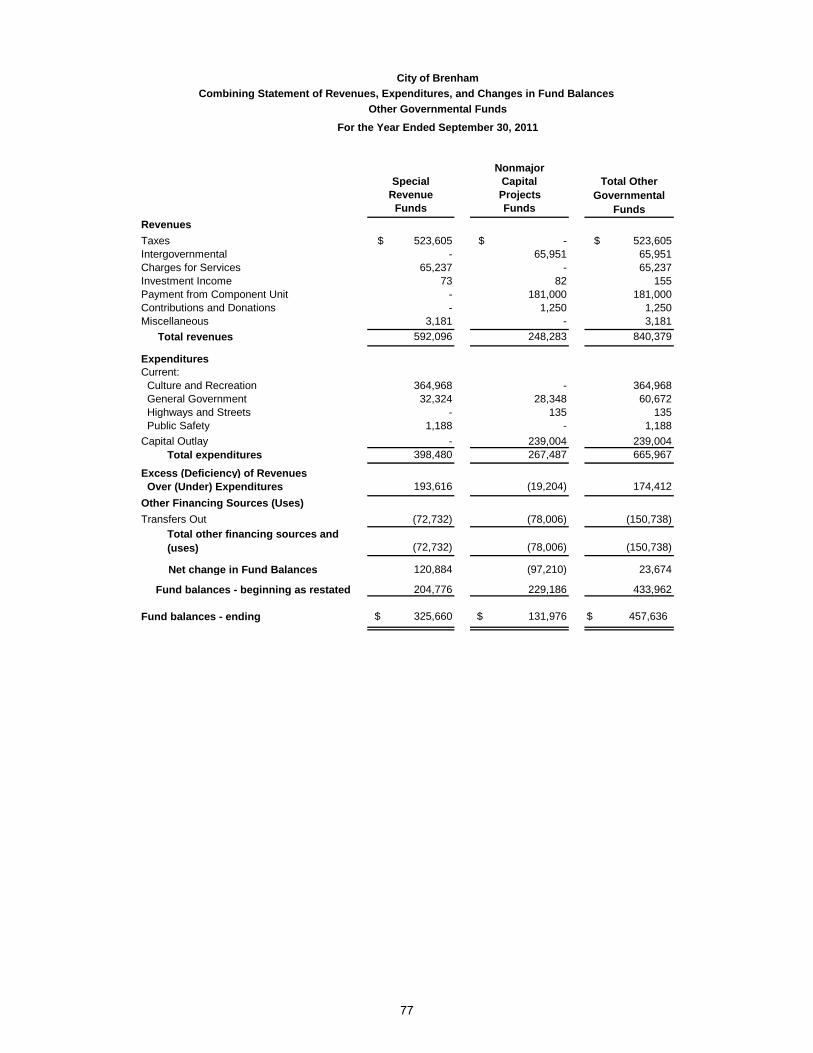
$ 523,605 65,951
- 65,237 155
181,000 1,250 1,250
3,181 840,379
364,968 60,672
135 1,188
239,004 665,967
Excess (Deficiency) of Revenues Over (Under) Expenditures 174,412
(150,738)
(150,738)
23,674
433,962
$ 457,636
City of BrenhamCombining Statement of Revenues, Expenditures, and Changes in Fund Balances
Other Governmental FundsFor the Year Ended September 30, 2011
NonmajorSpecial Capital Total Other
Governmental Funds
Revenue ProjectsFunds Funds
RevenuesTaxes $ 523,605 $ - Intergovernmental - 65,951 Charges for Services 65,237 Investment Income 73 82 Payment from Component Unit - 181,000 Contributions and Donations -Miscellaneous 3,181 -
Total revenues 592,096 248,283
ExpendituresCurrent: Culture and Recreation 364,968 - General Government 32,324 28,348 Highways and Streets - 135 Public Safety 1,188 -Capital Outlay - 239,004
Total expenditures 398,480 267,487
193,616 (19,204)Other Financing Sources (Uses)Transfers Out (72,732) (78,006)
Total other financing sources and (uses) (72,732) (78,006)
Net change in Fund Balances 120,884 (97,210)
204,776 229,186 Fund balances - beginning as restated
Fund balances - ending $ 325,660 $ 131,976
77
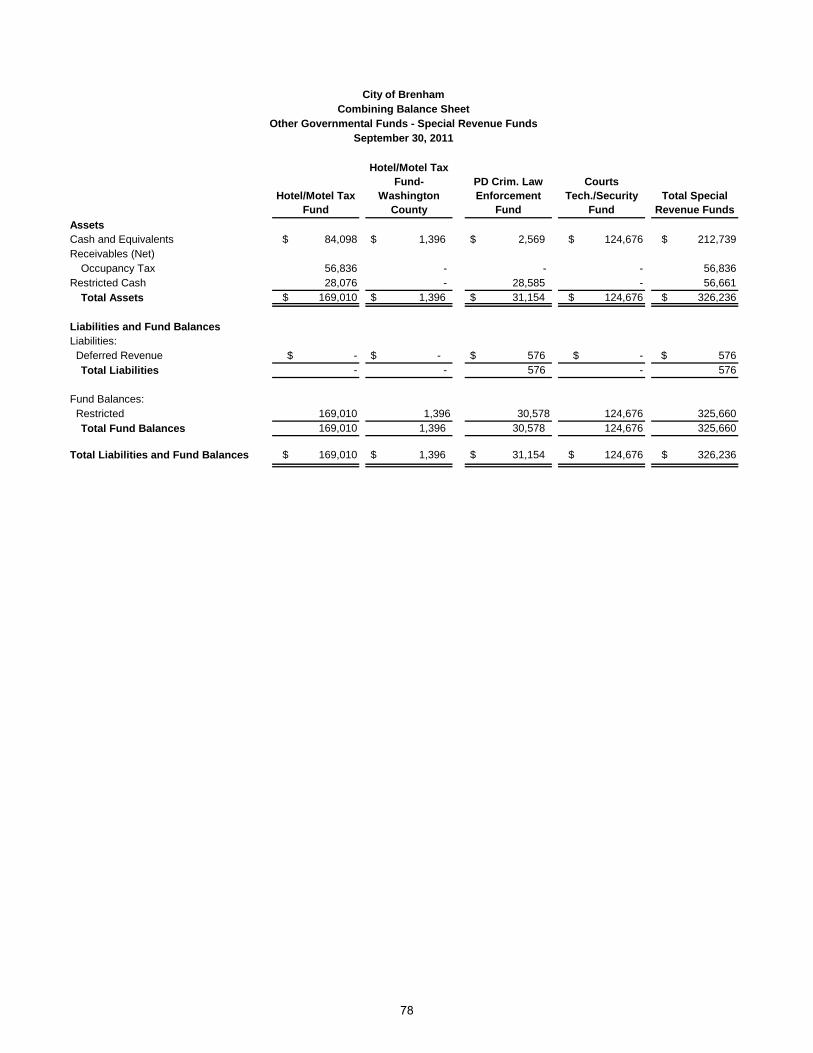
Hotel/Motel Tax Fund
Hotel/Motel Tax Fund-
Washington County
PD Crim. Law Enforcement
Fund
Courts Tech./Security
FundTotal Special
Revenue FundsAssetsCash and Equivalents $ 84,098 $ 1,396 $ 2,569 $ 124,676 $ 212,739 Receivables (Net)
Occupancy Tax 56,836 - - - 56,836 Restricted Cash 28,076 - 28,585 - 56,661
Total Assets $ 169,010 $ 1,396 $ 31,154 $ 124,676 $ 326,236
Liabilities and Fund BalancesLiabilities: Deferred Revenue $ - $ - $ 576 $ - $ 576
Total Liabilities - - 576 - 576
Fund Balances: Restricted 169,010 1,396 30,578 124,676 325,660
Total Fund Balances 169,010 1,396 30,578 124,676 325,660
Total Liabilities and Fund Balances $ 169,010 $ 1,396 $ 31,154 $ 124,676 $ 326,236
Other Governmental Funds - Special Revenue FundsSeptember 30, 2011
City of BrenhamCombining Balance Sheet
78

Hotel/Motel Tax Fund
Hotel/Motel Tax Fund-
Washington County
PD Crim. Law Enforcement
Fund
Courts Tech./Security
FundTotal Special
Revenue FundsRevenuesTaxes $ 468,371 $ 55,234 $ - $ - $ 523,605 Charges for Services - - - 65,237 65,237 Investment Income 36 - 37 - 73 Miscellaneous - - 3,181 - 3,181
Total revenues 468,407 55,234 3,218 65,237 592,096
ExpendituresCurrent: Culture and Recreation 311,130 53,838 - - 364,968 General Government - - - 32,324 32,324 Public Safety - - 1,188 - 1,188
Total expenditures 311,130 53,838 1,188 32,324 398,480
Excess (Deficiency) of Revenues Over (Under) Expenditures 157,277 1,396 2,030 32,913 193,616
Other Financing Sources (Uses)Transfers Out (48,000) - - (24,732) (72,732)
Total other financing sources and (uses) (48,000) - - (24,732) (72,732)
Net change in Fund Balances 109,277 1,396 2,030 8,181 120,884
Fund balances - beginning 59,733 - 28,548 116,495 204,776
Fund balances - ending $ 169,010 $ 1,396 $ 30,578 $ 124,676 325,660$
Other Governmental Funds - Special Revenue FundsFor the Year Ended September 30, 2011
City of BrenhamStatement of Revenues, Expenditures, and Changes in Fund Balances
79
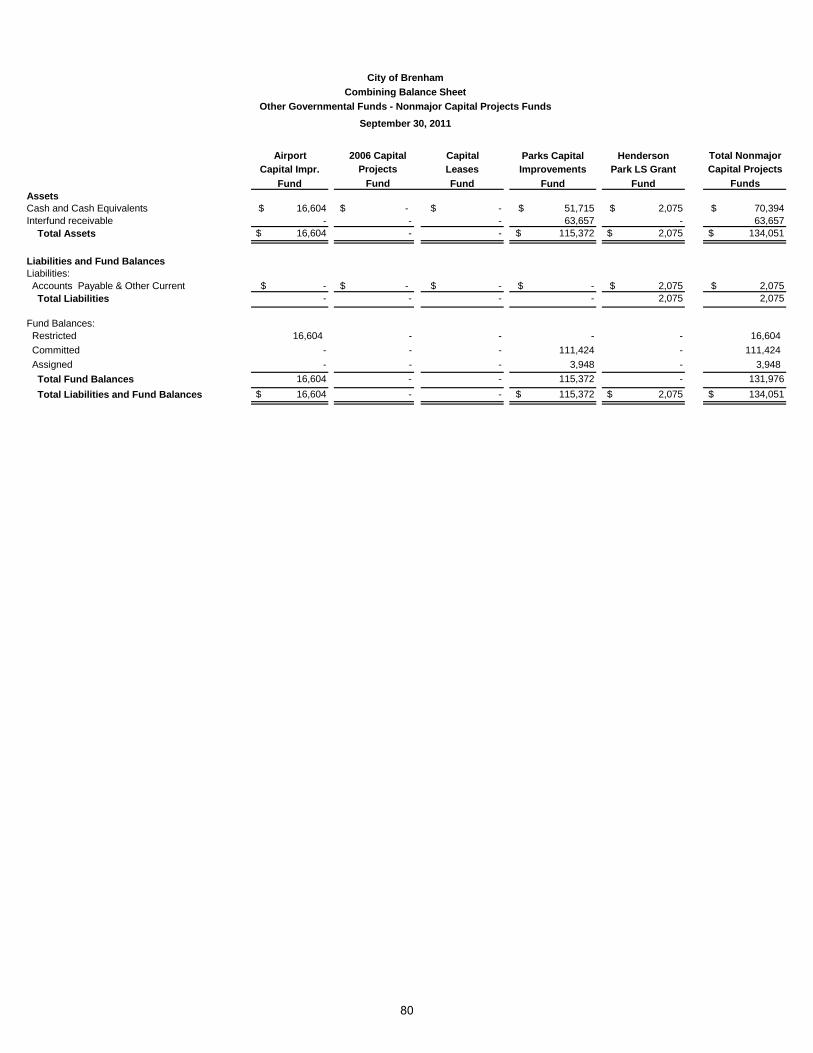
Airport Total NonmajorCapital Impr. Capital Projects
Fund Funds
$ 16,604 -$ $ 70,394 - - 63,657
$ 16,604 - $ 134,051
$ - -$ $ 2,075 - - 2,075
16,604 - - - - 16,604 - - - 111,424 - 111,424 - - - 3,948 - 3,948
16,604 - 131,976 $ 16,604 - $ 134,051
Total Fund Balances - - Total Liabilities and Fund Balances - $ 2,075
115,372 $ 115,372
$ -
Liabilities and Fund BalancesLiabilities: Accounts Payable & Other Current $ - $ 2,075
- Total Liabilities - 2,075
Restricted Committed Assigned
Fund Balances:
Total Assets - $ 2,075 $ 115,372
AssetsCash and Cash Equivalents $ - $ 2,075 Interfund receivable - -
$ 51,715 63,657
Projects Leases Park LS GrantFund Fund Fund
ImprovementsFund
City of BrenhamCombining Balance Sheet
Other Governmental Funds - Nonmajor Capital Projects FundsSeptember 30, 2011
2006 Capital Capital HendersonParks Capital
80

Total Nonmajor Capital Projects
Funds
$ 65,951 82
- - - 181,000 181,000 - - - 1,250 1,250
248,283
28,348 135
239,004 267,487
Excess (Deficiency) of Revenues Over (Under) Expenditures (19,204)
- (79) (77,927) - - (78,006)
(78,006)
(97,210)
229,186
$ 131,976
Highways and Streets 135
-
Fund balances (deficit) - beginning
(36,335)
-
Capital Impr. Projects Leases Park LS GrantParks CapitalImprovements
Fund Fund Fund Fund
-
City of BrenhamStatement of Revenues, Expenditures, and Changes in Fund Balances
Other Governmental Funds - Nonmajor Capital Projects FundsFor the Year Ended September 30, 2011
Airport 2006 Capital Capital Henderson
RevenuesFund
Investment Income - 79 3 --
Expenditures
Total revenues 37,603 79 3 28,348 182,250
Intergovernmental $ 37,603 $ - $ - $ 28,348 $ -
Current: General Government - - 28,348
Contributions and DonationsPayment from Component Unit
- -
Total expenditures 135 - 20,419 28,348 218,585 Capital Outlay - - 20,419 -218,585
37,468 79 (20,416) -
Other Financing Sources (Uses)
(36,335)
Transfers OutTotal other financing sources and (uses)
Net change in Fund Balances 37,468 - (98,343)
- (79) (77,927)
Fund balances - ending $ 16,604 $ - $ - $ -
151,707
$ 115,372
(20,864) - 98,343 -
81

Workers'Compensation
Fund Total
$ - $ 995 1,000 6,599
323,735 574,802 $ 324,735 $ 582,396
$ 67,283 $ 183,368 - 122,661
67,283 306,029
257,452 276,367 $ 257,452 $ 18,915 $ 276,367 Total Net Assets
Self Insurance Claims Payable 122,661 Total Liabilities 238,746
Net AssetsUnrestricted 18,915
Liabilities and Fund BalancesLiabilities: Interfund Payable $ 116,085
Other Current Assets 5,599 Restricted Cash 251,067 Total Assets $ 257,661
FundAssets Receivables - Accounts, Net $ 995
City of BrenhamInternal Service Funds
Combining Statement of Net AssetsSeptember 30, 2011
Self-InsuredHealth Ins.
82
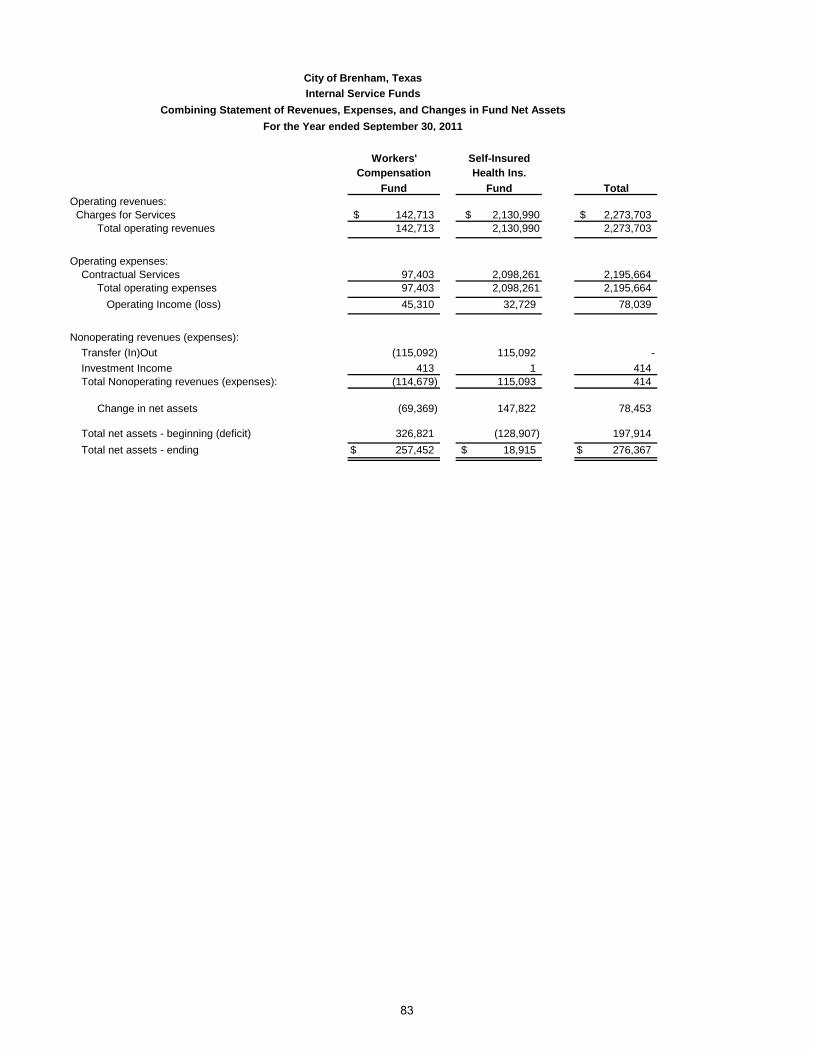
Workers' Self-InsuredCompensation Health Ins.
Fund Fund Total
142,713$ $ 2,130,990 2,273,703$ 142,713 2,130,990 2,273,703
97,403 2,098,261 2,195,66497,403 2,098,261 2,195,664
Operating Income (loss) 45,310 32,729 78,039
(115,092) 115,092 -413 1 414
(114,679) 115,093 414
(69,369) 147,822 78,453
326,821 (128,907) 197,914257,452$ 18,915$ 276,367$
City of Brenham, TexasInternal Service Funds
Combining Statement of Revenues, Expenses, and Changes in Fund Net AssetsFor the Year ended September 30, 2011
Operating revenues: Charges for Services
Total operating revenues
Operating expenses:Contractual Services
Total operating expenses
Nonoperating revenues (expenses):Transfer (In)OutInvestment IncomeTotal Nonoperating revenues (expenses):
Change in net assets
Total net assets - beginning (deficit)Total net assets - ending
83
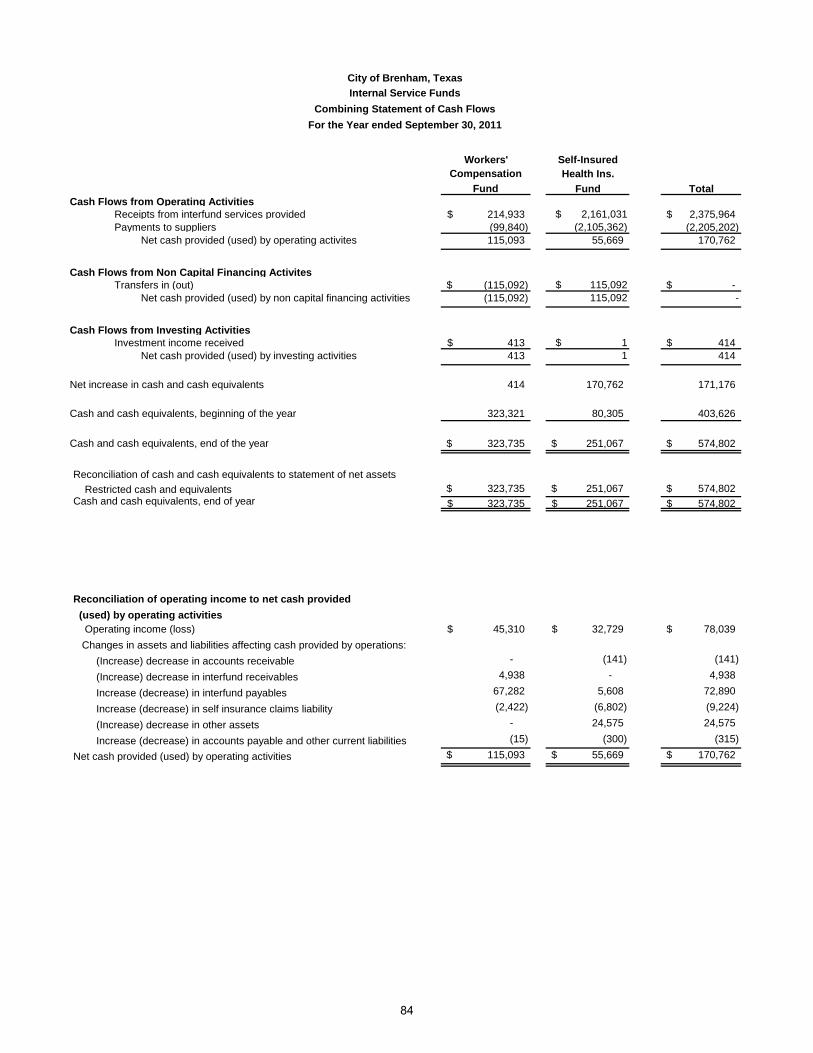
Workers' Self-InsuredCompensation Health Ins.
Fund Fund TotalCash Flows from Operating Activities
Receipts from interfund services provided 214,933$ $ 2,161,031 2,375,964$ Payments to suppliers (99,840) (2,105,362) (2,205,202)
Net cash provided (used) by operating activites 115,093 55,669 170,762
Cash Flows from Non Capital Financing ActivitesTransfers in (out) (115,092)$ $ 115,092 -$
Net cash provided (used) by non capital financing activities (115,092) 115,092 -
Cash Flows from Investing ActivitiesInvestment income received 413$ $ 1 414$
Net cash provided (used) by investing activities 413 1 414
Net increase in cash and cash equivalents 414 170,762 171,176
Cash and cash equivalents, beginning of the year 323,321 80,305 403,626
323,735$ 251,067$ 574,802$
Reconciliation of cash and cash equivalents to statement of net assets Restricted cash and equivalents 323,735$ 251,067$ 574,802$ Cash and cash equivalents, end of year 323,735$ 251,067$ 574,802$
Reconciliation of operating income to net cash provided (used) by operating activities Operating income (loss) 45,310$ 32,729$ 78,039$ Changes in assets and liabilities affecting cash provided by operations: (Increase) decrease in accounts receivable - (141) (141)
(Increase) decrease in interfund receivables 4,938 - 4,938
Increase (decrease) in interfund payables 67,282 5,608 72,890
Increase (decrease) in self insurance claims liability (2,422) (6,802) (9,224)
(Increase) decrease in other assets - 24,575 24,575
Increase (decrease) in accounts payable and other current liabilities (15) (300) (315)
Net cash provided (used) by operating activities 115,093$ 55,669$ 170,762$
Cash and cash equivalents, end of the year
City of Brenham, TexasInternal Service Funds
Combining Statement of Cash FlowsFor the Year ended September 30, 2011
84

Variance withFinal Budget
$ (2,889)(145)
(250,000)5,708
(247,326)
1,302,512 369,825 Principal Retirement 1,548,534 1,623,452 (74,918)
300 (54,868)
2,851,346 2,611,307 240,039
Excess (Deficiency) of Revenues Over (Under) Expenditures (7,287)
77,922 145,685 67,763 - 3,060,619
- - (3,004,387) (3,004,387)123,995
116,708
-
$ 116,708
City of BrenhamDebt Service
Schedule of Revenues, Expenditures, and Changes in Fund Balances - Budget and ActualFor the Year Ended September 30, 2011
Budgeted Amounts
Original Final Actual Amounts
RevenuesTaxes $ 1,601,305 $ 1,601,305 $ 1,598,416 Investment Income 1,400 1,400 1,255
Payment from Component Unit 567,781 567,781 573,489 Payments from Other Governments 250,000 250,000 -
Total revenues 2,420,486 2,420,486 2,173,160
ExpendituresDebt Service:
(430,860) (438,147)
Other Financing Sources (Uses)
Interest and Fiscal Charges 1,302,512 932,687 1,548,534
Issuance Costs 300 55,168
Payment to refunded bond escrow agentTotal other financing sources and (uses)
Total Expenditures 2,851,346
(430,860)
(236,230)
Fund balance - beginning 481,884
Transfer In 77,922 Refunding bonds issued - 3,060,619
481,884 481,884
77,922 77,922 201,917
Fund balance - ending $ 128,946 $ 128,946 $ 245,654
Net change in fund balance (352,938) (352,938)
85
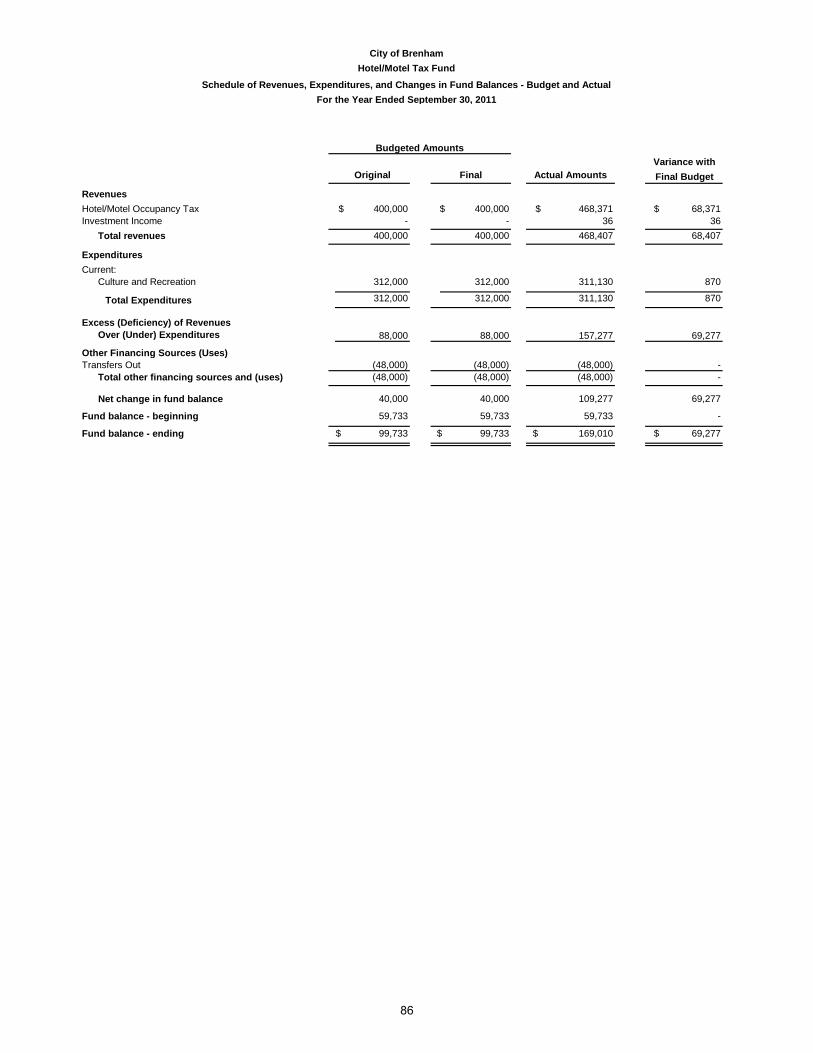
Variance withFinal Budget
$ 68,371 36
68,407
312,000 870
Excess (Deficiency) of Revenues Over (Under) Expenditures 69,277
(48,000)-
69,277
-
$ 69,277
City of BrenhamHotel/Motel Tax Fund
Schedule of Revenues, Expenditures, and Changes in Fund Balances - Budget and ActualFor the Year Ended September 30, 2011
Budgeted Amounts
Original Final Actual Amounts
RevenuesHotel/Motel Occupancy Tax $ 400,000 $ 400,000 $ 468,371 Investment Income - - 36
Total revenues 400,000 400,000 468,407
ExpendituresCurrent:
Culture and Recreation 312,000 311,130
312,000 312,000 311,130 870 Total Expenditures
88,000 88,000 157,277
Other Financing Sources (Uses)Transfers Out (48,000) (48,000) -
Total other financing sources and (uses) (48,000) (48,000) (48,000)
Net change in fund balance 40,000 40,000 109,277
Fund balance - beginning 59,733 59,733 59,733
Fund balance - ending $ 99,733 $ 99,733 $ 169,010
86
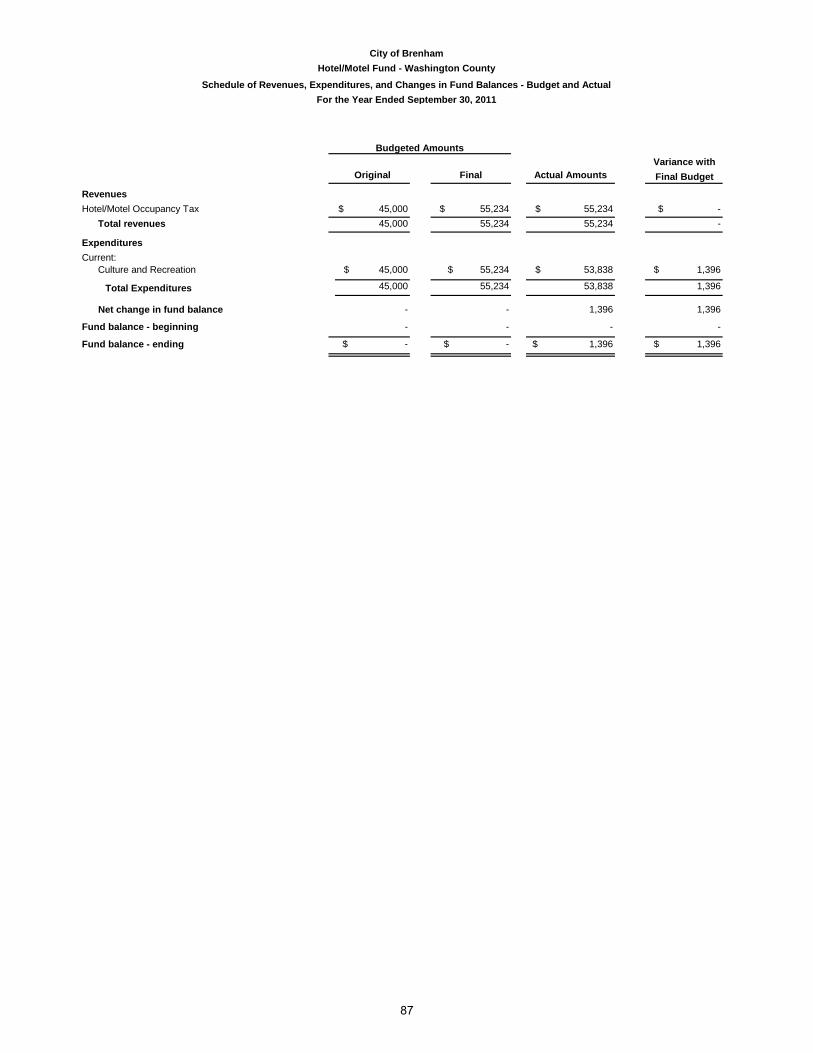
Variance withFinal Budget
$ - -
$ 55,234 $ 1,396
1,396
-
$ 1,396
City of BrenhamHotel/Motel Fund - Washington County
Schedule of Revenues, Expenditures, and Changes in Fund Balances - Budget and ActualFor the Year Ended September 30, 2011
Budgeted Amounts
Original Final Actual Amounts
RevenuesHotel/Motel Occupancy Tax $ 45,000 $ 55,234 $ 55,234
Total revenues 45,000 55,234 55,234
ExpendituresCurrent:
Culture and Recreation $ 45,000 $ 53,838
45,000 55,234 53,838 1,396 Total Expenditures
Net change in fund balance - - 1,396
Fund balance - beginning - - -
Fund balance - ending $ - $ - $ 1,396
87

Variance with Final Budget
$ (163) (6,819)
(6,982)
8,500 7,312
Excess (Deficiency) of Revenues Over (Under) Expenditures 330
330
-
$ 330
Original Final Actual Amounts
City of BrenhamPD Criminal Law Enforcement Fund
Schedule of Revenues, Expenditures, and Changes in Fund Balances - Budget and ActualFor the Year Ended September 30, 2011
Budgeted Amounts
$ 37 Program Income/Restitution 10,000 10,000 3,181
RevenuesInvestment Income $ 200 $ 200
Total revenues 10,200 10,200 3,218
Expenditures
1,700 1,700 2,030
Public Safety 8,500 1,188
8,500 8,500 1,188
Current:
7,312 Total Expenditures
Net change in fund balance 1,700 1,700 2,030
Fund balance - beginning 28,548 28,548 28,548
Fund balance - ending $ 30,248 $ 30,248 $ 30,578
88
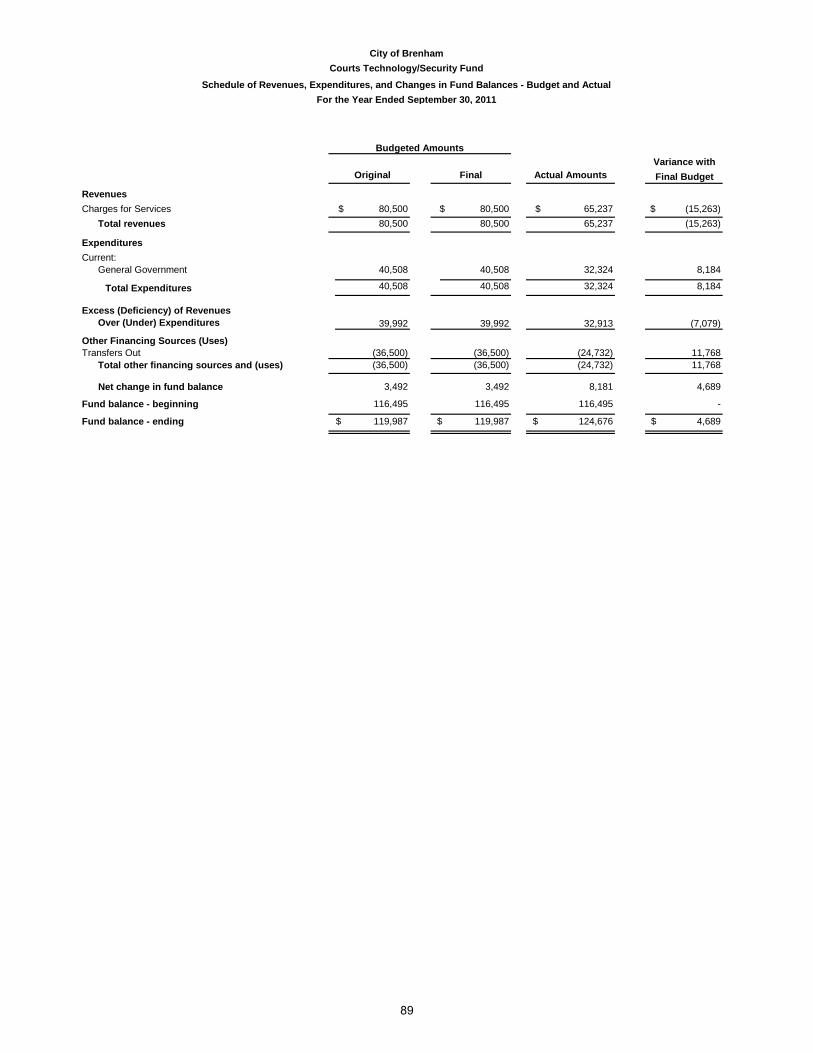
Variance withFinal Budget
$ (15,263)(15,263)
40,508 8,184
Excess (Deficiency) of Revenues Over (Under) Expenditures (7,079)
(36,500)11,768
4,689
-
$ 4,689
Fund balance - beginning 116,495 116,495 116,495
Fund balance - ending $ 119,987 $ 119,987 $ 124,676
Total other financing sources and (uses) (36,500) (36,500) (24,732)
Net change in fund balance 3,492 3,492 8,181
Other Financing Sources (Uses)Transfers Out (36,500) (24,732) 11,768
8,184 Total Expenditures
39,992 39,992 32,913
40,508 40,508 32,324
General Government 40,508 32,324
Total revenues 80,500 80,500 65,237
ExpendituresCurrent:
RevenuesCharges for Services $ 80,500 $ 80,500 $ 65,237
City of BrenhamCourts Technology/Security Fund
Schedule of Revenues, Expenditures, and Changes in Fund Balances - Budget and ActualFor the Year Ended September 30, 2011
Budgeted Amounts
Original Final Actual Amounts
89
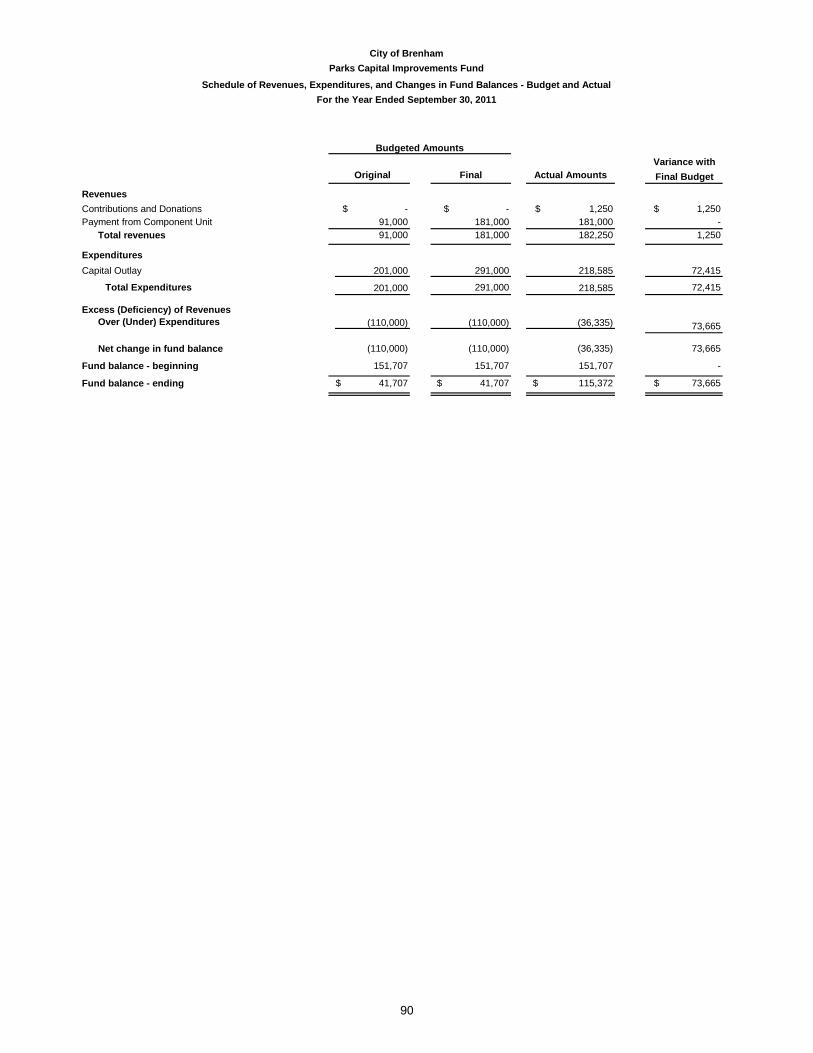
Variance withFinal Budget
$ 1,250 181,000
1,250
291,000 72,415 291,000 72,415
Excess (Deficiency) of Revenues Over (Under) Expenditures
73,665
-
$ 73,665
City of BrenhamParks Capital Improvements Fund
Schedule of Revenues, Expenditures, and Changes in Fund Balances - Budget and ActualFor the Year Ended September 30, 2011
Budgeted Amounts
Original Final Actual Amounts
RevenuesContributions and Donations $ - $ - $ 1,250 Payment from Component Unit 91,000 181,000 -
Total revenues 91,000 181,000 182,250
ExpendituresCapital Outlay 201,000 218,585
201,000 218,585 Total Expenditures
(110,000) (110,000) (36,335) 73,665
Net change in fund balance (110,000) (110,000) (36,335)
Fund balance - beginning 151,707 151,707 151,707
Fund balance - ending $ 41,707 $ 41,707 $ 115,372
90

Variance withFinal Budget
$ 2,789 2,789
Highways and Streets 15,200,000
223,000 (11,847)
Excess (Deficiency) of Revenues Over (Under) Expenditures 5,111,924
100,000 -
15,690,000 (532,563)
4,579,361
-
$ 4,579,361
Issuance Costs 223,000 255,146 (32,146)
City of BrenhamUS 290 Pass Thru Finance Fund
Schedule of Revenues, Expenditures, and Changes in Fund Balances - Budget and ActualFor the Year Ended September 30, 2011
Budgeted Amounts
Original
8,500 8,500 11,289
Final Actual Amounts
RevenuesInvestment Income $ 8,500 $ 8,500 $ 11,289
Current:15,200,000
Total revenues
(11,847)Total Expenditures
(15,414,500) (15,414,500) (10,302,576)
Expenditures
Capital Outlay - - 11,847
375,500 4,954,861
Other Financing Sources (Uses)
Bond Proceeds 15,690,000 15,325,116
Fund balance - ending $ 824,582 $ 824,582 $ 5,403,943
(364,884)Total other financing sources and (uses) 15,790,000 15,790,000 15,257,437
375,500
Transfers Out - (67,679) (67,679)
Net change in fund balance
Fund balance - beginning 449,082 449,082 449,082
10,046,872 5,153,128 Debt Service:
Transfers In 100,000 - (100,000)
15,423,000 15,423,000 10,313,865
91

Variance withFinal Budget
$ 16,817 (2,355)
(100,419)(85,957)
208,886 17,109
22,331 -48,893 -
- 21,095 - 21,095 99,431 (104,061)
Excess (Deficiency) of Revenues Over (Under) Expenditures (151,814)
(965,281) (5,708)-
772,558 (5,708)
(157,522)
-
($ 157,522)
Net change in fund balance - component unit
Amounts reported for component unit in the statement of activites are different because:
The net effect of miscellaneous transactions involving capital assets(i.e. purchase) is to increase net assets.
Donation of land 25,713 Construction in progress additions 203,492
The net effect of miscellaneous transactions involving capital assets(i.e. sale) is to decrease net assets.
Sale of land (307,003)
Bond principal payments are expenditures in the component unit, but they reducelong term liabilities in the statement of net assets. 48,893
Some expenses reported in the statement of activities do not require the use of currentfinancial resources and, therefore, are not reported as expenditures in governmental funds.
Accrued interest payable (55,649)
Change in net assets of component unit
City of BrenhamBrenham Community Development Corporation Fund
Schedule of Revenues, Expenditures, and Changes in Fund Balances - Budget and ActualFor the Year Ended September 30, 2011
Budgeted Amounts
Original Final Actual Amounts
RevenuesTaxes $ 1,241,481 $ 1,241,481 $ 1,258,298 Investment Income 4,000 4,000 1,645 Miscellaneous - 384,809 284,390
Total revenues 1,245,481 1,630,290 1,544,333
ExpendituresCurrent:
Economic Development 295,386 191,777 Debt Service:
Interest and Fiscal Charges 22,331 22,331 Principal Retirement 48,893 48,893
Capital Outlay 20,090 203,492 Bond Issue Costs
386,700 400,636 466,493
751,463
(65,857)Total Expenditures
858,781 1,229,654 1,077,840
$ 858,314
Total other financing sources and (uses) (858,781) (192,723) (219,526)
Other Financing Sources (Uses)Payment to Primary Government (858,781) (970,989)
-
$ 773,760
Fund balance - beginning 551,159 551,159 551,159
751,463 Proceeds from Bonds - - (772,558)
Fund balance - ending $ 551,159 $ 1,588,090 $ 1,409,473
Payment from Primary Government
Net change in fund balance - 1,036,931 858,314
92


REPORTS FOR MANAGEMENT SECTION
CITY OF BRENHAM
The reports for management provide additional detailed information about the City's expenses, revenues, rates, and customers.
- Government-wide Expenses by Function
- Government-wide Revenues
- General Governmental Expenditures by Function
- Reconciliation of Property Tax Receivable
- Revenues by Source - Governmental Funds
- Ratio of Annual Debt Service Expenditures for General Obligation Bonded Debt to General Governmental Expenditures
- Property Value and Construction
- Revenues by Source - Business Type Activities
- Electric Customers, Consumption, and Sales
- Gas Customers, Consumption, and Sales
- Electric Rates
- The Sewer System - Utility Billing Statistics
- The Sanitation System - Utility Billing Statistics
- Gas Rates
- Ten Largest Electric Customers
- Ten Largest Gas Customers
- The Water System - Utility Billing Statistics
93

GOVERNMENT-WIDE EXPENSES BY FUNCTION CITY OF BRENHAMLast Nine Fiscal Years
Fiscal Year
General Government Public Safety
Highways and Streets
Health and Welfare
Economic Develop-
mentCulture and Recreation
Interest on Long-term
Debt Electric Gas Water Wasterwater Sanitation
2003 1,099,474$ 4,255,750$ 1,548,837$ 554,797$ 269,685$ 2,897,340$ 696,557$ 18,431,275$ 5,023,642$ 2,439,366$ 2,559,845$ 1,689,275$ 2004 1,071,441 4,399,037 1,544,154 569,459 3,417 2,802,023 758,226 19,621,793 4,537,389 2,557,248 2,656,350 2,007,536 2005 1,930,824 4,174,264 1,569,656 218,987 - 2,903,509 743,699 20,843,491 5,225,571 2,732,815 2,944,784 2,062,243 2006 1,993,032 4,719,613 1,637,165 624,350 - 3,047,778 709,650 25,991,891 6,027,066 3,162,284 3,544,654 2,309,317 2007 1,888,188 5,028,102 2,279,505 580,118 - 3,264,409 991,486 23,342,221 5,646,666 3,164,010 3,559,574 2,331,316 2008 2,001,542 5,235,849 2,302,230 545,485 - 3,607,684 952,463 26,690,324 5,975,923 3,405,073 3,803,759 2,621,5382009 5,241,430 5,414,468 2,410,013 271,509 - 3,585,647 918,260 22,428,215 2,905,012 3,316,393 3,286,770 2,464,1422010 5,755,450 6,831,143 2,679,468 299,216 - 3,676,194 855,569 22,259,716 3,198,740 3,088,039 2,979,406 2,669,6782011 5,177,514 6,579,061 2,628,682 288,699 - 3,513,628 938,663 23,962,803 2,602,842 3,430,862 2,860,922 2,706,750
The City of Brenham first applied GASB Statement No. 34 in fiscal year 2003; therefore, government wide financial information for years prior to fiscal year 2003 is not available.
94
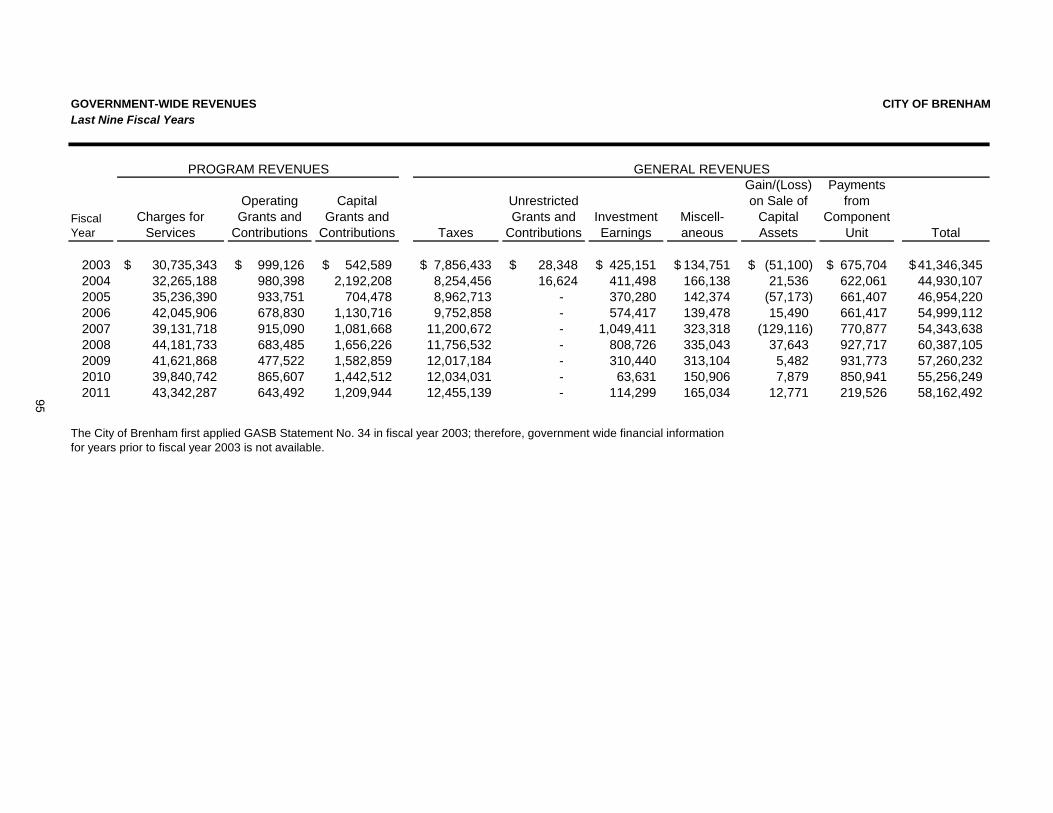
GOVERNMENT-WIDE REVENUES CITY OF BRENHAMLast Nine Fiscal Years
Fiscal Year
Charges for Services
Operating Grants and
Contributions
Capital Grants and
Contributions Taxes
Unrestricted Grants and
ContributionsInvestment Earnings
Miscell- aneous
Gain/(Loss) on Sale of
Capital Assets
Payments from
Component Unit Total
2003 30,735,343$ 999,126$ 542,589$ 7,856,433$ 28,348$ 425,151$ 134,751$ (51,100)$ 675,704$ 41,346,345$ 2004 32,265,188 980,398 2,192,208 8,254,456 16,624 411,498 166,138 21,536 622,061 44,930,107 2005 35,236,390 933,751 704,478 8,962,713 - 370,280 142,374 (57,173) 661,407 46,954,220 2006 42,045,906 678,830 1,130,716 9,752,858 - 574,417 139,478 15,490 661,417 54,999,112 2007 39,131,718 915,090 1,081,668 11,200,672 - 1,049,411 323,318 (129,116) 770,877 54,343,638 2008 44,181,733 683,485 1,656,226 11,756,532 - 808,726 335,043 37,643 927,717 60,387,105 2009 41,621,868 477,522 1,582,859 12,017,184 - 310,440 313,104 5,482 931,773 57,260,232 2010 39,840,742 865,607 1,442,512 12,034,031 - 63,631 150,906 7,879 850,941 55,256,249 2011 43,342,287 643,492 1,209,944 12,455,139 - 114,299 165,034 12,771 219,526 58,162,492
PROGRAM REVENUES
The City of Brenham first applied GASB Statement No. 34 in fiscal year 2003; therefore, government wide financial information for years prior to fiscal year 2003 is not available.
GENERAL REVENUES
95

GENERAL GOVERNMENTAL EXPENDITURES BY FUNCTION CITY OF BRENHAM
Last Ten Fiscal Years
Highways Health
Fiscal General Public and and Culture & Economic Debt Capital
Year Government Safety Streets Welfare Recreation Development Service Outlay Totals
2002 901,474 4,229,819 1,857,357 613,154 2,590,967 - 1,598,452 2,795,571 14,586,794
2003 980,100 4,021,661 1,032,007 556,746 2,366,423 275,531 1,627,423 3,198,692 14,058,583
2004 974,771 4,164,948 1,070,642 571,160 2,267,690 3,417 1,663,252 4,780,081 15,495,961
2005 1,560,873 4,053,844 1,046,654 214,873 2,374,455 - 1,762,731 1,763,551 12,776,981
2006 1,270,288 4,179,268 1,085,298 614,794 2,467,861 - 1,875,109 2,475,907 13,968,525
2007 1,383,100 4,634,054 1,153,897 562,579 2,611,013 - 2,030,056 3,497,123 15,871,822
2008 1,491,349 4,801,776 1,240,278 535,818 2,993,583 - 2,096,195 2,340,500 15,499,499
2009 4,793,575 5,055,235 1,317,966 262,880 2,963,083 - 2,268,575 9,585,060 26,246,374
2010 4,987,652 5,977,319 1,535,385 281,388 2,985,738 - 2,111,683 2,002,664 19,881,829
2011 4,814,955 5,801,959 11,426,323 278,258 2,860,841 - 2,887,548 1,203,378 29,273,262
NOTE:
1. This table includes expenditures of all governmental fund types of the primary government, which consist of the general, special revenue, debt service, capital
projects, and expendable trust funds.
96

RECONCILIATON OF PROPERTY TAX RECEIVABLES CITY OF BRENHAM
Last Ten Fiscal Years
Additions Collections
Fiscal Beginning Net of Refunds and Ending
Year Balance Adjustments Adjustments Balance
2002 118,450 2,391,892 (2,383,038) 127,304
2003 127,304 2,648,253 (2,624,589) 150,968
2004 150,968 2,827,306 (2,805,850) 172,424
2005 172,424 3,072,218 (3,123,274) 121,368
2006 121,368 3,468,062 (3,443,982) 145,448
2007 145,448 4,109,307 (4,090,608) 164,147
2008 164,147 4,497,853 (4,511,707) 150,293
2009 150,293 4,737,392 (4,727,001) 160,684
2010 160,684 4,957,409 (4,936,977) 181,116
2011 181,116 4,919,898 (4,909,795) 191,219
97

REVENUES BY SOURCE - GOVERNMENTAL FUNDS (1) CITY OF BRENHAMLast Ten Fiscal Years
FISCAL LICENSES & INTER- CHARGES FOR FINES & MISCEL- TOTALYEAR TAXES PERMITS GOVERNMENTAL SERVICES FORFEITURES LANEOUS REVENUES
2002 7,374,952 45,181 1,425,598 283,369 217,342 860,259 10,206,7012003 7,832,768 43,572 1,269,907 331,505 216,255 1,090,139 10,784,1462004 8,233,000 57,574 2,094,325 401,130 300,235 1,985,022 13,071,2862005 9,013,770 57,846 1,596,241 396,353 344,076 1,001,261 12,409,5472006 9,728,777 56,146 1,656,366 363,984 337,014 1,202,119 13,344,4062007 11,181,972 54,487 1,648,201 368,861 363,253 1,553,226 15,170,0002008 11,770,388 58,260 769,904 458,378 493,664 1,713,621 15,264,2152009 12,006,792 61,989 1,462,232 571,177 594,840 1,301,275 15,998,3052010 12,013,599 76,999 1,817,216 603,568 668,762 1,149,059 16,329,2032011 12,445,035 64,465 696,256 558,484 766,908 1,216,432 15,747,580
(1) This table includes revenues of all governmental fund types of the primary government, which consists of the general, special revenue, debt service, capital projects, and expendable trust funds.
98
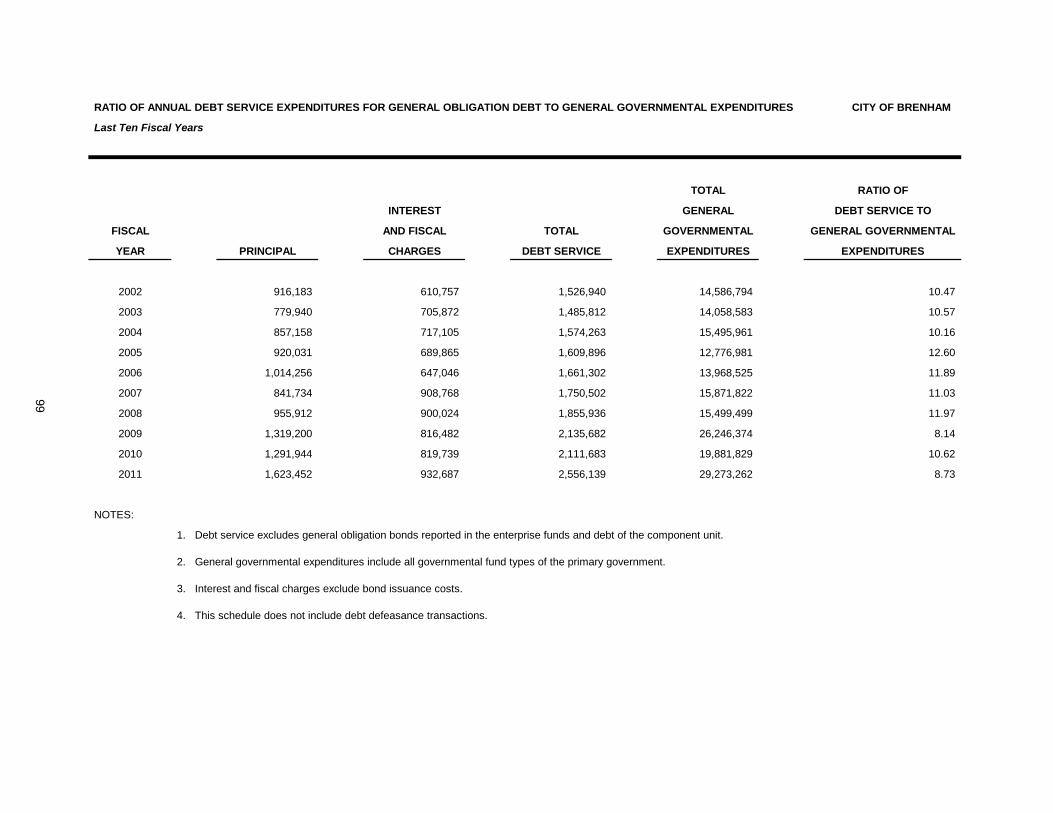
RATIO OF ANNUAL DEBT SERVICE EXPENDITURES FOR GENERAL OBLIGATION DEBT TO GENERAL GOVERNMENTAL EXPENDITURES CITY OF BRENHAM
Last Ten Fiscal Years
TOTAL RATIO OF
INTEREST GENERAL DEBT SERVICE TO
FISCAL AND FISCAL TOTAL GOVERNMENTAL GENERAL GOVERNMENTAL
YEAR PRINCIPAL CHARGES DEBT SERVICE EXPENDITURES EXPENDITURES
2002 916,183 610,757 1,526,940 14,586,794 10.47
2003 779,940 705,872 1,485,812 14,058,583 10.57
2004 857,158 717,105 1,574,263 15,495,961 10.16
2005 920,031 689,865 1,609,896 12,776,981 12.60
2006 1,014,256 647,046 1,661,302 13,968,525 11.89
2007 841,734 908,768 1,750,502 15,871,822 11.03
2008 955,912 900,024 1,855,936 15,499,499 11.97
2009 1,319,200 816,482 2,135,682 26,246,374 8.14
2010 1,291,944 819,739 2,111,683 19,881,829 10.62
2011 1,623,452 932,687 2,556,139 29,273,262 8.73
NOTES:
1. Debt service excludes general obligation bonds reported in the enterprise funds and debt of the component unit.
2. General governmental expenditures include all governmental fund types of the primary government.
3. Interest and fiscal charges exclude bond issuance costs.
4. This schedule does not include debt defeasance transactions.
99

PROPERTY VALUE AND CONSTRUCTION CITY OF BRENHAM
Last Ten Fiscal Years
NET RESIDENTIAL COMMERCIAL DEMOLITION RELOCATION TOTAL
TAXABLE
FISCAL PROPERTY NUMBER NUMBER NUMBER NUMBER NUMBER
YEAR VALUE OF UNITS VALUE OF UNITS VALUE OF UNITS VALUE OF UNITS VALUE OF UNITS VALUE
2002 606,171,712 182 13,438,167 125 11,598,574 6 57,875 9 56,000 322 25,151,116
2003 643,396,615 160 6,727,442 102 9,811,858 9 49,328 1 19,150 272 16,607,778
2004 686,861,013 136 6,296,904 127 44,482,180 4 11,250 6 31,200 273 50,821,534
2005 705,780,613 186 13,396,626 124 23,887,960 10 26,514 7 42,860 327 37,353,960
2006 742,413,700 212 13,094,207 136 13,189,145 12 95,875 13 65,980 373 26,445,207
2007 797,156,826 215 13,832,035 137 12,817,681 7 198,800 8 71,500 367 26,920,016
2008 879,817,843 224 11,320,174 135 18,898,102 7 110,673 18 22,800 384 30,351,749
2009 945,811,445 241 12,664,897 101 16,088,855 4 5,500 8 44,000 354 28,803,252
2010 982,776,938 218 18,814,016 136 26,768,176 7 84,485 1 15,000 362 45,681,677
2011 975,919,507 210 19,274,211 146 15,613,921 9 36,800 2 39,000 367 34,963,932
100

REVENUES BY SOURCE - BUSINESS TYPE ACTIVITIESLast Ten Fiscal Years
FISCAL TOTALYEAR ELECTRIC GAS WATER WASTEWATER SANITATION REVENUES
2002 18,026,344 3,456,761 1,487,365 1,594,352 2,472,349 27,037,1712003 19,230,844 4,945,353 1,701,153 2,032,243 2,563,880 30,473,4732004 20,468,491 4,412,176 1,993,821 1,953,816 2,690,075 31,518,3792005 22,138,695 4,803,557 2,171,315 2,377,633 2,944,790 34,435,9902006 26,440,575 5,768,269 2,427,160 2,934,281 3,718,368 41,288,6532007 23,184,463 5,639,536 2,468,172 3,798,212 3,254,617 38,345,0002008 26,539,770 6,061,121 2,731,307 4,119,856 3,719,245 43,171,2992009 25,678,975 3,338,384 2,723,637 4,045,839 4,606,941 40,393,7762010 24,387,110 3,740,131 3,898,316 3,552,059 2,913,756 38,491,3722011 26,814,028 3,178,811 5,122,170 3,717,883 3,119,515 41,952,407
CITY OF BRENHAM
101

ELECTRIC CUSTOMERS, CONSUMPTION AND SALES CITY OF BRENHAMLast Ten Fiscal Years
2011 2010 2009 2008 2007 2006 2005 2004 2003 2002Number of customers Residential 5,357 5,337 5,273 5,184 5,061 4,925 4,844 4,828 4,852 4,807 Commercial 1,178 1,154 1,146 1,165 1,191 1,138 1,124 1,111 1,100 1,060 Large commercial 317 308 303 294 288 282 276 274 273 258 Industrial 21 23 23 22 20 26 26 28 29 31 Street lights 1,248 1,238 1,228 1,218 1,205 1,175 1,137 1,135 1,126 1,115 Security lights 165 175 176 177 182 182 178 180 184 183 Total 8,286 8,235 8,150 8,060 7,947 7,728 7,585 7,556 7,564 7,454
Consumption (in KWH) Residential 80,534,797 76,664,387 74,039,837 73,296,005 70,267,796 73,781,005 71,200,173 67,146,651 70,366,417 68,957,930 Commercial 16,835,349 16,364,454 16,334,810 17,061,350 17,089,919 17,756,825 17,639,335 17,006,158 17,616,182 16,970,604 Large commercial 68,446,624 65,006,673 64,052,067 65,162,802 64,226,951 64,242,555 63,440,681 61,690,946 60,934,736 54,909,551 Industrial 122,217,940 111,567,780 115,129,160 133,073,570 148,939,620 157,358,022 154,601,347 146,081,323 152,368,023 160,204,329 Street lights 1,437,576 1,426,728 1,414,248 1,403,016 1,388,136 1,353,480 1,309,704 1,308,072 1,296,802 1,285,032 Security lights 296,472 289,440 278,448 276,192 277,728 280,800 276,576 279,264 284,736 288,768 Total 289,768,758 271,319,462 271,248,570 290,272,935 302,190,150 314,772,687 308,467,816 293,512,414 302,866,896 302,616,214
Sales (1) Residential $ 8,477,097 7,861,811 $ 8,077,592 $ 7,909,221 $ 6,419,733 $ 7,118,275 $ 5,985,305 $ 5,686,795 $ 5,436,951 $ 4,969,097 Commercial 1,829,938 1,727,624 1,838,138 1,877,315 1,607,902 1,760,370 1,526,577 1,478,458 1,393,007 1,252,180 Large commercial 6,195,255 5,662,262 6,055,319 5,979,719 4,867,798 5,253,311 4,388,473 4,270,913 3,784,246 3,320,333 Industrial 9,683,819 8,461,265 9,322,374 10,135,546 9,842,065 11,814,007 9,679,213 8,574,419 8,106,613 8,076,026 Street lights 101,171 95,651 106,217 92,907 81,595 81,238 76,322 76,337 71,278 71,869 Security lights 41,660 40,639 39,090 38,696 39,011 39,525 38,901 39,114 38,603 34,107 Total $ 26,328,940 $ 23,849,252 $ 25,438,730 $ 26,033,404 $ 22,858,104 $ 26,066,726 $ 21,694,791 $ 20,126,036 $ 18,830,698 $ 17,723,612
Annual average consumptionper customer (in KWH) Residential 15,034 14,365 14,041 14,138 13,884 14,981 14,699 13,908 14,503 14,345 Commercial 14,291 14,181 14,254 14,651 14,349 15,604 15,693 15,307 16,015 16,010 Large commercial 215,920 211,061 211,393 221,642 223,010 227,810 229,858 225,149 223,204 212,828 Industrial 5,819,902 4,850,773 5,005,616 6,048,799 7,446,981 6,052,232 5,946,206 5,217,190 5,254,070 5,167,882 Street lights 1,152 1,152 1,152 1,152 1,152 1,152 1,152 1,152 1,152 1,152 Security lights 1,797 1,654 1,582 1,562 1,526 1,543 1,554 1,551 1,547 1,578
Monthly average billper customer Residential $ 132 123 128 127 106 120 103 98 93 86 Commercial 129 125 134 134 113 129 113 111 106 98 Large commercial 1,629 1,532 1,665 1,695 1,409 1,552 1,325 1,299 1,155 1,072 Industrial 38,428 30,657 33,777 38,392 41,009 37,865 31,023 25,519 23,295 21,710 Street lights 7 6 7 6 6 6 6 6 5 5 Security lights 21 19 19 18 18 18 18 18 17 16
Average price per KWH purchased 0.0637 0.0637 0.0626 0.0691 0.0557 0.0650 0.0501 0.0480 0.0441 0.0411Average price per KWH sold 0.0909 0.0879 0.0938 0.0896 0.0756 0.0828 0.0703 0.0686 0.0622 0.0586
% line loss 5.83% 5.83% 5.14% 5.32% 4.52% 4.06% 5.19% 5.33% 5.37% 4.35%
(1) Sales reflect KWH sold and do not include charges for other services.
FISCAL YEAR
102
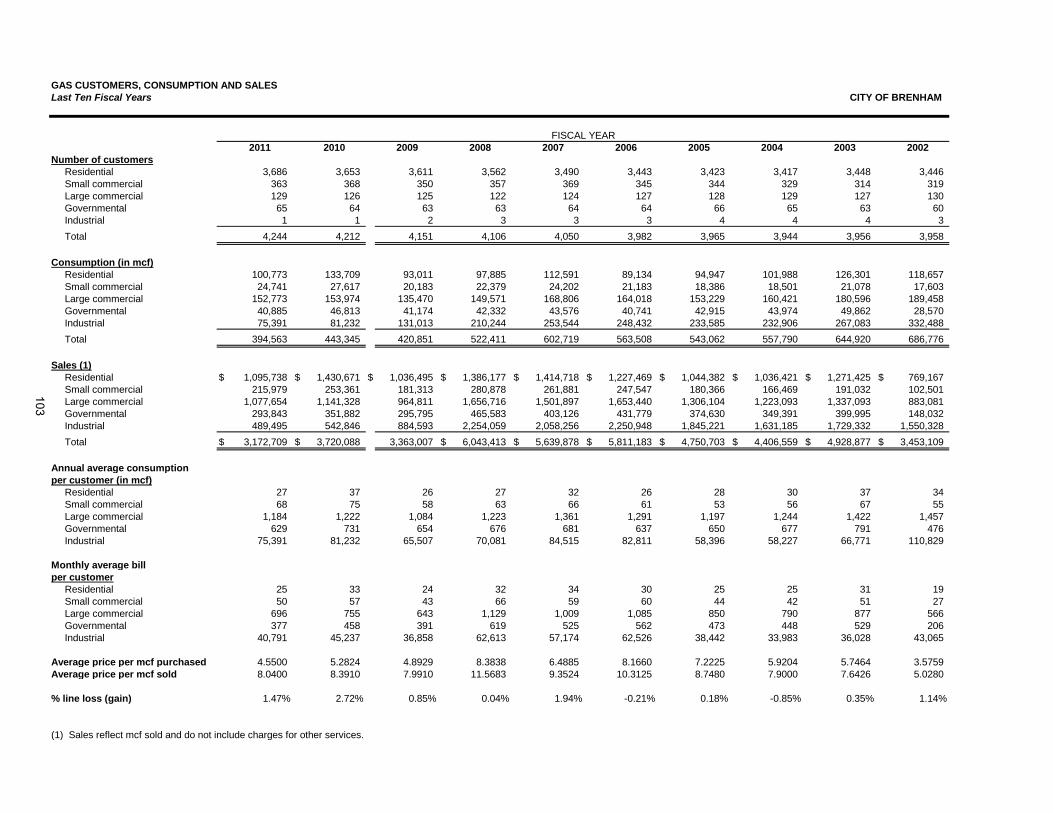
GAS CUSTOMERS, CONSUMPTION AND SALESLast Ten Fiscal Years CITY OF BRENHAM
2011 2010 2009 2008 2007 2006 2005 2004 2003 2002Number of customers Residential 3,686 3,653 3,611 3,562 3,490 3,443 3,423 3,417 3,448 3,446 Small commercial 363 368 350 357 369 345 344 329 314 319 Large commercial 129 126 125 122 124 127 128 129 127 130 Governmental 65 64 63 63 64 64 66 65 63 60 Industrial 1 1 2 3 3 3 4 4 4 3 Total 4,244 4,212 4,151 4,106 4,050 3,982 3,965 3,944 3,956 3,958
Consumption (in mcf) Residential 100,773 133,709 93,011 97,885 112,591 89,134 94,947 101,988 126,301 118,657 Small commercial 24,741 27,617 20,183 22,379 24,202 21,183 18,386 18,501 21,078 17,603 Large commercial 152,773 153,974 135,470 149,571 168,806 164,018 153,229 160,421 180,596 189,458 Governmental 40,885 46,813 41,174 42,332 43,576 40,741 42,915 43,974 49,862 28,570 Industrial 75,391 81,232 131,013 210,244 253,544 248,432 233,585 232,906 267,083 332,488 Total 394,563 443,345 420,851 522,411 602,719 563,508 543,062 557,790 644,920 686,776
Sales (1) Residential $ 1,095,738 $ 1,430,671 $ 1,036,495 $ 1,386,177 $ 1,414,718 $ 1,227,469 $ 1,044,382 $ 1,036,421 $ 1,271,425 $ 769,167 Small commercial 215,979 253,361 181,313 280,878 261,881 247,547 180,366 166,469 191,032 102,501 Large commercial 1,077,654 1,141,328 964,811 1,656,716 1,501,897 1,653,440 1,306,104 1,223,093 1,337,093 883,081 Governmental 293,843 351,882 295,795 465,583 403,126 431,779 374,630 349,391 399,995 148,032 Industrial 489,495 542,846 884,593 2,254,059 2,058,256 2,250,948 1,845,221 1,631,185 1,729,332 1,550,328 Total $ 3,172,709 $ 3,720,088 3,363,007 $ 6,043,413 $ 5,639,878 $ 5,811,183 $ 4,750,703 $ 4,406,559 $ 4,928,877 $ 3,453,109
Annual average consumptionper customer (in mcf) Residential 27 37 26 27 32 26 28 30 37 34 Small commercial 68 75 58 63 66 61 53 56 67 55 Large commercial 1,184 1,222 1,084 1,223 1,361 1,291 1,197 1,244 1,422 1,457 Governmental 629 731 654 676 681 637 650 677 791 476 Industrial 75,391 81,232 65,507 70,081 84,515 82,811 58,396 58,227 66,771 110,829
Monthly average billper customer Residential 25 33 24 32 34 30 25 25 31 19 Small commercial 50 57 43 66 59 60 44 42 51 27 Large commercial 696 755 643 1,129 1,009 1,085 850 790 877 566 Governmental 377 458 391 619 525 562 473 448 529 206 Industrial 40,791 45,237 36,858 62,613 57,174 62,526 38,442 33,983 36,028 43,065
Average price per mcf purchased 4.5500 5.2824 4.8929 8.3838 6.4885 8.1660 7.2225 5.9204 5.7464 3.5759Average price per mcf sold 8.0400 8.3910 7.9910 11.5683 9.3524 10.3125 8.7480 7.9000 7.6426 5.0280
% line loss (gain) 1.47% 2.72% 0.85% 0.04% 1.94% -0.21% 0.18% -0.85% 0.35% 1.14%
(1) Sales reflect mcf sold and do not include charges for other services.
FISCAL YEAR
103

ELECTRIC RATES (1) CITY OF BRENHAMImpacting Last Ten Fiscal Years
EFFECTIVE SINGLE THREE SINGLE THREE SINGLE THREE SMALL LARGEDATE CHARGES PHASE PHASE PHASE PHASE PHASE PHASE INDUSTRIAL INDUSTRIAL
Sep-25-1995 Customer charge $11.59 $20.05 $15.00 $25.95 $40.36 $69.83 $100.00 $100.00Demand charge - - - - $6.30 $6.30 - -Non-coincident demand charge - - - - - - $1.7930 $1.7930On peak demand charge - - - - - - $9.0610 $9.0610Off peak demand charge - - - - - - $6.4650 $6.4650KVA - - - - - - $0.240 $0.181
Apr-01-2002 Customer charge $11.60 $20.00 $15.00 $26.00 $40.00 $70.00 $100.00 $100.00Wires charge (per KWH) $0.02290 $0.02290 $0.02200 $0.02200 $0.01510 $0.01510 $0.00896 $0.00636
Sep-22-2002 Customer charge $11.60 $20.00 $15.00 $26.00 $40.00 $70.00 $100.00 $100.00Wires charge (per KWH) $0.02510 $0.02510 $0.02420 $0.02420 $0.01640 $0.01640 $0.00993 $0.00700
Jan-01-2003 Customer charge $11.60 $20.00 $15.00 $26.00 $40.00 $70.00 $100.00 $100.00Wires charge (per KWH) $0.02520 $0.02520 $0.02430 $0.02430 $0.01650 $0.01650 $0.00993 $0.00700
(1) Rates reflect base charges excluding the energy charge which is the cost of energy passed directly through to the customer. Customers are also assessed charges for adjustments in generation charges as needed.
RESIDENTIAL SMALL COMMERCIAL LARGE COMMERCIAL
104

GAS RATES CITY OF BRENHAMImpacting Last Ten Fiscal Years
EFFECTIVE LARGE GOVERN-DATE CHARGES URBAN RURAL URBAN RURAL URBAN RURAL URBAN RURAL INDUSTRIAL MENTAL
Oct-01-1995 First 1 mcf (Min) (1) $5.30 $7.95 $5.30 $7.95 - - - - - -Next 4 mcf $2.42 $3.62 $2.42 $3.62 - - - - - -Next 10 mcf $1.89 $3.84 $1.89 $3.84 - - - - - -All additional mcf $1.58 $2.36 $1.58 $2.36 $0.80 $1.20 $0.80 $1.20 - -
Minimum bill (1) $5.30 $7.95 $5.30 $7.95 $28.80 $43.20 $28.80 $43.20 - -First 30 mcf (Min) (1) - - - - $1.01 $43.20 $1.01 $43.20 - -
All mcf (1) - - - - - - - - $0.69 -
All mcf - urban (1) - - - - - - - - - $1.01All mcf - rural (1) - - - - - - - - - $1.51
Feb-22-1999 Customer charge $5.30 $6.10 $5.30 $6.10 $28.80 $33.12 $28.80 $33.12 $28.80 $28.80Gas charge per mcf (2) $3.52600 $3.75800 $3.52600 $3.75800 $3.17700 $3.35400 $3.17700 $3.35400 $2.87200 $3.29700
Sep-22-2002 Customer charge $6.16 $7.09 $6.16 $7.09 $33.50 $38.52 $33.50 $38.52 $33.50 $33.50Gas charge per mcf (2) $3.73100 $3.99400 $3.73100 $3.99400 $3.33600 $3.53700 $3.33600 $3.53700 $2.98600 $3.46200
Sep-22-2004 Customer charge $7.29 $8.39 $7.29 $8.39 $39.63 $45.57 $39.63 $45.57 $39.63 $39.63Gas charge per mcf (2) $4.00000 $4.30300 $4.00000 $4.30300 $3.54400 $3.77500 $3.54400 $3.77500 $3.13400 $3.67700
Feb-22-2006 Customer charge $7.29 $8.39 $7.29 $8.39 $39.63 $45.57 $39.63 $45.57 $39.63 $39.63Gas charge per mcf (2) $9.66500 $9.96800 $9.66500 $9.96800 $9.20900 $9.44000 $9.20900 $9.44000 $8.79900 $9.34200
Dec-08-2006 Customer charge $8.00 $9.20 $8.00 $9.20 $45.00 $51.75 $45.00 $51.75 $45.00 $45.00Gas charge per mcf (2) $10.53100 $10.93000 $10.53100 $10.93000 $9.79100 $10.07900 $9.79100 $10.07900 $9.68500 $9.52300
(1) In addition to the base charges, each customer's monthly bill includes a gas fuel adjustment charge per mcf.
(2) In addition to the appropriate base rate charge, each customer shall pay a Gas Cost Adjustment Charge to recover those costs of purchasing gas on a wholesale basis, which exceed the allowance provided for the cost of gas within the base rate.
RESIDENTIAL SMALL COMMERCIAL LARGE COMMERCIAL SMALL INDUSTRIAL
105

TEN LARGEST ELECTRIC CUSTOMERS CITY OF BRENHAMCurrent Year and Nine Years Ago
PERCENTAGE PERCENTAGEOF TOTAL CITY OF TOTAL CITY
ELECTRIC ELECTRIC ELECTRIC ELECTRICNAME BILLINGS CHARGES NAME BILLINGS CHARGES
Blue Bell Creameries $ 3,888,134 14.77% Mount Vernon Mills, Inc. $ 2,259,554 12.75%Blinn College 1,190,424 4.52% Blue Bell Creameries 2,144,976 12.10%City of Brenham 1,144,201 4.35% City of Brenham 690,206 3.89%Valmont/Als - Abated 1,098,388 4.17% Blinn 617,696 3.49%BISD 816,702 3.10% Valmont/Als 589,520 3.33%StanPac USA 655,101 2.49% Cleaners Hanger Company 420,878 2.37%Brenham State Supported Living 615,203 2.34% Brenham State Supported Living 369,243 2.08%Scott & White Hospital - Brenham 515,082 1.96% Brenham Wholesale Grocery 241,957 1.37%Brenham Wholesale Grocery 363,584 1.38% Germania Insurance 207,279 1.17%Germania Insurance 347,019 1.32% Trinity Medical Center 199,158 1.12%Total $ 10,633,838 40.39% Total $ 7,740,468 43.67%
2011 Total Electric Charges $ 26,328,940 2002 Total Electric Charges $ 17,723,612
2011 2002
106
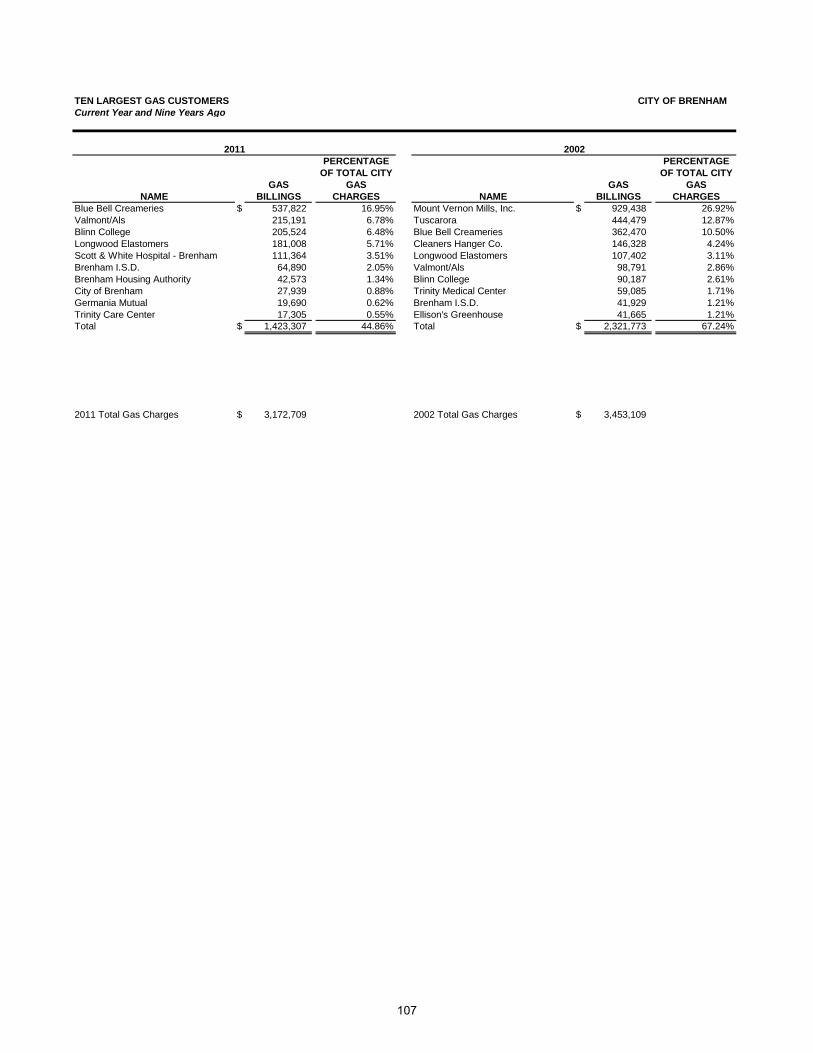
TEN LARGEST GAS CUSTOMERS CITY OF BRENHAMCurrent Year and Nine Years Ago
PERCENTAGE PERCENTAGEOF TOTAL CITY OF TOTAL CITY
GAS GAS GAS GASNAME BILLINGS CHARGES NAME BILLINGS CHARGES
Blue Bell Creameries $ 537,822 16.95% Mount Vernon Mills, Inc. $ 929,438 26.92%Valmont/Als 215,191 6.78% Tuscarora 444,479 12.87%Blinn College 205,524 6.48% Blue Bell Creameries 362,470 10.50%Longwood Elastomers 181,008 5.71% Cleaners Hanger Co. 146,328 4.24%Scott & White Hospital - Brenham 111,364 3.51% Longwood Elastomers 107,402 3.11%Brenham I.S.D. 64,890 2.05% Valmont/Als 98,791 2.86%Brenham Housing Authority 42,573 1.34% Blinn College 90,187 2.61%City of Brenham 27,939 0.88% Trinity Medical Center 59,085 1.71%Germania Mutual 19,690 0.62% Brenham I.S.D. 41,929 1.21%Trinity Care Center 17,305 0.55% Ellison's Greenhouse 41,665 1.21%Total $ 1,423,307 44.86% Total $ 2,321,773 67.24%
2011 Total Gas Charges $ 3,172,709 2002 Total Gas Charges $ 3,453,109
2011 2002
107

The Water System - Utility Billing Statistics City of BrenhamCurrent Year and Prior Year
2011 2010 (DEC)/INC
NUMBER OF CUSTOMERSResidential 5,408 5,361 47 Commercial 1,248 1,234 14 Meter on Fire Hydrant 14 9 5 Sprinkler 494 473 21 TOTAL 7,164 7,077 87
CONSUMPTION (in gallons)Residential 469,200,500 356,686,700 112,513,800 Commercial 330,640,800 286,464,400 44,176,400 Meter on Fire Hydrant 6,296,600 2,681,700 3,614,900 Sprinkler 190,224,900 106,915,300 83,309,600 TOTAL 996,362,800 752,748,100 243,614,700
SALES (in dollars)Residential $ 2,410,428 1,906,120 $ 504,308 Commercial 1,401,245 1,241,648 159,597 Meter on Fire Hydrant 46,548 19,634 26,914 Sprinkler 1,075,276 593,904 481,372 TOTAL $ 4,933,497 3,761,306 $ 1,172,191
ANNUAL AVERAGE CONSUMPTION PER CUSTOMERResidential (in gallons) 86,760 66,534 20,226 Commercial 264,937 232,143 32,794 Meter on Fire Hydrant 449,757 297,967 151,790 Sprinkler 385,071 226,037 159,034
MONTHLY AVERAGE BILL PER CUSTOMERResidential $ 37 30 $ 7 Commercial 94 84 10 Meter on Fire Hydrant 277 182 95 Sprinkler 181 105 76
AVERAGE PRICE PER 1000 GALLONS PURCHASED 0.267 0.260 (0.076) AVERAGE PRICE PER 1000 GALLONS SOLD 4.952 4.997 (0.045)
% LINE LOSS 3.53% * 10.50% * -6.97%
*12,249,600 and 12,249,600 gallons respectively unbilled City water usage
Fiscal Year
108
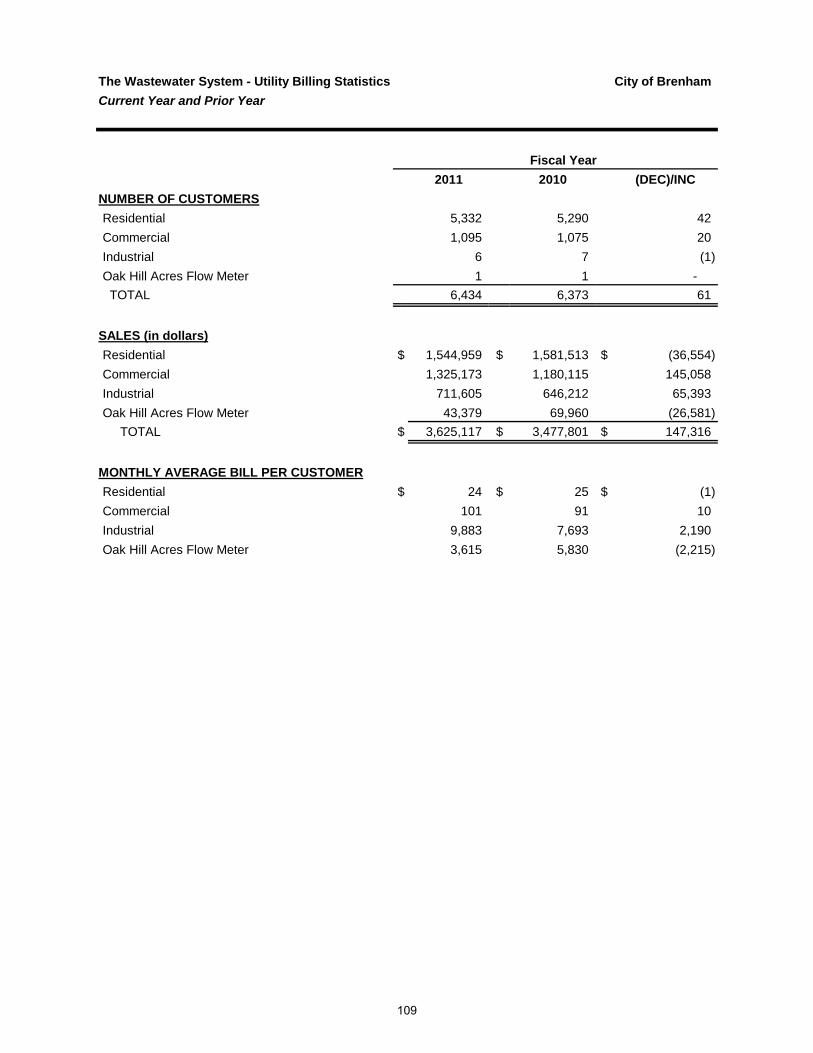
The Wastewater System - Utility Billing Statistics City of BrenhamCurrent Year and Prior Year
2011 2010 (DEC)/INCNUMBER OF CUSTOMERSResidential 5,332 5,290 42 Commercial 1,095 1,075 20 Industrial 6 7 (1) Oak Hill Acres Flow Meter 1 1 - TOTAL 6,434 6,373 61
SALES (in dollars)Residential $ 1,544,959 $ 1,581,513 $ (36,554)Commercial 1,325,173 1,180,115 145,058 Industrial 711,605 646,212 65,393 Oak Hill Acres Flow Meter 43,379 69,960 (26,581) TOTAL $ 3,625,117 $ 3,477,801 $ 147,316
MONTHLY AVERAGE BILL PER CUSTOMERResidential $ 24 $ 25 $ (1)Commercial 101 91 10 Industrial 9,883 7,693 2,190 Oak Hill Acres Flow Meter 3,615 5,830 (2,215)
Fiscal Year
109

The Sanitation System - Utility Billing Statistics City of BrenhamCurrent Year and Prior Year
2011 2010 (DEC)/INC
NUMBER OF CUSTOMERSResidential 5,180 5,069 111 Residential - Rural 5 3 2 Commercial 543 538 5 Dumpster - - - TOTAL 5,728 5,610 118
SALES (in dollars)Residential $ 874,859 $ 857,800 $ 17,059 Residential - Rural 1,216 623 593 Commercial 946,008 918,387 27,621 Dumpster - - - TOTAL $ 1,822,083 $ 1,776,810 $ 45,273
MONTHLY AVERAGE BILL PER CUSTOMERResidential $ 14 $ 14 $ (0) Residential - Rural 20 17 3 Commercial 145 142 3
Fiscal Year
110
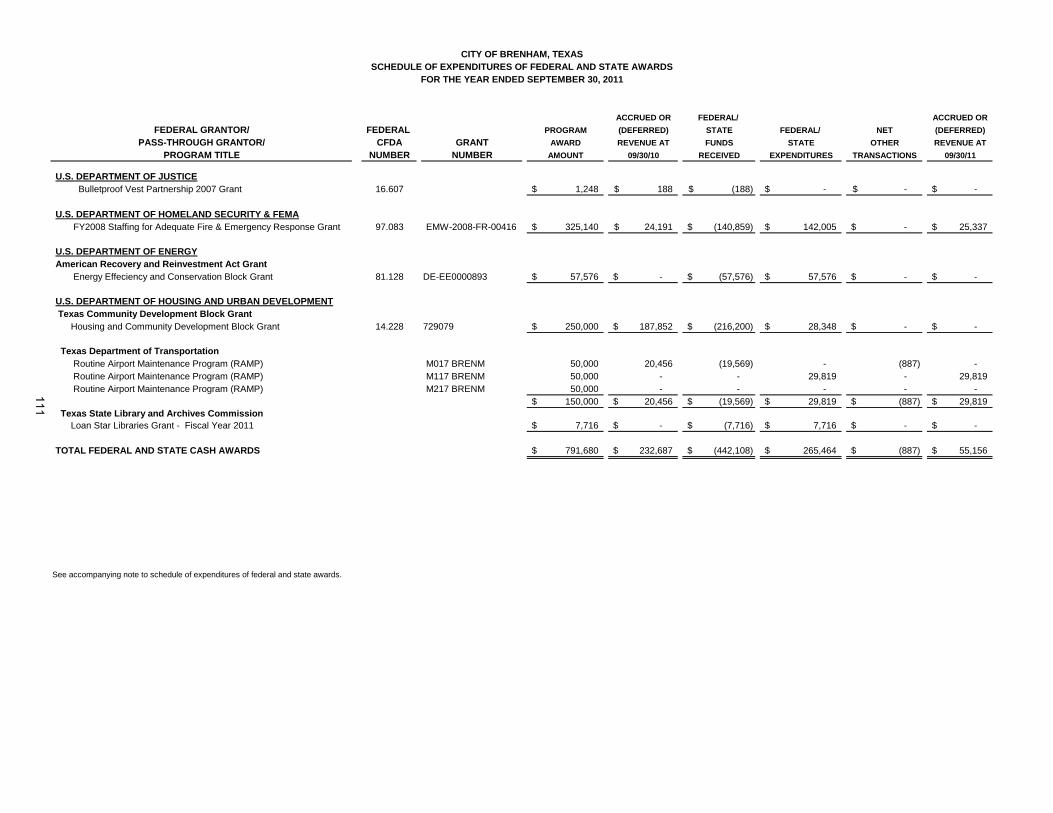
ACCRUED OR FEDERAL/ ACCRUED ORFEDERAL GRANTOR/ FEDERAL PROGRAM (DEFERRED) STATE FEDERAL/ NET (DEFERRED)
PASS-THROUGH GRANTOR/ CFDA GRANT AWARD REVENUE AT FUNDS STATE OTHER REVENUE ATPROGRAM TITLE NUMBER NUMBER AMOUNT 09/30/10 RECEIVED EXPENDITURES TRANSACTIONS 09/30/11
U.S. DEPARTMENT OF JUSTICE Bulletproof Vest Partnership 2007 Grant 16.607 1,248$ 188$ (188)$ -$ -$ -$
U.S. DEPARTMENT OF HOMELAND SECURITY & FEMA FY2008 Staffing for Adequate Fire & Emergency Response Grant 97.083 EMW-2008-FR-00416 325,140$ 24,191$ (140,859)$ 142,005$ -$ 25,337$
U.S. DEPARTMENT OF ENERGYAmerican Recovery and Reinvestment Act Grant Energy Effeciency and Conservation Block Grant 81.128 DE-EE0000893 57,576$ -$ (57,576)$ 57,576$ -$ -$
U.S. DEPARTMENT OF HOUSING AND URBAN DEVELOPMENT Texas Community Development Block Grant Housing and Community Development Block Grant 14.228 729079 250,000$ 187,852$ (216,200)$ 28,348$ -$ -$
Texas Department of Transportation Routine Airport Maintenance Program (RAMP) M017 BRENM 50,000 20,456 (19,569) - (887) - Routine Airport Maintenance Program (RAMP) M117 BRENM 50,000 - - 29,819 - 29,819 Routine Airport Maintenance Program (RAMP) M217 BRENM 50,000 - - - - -
150,000$ 20,456$ (19,569)$ 29,819$ (887)$ 29,819$ Texas State Library and Archives Commission Loan Star Libraries Grant - Fiscal Year 2011 7,716$ -$ (7,716)$ 7,716$ -$ -$
TOTAL FEDERAL AND STATE CASH AWARDS 791,680$ 232,687$ (442,108)$ 265,464$ (887)$ 55,156$
See accompanying note to schedule of expenditures of federal and state awards.
CITY OF BRENHAM, TEXASSCHEDULE OF EXPENDITURES OF FEDERAL AND STATE AWARDS
FOR THE YEAR ENDED SEPTEMBER 30, 2011
111

ACCRUED OR FEDERAL/ ACCRUED ORFEDERAL GRANTOR/ FEDERAL PROGRAM (DEFERRED) STATE FEDERAL/ NET (DEFERRED)
PASS-THROUGH GRANTOR/ CFDA GRANT AWARD REVENUE AT FUNDS STATE OTHER REVENUE ATPROGRAM TITLE NUMBER NUMBER AMOUNT 09/30/10 RECEIVED EXPENDITURES TRANSACTIONS 09/30/11
U.S. DEPARTMENT OF TRANSPORTATION - FAA Texas Department of Transportation (1) Federally Assisted Airport Development Grant RUNWAY 20.106 0717BRENM & 0817BRENM 1,883,357$ -$ (37,603)$ 37,603$ -$ -$
TOTAL NON-CASH FEDERAL AND STATE AWARDS 1,883,357$ -$ (37,603)$ 37,603$ -$ -$
(1) The City remits its matching funds requirements to the State Department of Transportation, which acts as sponsor for these airport development programs. No funds are directly received by the City.
CITY OF BRENHAM, TEXASSCHEDULE OF EXPENDITURES OF FEDERAL AND STATE AWARDS (Continued)
FOR THE YEAR ENDED SEPTEMBER 30, 2011
112

Note 1: Basis of Presentation
The accompanying schedule of expenditures of federal and state awards includes the federal and state grant activity of the City and is presented on the modified accrual basis of accounting.
113

This page intentionally left blank.
114

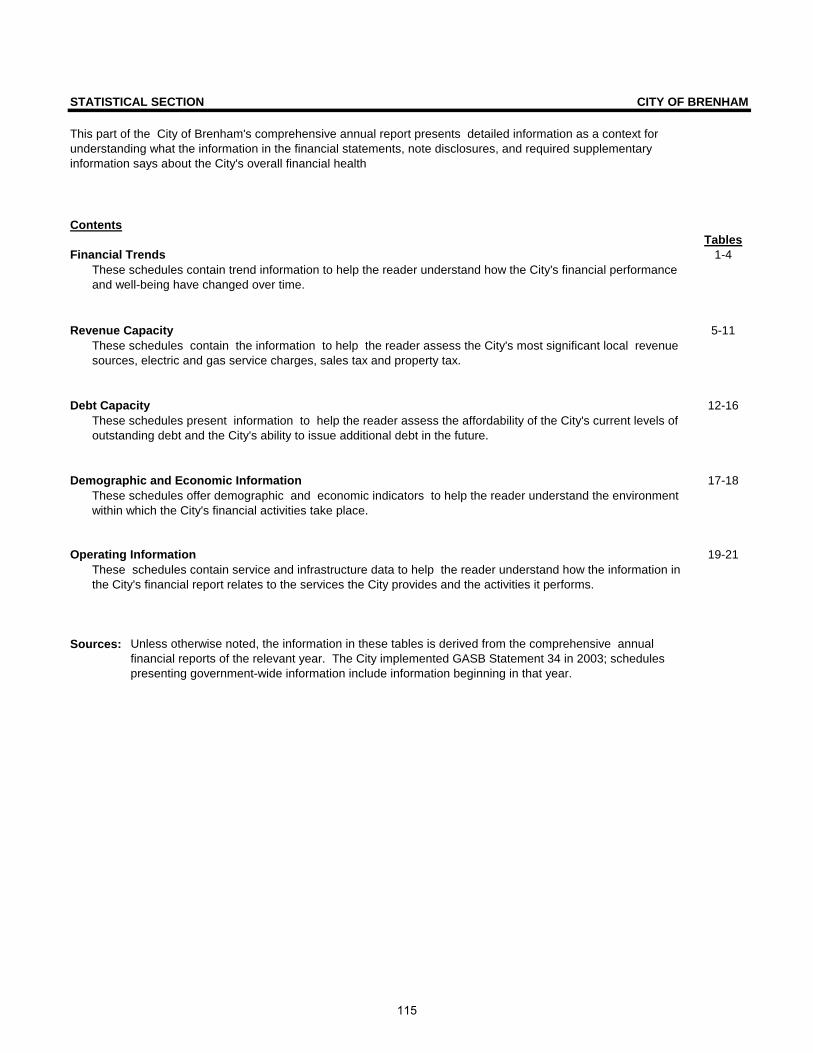
STATISTICAL SECTION
ContentsTables
Financial Trends 1-4
Revenue Capacity 5-11
Debt Capacity 12-16
Demographic and Economic Information 17-18
Operating Information 19-21
Sources:
CITY OF BRENHAM
These schedules contain trend information to help the reader understand how the City's financial performance and well-being have changed over time.
These schedules contain the information to help the reader assess the City's most significant local revenue sources, electric and gas service charges, sales tax and property tax.
Unless otherwise noted, the information in these tables is derived from the comprehensive annual financial reports of the relevant year. The City implemented GASB Statement 34 in 2003; schedules presenting government-wide information include information beginning in that year.
These schedules present information to help the reader assess the affordability of the City's current levels of outstanding debt and the City's ability to issue additional debt in the future.
These schedules offer demographic and economic indicators to help the reader understand the environment within which the City's financial activities take place.
These schedules contain service and infrastructure data to help the reader understand how the information in the City's financial report relates to the services the City provides and the activities it performs.
This part of the City of Brenham's comprehensive annual report presents detailed information as a context for understanding what the information in the financial statements, note disclosures, and required supplementary information says about the City's overall financial health
115
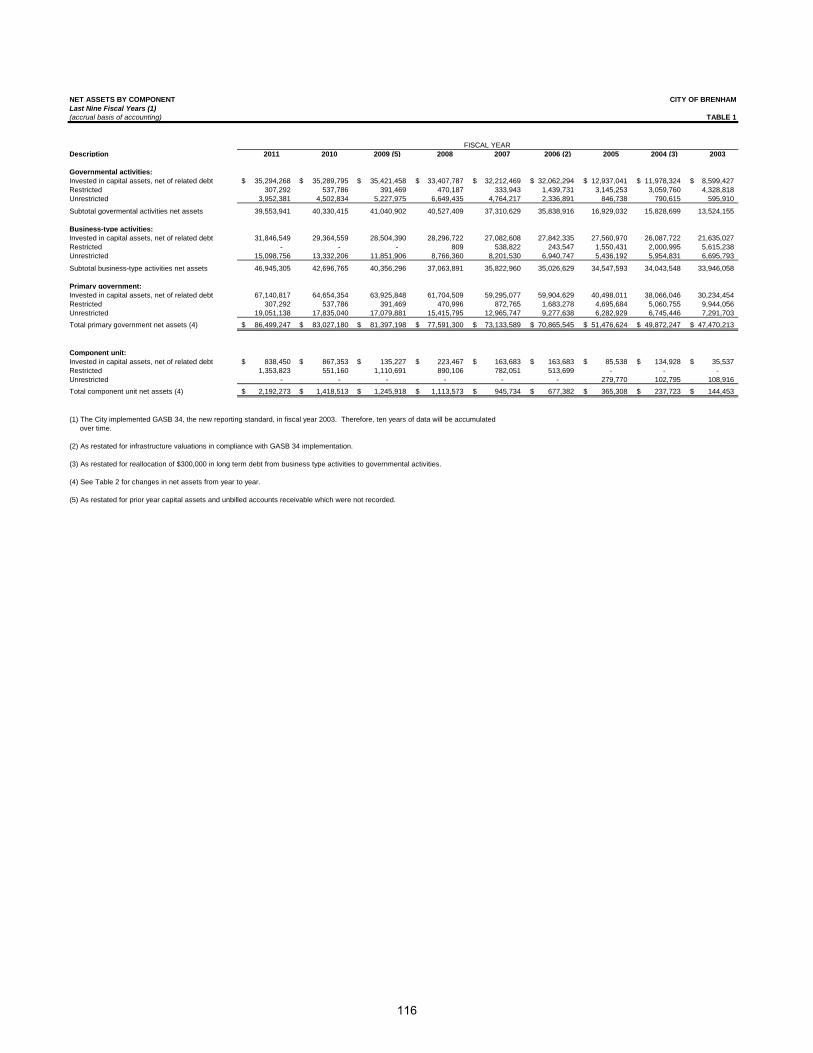
NET ASSETS BY COMPONENT Last Nine Fiscal Years (1)(accrual basis of accounting)
Description 2011 2010 2009 (5) 2008 2007 2006 (2) 2005 2004 (3) 2003
Governmental activities:Invested in capital assets, net of related debt $ 35,294,268 $ 35,289,795 $ 35,421,458 $ 33,407,787 $ 32,212,469 $ 32,062,294 $ 12,937,041 $ 11,978,324 $ 8,599,427Restricted 307,292 537,786 391,469 470,187 333,943 1,439,731 3,145,253 3,059,760 4,328,818Unrestricted 3,952,381 4,502,834 5,227,975 6,649,435 4,764,217 2,336,891 846,738 790,615 595,910
Subtotal govermental activities net assets 39,553,941 40,330,415 41,040,902 40,527,409 37,310,629 35,838,916 16,929,032 15,828,699 13,524,155
Business-type activities:Invested in capital assets, net of related debt 31,846,549 29,364,559 28,504,390 28,296,722 27,082,608 27,842,335 27,560,970 26,087,722 21,635,027Restricted - - - 809 538,822 243,547 1,550,431 2,000,995 5,615,238Unrestricted 15,098,756 13,332,206 11,851,906 8,766,360 8,201,530 6,940,747 5,436,192 5,954,831 6,695,793
Subtotal business-type activities net assets 46,945,305 42,696,765 40,356,296 37,063,891 35,822,960 35,026,629 34,547,593 34,043,548 33,946,058
Primary government:Invested in capital assets, net of related debt 67,140,817 64,654,354 63,925,848 61,704,509 59,295,077 59,904,629 40,498,011 38,066,046 30,234,454Restricted 307,292 537,786 391,469 470,996 872,765 1,683,278 4,695,684 5,060,755 9,944,056Unrestricted 19,051,138 17,835,040 17,079,881 15,415,795 12,965,747 9,277,638 6,282,929 6,745,446 7,291,703Total primary government net assets (4) $ 86,499,247 $ 83,027,180 $ 81,397,198 $ 77,591,300 $ 73,133,589 $ 70,865,545 $ 51,476,624 $ 49,872,247 $ 47,470,213
Component unit:Invested in capital assets, net of related debt $ 838,450 $ 867,353 $ 135,227 $ 223,467 $ 163,683 $ 163,683 $ 85,538 $ 134,928 $ 35,537Restricted 1,353,823 551,160 1,110,691 890,106 782,051 513,699 - - -Unrestricted - - - - - - 279,770 102,795 108,916Total component unit net assets (4) $ 2,192,273 $ 1,418,513 $ 1,245,918 $ 1,113,573 $ 945,734 $ 677,382 $ 365,308 $ 237,723 $ 144,453
(1) The City implemented GASB 34, the new reporting standard, in fiscal year 2003. Therefore, ten years of data will be accumulated over time.
(2) As restated for infrastructure valuations in compliance with GASB 34 implementation.
(3) As restated for reallocation of $300,000 in long term debt from business type activities to governmental activities.
(4) See Table 2 for changes in net assets from year to year.
(5) As restated for prior year capital assets and unbilled accounts receivable which were not recorded.
CITY OF BRENHAM
TABLE 1
FISCAL YEAR
116

CHANGE IN NET ASSETS Last Nine Fiscal Years (1)(accrual basis of accounting)
2011 2010 2009 2008 2007 2006 2005 2004 2003Program expensesGovernmental activities: General government $ 5,177,514 $ 5,755,450 $ 5,241,430 $ 2,001,542 $ 1,888,188 $ 1,993,032 $ 1,930,824 $ 1,071,441 $ 1,099,474 Public safety 6,579,061 6,831,143 5,414,468 5,235,849 5,028,102 4,719,613 4,174,264 4,399,037 4,255,750 Highways and streets 2,628,682 2,679,468 2,410,013 2,302,230 2,279,505 1,637,165 1,569,656 1,544,154 1,548,837 Health and welfare 288,699 299,216 271,509 545,485 580,118 624,350 218,987 569,459 554,797 Economic development - - - - - - - 3,417 269,685 Culture and recreation 3,513,628 3,676,194 3,585,647 3,607,684 3,264,409 3,047,778 2,903,509 2,802,023 2,897,340 Debt service 938,663 855,569 918,260 952,463 991,486 709,650 743,699 758,226 696,557
Total government activities program expenses 19,126,247 20,097,040 17,841,327 14,645,253 14,031,808 12,731,588 11,540,939 11,147,757 11,322,440
Business-type activities: Electric 23,962,803 22,259,716 22,428,215 26,690,324 23,342,221 25,991,891 20,843,491 19,621,793 18,431,275 Gas 2,602,842 3,198,740 2,905,012 5,975,923 5,646,666 6,027,066 5,225,571 4,537,389 5,023,642 Sanitation 2,706,750 2,669,678 2,464,142 2,621,538 2,331,316 2,309,317 2,062,243 2,007,536 1,689,275 Wastewater 2,860,922 2,979,406 3,286,770 3,803,759 3,559,574 3,544,654 2,944,784 2,656,350 2,559,845 Water 3,430,862 3,088,039 3,316,393 3,405,073 3,164,010 3,162,284 2,732,815 2,557,248 2,439,366
Total business-type activities program expenses 35,564,179 34,195,579 34,400,532 42,496,617 38,043,787 41,035,212 33,808,904 31,380,316 30,143,403
Total primary government expenses 54,690,426 54,292,619 52,241,859 57,141,870 52,075,595 53,766,800 45,349,843 42,528,073 41,465,843
Program revenuesGovernmental activities: Charges for services: General government 934,808 866,090 782,976 652,831 482,252 423,312 450,653 405,857 284,763 Public safety 6,258 8,548 5,446 6,138 2,321 34,020 28,641 25,130 30,798 Highways and streets 51,666 51,996 44,094 38,284 13 14 15 59 59 Health and welfare 32,452 35,606 47,472 37,566 30,290 32,094 7,179 11,299 13,245 Economic development - - - - - - - 25 25 Culture and recreation 364,696 387,113 348,065 275,555 271,842 267,813 314,012 316,720 241,706 Operating grants and contributions 626,870 865,607 469,206 678,485 915,090 678,830 933,651 968,117 965,931 Capital grants and contributions 610,145 1,213,423 1,467,320 1,415,745 1,081,668 1,120,556 704,478 2,192,208 542,589
Total govermental activities program revenues 2,626,895 3,428,383 3,164,579 3,104,604 2,783,476 2,556,639 2,438,629 3,919,415 2,079,116
Business-type activities: Charges for services: Electric 26,814,028 24,387,117 26,016,817 26,539,793 23,184,463 26,440,575 22,138,695 20,468,491 19,230,844 Gas 3,178,811 3,740,133 3,372,455 6,061,128 5,639,536 5,768,269 4,803,557 4,412,176 4,945,353 Sanitation 3,119,515 2,913,758 2,767,713 2,731,314 2,468,172 2,427,160 2,171,215 1,981,540 1,667,958 Wastewater 3,717,883 3,552,062 4,104,465 4,119,867 3,798,212 2,934,281 2,377,633 1,953,816 1,756,712 Water 5,122,170 3,898,319 4,688,689 3,719,257 3,254,617 3,718,368 2,944,790 2,690,075 2,563,880 Operating grants and contributions 16,622 - 8,316 5,000 - - 100 12,281 33,195 Capital grants and contributions 599,799 229,089 115,539 240,481 - 10,160 - - 275,531
Total business-type activities program revenues 42,568,828 38,720,478 41,073,994 43,416,841 38,345,000 41,298,813 34,435,990 31,518,379 30,473,473
Total primary government program revenues 45,195,723 42,148,861 44,238,573 46,521,445 41,128,476 43,855,452 36,874,619 35,437,794 32,552,589
Net (expense)/revenueGovernmental activities (16,499,352) (16,668,657) (14,676,748) (11,540,649) (11,248,332) (10,174,949) (9,102,310) (7,228,342) (9,243,324)Business-type activities 7,004,649 4,524,899 6,673,462 920,224 301,213 263,601 627,086 138,063 330,070
Total primary government net expense (9,494,703) (12,143,758) (8,003,286) (10,620,425) (10,947,119) (9,911,348) (8,475,224) (7,090,279) (8,913,254)
CITY OF BRENHAM
TABLE 2
FISCAL YEAR
117

CHANGE IN NET ASSETS Last Nine Fiscal Years (1)(accrual basis of accounting)
2011 2010 2009 2008 2007 2006 2005 2004 2003
CITY OF BRENHAM
TABLE 2
FISCAL YEAR
General revenues and other changes in net assetsGovernmental activities: Property taxes 4,980,377 5,011,013 4,787,893 4,547,830 4,152,080 3,505,543 3,091,085 2,899,464 2,680,158 Sales taxes 3,774,894 3,678,707 3,727,329 3,696,762 3,524,009 3,290,760 2,910,902 2,610,841 2,588,412 Other taxes 3,699,868 3,344,311 3,501,962 3,511,940 3,524,583 2,956,555 2,960,726 2,744,151 2,587,861 Grants and contributions not restricted - - - - - - - 16,624 28,348 Investment income not restricted 18,501 12,790 181,281 460,201 587,125 261,901 143,000 138,952 111,107 Miscellaneous 143,988 105,935 120,375 208,690 55,483 120,666 119,836 134,188 103,857 Gain (loss) on sale of capital assets 12,771 7,879 5,482 37,643 9,508 5,458 (58,343) 21,536 (51,110) Payments from component Unit 219,526 850,941 931,773 927,717 770,877 661,417 661,407 622,061 675,704 Transfers 2,872,953 2,836,566 3,146,621 154,171 96,380 239,378 374,031 645,069 1,671,039
Total government activities 15,722,878 15,848,142 16,402,716 13,544,954 12,720,045 11,041,678 10,202,644 9,832,886 10,395,376
Business-type activities: Investment income not restricted 95,798 50,841 129,159 348,525 462,286 312,516 227,280 272,546 314,044 Miscellaneous 21,046 44,971 192,729 126,353 267,835 18,812 22,538 31,950 30,894 Gain (loss) on sale of capital assets - - - - (138,624) 10,032 1,170 - - Transfers (2,872,953) (2,836,566) (3,146,621) (154,171) (96,380) (239,378) (374,031) (645,069) (1,671,039)
Total business-type activities (2,756,109) (2,740,754) (2,824,734) 320,707 495,117 101,982 (123,043) (340,573) (1,326,101)
Total primary government general revenues and other changes in net assets 12,966,769 13,107,388 13,577,982 13,865,661 13,215,162 11,143,660 10,079,601 9,492,313 9,069,275
Change in net assets Governmental activities, as previously reported (776,474) (820,515) 1,725,968 2,004,305 1,471,713 866,729 1,100,334 2,604,544 1,152,052 Restatement in capital assets (2) - - - - - 17,915,958 - - - Restatement in deferred revenue (3) - - - - - 127,197 - - - Restatement in bonds (4) - - - - - - - (300,000) - Restatement in capital assets (5) - 110,028 - - - - - - - Governmental activities, restated (776,474) (710,487) 1,725,968 2,004,305 1,471,713 18,909,885 1,100,334 2,304,544 1,152,052
Business-type activities, as previously reported 4,248,540 1,784,145 3,292,404 1,240,931 796,330 365,583 504,043 (202,510) (996,031) Restatement in capital assets (2) - - - - - 113,453 - - - Restatement in bonds (4) - - - - - - - 300,000 - Restatement in charges for services (6) - 556,324 - - - - - - - Business-type activities, restated 4,248,540 2,340,469 3,292,404 1,240,931 796,330 479,036 504,043 97,490 (996,031)
Total primary government change in net assets 3,472,066 1,629,982 $ 5,018,373 3,245,236 $ 2,268,044 $ 19,388,921 $ 1,604,377 $ 2,402,034 $ 156,021
Component unitProgram expenses $ 269,757 $ 205,065 $ 190,761 $ 191,425 $ 163,868 $ 137,649 $ 154,949 $ 157,137 $ 145,353Program revenues Brenham Community Development Corporation - - - - - - - - -Net expenses (269,757) (205,065) (190,761) (191,425) (163,868) (137,649) (154,949) (157,137) (145,353)
General revenues and other changes in net assetsComponent unit activities: Sales taxes 1,258,298 1,226,236 1,242,443 1,232,254 1,174,670 1,096,920 970,301 870,280 862,804 Investment income not restricted 1,645 2,365 7,088 24,727 28,427 14,220 1,275 1,344 4,704 Miscellaneous - - - 30,000 - - 560 844 25,201 Gain (loss) on sale of capital assets 3,100 - 5,348 - - - (28,194) - - Payments from component unit (219,526) (850,941) (931,773) (927,717) (770,877) (661,417) (661,407) (622,061) (675,704) Transfers - - - - - - - - -
Total component unit activities 1,043,517 377,660 323,106 359,264 432,220 449,723 282,534 250,407 217,005 Component unit change in assets $ 773,760 $ 172,595 $ 132,345 $ 167,839 $ 268,352 $ 312,074 $ 127,585 $ 93,270 $ 71,652
(1) The City implemented GASB 34, the new reporting standard, in fiscal year 2003. Therefore, ten years of data will be accumulated over time.
(2) As restated for infrastructure valuations in compliance with GASB 34 implementation.(3) As restated for prior year accrued franchise taxes which were not recorded.(4) As restated for reallocation of $300,000 in long term debt from business type activities to governmental activities.(5) As restated for prior year capital assets which were not recorded.(6) As restated for prior year correction to charges for services.
118
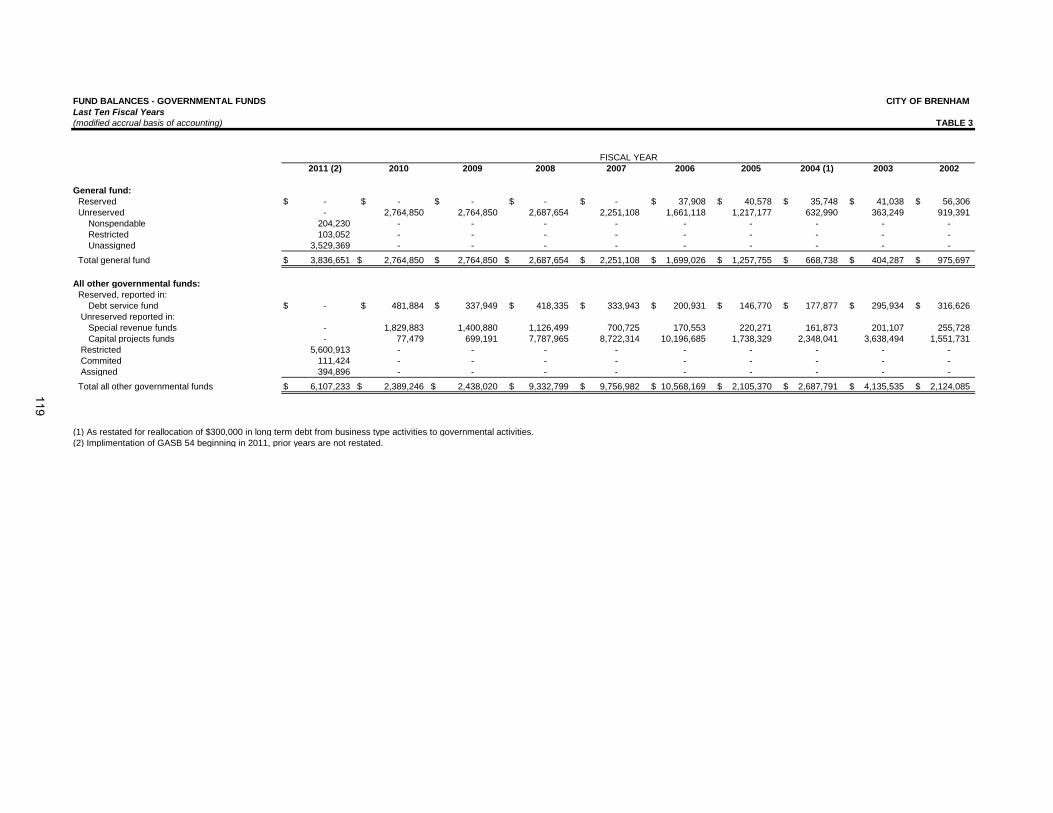
FUND BALANCES - GOVERNMENTAL FUNDS CITY OF BRENHAMLast Ten Fiscal Years (modified accrual basis of accounting) TABLE 3
2011 (2) 2010 2009 2008 2007 2006 2005 2004 (1) 2003 2002
General fund: Reserved $ - $ - $ - $ - $ - $ 37,908 $ 40,578 $ 35,748 $ 41,038 $ 56,306 Unreserved - 2,764,850 2,764,850 2,687,654 2,251,108 1,661,118 1,217,177 632,990 363,249 919,391 Nonspendable 204,230 - - - - - - - - - Restricted 103,052 - - - - - - - - - Unassigned 3,529,369 - - - - - - - - - Total general fund $ 3,836,651 $ 2,764,850 $ 2,764,850 $ 2,687,654 $ 2,251,108 $ 1,699,026 $ 1,257,755 $ 668,738 $ 404,287 $ 975,697
All other governmental funds: Reserved, reported in: Debt service fund $ - $ 481,884 $ 337,949 $ 418,335 $ 333,943 $ 200,931 $ 146,770 $ 177,877 $ 295,934 $ 316,626 Unreserved reported in: Special revenue funds - 1,829,883 1,400,880 1,126,499 700,725 170,553 220,271 161,873 201,107 255,728 Capital projects funds - 77,479 699,191 7,787,965 8,722,314 10,196,685 1,738,329 2,348,041 3,638,494 1,551,731 Restricted 5,600,913 - - - - - - - - - Commited 111,424 - - - - - - - - - Assigned 394,896 - - - - - - - - - Total all other governmental funds $ 6,107,233 $ 2,389,246 $ 2,438,020 $ 9,332,799 $ 9,756,982 $ 10,568,169 $ 2,105,370 $ 2,687,791 $ 4,135,535 $ 2,124,085
(1) As restated for reallocation of $300,000 in long term debt from business type activities to governmental activities.(2) Implimentation of GASB 54 beginning in 2011, prior years are not restated.
FISCAL YEAR
119

CHANGES IN FUND BALANCES - GOVERNMENTAL FUNDSLast Ten Fiscal Years CITY OF BRENHAM(modified accrual basis of accounting) TABLE 4
2011 2010 2009 2008 2007 2006 2005 2004 2003 2002
Revenues Taxes $ 12,445,035 $ 12,013,599 $ 12,006,792 $ 11,770,388 $ 11,181,972 $ 9,728,777 $ 9,013,770 $ 8,233,000 $ 7,832,768 $ 7,374,952 Licenses and permits 64,465 76,999 61,989 58,260 54,487 56,146 57,846 57,574 43,572 45,181 Intergovermental 696,256 1,817,216 1,462,232 769,904 1,648,201 1,656,366 1,596,241 2,094,325 1,269,907 1,425,598 Charges for services 558,484 603,568 571,177 458,378 368,861 363,984 396,353 401,130 331,505 283,369 Fines and forfeitures 766,908 668,762 594,840 493,664 363,253 337,014 344,076 300,235 216,255 217,342 Investment income 18,259 12,428 179,685 457,112 572,336 246,716 137,011 138,952 111,107 187,302 Payment from component unit 970,989 850,941 931,773 927,717 770,877 661,417 661,407 622,061 675,704 714,985 Contributions and donations 111,254 174,272 39,833 176,900 124,608 176,214 44,895 1,084,504 - 265,270 Miscellaneous 115,930 111,418 149,984 151,892 85,405 117,772 157,948 139,505 303,328 399,980
Total revenues 15,747,580 16,329,203 15,998,305 15,264,215 15,170,000 13,344,406 12,409,547 13,071,286 10,784,146 10,913,979
Expenditures Current: Culture and recreation 2,860,841 2,985,738 2,963,083 2,993,583 2,611,013 2,467,861 2,374,455 2,267,690 2,366,423 2,590,967 Economic development - - - - - - - 3,417 275,531 - General government 4,814,955 4,987,652 4,793,575 1,491,349 1,383,100 1,270,288 1,560,873 974,771 980,100 876,371 Health and welfare 278,258 281,388 262,880 535,818 562,579 614,794 214,873 571,160 556,746 613,154 Highways and streets 11,426,323 1,535,385 1,317,966 1,240,278 1,153,897 1,085,298 1,046,654 1,070,642 1,032,007 1,857,357 Public safety 5,801,959 5,977,319 5,055,235 4,801,776 4,634,054 4,179,268 4,053,844 4,164,948 4,021,661 4,229,819 Debt service: - Interest & fiscal charges 932,687 818,939 816,482 929,359 938,159 664,571 724,066 739,385 716,629 610,758 Principal retirement 1,623,452 1,291,944 1,319,200 1,165,767 1,070,825 1,138,070 1,038,665 927,215 848,102 916,183 Issuance costs 331,409 800 132,893 1,069 21,072 72,468 - - 62,692 71,511 Capital outlay 1,203,378 2,002,664 9,585,060 2,340,500 3,497,123 2,475,907 1,763,551 4,780,081 3,198,692 2,795,571
Total expenditures 29,273,262 19,881,829 26,246,374 15,499,499 15,871,822 13,968,525 12,776,981 15,499,309 14,058,583 14,561,691
Excess (deficiency) of revenues over(under) expenditures (13,525,682) (3,552,626) (10,248,069) (235,284) (701,822) (624,119) (367,434) (2,428,023) (3,274,437) (3,647,712)
Other financing sources (uses) Transfers in 3,091,370 3,849,305 4,092,165 1,036,319 723,787 802,738 609,424 1,088,710 1,892,850 1,539,723 Transfers out (218,417) (1,012,739) (945,544) (882,148) (848,384) (563,360) (235,394) (293,904) (221,812) (453,779) Payment to Component Unit (751,463) - - - - - - - - - Proceeds from bonds 16,097,674 - - - - 9,000,000 - - 3,043,442 4,342,199 Refunding bonds issued 3,060,619 - 5,941,995 - 1,524,321 - - - - - Gain on settlement - - - - - - - - - 75,000 Bond premium - - 194,962 - - - - - - - Payment to refunded bond escrow agent (3,004,387) - (6,004,364) - (1,501,306) - - - - - Proceeds from capital lease - 645,621 131,933 - 544,300 288,810 - 449,924 - 289,547 Miscellaneous 40,074 21,665 19,339 93,476 - - - - - -
Total other financing sources (uses) 18,315,470 3,503,852 3,430,486 247,647 442,718 9,528,188 374,030 1,244,730 4,714,480 5,792,690
Net change in fund balance $ 4,789,788 $ (48,774) $ (6,817,583) $ 12,363 $ (259,104) $ 8,904,069 $ 6,596 $ (1,183,293) $ 1,440,043 $ 2,144,978
Debt service as a percentage of non-capital expenditures 10.29% 11.81% 13.62% 15.93% 16.40% 16.32% 16.01% 15.55% 14.99% 13.59%
FISCAL YEAR
120
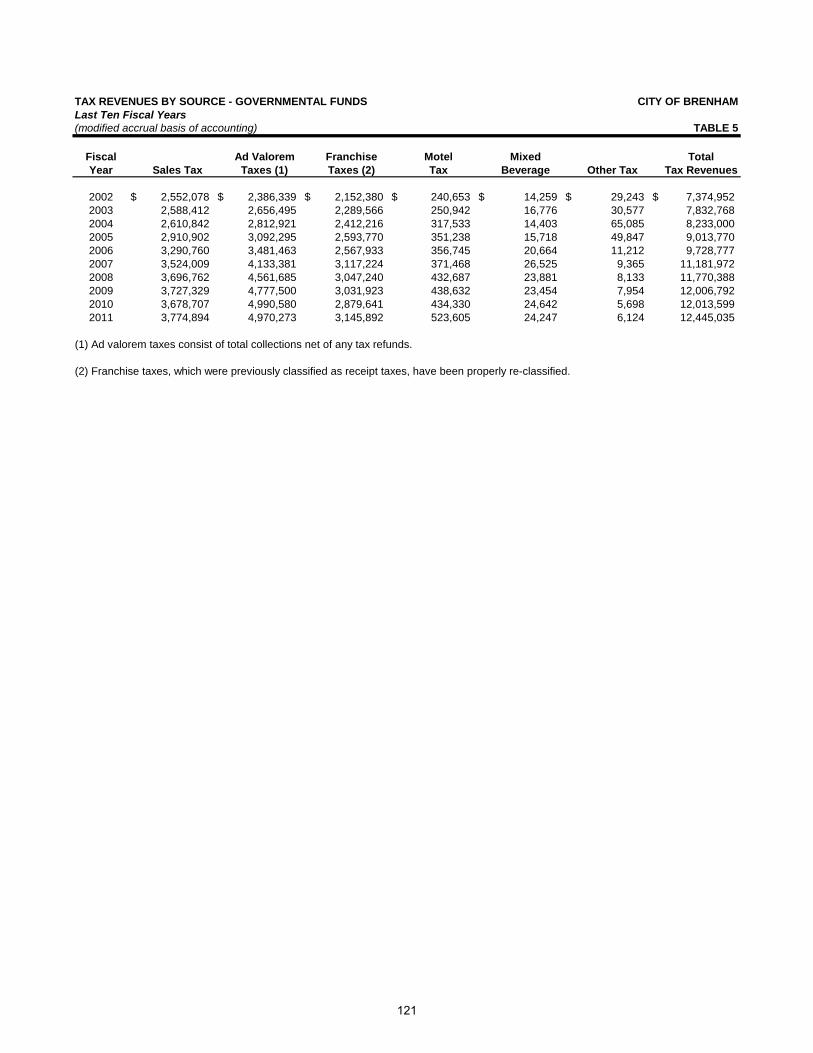
TAX REVENUES BY SOURCE - GOVERNMENTAL FUNDSLast Ten Fiscal Years (modified accrual basis of accounting) TABLE 5
Fiscal Ad Valorem Franchise Motel Mixed TotalYear Sales Tax Taxes (1) Taxes (2) Tax Beverage Other Tax Tax Revenues
2002 $ 2,552,078 $ 2,386,339 $ 2,152,380 $ 240,653 $ 14,259 $ 29,243 $ 7,374,9522003 2,588,412 2,656,495 2,289,566 250,942 16,776 30,577 7,832,7682004 2,610,842 2,812,921 2,412,216 317,533 14,403 65,085 8,233,0002005 2,910,902 3,092,295 2,593,770 351,238 15,718 49,847 9,013,7702006 3,290,760 3,481,463 2,567,933 356,745 20,664 11,212 9,728,7772007 3,524,009 4,133,381 3,117,224 371,468 26,525 9,365 11,181,9722008 3,696,762 4,561,685 3,047,240 432,687 23,881 8,133 11,770,3882009 3,727,329 4,777,500 3,031,923 438,632 23,454 7,954 12,006,7922010 3,678,707 4,990,580 2,879,641 434,330 24,642 5,698 12,013,5992011 3,774,894 4,970,273 3,145,892 523,605 24,247 6,124 12,445,035
(1) Ad valorem taxes consist of total collections net of any tax refunds.
(2) Franchise taxes, which were previously classified as receipt taxes, have been properly re-classified.
CITY OF BRENHAM
121

ASSESSED (1) AND ESTIMATED ACTUAL VALUE OF TAXABLE PROPERTYLast Ten Fiscal Years
TABLE 6
Net TotalFiscal Personal Gross Taxable DirectYear Residential Commercial Property Valuation Exemption Value Tax Rate
2002 $ 294,146,981 $ 207,576,271 $ 201,341,491 $ 703,064,743 $ 96,893,031 $ 606,171,712 0.395002003 313,526,154 222,282,517 200,099,154 735,907,825 92,511,210 643,396,615 0.411602004 342,870,991 256,701,023 188,770,685 788,342,699 101,481,686 686,861,013 0.411602005 361,775,150 256,868,274 177,812,355 796,455,779 90,675,166 705,780,613 0.436202006 370,683,893 208,798,536 251,690,047 831,172,476 88,694,515 742,477,961 0.466202007 422,316,663 220,190,107 257,897,502 900,404,272 103,247,446 797,156,826 0.506302008 465,073,145 247,703,127 290,075,024 1,002,851,296 123,033,453 879,817,843 0.506302009 496,035,865 293,274,572 302,853,623 1,092,164,060 146,352,615 945,811,445 0.504202010 518,208,990 327,644,944 307,326,105 1,153,180,039 170,403,101 982,776,938 0.504202011 531,338,057 330,838,349 276,091,085 1,138,267,491 162,347,984 975,919,507 0.50420
(1) The property is reassessed each year. The assessed value is based on 100% of estimated actual value. Tax rates are per $100 of assessed value.
CITY OF BRENHAM
122
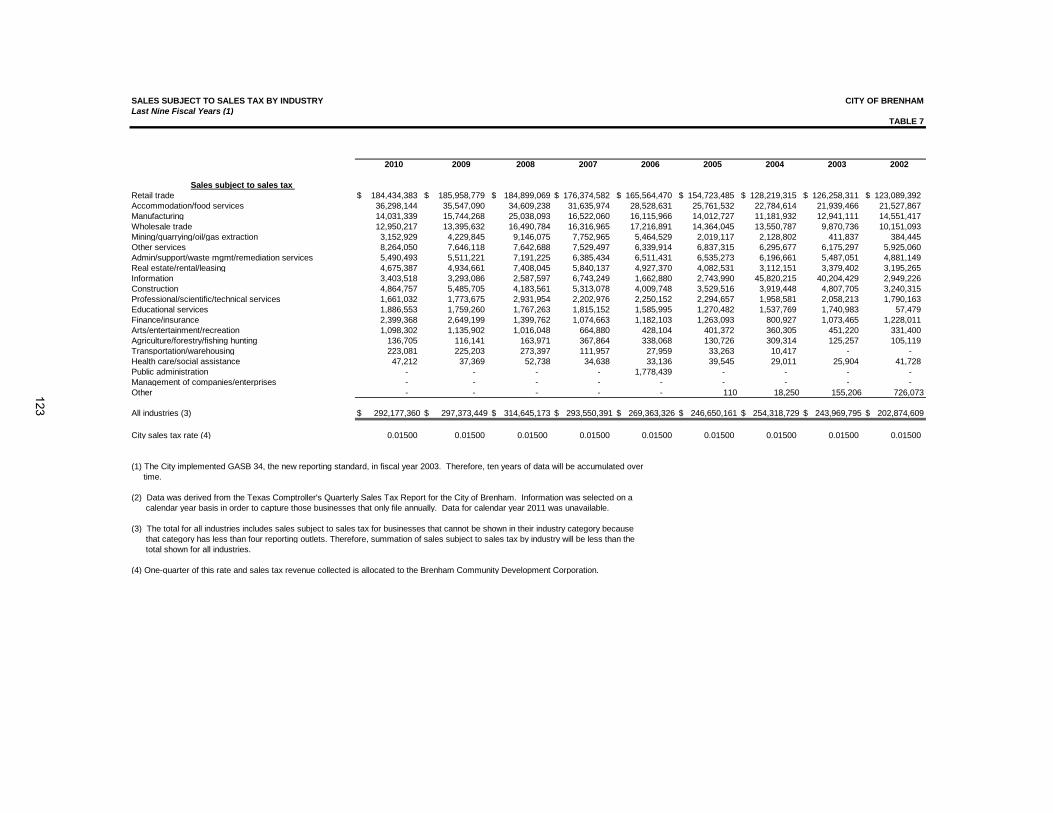
SALES SUBJECT TO SALES TAX BY INDUSTRYLast Nine Fiscal Years (1)
2010 2009 2008 2007 2006 2005 2004 2003 2002
Sales subject to sales tax Retail trade $ 184,434,383 $ 185,958,779 $ 184,899,069 $ 176,374,582 $ 165,564,470 $ 154,723,485 $ 128,219,315 $ 126,258,311 $ 123,089,392Accommodation/food services 36,298,144 35,547,090 34,609,238 31,635,974 28,528,631 25,761,532 22,784,614 21,939,466 21,527,867Manufacturing 14,031,339 15,744,268 25,038,093 16,522,060 16,115,966 14,012,727 11,181,932 12,941,111 14,551,417Wholesale trade 12,950,217 13,395,632 16,490,784 16,316,965 17,216,891 14,364,045 13,550,787 9,870,736 10,151,093Mining/quarrying/oil/gas extraction 3,152,929 4,229,845 9,146,075 7,752,965 5,464,529 2,019,117 2,128,802 411,837 384,445Other services 8,264,050 7,646,118 7,642,688 7,529,497 6,339,914 6,837,315 6,295,677 6,175,297 5,925,060Admin/support/waste mgmt/remediation services 5,490,493 5,511,221 7,191,225 6,385,434 6,511,431 6,535,273 6,196,661 5,487,051 4,881,149Real estate/rental/leasing 4,675,387 4,934,661 7,408,045 5,840,137 4,927,370 4,082,531 3,112,151 3,379,402 3,195,265Information 3,403,518 3,293,086 2,587,597 6,743,249 1,662,880 2,743,990 45,820,215 40,204,429 2,949,226Construction 4,864,757 5,485,705 4,183,561 5,313,078 4,009,748 3,529,516 3,919,448 4,807,705 3,240,315Professional/scientific/technical services 1,661,032 1,773,675 2,931,954 2,202,976 2,250,152 2,294,657 1,958,581 2,058,213 1,790,163Educational services 1,886,553 1,759,260 1,767,263 1,815,152 1,585,995 1,270,482 1,537,769 1,740,983 57,479Finance/insurance 2,399,368 2,649,199 1,399,762 1,074,663 1,182,103 1,263,093 800,927 1,073,465 1,228,011Arts/entertainment/recreation 1,098,302 1,135,902 1,016,048 664,880 428,104 401,372 360,305 451,220 331,400Agriculture/forestry/fishing hunting 136,705 116,141 163,971 367,864 338,068 130,726 309,314 125,257 105,119Transportation/warehousing 223,081 225,203 273,397 111,957 27,959 33,263 10,417 - - Health care/social assistance 47,212 37,369 52,738 34,638 33,136 39,545 29,011 25,904 41,728Public administration - - - - 1,778,439 - - - - Management of companies/enterprises - - - - - - - - - Other - - - - - 110 18,250 155,206 726,073
All industries (3) $ 292,177,360 $ 297,373,449 $ 314,645,173 $ 293,550,391 $ 269,363,326 $ 246,650,161 $ 254,318,729 $ 243,969,795 $ 202,874,609
City sales tax rate (4) 0.01500 0.01500 0.01500 0.01500 0.01500 0.01500 0.01500 0.01500 0.01500
(1) The City implemented GASB 34, the new reporting standard, in fiscal year 2003. Therefore, ten years of data will be accumulated over time.
(2) Data was derived from the Texas Comptroller's Quarterly Sales Tax Report for the City of Brenham. Information was selected on a calendar year basis in order to capture those businesses that only file annually. Data for calendar year 2011 was unavailable.
(3) The total for all industries includes sales subject to sales tax for businesses that cannot be shown in their industry category because that category has less than four reporting outlets. Therefore, summation of sales subject to sales tax by industry will be less than the total shown for all industries.
(4) One-quarter of this rate and sales tax revenue collected is allocated to the Brenham Community Development Corporation.
CITY OF BRENHAM
TABLE 7
123

DIRECT AND OVERLAPPING PROPERTY AND SALES TAX RATESLast Ten Fiscal Years
TABLE 8
Brenham Total TotalFiscal General Debt Independent Blinn Washington Overlapping City of Washington OverlappingYear Fund Service Total School District College County Governments Brenham County Governments
2002 0.27500 0.12000 0.39500 1.57170 0.05440 0.45000 2.47110 0.01500 0.00500 0.020002003 0.28750 0.12410 0.41160 1.59900 0.05490 0.45160 2.51710 0.01500 0.00500 0.020002004 0.30000 0.11160 0.41160 1.59900 0.05670 0.45160 2.51890 0.01500 0.00500 0.020002005 0.30510 0.13110 0.43620 1.56900 0.05520 0.44350 2.50390 0.01500 0.00500 0.020002006 0.31650 0.14970 0.46620 1.61000 0.05100 0.44350 2.57070 0.01500 0.00500 0.020002007 0.31650 0.18980 0.50630 1.44500 0.05130 0.43350 2.43610 0.01500 0.00500 0.020002008 0.32450 0.18180 0.50630 1.10840 0.05480 0.43490 2.10440 0.01500 0.00500 0.020002009 0.34200 0.16220 0.50420 1.08840 0.05320 0.42600 2.07180 0.01500 0.00500 0.020002010 0.34200 0.16220 0.50420 1.08840 0.05450 0.42600 2.07310 0.01500 0.00500 0.020002011 0.34200 0.16220 0.50420 1.11840 0.05590 0.43580 2.11430 0.01500 0.00500 0.02000
(1) Data is from Washington County Appraisal District.(2) Data is from Texas Comptroller of Public Accounts.
City Direct Rates
CITY OF BRENHAM
PROPERTY TAX RATES (per $100 of assessed value) (1) SALES TAX RATES (2)
124

TEN LARGEST PROPERTY TAX PAYERS (1)Current Year and Ten Years Ago
TABLE 9
Percentage Percentageof Total City of Total City
Taxable Taxable Taxable TaxableAssessed Assessed Assessed Assessed
Taxpayer Value Value Taxpayer Value ValueBlue Bell Creameries $ 39,804,114 4.08% Mount Vernon Mills, Inc. $ 29,240,530 4.82%Valmonts/Als 25,831,650 2.65% Blue Bell Creameries 27,136,125 4.48%MIC LLC (East) 15,399,600 1.58% Valmont Industries 15,807,915 2.61%Moore Wallace North America 14,777,560 1.51% Wallace Computer Services 12,472,160 2.06%MIC Group LLC (West) 14,487,680 1.48% Cleaners Hangers Co. 11,424,730 1.88%Germania Farm Mutual Aid Assoc 11,980,930 1.23% Wal-Mart Properties #32 10,619,940 1.75%PI Components Corp. 9,525,830 0.98% Germania Farm Mutual Aid Assoc 9,444,660 1.56%Lowe's Home Centers, Inc. #2521 9,378,810 0.96% Brenham Wholesale Groc. 9,123,520 1.51%Wal-Mart Real Estate Business Trust 8,106,950 0.83% Sealy Mattress Co. 7,417,060 1.22%Brenham Wholesale Grocery 7,264,500 0.74% P I Components 6,824,170 1.13%Total $ 156,557,624 16.04% $ 139,510,810 23.02%
(1) Data is from Washington County Appraisal District.
2011 2002
CITY OF BRENHAM
125

PROPERTY TAX LEVIES AND COLLECTIONSLast Ten Fiscal Years
TABLE 10
Levy CollectionsFiscal Assessed Tax Net of Percentage from Prior PercentageYear Valuation Rate Adjustments Amount of Levy Years (6) Amount of Levy
2002 $ 606,171,712 0.39500 $ 2,391,893 $ 2,354,756 98.45% $ 27,119 $ 2,386,386 (1) 99.77%2003 643,396,615 0.41160 2,648,253 2,595,349 98.00% 29,990 2,625,339 99.13%2004 686,861,013 0.41160 2,827,306 2,746,974 97.16% 66,648 2,813,622 99.52%2005 705,780,613 0.43620 3,072,218 3,022,400 98.38% 68,463 3,092,295 (2) 100.65%2006 742,477,961 0.46620 3,468,062 3,413,035 98.41% 30,946 3,443,981 99.31%2007 797,156,826 0.50630 4,088,719 4,020,719 98.34% 65,640 4,089,261 (3) 100.01%2008 879,817,843 0.50630 4,495,628 4,493,575 99.95% 85,464 4,581,092 (4) 101.90%2009 945,811,445 0.50420 4,739,801 4,666,545 98.45% 51,033 4,727,111 (5) 99.73%2010 982,776,938 0.50420 4,957,748 4,866,421 98.16% 69,767 4,936,188 99.57%2011 975,919,507 0.50420 4,928,249 4,840,754 98.22% 73,287 4,914,041 99.71%
(1) Includes $4,511 in overrages.(2) Includes $1,432 in overrages.(3) Includes $2,902 of 2007 rollback taxes collected.(4) Includes $2,053 of 2008 rollback taxes collected.(5) Includes $9,424 of 2009 rollback taxes collected.(6) Collections from prior years are recognized as revenue in the year they are received, not the year in which they are levied,
CITY OF BRENHAM
Fiscal Year of LevyCollected within the
Total Collections
126

PRINCIPAL SALES TAX PAYERS BY INDUSTRY (1)Calendar Years 2010 and 2002 (2)
TABLE 11
Sales Percentage Number of Sales Percentage Number ofSubject to of All Reporting Subject to of All Reporting
Sales Tax Payers By Industry Sales Tax Industries Outlets 4th Q Sales Tax Payers By Industry Sales Tax Industries Outlets 4th QRetail trade $ 184,434,383 63.12% 376 Retail trade 123,089,392 60.67% 378Accommodation/food services 36,298,144 12.42% 95 Accommodation/food services 21,527,867 10.61% 67Manufacturing 14,031,339 4.80% 77 Manufacturing 14,551,417 7.17% 65Wholesale trade 12,950,217 4.43% 50 Wholesale trade 10,151,093 5.00% 29Mining/quarrying/oil/gas extraction 3,152,929 1.08% 4 Other services 384,445 0.19% 104Other services 8,264,050 2.83% 117 Admin/support/waste mgmt/remediation services 5,925,060 2.92% 62Admin/support/waste mgmt/remediation services 5,490,493 1.88% 60 Construction 4,881,149 2.41% 81Real estate/rental/leasing 4,675,387 1.60% 17 Real estate/rental/leasing 3,195,265 1.57% 10Information 3,403,518 1.16% 11 Information 2,949,226 1.45% 12Construction 4,864,757 1.67% 74 Professional/scientific/technical services 3,240,315 1.60% 39Professional/scientific/technical services 1,661,032 0.57% 53 Finance/insurance 1,790,163 0.88% 13Educational services 1,886,553 0.65% 13 Other 57,479 0.03% 48Finance/insurance 2,399,368 0.82% 17 Mining/quarrying/oil/gas extraction 1,228,011 0.61% 4Arts/entertainment/recreation 1,098,302 0.38% 16 Arts/entertainment/recreation 331,400 0.16% 11Agriculture/forestry/fishing hunting 136,705 0.05% 11 Agriculture/forestry/fishing hunting 105,119 0.05% 10Transportation/warehousing 223,081 0.08% 6 Educational services 0 0.00% 9Health care/social assistance 47,212 0.02% 6 Health care/social assistance 41,728 0.02% 4Public administration 0 0.00% 11 Public administration 0 0.00% 3Management of companies/enterprises 0 0.00% 2 Transportation/warehousing 0 0.00% 3Other 0 0.00% 1 Management of companies/enterprises 726,073 0.36% 0
All industries (3) $ 292,177,360 100.00% 1,017 All industries (3) $ 202,874,609 100.00% 952
(1) Sales tax data by business entity is deemed by the Texas State Comptroller to be confidential and may not be publicly disclosed.
(2) Data was derived from the Texas Comptroller's Quarterly Sales Tax Report for the City of Brenham. Information was selected on a calendar year basis in order to capture those business entities that only file annually. Data for calendar year 2010 and prior to 2002 was unavailable.
(3) The total for all industries includes sales subject to sales tax for businesses that cannot be shown in their industry category because that category has less than 4 reporting outlets. Therefore, summation of sales subject to sales tax by industry will be less than the total shown for all industries.
2010 2002
CITY OF BRENHAM
127

RATIO OF OUTSTANDING DEBT BY TYPELast Ten Fiscal Years
TABLE 12
PercentageGeneral Certificates General Limited General Certificates General Total of
Fiscal Obligation of Obligation Revenue Tax Capital Obligation of Obligation Capital Primary Personal PerYear Bonds Obligation Refunding Bonds Notes Leases Bonds Obligation Refunding Leases Settlement Government Income (1) Capita (1)
2002 $ 1,735,000 $ 11,767,124 $ - $ - $ - $ 239,676 $ 855,000 $ 12,117,876 $ 3,885,000 $ 276,226 $ 80,483 $ 30,956,385 7.84% 2,2462003 1,340,000 14,433,034 - - - 171,514 585,000 18,181,966 3,885,000 217,454 67,972 38,881,940 9.85% 2,8102004 920,000 14,292,528 - - - 551,381 300,000 17,677,472 3,885,000 166,807 54,689 37,847,877 8.87% 2,6922005 475,000 13,817,497 - - - 432,747 - 17,432,503 3,885,000 113,759 40,586 36,197,092 7.85% 2,5422006 - 22,278,242 - - - 597,743 - 17,086,758 3,530,000 138,387 25,614 43,656,744 8.69% 3,0362007 - 19,848,522 1,511,950 - - 878,321 - 12,826,478 7,133,050 417,259 9,719 42,625,299 8.15% 2,9602008 - 18,899,484 1,505,078 - - 635,451 - 12,125,517 6,714,923 335,720 - 40,216,173 7.11% 2,6812009 - 12,019,923 7,371,700 - - 471,085 - 14,680,078 9,273,300 250,733 - 44,066,819 7.43% 2,8862010 - 11,407,845 6,906,103 - - 866,584 - 13,892,156 8,763,898 291,763 - 42,128,349 6.90% 2,6812011 - 7,948,585 9,383,268 14,165,000 655,000 552,333 - 6,536,415 14,971,731 188,043 - 54,400,376 8.02% 3,427
(1) See Table 17 for total personal income and population information.
CITY OF BRENHAM
Governmental Activities Business-Type Activities
128

RATIO OF NET GENERAL OBLIGATION BONDED DEBTLast Ten Fiscal Years
TABLE 13
Ratio of NetGeneral Certificates General Limited Gross Less Debt Net Taxable Bonded Debt Net Bonded
Fiscal Obligation of Obligation Revenue Tax Bonded Service Funds Bonded Assessed to Assessed Debt PerYear Bonds Obligation Refunding Bonds Notes Debt Available Debt Value Values Capita (1)
2002 $ 1,735,000 $ 11,767,124 $ - $ - $ - $ 13,502,124 $ 316,626 $ 13,185,498 $ 606,171,712 2.18% 9572003 1,340,000 14,433,034 - - - 15,773,034 295,934 15,477,100 643,396,615 2.41% 1,1182004 920,000 14,292,528 - - - 15,212,528 177,817 15,034,711 686,861,013 2.19% 1,0692005 475,000 13,817,497 - - - 14,292,497 146,770 14,145,727 760,929,323 1.86% 9942006 - 22,278,242 - - - 22,278,242 198,430 22,079,812 742,477,961 2.97% 1,5352007 - 19,848,522 1,511,950 - - 21,360,472 332,812 21,027,660 797,156,826 2.64% 1,4602008 - 18,899,484 1,505,078 - - 20,404,562 418,335 19,986,227 879,817,843 2.27% 1,3322009 - 12,019,923 7,371,700 - - 19,391,623 337,949 19,053,674 945,811,445 2.01% 1,2482010 - 11,407,845 6,906,103 - - 18,313,948 481,884 17,832,064 982,776,938 1.81% 1,1352011 - 7,948,585 9,383,268 14,165,000 655,000 32,151,853 245,654 31,906,199 975,919,507 3.27% 2,010
(1) See Table 17 for population information.
CITY OF BRENHAM
129
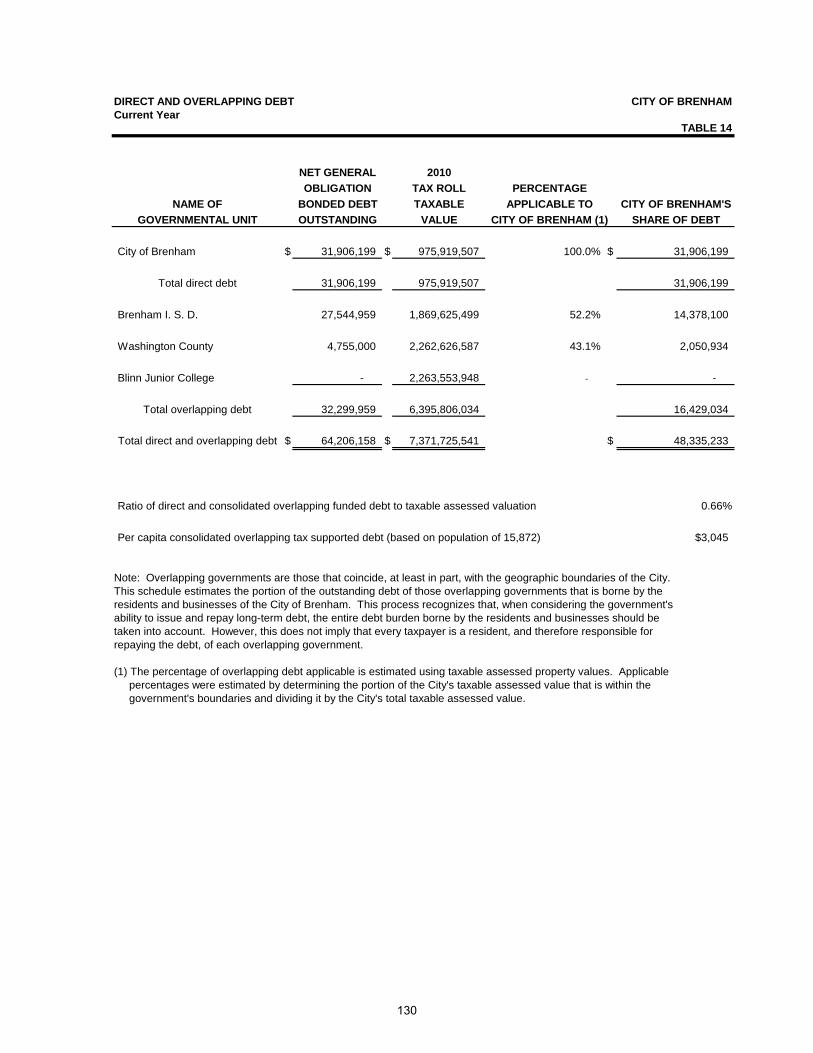
DIRECT AND OVERLAPPING DEBT CITY OF BRENHAMCurrent Year
TABLE 14
NET GENERAL 2010OBLIGATION TAX ROLL PERCENTAGE
NAME OF BONDED DEBT TAXABLE APPLICABLE TO CITY OF BRENHAM'SGOVERNMENTAL UNIT OUTSTANDING VALUE CITY OF BRENHAM (1) SHARE OF DEBT
City of Brenham $ 31,906,199 $ 975,919,507 100.0% $ 31,906,199
Total direct debt 31,906,199 975,919,507 31,906,199
Brenham I. S. D. 27,544,959 1,869,625,499 52.2% 14,378,100
Washington County 4,755,000 2,262,626,587 43.1% 2,050,934
Blinn Junior College - 2,263,553,948 - -
Total overlapping debt 32,299,959 6,395,806,034 16,429,034
Total direct and overlapping debt $ 64,206,158 $ 7,371,725,541 $ 48,335,233
Ratio of direct and consolidated overlapping funded debt to taxable assessed valuation 0.66%
Per capita consolidated overlapping tax supported debt (based on population of 15,872) $3,045
Note: Overlapping governments are those that coincide, at least in part, with the geographic boundaries of the City.This schedule estimates the portion of the outstanding debt of those overlapping governments that is borne by the residents and businesses of the City of Brenham. This process recognizes that, when considering the government'sability to issue and repay long-term debt, the entire debt burden borne by the residents and businesses should betaken into account. However, this does not imply that every taxpayer is a resident, and therefore responsible for repaying the debt, of each overlapping government.
(1) The percentage of overlapping debt applicable is estimated using taxable assessed property values. Applicable percentages were estimated by determining the portion of the City's taxable assessed value that is within the government's boundaries and dividing it by the City's total taxable assessed value.
130

LEGAL DEBT MARGIN INFORMATION CITY OF BRENHAMLast Ten Fiscal Years
TABLE 15
2011 2010 2009 2008 2007 2006 2005 2004 2003 2002
Taxable assessed valuations $ 975,919,507 $ 982,776,938 $ 945,811,445 $ 879,817,843 $ 797,156,826 $ 742,477,961 $ 705,780,613 $ 686,861,013 $ 643,396,615 $ 606,171,712
Tax limit per $100 valuation 1.65000 1.65000 1.65000 1.65000 1.65000 1.65000 1.65000 1.65000 1.65000 1.65000
O&M tax rate per $100 valuation 0.34200 0.34200 0.34200 0.32450 0.31650 0.31650 0.30510 0.30000 0.28750 0.27500
Debt limit per $100 valuation 1.30800 1.30800 1.30800 1.32550 1.33350 1.33350 1.34490 1.35000 1.36250 1.37500
Debt limit 12,765,027 12,854,722 12,371,214 11,661,986 10,630,086 9,900,944 9,492,043 9,272,624 8,766,279 8,334,861
Total net debt applicable to limit 2,611,307 2,107,581 2,219,350 2,046,971 1,980,831 1,754,883 1,655,433 1,574,263 1,485,812 1,385,364
Legal debt margin $ 10,153,720 $ 10,747,141 $ 10,151,864 $ 9,615,015 $ 8,649,255 $ 8,146,061 $ 7,836,610 $ 7,698,361 $ 7,280,467 $ 6,949,497
Total net debt applicable to the limit as a percentage of debt limit 20.46% 16.40% 17.94% 17.55% 18.63% 17.72% 17.44% 16.98% 16.95% 16.62%
Fiscal Year
131

PLEDGED REVENUE COVERAGE Last Ten Fiscal Years
Utility Less: Net Debt Utility Less: Net DebtFiscal Charges for Operating Available Service Fiscal Charges for Operating Available ServiceYear Services Expenses Revenue Principal Interest (3) Coverage Year Services Expenses Revenue Principal Interest (3) Coverage
2002 $ 2,472,349 $ 2,045,722 $ 426,627 $ 402,146 $ 235,015 $ 0.67 2002 $ 1,594,352 $ 1,861,284 $ (266,932) $ 144,666 $ 338,370 $ (0.55)2003 2,563,788 2,022,318 541,470 311,230 393,136 0.77 2003 2,032,243 1,964,495 67,748 88,830 561,089 0.102004 2,690,050 2,161,268 528,782 328,586 377,209 0.75 2004 1,953,796 2,005,729 (51,933) 164,256 653,379 (0.06)2005 2,944,778 2,376,870 567,908 341,325 346,490 0.83 2005 2,377,615 2,315,795 61,820 203,644 648,215 0.072006 3,718,352 2,797,111 921,241 397,213 328,534 1.27 2006 2,934,264 2,895,413 38,851 303,332 640,901 0.042007 3,254,601 2,784,247 470,354 522,026 303,652 0.57 2007 3,798,195 2,888,251 909,944 571,241 617,220 0.772008 3,719,245 3,088,309 630,936 537,025 281,166 0.77 2008 4,119,856 3,191,900 927,956 582,064 592,494 0.792009 4,606,941 2,835,706 1,771,235 569,498 426,689 1.78 2009 4,045,839 2,639,477 1,406,362 633,196 544,878 1.192010 3,898,316 2,509,163 1,389,153 629,780 492,080 1.24 2010 3,552,059 2,406,199 1,145,860 667,545 497,324 0.982011 5,122,167 2,969,660 2,152,507 690,635 430,063 1.92 2011 3,717,881 2,396,120 1,321,761 790,302 375,458 1.13
Utility Less: Net DebtFiscal Charges for Operating Available ServiceYear Services Expenses Revenue Principal Interest (3) Coverage
2002 $ 4,066,701 $ 3,907,006 $ 159,695 $ 546,812 $ 573,385 $ 0.142003 4,596,031 3,986,813 609,218 400,060 954,225 0.452004 4,643,846 4,166,997 476,849 492,842 1,030,588 0.312005 5,322,393 4,692,665 629,728 544,969 994,705 0.412006 6,652,616 5,692,524 960,092 700,545 969,435 0.572007 7,052,796 5,672,498 1,380,298 1,093,267 920,872 0.692008 7,839,101 6,280,209 1,558,892 1,119,089 873,660 0.782009 8,652,780 5,475,183 3,177,597 1,202,694 971,567 1.462010 7,450,375 4,915,362 2,535,013 1,297,325 989,404 1.112011 8,840,048 5,365,780 3,474,268 1,480,937 805,522 1.52
(1) Water fund-supported debt includes 2001 general obligation refunding bonds, 2001 and 2008 certificates of obligation, and 2007, 2009, 2010, 2011 general obligation refunding bonds.
(2) Wastewater fund-supported debt includes 2001 and 2002 certificates of obligation, and 2007, 2009, 2010, 2011 general obligation refunding bonds.
(3) Interest is represented on a cash basis.
Total Water and Wastewater Funds
Debt Service
Debt Service
Debt Service
CITY OF BRENHAM
TABLE 16
Water Fund (1) Wastewater Fund - Self-Supporting Debt (2)
132

DEMOGRAPHIC AND ECONOMIC STATISTICSLast Ten Fiscal Years
TABLE 17
PerTotal Capita
Fiscal Personal Personal UnemploymentYear Population (1) Income (000's) (2) Income (3) Rate (4)
2002 13,988 400,574 28,637 4.42003 14,171 404,299 28,530 5.12004 14,407 436,921 30,327 5.22005 14,484 473,004 32,657 4.62006 14,614 495,239 33,888 4.42007 14,873 531,516 35,737 3.82008 15,049 555,248 36,896 3.82009 15,270 591,797 38,756 5.32010 15,716 639,780 40,709 5.92011 15,872 678,696 42,761 6.0
(1) 2001 to 2009 population are projections provided by the Population Division of the U.S. Census Bureau. Data for 2010 is from the results of the 2010 census. Data for 2011 is estimated based on prior percent increase.
(2) Total personal income derived by taking Brenham population multiplied by per capita personal income for Washington County (see note 3).
(3) Data for years 2001 to 2008, is for Washington County and comes from the Bureau of Economic Analysis. 2009, 2010, and 2011 are estimates based on a five year compound average annual growth rate.
(4) Unemployment rates are taken from U.S. Bureau of Labor Statistics. Under the new U.S. Bureau of Labor Statistics mandated methodology for producing labor statistics, a city must have a population of at least 25,000 for city-level estimates to be produced; therefore, the unemployment rates shown for 2005 to 2011 are for Washington County.
CITY OF BRENHAM
133
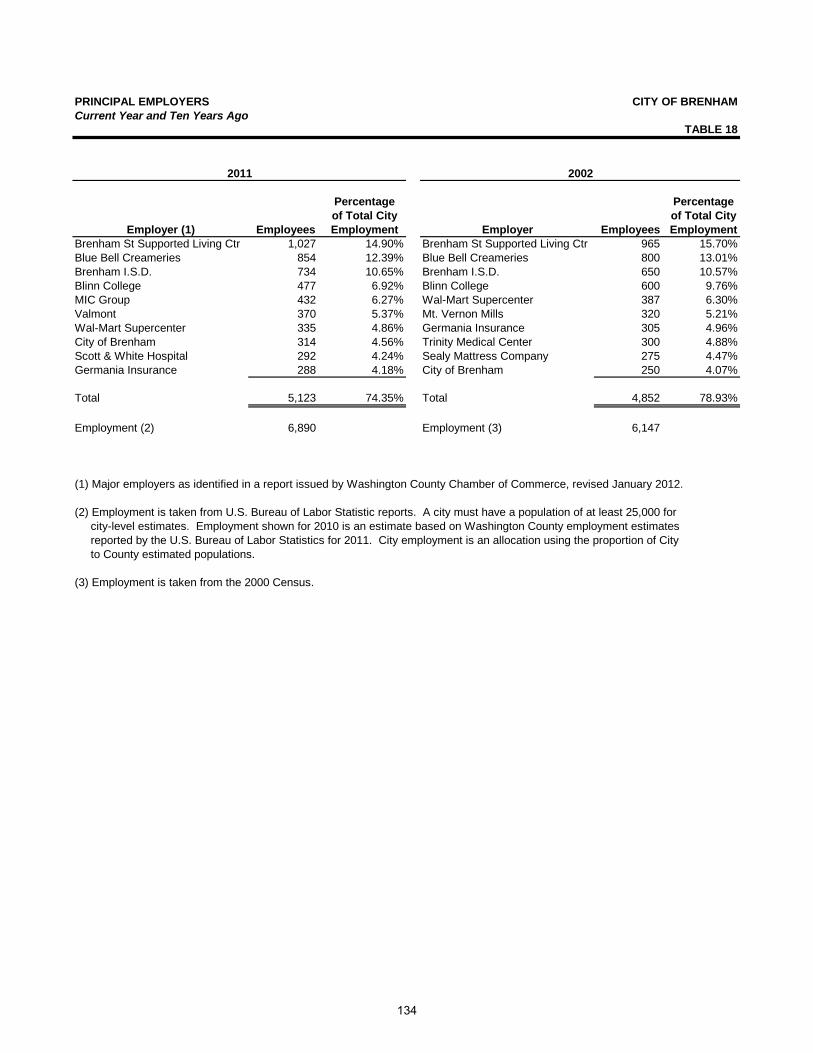
PRINCIPAL EMPLOYERSCurrent Year and Ten Years Ago
TABLE 18
Percentage Percentageof Total City of Total City
Employer (1) Employees Employment Employer Employees EmploymentBrenham St Supported Living Ctr 1,027 14.90% Brenham St Supported Living Ctr 965 15.70%Blue Bell Creameries 854 12.39% Blue Bell Creameries 800 13.01%Brenham I.S.D. 734 10.65% Brenham I.S.D. 650 10.57%Blinn College 477 6.92% Blinn College 600 9.76%MIC Group 432 6.27% Wal-Mart Supercenter 387 6.30%Valmont 370 5.37% Mt. Vernon Mills 320 5.21%Wal-Mart Supercenter 335 4.86% Germania Insurance 305 4.96%City of Brenham 314 4.56% Trinity Medical Center 300 4.88%Scott & White Hospital 292 4.24% Sealy Mattress Company 275 4.47%Germania Insurance 288 4.18% City of Brenham 250 4.07%
Total 5,123 74.35% Total 4,852 78.93%
Employment (2) 6,890 Employment (3) 6,147
(1) Major employers as identified in a report issued by Washington County Chamber of Commerce, revised January 2012.
(2) Employment is taken from U.S. Bureau of Labor Statistic reports. A city must have a population of at least 25,000 for city-level estimates. Employment shown for 2010 is an estimate based on Washington County employment estimates reported by the U.S. Bureau of Labor Statistics for 2011. City employment is an allocation using the proportion of City to County estimated populations.
(3) Employment is taken from the 2000 Census.
CITY OF BRENHAM
2011 2002
134

FULL-TIME EQUIVALENT EMPLOYEESLast Nine Fiscal Years (1)
TABLE 19
2011 2010 2009 2008 2007 2006 2005 2004 2003Function/program Streets/Drainage 16.90 16.90 16.90 17.50 17.50 17.88 18.28 18.31 18.28 Parks/Recreation 25.80 25.80 27.38 20.10 20.10 20.08 20.23 20.23 20.48 Aquatic Center 15.04 15.04 15.04 20.19 20.19 22.50 23.12 22.25 24.37 Library 8.14 8.14 8.03 8.92 8.92 7.88 6.84 7.36 7.84 Central Communication 17.16 17.16 13.13 14.17 13.17 13.19 14.22 14.70 12.72 Police 38.00 37.00 34.00 34.00 33.00 32.00 32.75 32.00 32.00 Fire 15.00 15.00 12.13 12.00 11.00 11.00 10.50 10.50 10.50 Animal Control 4.00 3.00 4.00 4.40 3.40 3.00 3.00 3.00 3.00 Municipal Court 4.60 4.60 4.75 4.60 4.60 4.60 3.60 3.60 3.60 Public Works 6.00 6.00 6.00 6.14 6.14 6.14 5.89 5.64 5.64 Administration 6.28 8.08 8.08 7.00 10.00 8.00 8.25 6.50 6.50 Main St/Community Development 3.00 2.00 2.00 2.00 - - - - - Utility Billing/Customer Service 10.00 10.00 10.00 10.00 10.00 10.00 10.73 9.73 10.73 Finance 9.39 10.39 10.45 10.00 10.00 11.00 10.00 12.00 12.00 HR/Risk Management 2.80 - - - - - - - - Purchasing/Warehouse - - - - - - - - - Public Information - 2.00 2.00 2.00 2.00 2.00 2.00 4.00 3.00 Public Utilities 7.00 7.00 7.00 6.00 6.00 6.00 8.00 9.33 9.00 Central Warehouse/Maintenance 8.00 8.00 8.00 8.38 9.38 9.38 9.40 8.37 6.40 Information Technology 5.00 5.00 5.00 4.50 3.50 4.50 4.50 3.00 3.00 Electric 13.00 12.00 12.00 11.00 11.00 11.00 11.00 12.00 12.00 Gas 5.00 5.00 5.00 5.00 5.33 5.33 5.33 5.33 5.33 Water Treatment 6.50 6.50 5.50 7.00 6.00 6.00 6.00 7.00 7.00 Water Construction 5.00 5.50 5.50 5.50 5.34 5.34 5.34 5.34 5.34 Wastewater Treatment 4.50 4.50 5.50 7.00 7.00 7.00 7.00 8.00 8.00 Wastewater Construction 5.00 5.50 5.50 5.50 5.33 5.33 5.33 5.33 5.33 Transfer Station 2.75 2.75 3.08 3.08 3.08 3.08 5.14 3.99 4.56 Collection Station 2.83 2.83 1.39 1.08 1.08 1.08 - - - Recycling Center 2.25 2.25 2.25 2.25 2.25 2.25 2.33 3.33 3.25 Collection 2.75 2.75 3.59 4.03 5.03 4.59 5.84 7.17 8.50 Special Revenues/Grants - - - - - - 2.25 3.00 4.00
Total 251.69 250.69 243.20 243.34 240.34 240.15 246.87 251.01 252.37
(1) The City implemented GASB 34, the new reporting standard, in fiscal year 2003. Therefore, ten years of data will be accumulated over time.
CITY OF BRENHAM
FISCAL YEAR
135

OPERATING INDICATORS BY FUNCTION/PROGRAMLast Nine Fiscal Years (1)
TABLE 20
2011 2010 2009 2008 2007 2006 2005 2004 2003 Recreation/Parks Number of athletic tournaments (2) 41 36 33 31 32 38 35 31 NA
Aquatic Center Number of Visitors 68,997 67,000 67,526 73,506 66,793 70,363 67,914 58,627 49,089 Number of Annual Passes 87 97 145 143 137 140 140 159 239 Number of Monthly Passes 1,156 962 930 927 907 878 913 814 615 Number of Summer Passes 84 - - - - - - - -
Streets Road maintenance in linear feet 16,430 33,958 11,186 9,376 11,738 16,393 12,967 7,750 7,955
Library Circulation 73,288 75,174 73,700 70,174 44,933 49,004 47,545 49,754 51,204
Central Communications Number of Incoming Calls 759,065 712,766 749,499 682,254 561,436 519,038 503,992 481,609 436,210 Number of 9-1-1 Calls 34,924 30,388 30,594 30,001 30,702 27,253 20,496 17,928 16,075
Police Traffic Citations 5,240 6,230 8,036 6,445 3,593 2,988 3,186 4,513 2,506 Traffic Warning Tickets Issued 9,740 7,493 4,274 3,426 3,536 4,188 5,297 8,516 4,237 Mileage on Police units 401,630 422,313 382,597 296,882 296,422 299,527 295,802 300,602 312,246
Fire (3) Fire Responses 133 70 73 81 118 80 86 71 68 Rescues 18 17 33 28 52 34 32 32 30
Animal Control/Shelter/Adoption Number of Incoming Animals 1,611 1,760 1,455 1,723 1,846 1,464 1,784 1,876 1,812 Animals Adopted 336 343 300 385 401 343 342 304 301 Municipal Court Traffic dispositions 4,270 5,703 5,582 4,444 5,614 5,132 4,232 4,429 3,388 Other dispositions 2,458 1,527 1,603 1,647 1,413 1,505 1,953 1,790 1,850
Public Works Building Inspection Visits 1,835 1,956 1,818 1,936 1,742 1,692 1,779 1,552 1,536
Electric kWh delivered 289,472,286 271,319,462 271,248,570 290,272,935 302,190,150 314,772,687 308,467,816 293,512,414 302,866,896 Customers served 8,120 8,235 8,150 8,060 7,947 7,728 7,585 7,556 7,564
Gas mcf delivered 394,563 443,345 420,851 522,411 602,719 563,508 543,062 557,790 644,920 Customers served 4,244 4,212 4,151 4,106 4,050 3,982 3,965 3,944 3,956
Water Gallons delivered 996,362,800 752,748,100 926,510,200 883,015,900 799,546,600 956,383,100 811,893,100 736,565,100 782,517,000 Customers served 7,164 7,077 6,946 6,816 6,654 6,372 6,211 6,134 6,124
Wastewater Effluent plant gallons processed 657,568,000 727,301,000 762,338,000 772,589,000 810,562,100 751,247,000 759,309,000 696,397,880 727,604,500 Commercial/industrial gallons processed 351,747,400 327,125,800 385,150,300 393,674,700 394,462,700 406,897,100 359,657,100 352,189,200 381,528,924 Customers served 6,434 6,373 6,284 6,198 6,073 5,839 5,766 5,722 5,719
Sanitation Customers served 5,728 5,610 5,468 5,299 5,168 5,065 4,979 4,949 5,158
(1) The City implemented GASB 34, the new reporting standard, in fiscal year 2003. Therefore, ten years of data will be accumulated over time.
(2) Tournament data for 2003 is not available.
(3) Operating indicators for the Fire Department are based on calendar year. Figures for 2008 are year-to-date December 12, 2008.
CITY OF BRENHAM
FISCAL YEAR
136

CAPITAL ASSET STATISTICS BY FUNCTION/PROGRAMLast Nine Fiscal Years (1)
TABLE 21
2011 2010 2009 2008 2007 2006 2005 2004 2003Function/program
Recreation/Parks Park acreage 191 150 150 150 150 150 150 150 150 Parks 7 7 7 7 7 7 7 7 7 Ampitheater 1 - - - - - - - - Aquatic centers 1 1 1 1 1 1 1 1 1 Baseball fields 8 8 8 8 8 8 8 8 8 Softball fields 9 9 9 9 9 9 9 9 9 Tennis courts 6 6 6 6 6 6 6 6 6 Soccer fields 12 12 12 12 12 12 12 12 12 Skateboard parks 1 1 1 1 1 1 1 1 1
Library Libraries 1 1 1 1 1 1 1 1 1
Airports 1 1 1 1 1 1 1 1 1
Police Stations 1 1 1 1 1 1 1 1 1 Police vehicles 43 43 43 40 38 33 34 33 33
Fire Fire stations 1 1 1 1 1 1 1 1 1 Fire trucks 5 5 5 5 5 5 5 5 5
Animal control/shelter/adoption Shelters 1 1 1 1 1 1 1 1 1
Electric Miles of service lines 118 118 118 118 116 115 113 112 110
Gas Miles of service lines 118 116 115 115 111 111 110 109 107
Water Miles of water mains 153 149 148 145 143 138 137 136 136
Wastewater Miles of sanitary mains 138 137 137 136 135 129 128 127 127
Sanitation Collection stations 1 1 1 1 1 1 1 1 1 Transfer stations 1 1 1 1 1 1 1 1 1 Recycling stations 1 1 1 1 1 1 1 1 1
(1) The City implemented GASB 34, the new reporting standard, in fiscal year 2003. Therefore, ten years of data will be accumulated over time.
CITY OF BRENHAM
Fiscal Year
137

This page intentionally left blank.
138


